the Creative Commons Attribution 4.0 License.
the Creative Commons Attribution 4.0 License.
 | 27 Oct 2021
Research on the smooth velocity control of a driving switching process of a new pneumatic electric hybrid actuator
Xiaoning Li
In order to meet the application requirements of fast-moving, accurate positioning, and low cost, a new type of pneumatic electric hybrid actuator was developed with a positioning accuracy of 0.01 mm. It was found that the velocity fluctuation would occur in the process of driving switching due to the “stop then restart” strategy, resulting in stumbling when positioning. To solve this problem, the basic characteristics of the drive switching mechanism were tested and analyzed. A driving switching strategy called “relay and run” was proposed based on the response characteristics of the locking mechanism in the braking stage and the starting characteristics of the motor. The uniform acceleration was controlled by the motor drive to compensate for the velocity loss so that the overall velocity was slowly reduced. The control model was established, and the experiments were conducted. The results showed that the relay and run switching strategy can eliminate the velocity fluctuation caused by the stop then restart strategy.
- Article
(4113 KB) - Full-text XML
- BibTeX
- EndNote


Pneumatic actuators and electric actuators are more and more widely used in the field of industrial automation (Saravanakumar et al., 2017; Zhang et al., 2014), but they have their limitations. The pneumatic actuator has a large output force and fast movement velocity, but the positioning accuracy is low (Tan et al., 2019; Qi et al., 2020). The electric actuator has a high positioning accuracy and good anti-interference performance, but the output force is small, and the cost is high under the long stroke (Wang et al., 2020; Qi et al., 2018). To meet the requirements of fast-moving and accurate positioning at the same time, hybrid actuators combined with pneumatic and electric drive have been focused on, which were called pneumatic–electric hybrid actuators (PEHAs; Paul et al., 2010; Zong et al., 2019; Rouzbeh et al., 2020).
According to the combination of driving modes, the reported PEHAs could be divided into series drive mode and parallel drive mode (Zhang et al., 2018). The PEHAs with parallel drive mode had greater load capacity and could realize accurate force control, but the control algorithm was complex and the velocity was limited (Zhang et al., 2021). The PEHAs with series drive mode had a simple structure, easy control method, and lower cost, but their load capacity was also lower.
References (Li et al., 2020) related to a new series-driven PEHA, which used the motor self-locking and pneumatic locking mechanism to lock the piston rod to realize the conversion between pneumatic drive mode and motor drive mode (Yang et al., 2021) have been published. (This design has been submitted for an invention patent and has been authorized with the patent number 201811208567.2.) The position control accuracy of the new PEHA reached 0.01 mm, and its cost was only one-third of that of the electric actuator. However, in the research of this actuator, it was found that the velocity fluctuation of the series-driven hybrid actuator would occur in the process of driving mode switching.
To solve this problem, the response characteristics of the pneumatic locking mechanism and the starting characteristics of the motor screw pair in the process of drive switching have been analyzed in this study. A “relay and run” drive switching strategy was established to eliminate the velocity fluctuation. Under this strategy, the velocity of the new PEHA no longer decreased first and then increased in the switching process from pneumatic drive to motor drive.
2.1 Structure of the PEHA
The PEHA (Li et al., 2020) adopted the coaxial series drive mode, and its overall structure is shown in Fig. 1. It was mainly composed of pneumatic driving components, a displacement sensor, and electric driving components, which were installed on the same bottom plate, in turn, with the same axis. Its shape was similar to that of a common cylinder, but it was equipped with pneumatic and electric interfaces, respectively. The pneumatic driving components mainly included a pneumatic locking mechanism and an inner cylinder. The inner cylinder also included front and rear covers, a cylinder barrel, piston, and a piston rod. The bottom of the front and rear covers were processed into guide rail grooves and installed on the double slide rails fixed on the bottom plate. Therefore, the pneumatic driving components could move a small distance along the axial direction under the electric drive. Electric drive components include a servo motor, a ball screw nut pair, a coupling, etc. The measuring rod of the displacement sensor extended into the hollow piston rod through the rear cover of the inner cylinder to measure the magnetic ring installed in the hollow piston.
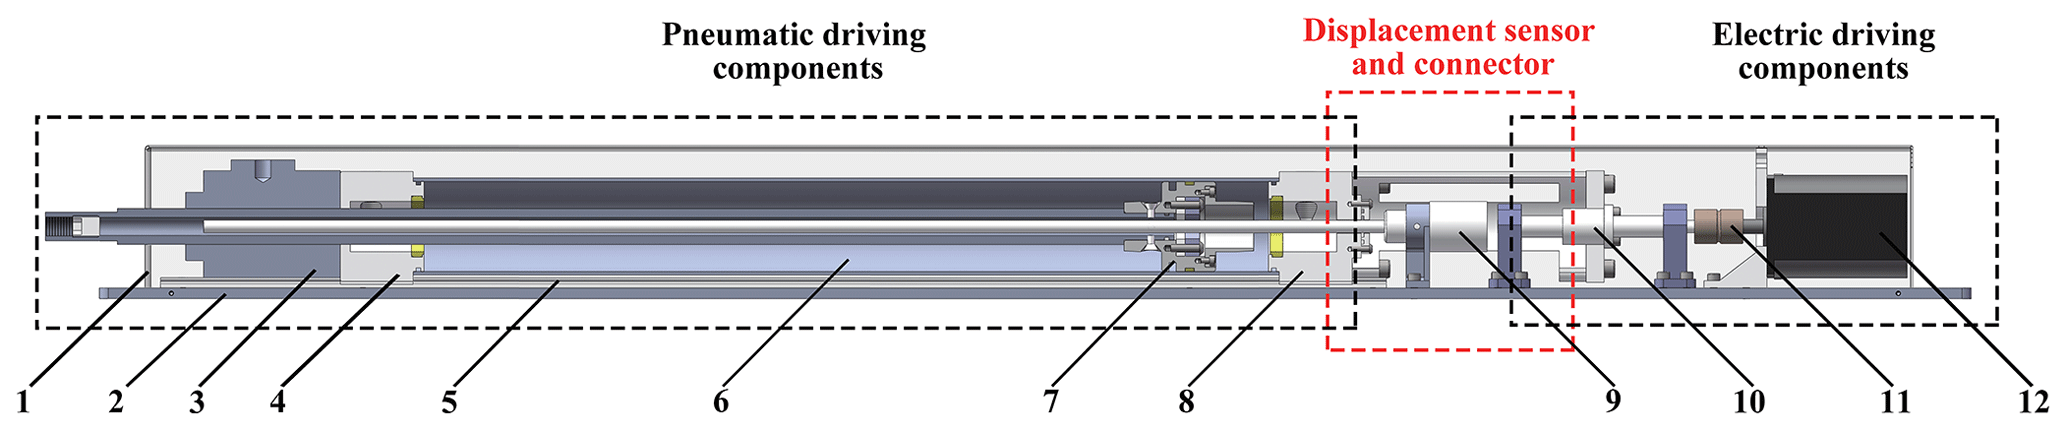
Figure 1Structure of pneumatic electric composite actuator: 1 – shell; 2 – bottom plate; 3 – pneumatic locking mechanism; 4 – front cover of the inner cylinder; 5 – double slide; 6 – cylinder barrel; 7 – hollow piston; 8 – rear cover of the inner cylinder; 9 – displacement sensor; 10 – ball screw; 11 – couple; 12 – motor.
2.2 Working principle of the PEHA
The working principle of the PEHA was as follows: first, the locking mechanism was unlocked so that the piston and piston rod could move relative to the cylinder. The servo motor was powered on and maintained. A large static torque existed when the servo motor was in the state of being powered on and shut down, so the whole electric driving components remained stationary. The inner cylinder also remained stationary due to the connector. The piston moved at high velocity under the pressure difference between the two chambers. At this time, the system was equivalent to a cylinder that could move independently, and the moving components were piston and piston rod. This stage was called the high-velocity pneumatic drive stage.
When the piston reached the preset position, the piston rod was locked by the locking mechanism. Then the system was switched to the motor drive mode. The servo motor drove the ball screw pair. The inner cylinder was pushed to complete the remaining displacement on the double slide rails, and accurate positioning was carried out. At this time, the system was equivalent to a system in which the motor lead screw pushed the load. The moving components were the whole inner cylinder, push connector, and ball nut. This stage was called the precision motor drive stage.
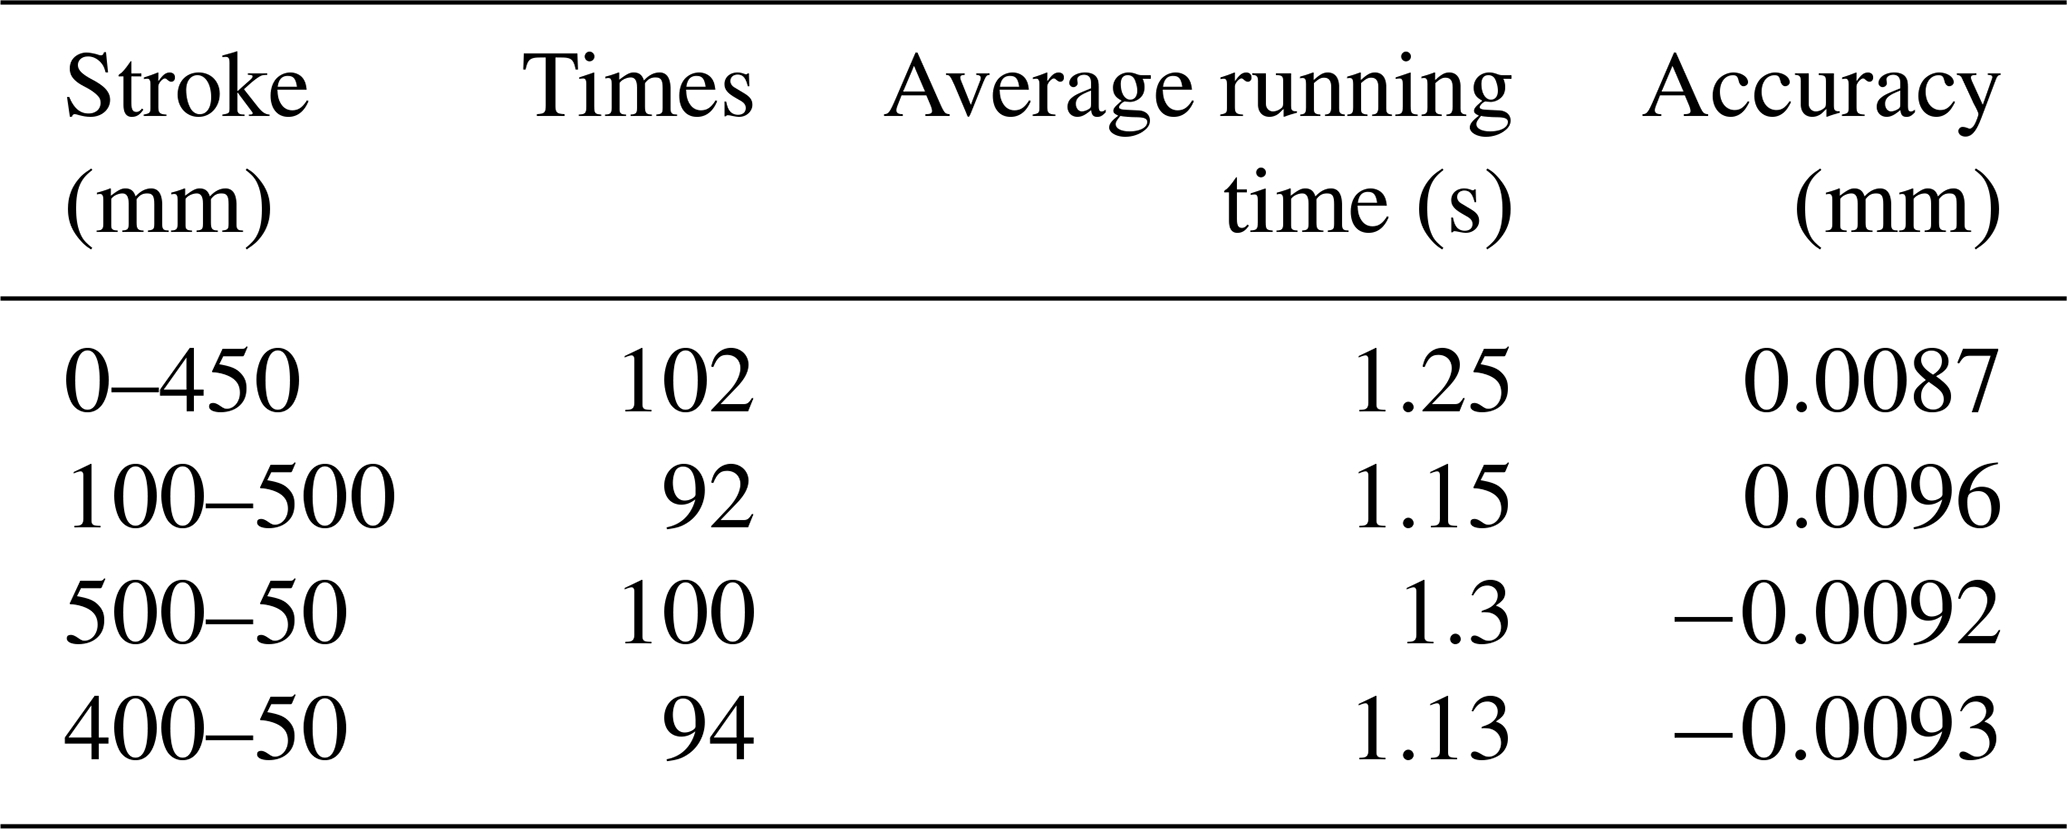
Under the above working principle, the new PEHA can not only move rapidly under the pneumatic drive but also locate accurately under the motor drive, as shown in Table 1.
2.3 Velocity fluctuation
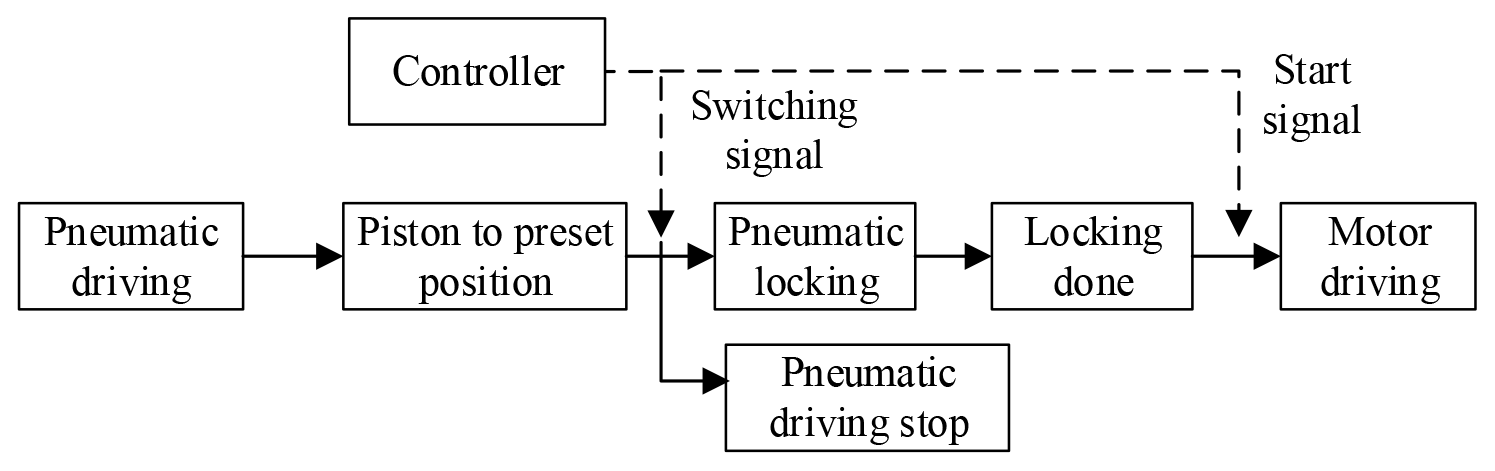
The switching process from pneumatic drive to motor drive was as follows: the drive switching signal was sent when the piston reached the preset position. The air supply in the two chambers of the inner cylinder was stopped. The locking mechanism was pressurized to lock the piston rod. The motor drive started after the locking was completed. The process of this “stop then restart” control strategy was shown in Fig. 2. The velocity of the piston rod decreased gradually to zero until the locking was completed. Then the motor drive started and the velocity increased again. This was the direct cause of velocity fluctuation during switching.
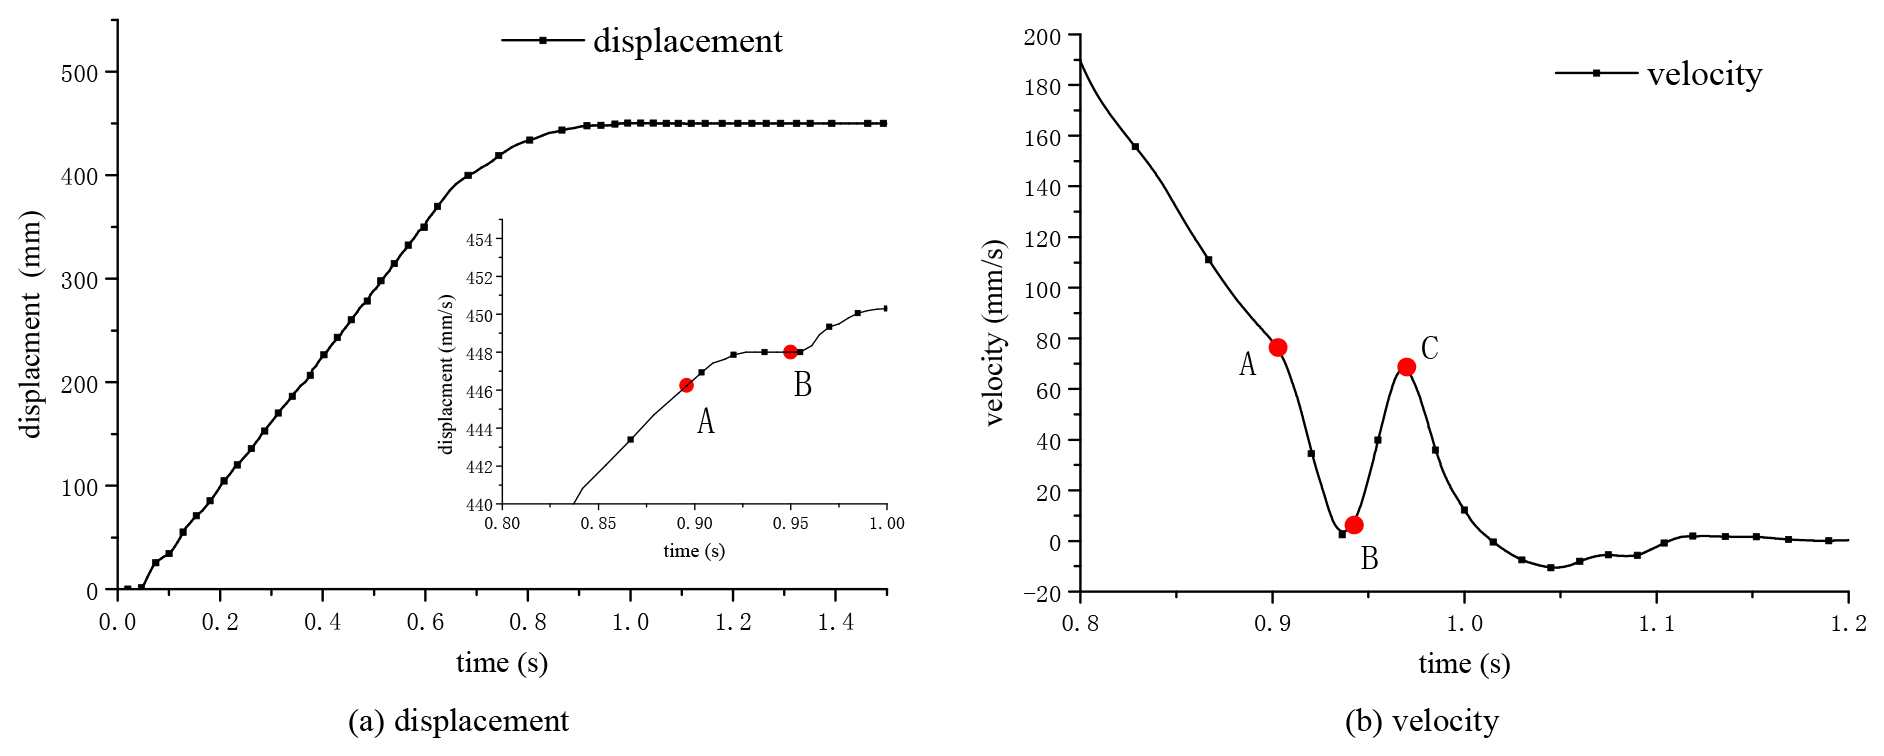
The positioning was carried out under this stop then restart strategy, as shown in Fig. 3, which was a single 0–450 mm stroke positioning. As can be seen in Fig. 3, the piston was rapidly approaching the target position under the pneumatic drive. When it reached the preset position (point A), the locking mechanism started to lock the piston rod. After a certain period, it can be seen from the subgraph that a small horizontal line appeared in the displacement. At this time, the velocity decreased to zero, and the locking was completed (point B). Then the motor drive started, and the velocity was increased again (point C). There was an obvious velocity fluctuation from points A to C. To solve this problem, it was necessary to start with the analysis of the basic units for drive switching of the PEHA.
The basic units for drive switching were the pneumatic locking mechanism and motor ball screw pair.
3.1 Characteristics of the pneumatic locking mechanism
3.1.1 Structure of the pneumatic locking mechanism
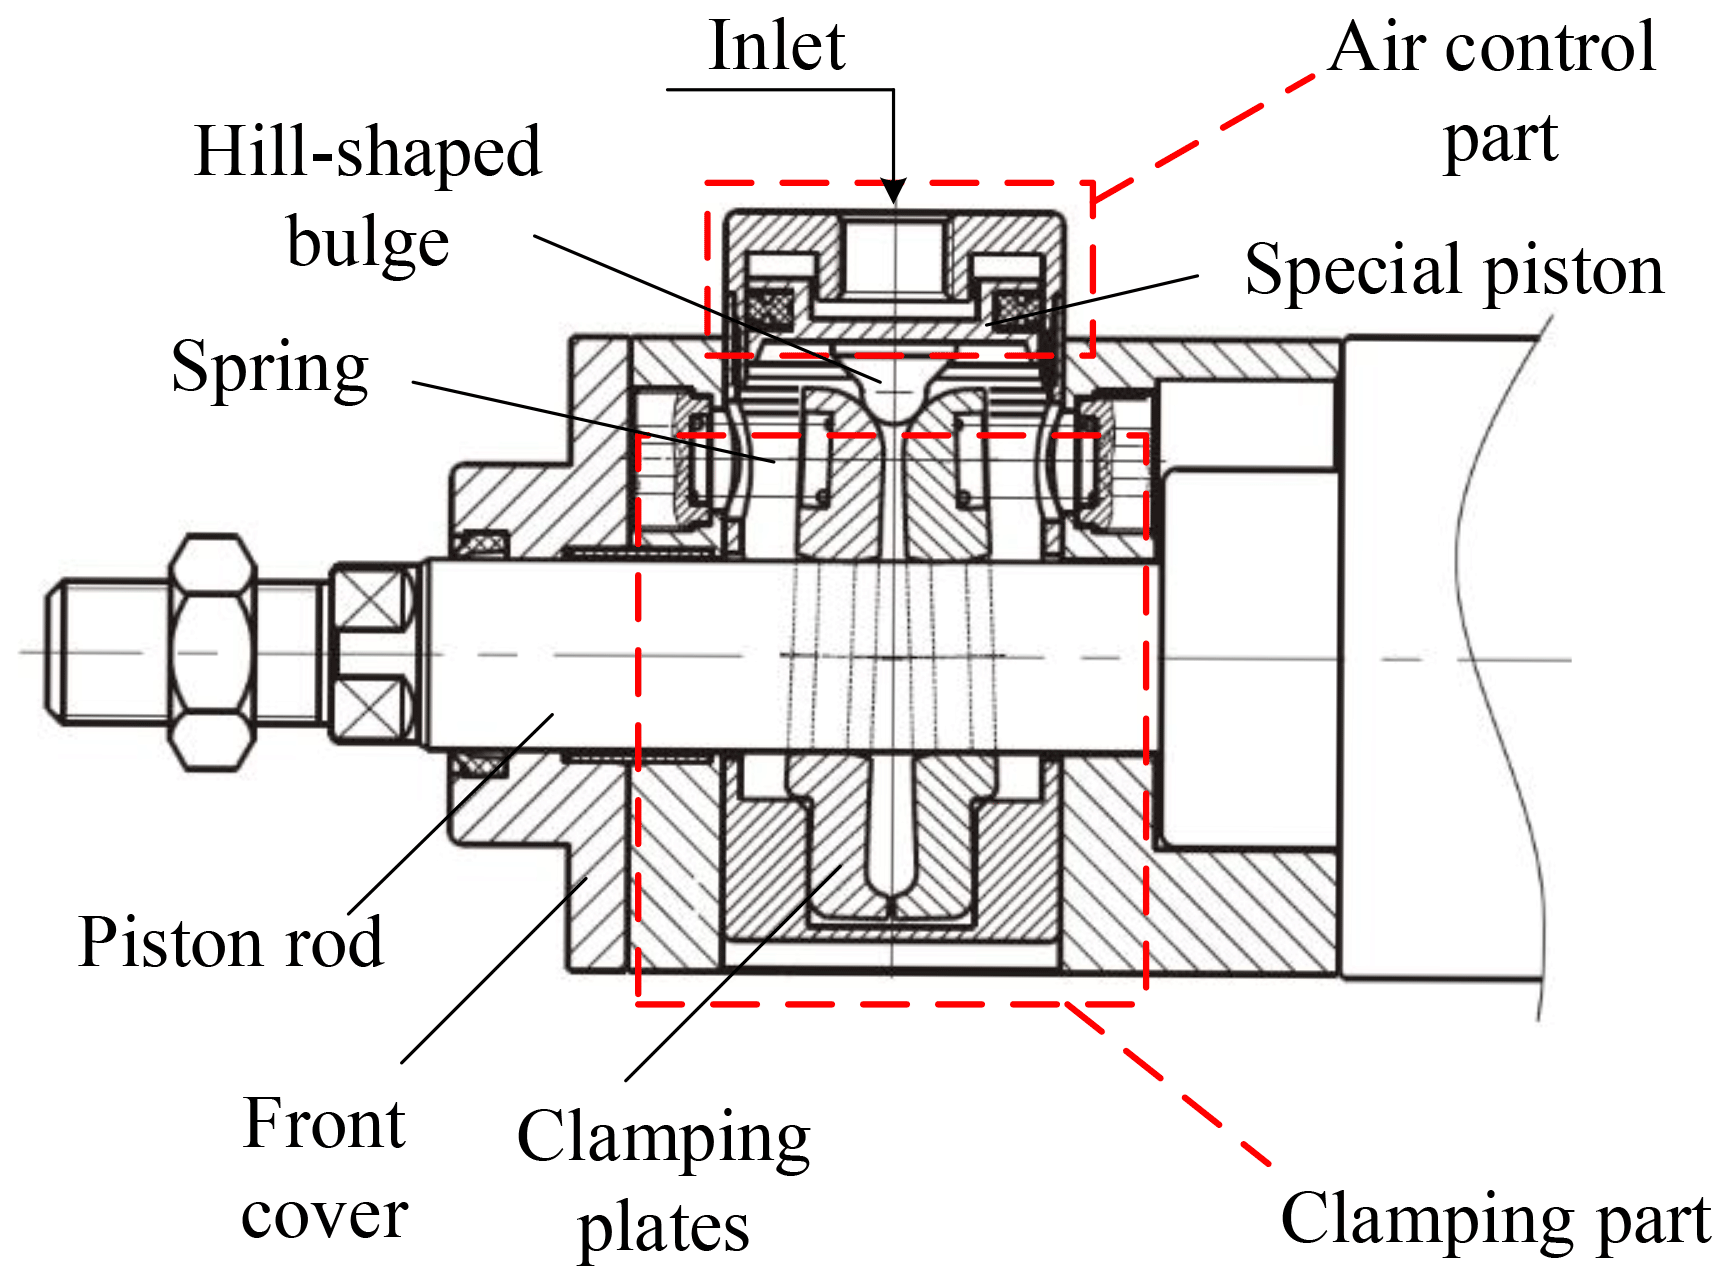
The structure of the pneumatic locking mechanism is shown in Fig. 4. It was installed at the end of the exit rod side of the cylinder, which was mainly composed of the air control part and the clamping part. There was a special piston with a hill-shaped bulge in the air control part. The clamping part consisted of a pair of clamping plates, springs, and a base. The bottom of the plates was inserted into the groove of the base, and the top was connected with the spring. The clamping plates could be swinging slightly. The piston rod of the cylinder passed through two plates and extended through the front cover. Under normal conditions, the plates clamped the piston rod under the action of spring. When the inlet was pressurized, the piston moved downward. The hill-shaped bulge was pushed into the gap to overcome the spring force to open the clamp plates, so the pneumatic locking mechanism was unlocked.
3.1.2 Locking response characteristics
The pneumatic locking mechanism was controlled by a solenoid reversing valve. When the solenoid valve was powered on, the locking mechanism was unlocked after the pressure was greater than 0.15 MPa. When the solenoid valve was powered off, the locking mechanism was locked after the pressure was less than 0.15 MPa.
Figure 5 shows the displacement curve of the piston rod when it was locked by the pneumatic locking mechanism at the velocity of 700 mm s−1. It was obvious that, after the control signal was sent, the piston rod did not stop moving immediately but decelerated and stopped after a certain delay (about 55 ms). This delay consisted of the following three parts: (1) the response delay of the reversing valve, (2) the exhaust delay of the gas, and (3) the brake delay of the clamp plates to clamp the piston rod.
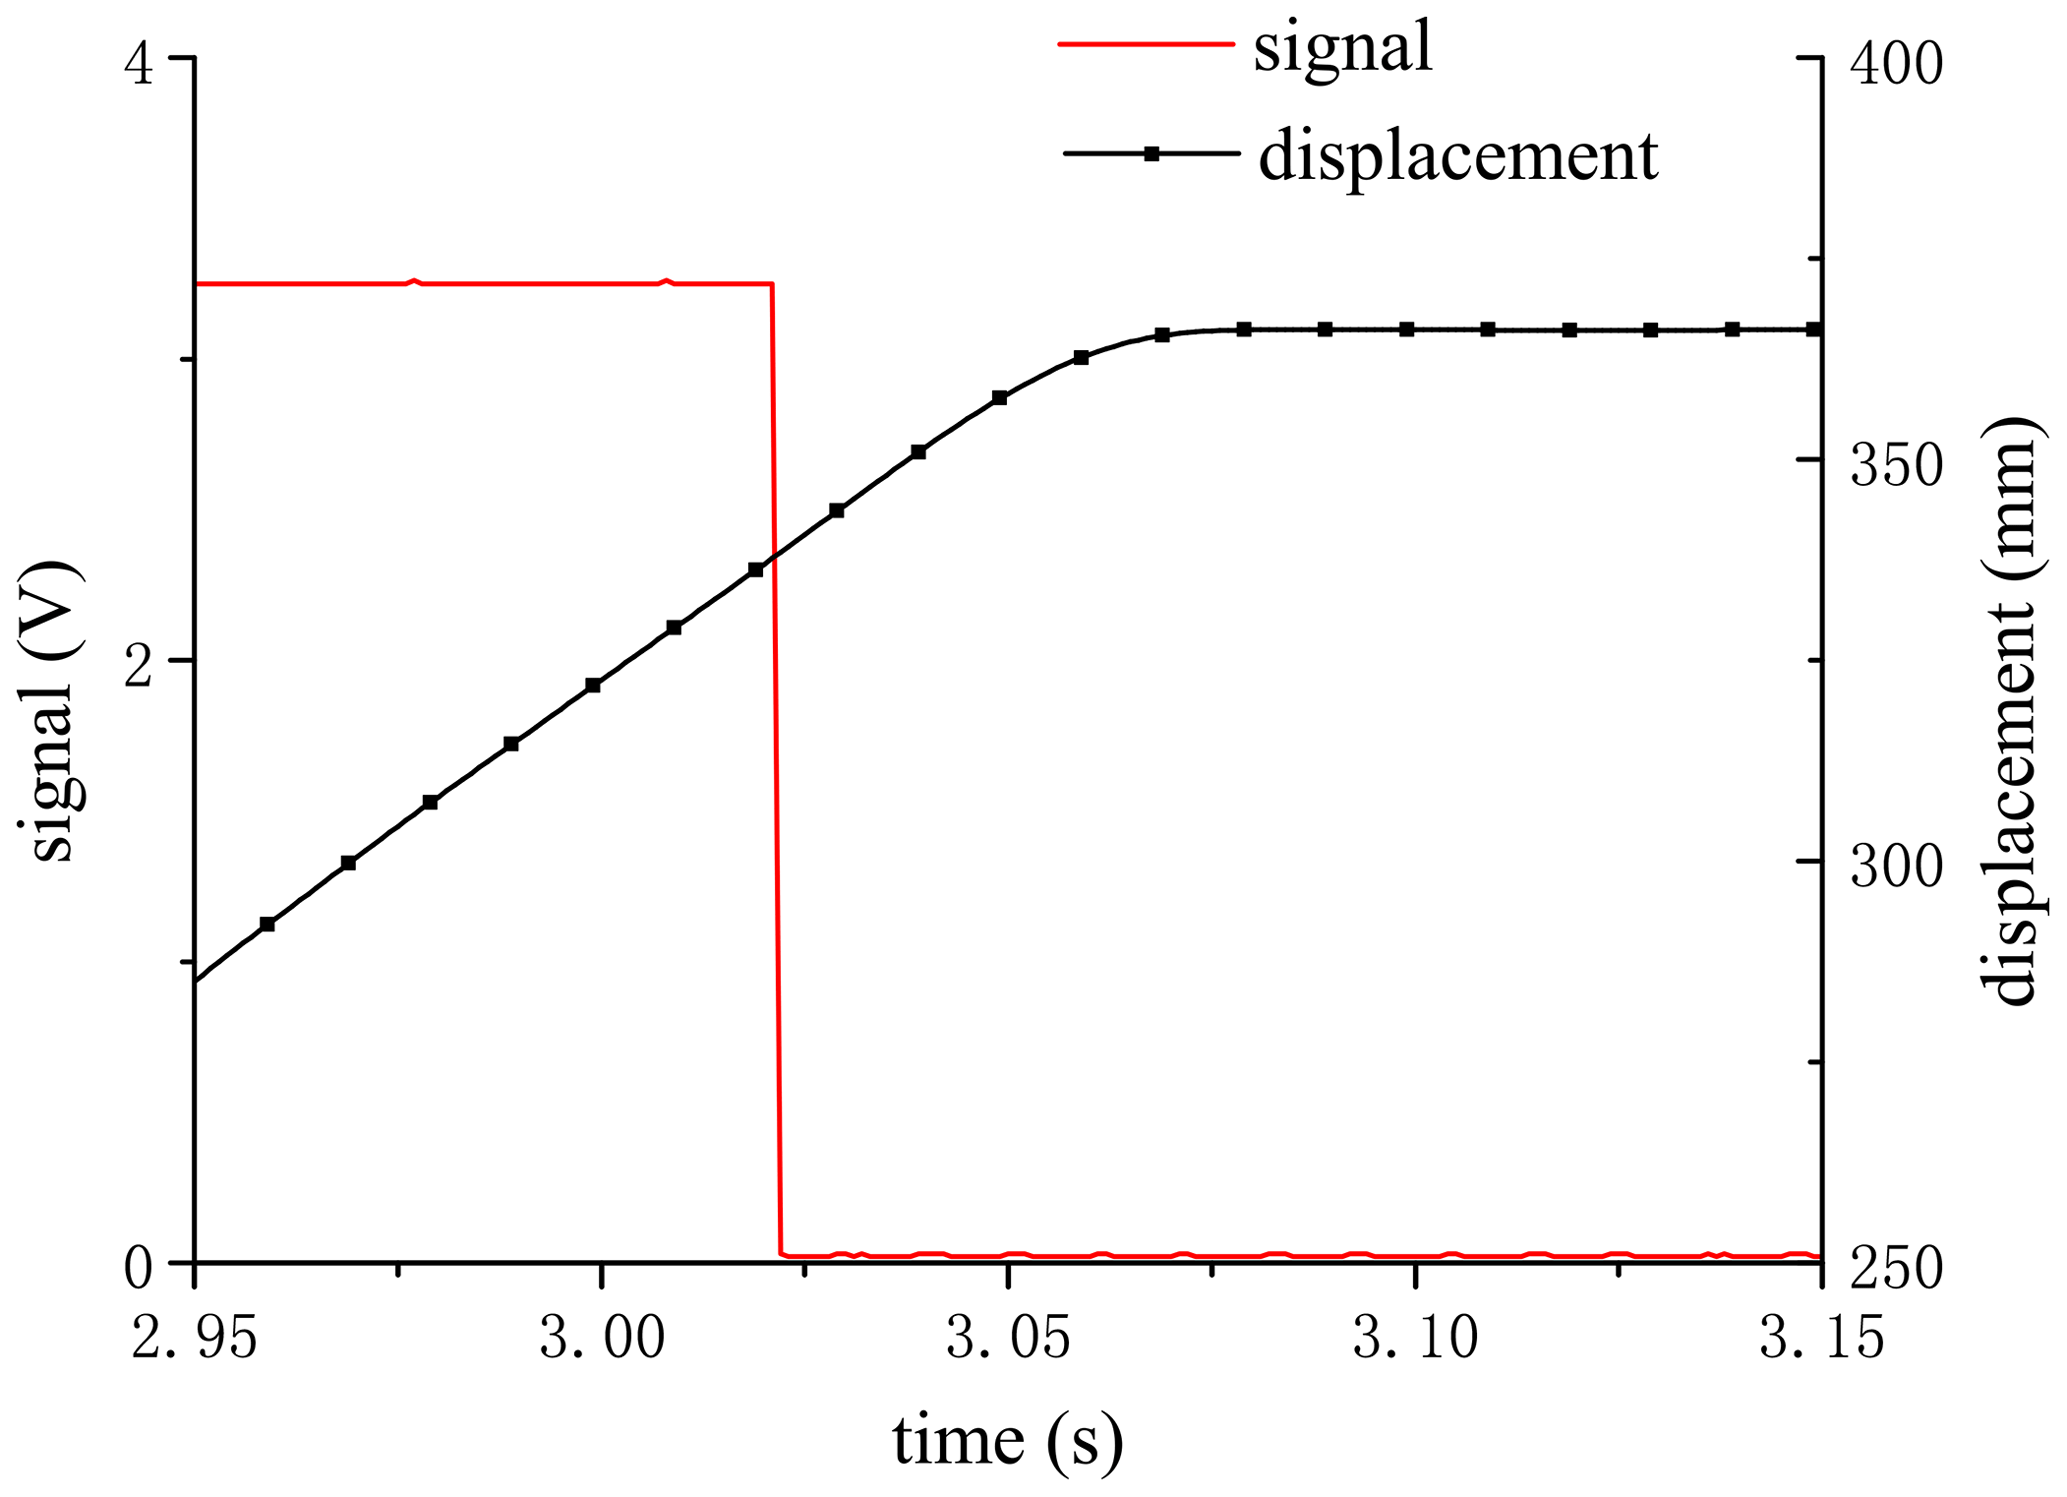
Figure 5Displacement curve of the piston rod braking with the initial velocity of 700 mm s−1.
The response delay of the solenoid valve was caused by the charge of the solenoid and the displacement of the valve core. It could be measured (Yang et al., 2020; Dong et al., 2015). Because the response delay of the solenoid valve and the exhaust delay of the gas would eventually reflect the pressure change at the inlet of the locking mechanism, the two delays could also be measured together. This stage was defined as the locking reaction stage, and the time was called the locking reaction time.
The test circuit was built, as shown in Fig. 6a. The pressure gauge was set at the inlet of the locking mechanism to measure the pressure change. As can be seen from Fig. 6b, the pressure change lagged behind the control signal, and the locking reaction time was 15 ms.

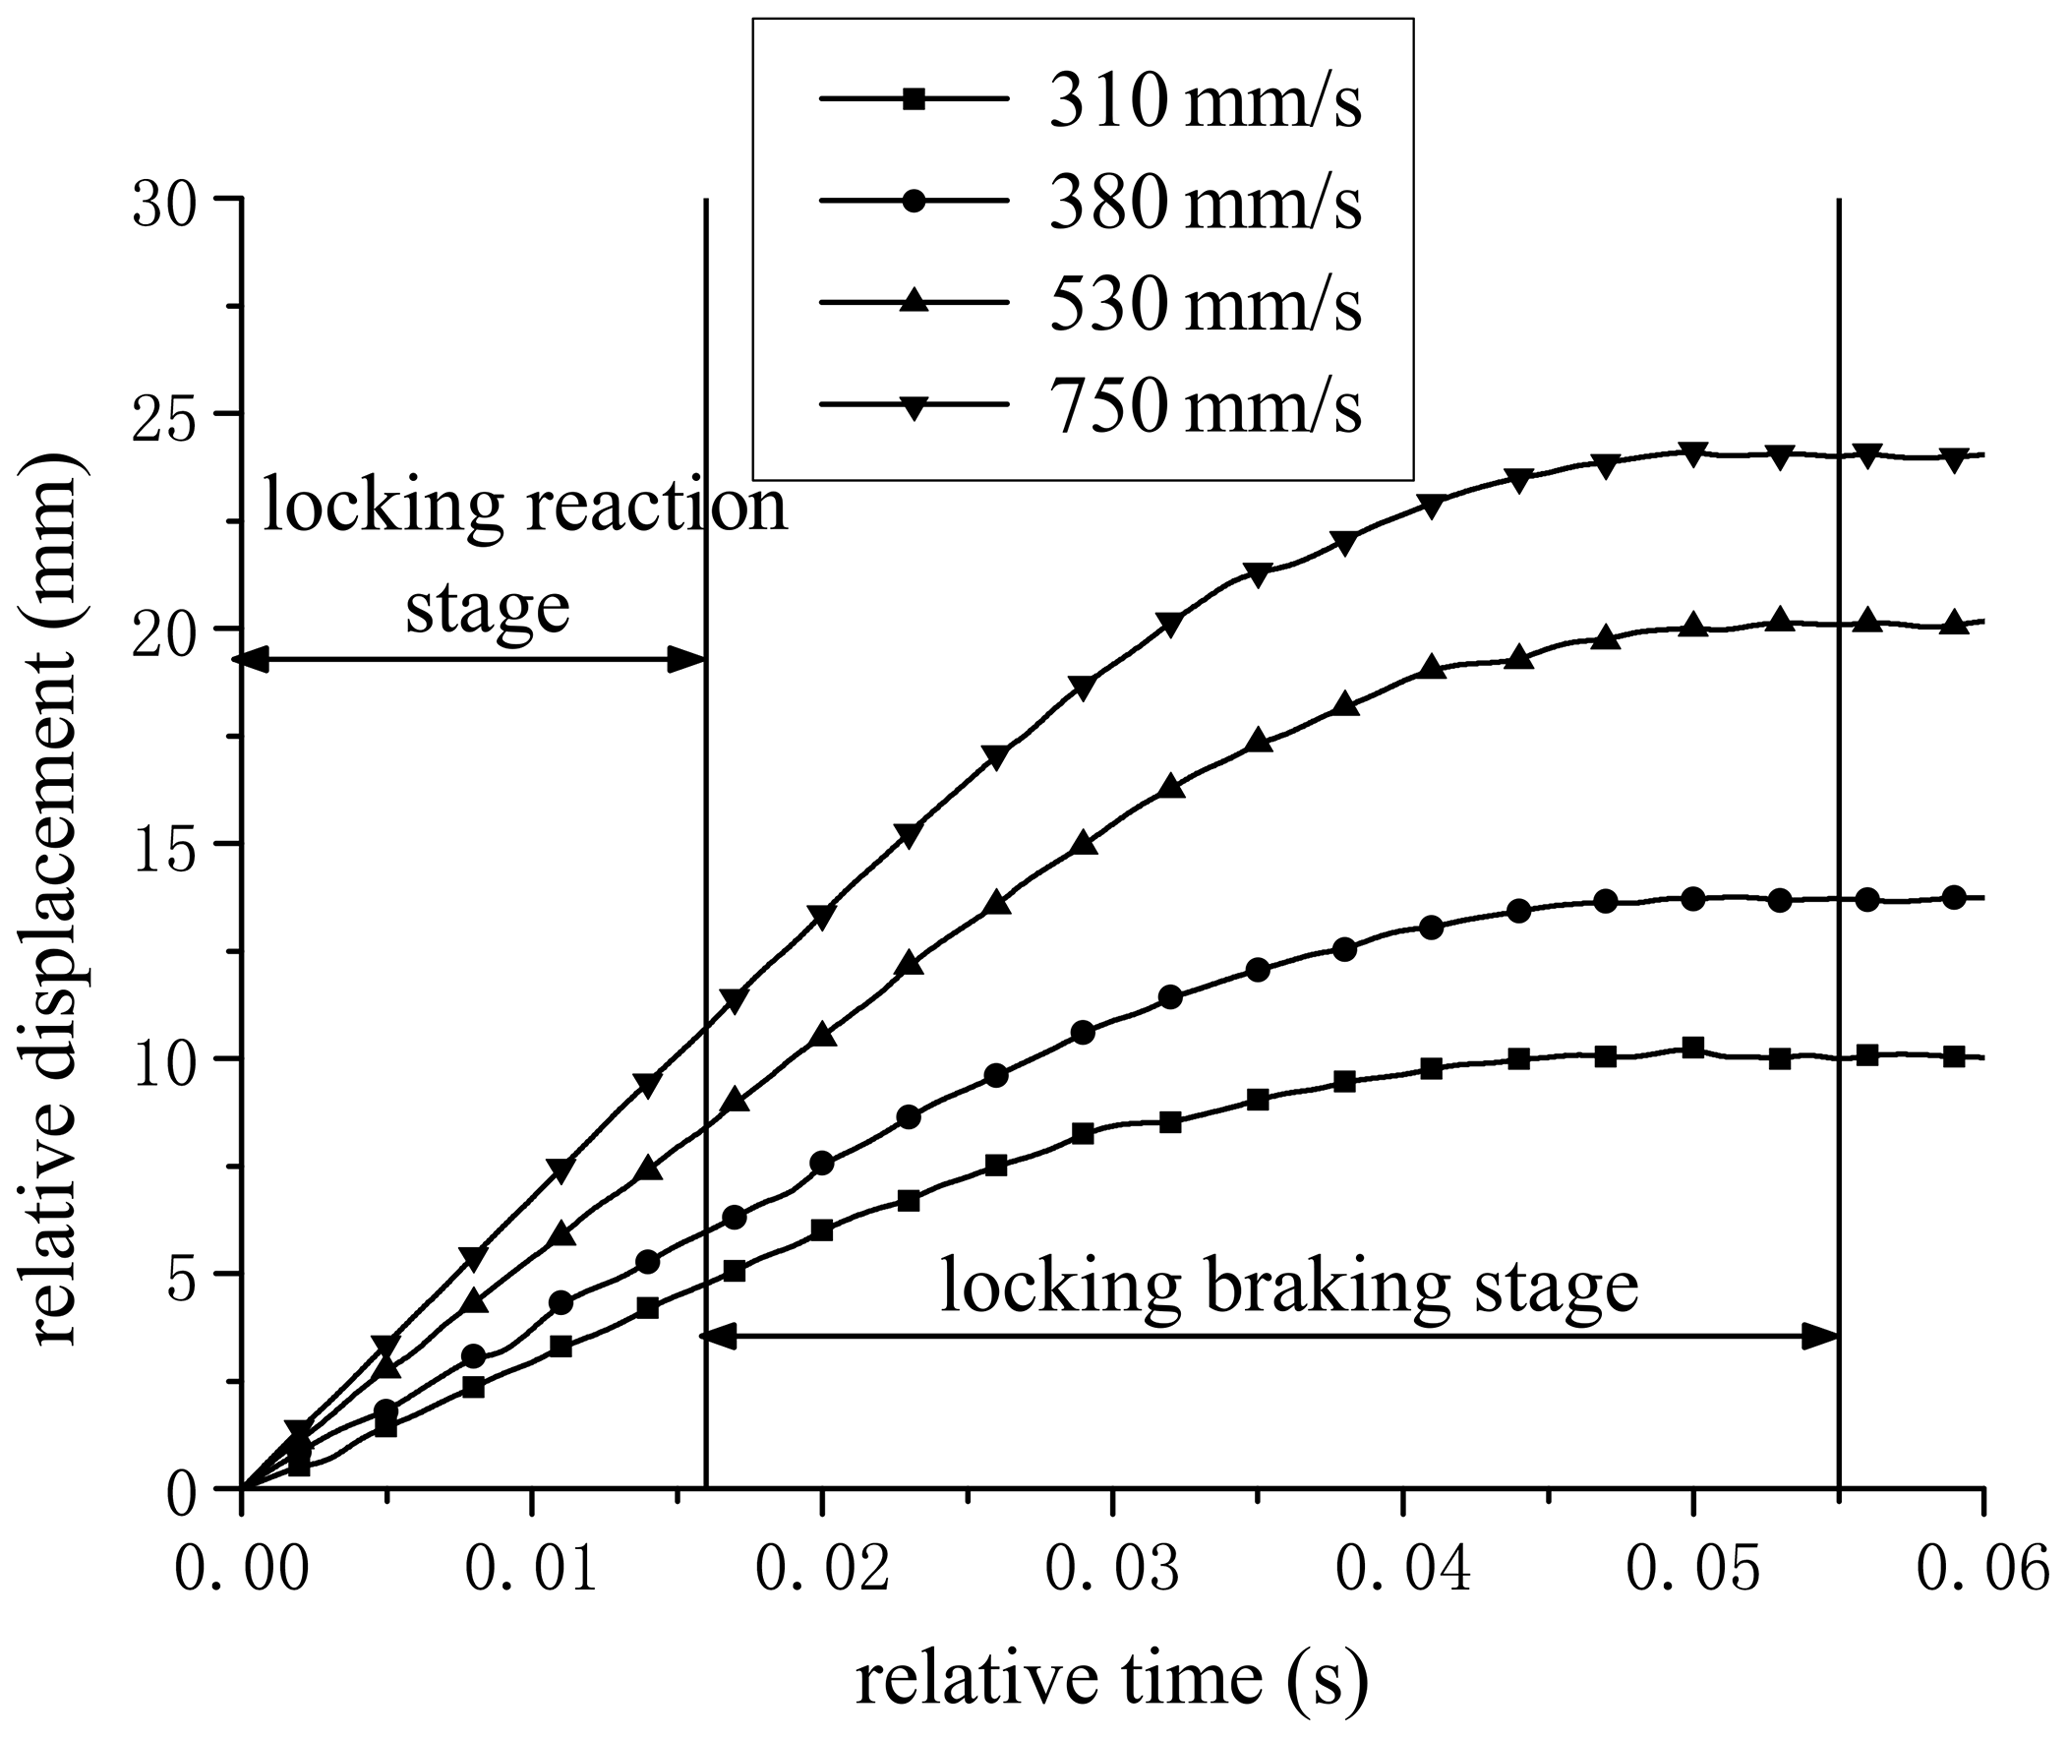
The brake delay was that the piston rod was clamped by the clamping plate until it stopped moving. This stage was defined as the locking braking stage, and the time was called the locking braking time. A braking test at different velocities was carried out. The braking signal time was taken as the relative zero time, and the displacement of this time was taken as the relative zero points, as shown in Fig. 7. It could be seen that, in the locking braking stage, the velocity gradually slowed down until it stopped. At different initial velocities, the braking distance increased with the increase in the initial velocity. The braking distance reaches 24 mm at the initial velocity of 750 mm s−1. The braking time was the same, at about 40 ms. Therefore, the brake delay was 55 ms.
3.2 Mathematical description of the piston rod in the locking process
It was assumed that the system origin was set when the piston was located at the right end cover of the inner cylinder.
3.2.1 Locking reaction stage
During the period from the switching signal to the locking action of the locking mechanism, the air supply to the two chambers of the inner cylinder had stopped. However, the pressure difference still existed, and the piston and piston rod were affected by the air pressure and friction. Due to inertia, the piston would continue to move forward, so the force on the piston and piston rod can be described by Eq. (1).
where M is the total mass of piston and load, x is the displacement of piston, Fp is the pressure force, FL is the external force, Ff is the frictional force, p is pressure, subscripts 1 and 2 represent the rodless chamber and rod chamber, respectively, and A is the sectional area.
The change in the gas state in the two chambers could be regarded as being a reversible adiabatic process, so the change in pressure is expressed by Eq. (2) as follows:
where the subscript a indicates the state of the signal sending time, V is the chamber volume, and k is the air adiabatic index.
Volume V can be expressed by Eq. (3) as follows:
where V10 is the initial volume of the rodless cavity, and V20 is the initial volume of the rod cavity.
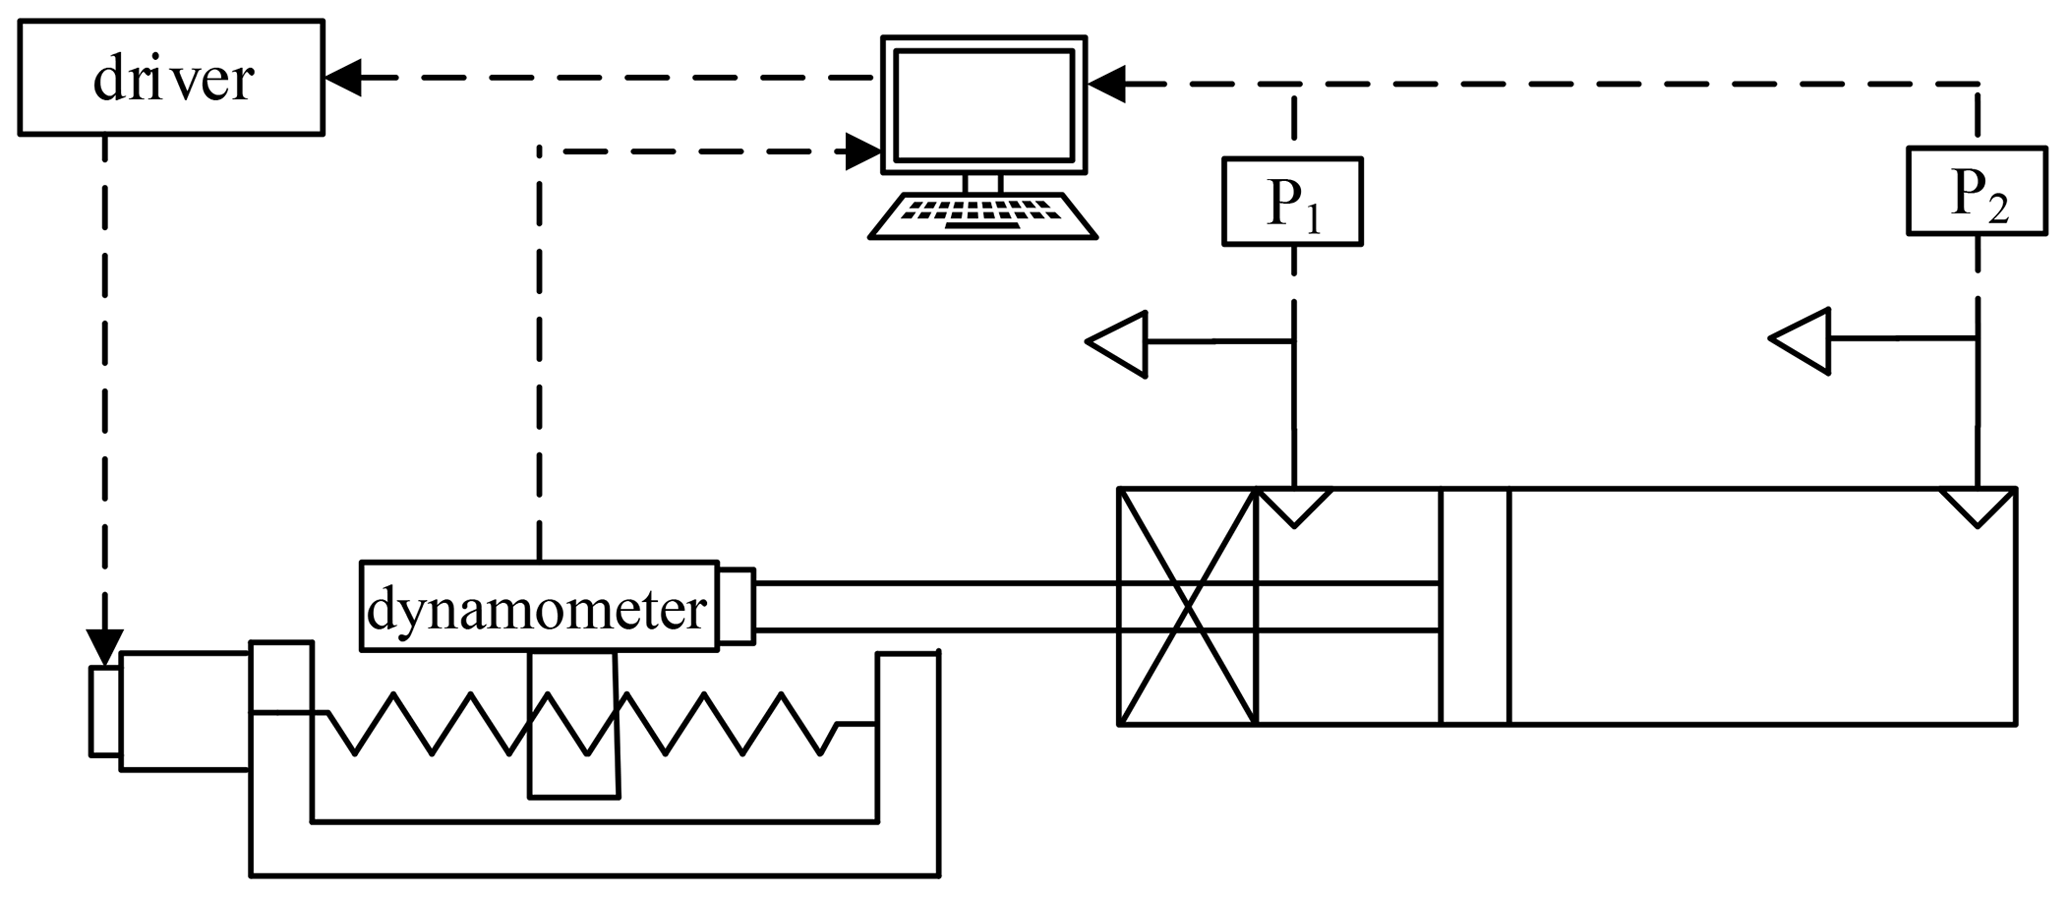
There were many models to describe the friction in a pneumatic cylinder (Jiang et al., 2011; Shang et al., 2015). The friction of the PEHA also included the friction between the pneumatic locking mechanism and the piston rod. Whether it could be described by the existing friction model and the parameters in the model needed to be determined by experiments. Generally, it was considered that friction was related to the velocity of the piston. The test platform was designed, as shown in Fig. 8. The inner cylinder was placed horizontally. The piston rod was connected with the dynamometer on the linear slide, and the driver controlled the linear slide to move at a uniform velocity. The friction could be measured and calculated according to Eq. (1).
The friction test results are shown in Fig. 9. The static friction was 40.12 N. The dynamic friction conformed to the Stribeck friction model at low velocity. The test values were fitted by the least square method. However, in the high-velocity stage, the friction force remained unchanged. Therefore, the friction of the inner cylinder can be expressed by Eq. (4) as follows:
where Fe is the resultant force other than friction, Fs is the static friction, with a test value of 40.12 N, Fc is the Coulomb friction, with a fitting value of 11.8 N, and vs is the Stribeck velocity, with a fitting value of 0.0072 m s−1. δ is the coefficient, with a fitting value of 0.2, b is the viscous friction coefficient, with a fitting value of 50.5, and Fb is high-velocity friction, with a test value of 37.4 N.

The experimental values and the calculated values using Eqs. (1)–(4) are shown in Fig. 10. It can be seen that the calculated values were very close to the test values, and the relative errors were within 5 %, indicating that Eqs. (1)–(4) could accurately describe the motion characteristics of this stage.

3.2.2 Locking braking stage
The piston rod was affected by the clamping force, friction, and air pressure in the locking braking stage. Because the clamping force was complex, and its function was to generate braking resistance, which was consistent with the direction of cylinder friction. All resistance could be calculated as a resultant force Fj. Then the equation of motion at this stage was Eq. (5), as follows:
where Fj is the resistance force.
Similarly, the changes in gas pressures and volumes in both chambers can be expressed by Eqs. (2) and (3). It was difficult to measure the total resistance Fj, and there was no existing literature on it.
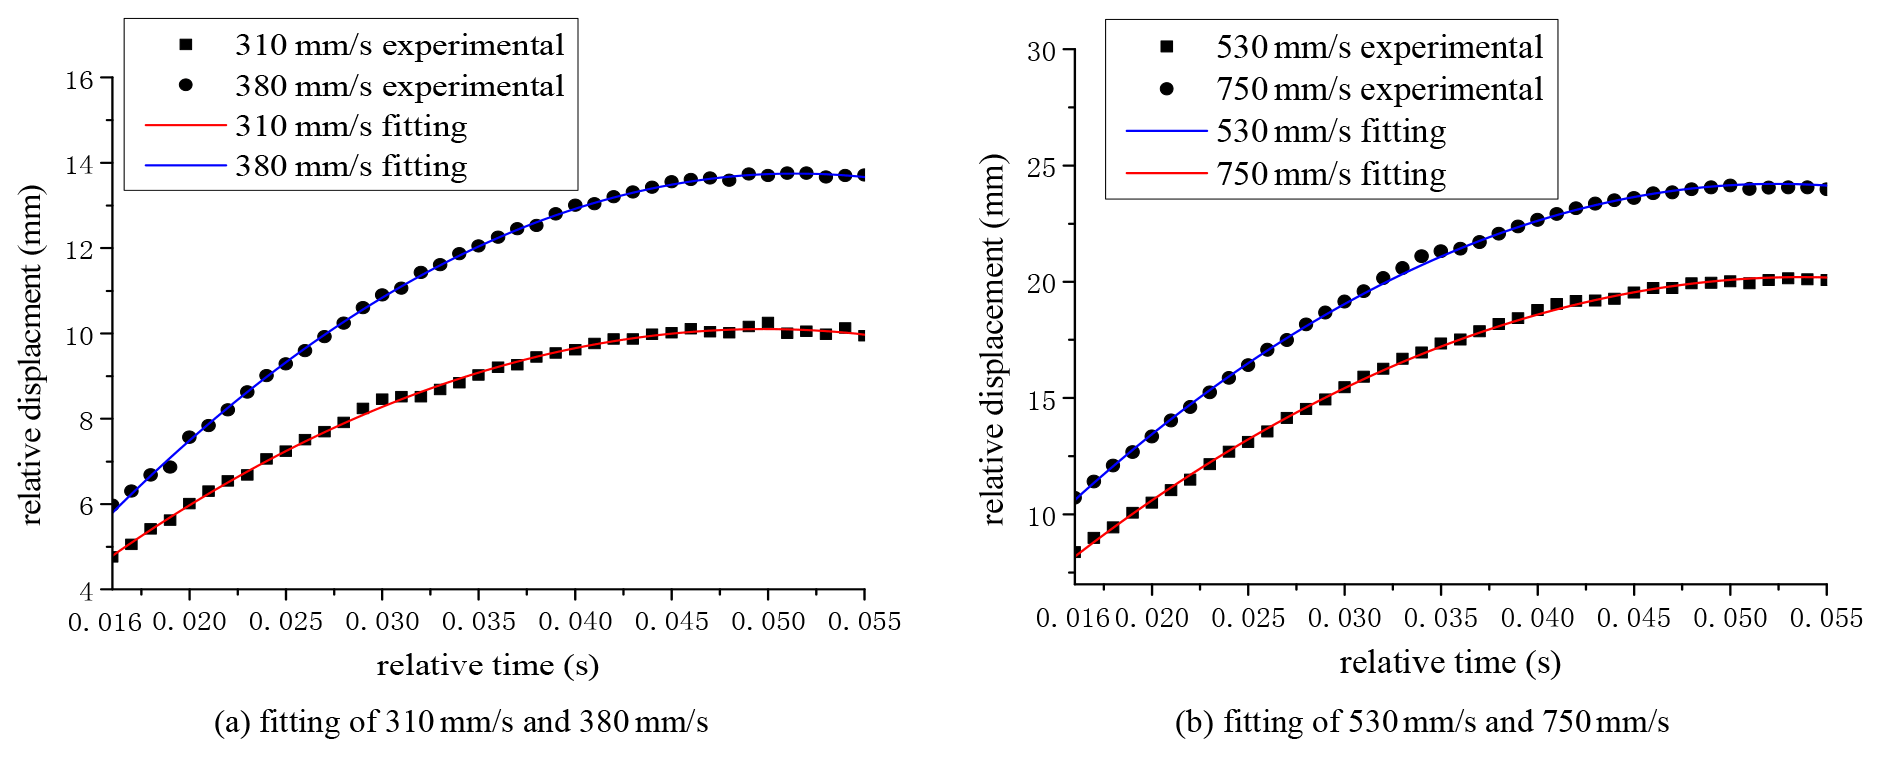
It could be found that the displacement curves in the braking stage under different initial velocities were very similar to the quadratic function. Therefore, it could be assumed that the piston rod received constant braking resistance in the locking braking stage and had a uniform deceleration movement, and that the resistance was related to the initial velocity.
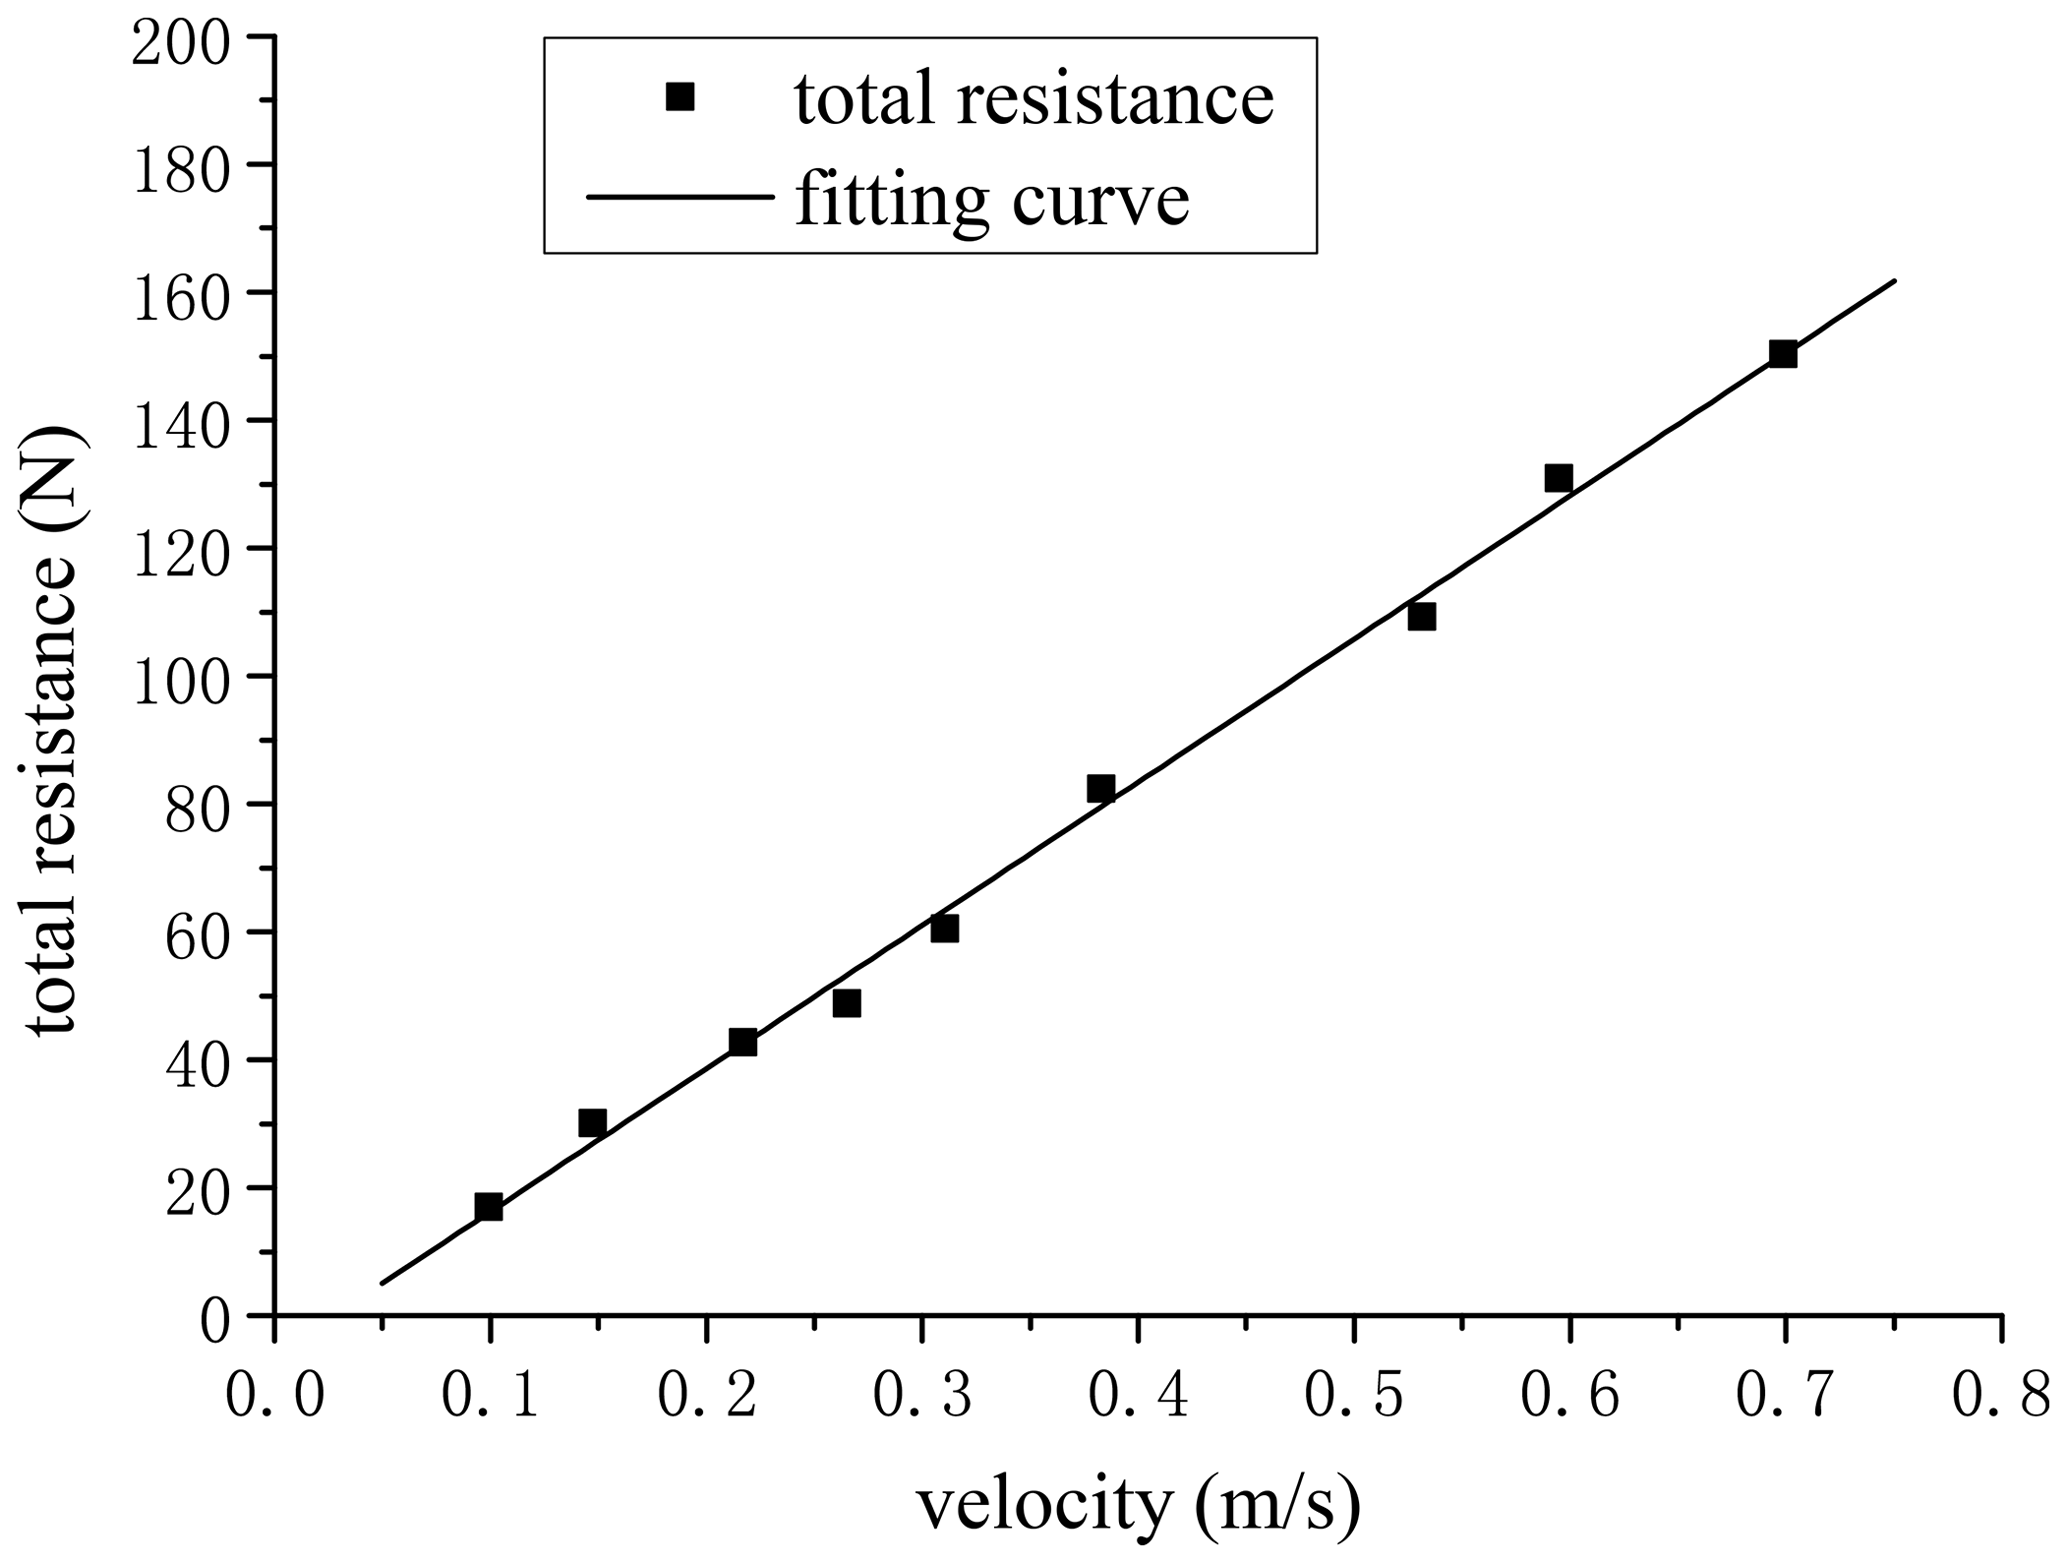
To verify this assumption, the displacement data in the braking stage were selected and fitted by the quadratic curve. As shown in Fig. 11, it could be seen that the data were well fitted with different initial velocities. Therefore, such a conclusion could be obtained that, in the braking stage, the piston and piston rod assembly were subjected to an approximately constant resistance to make it slow down evenly until it stopped. The acceleration in the braking stage under different initial velocities could be calculated by quadratic derivation; that is, the total resistance Fj could be calculated. As shown in Fig. 12, the relationship between the total resistance Fj and different initial velocities presented a linear relationship.
3.3 Response of the motor screw pair
The selected motor was a DC servo motor with a 1000 encoder. The position control mode was selected at the motor driver. The pulse frequency and quantity controlled the rotary velocity and angle. Then the velocity of the motor driving the inner cylinder can be expressed as Eq. (6) as follows:
where ω is the rotating velocity, L is the ball screw lead, and f is frequency.
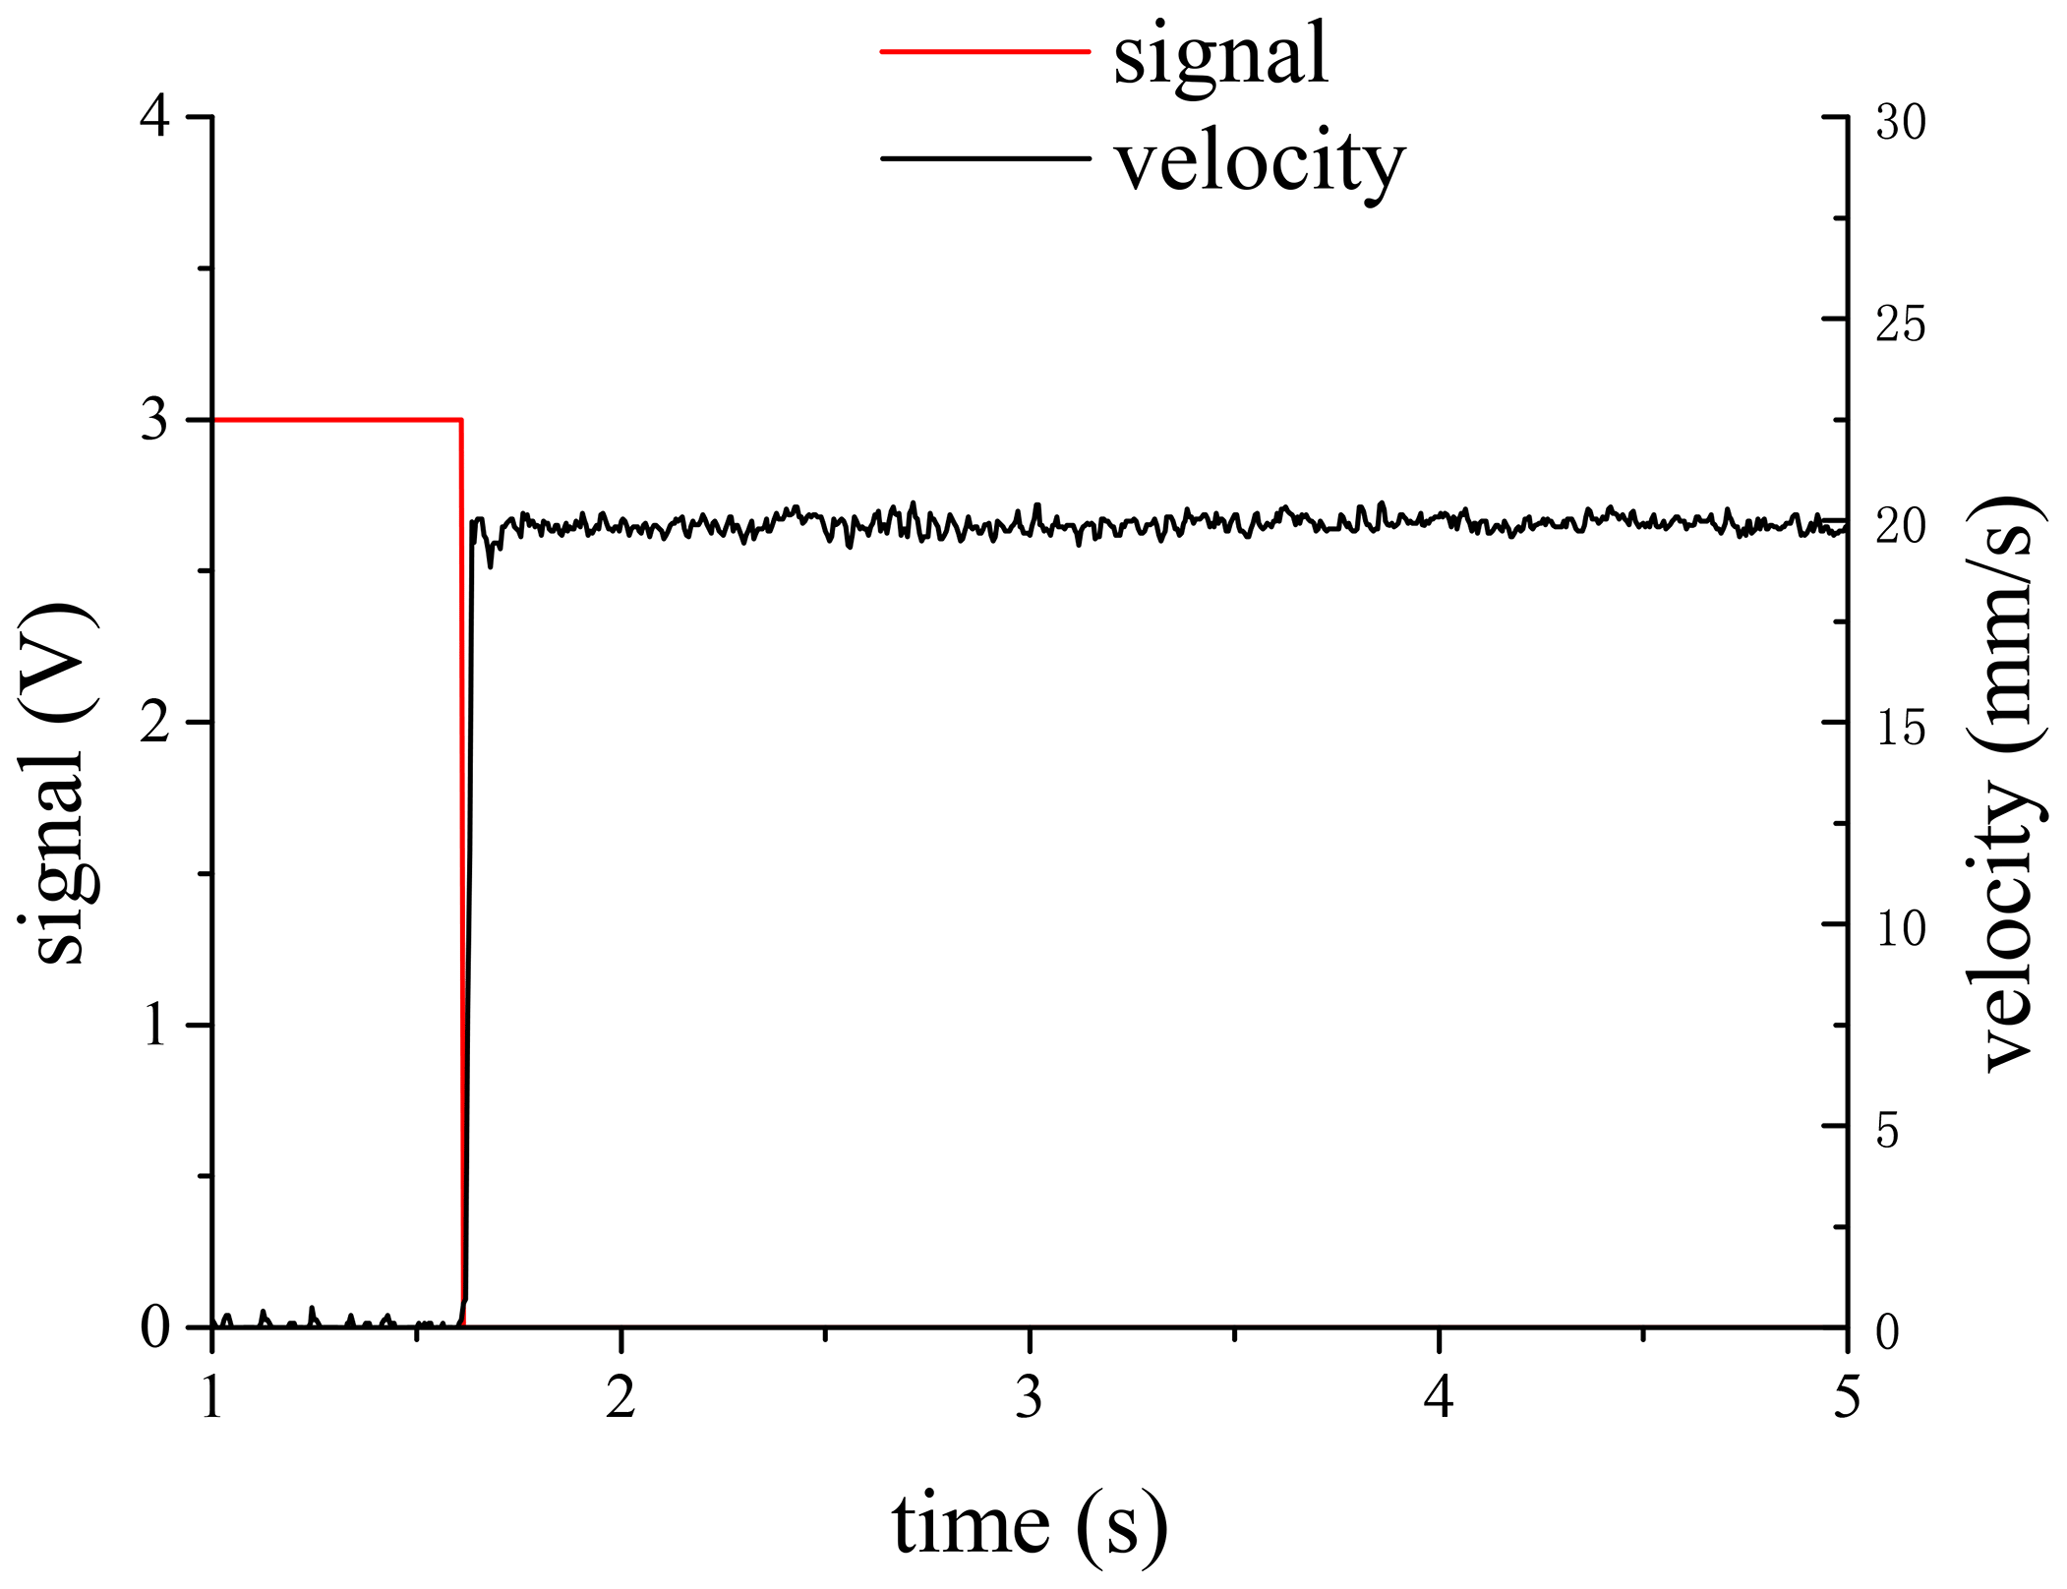
The starting characteristics of the motor are shown in Fig. 13. The input pulse frequency was 10 kHz. It can be seen from the figure that the actual velocity of the nut was 20 mm s−1 with little fluctuation. The response time was 10 ms, and the acceleration time, from 0 to 20 mm s−1, was 15 ms.
4.1 Lock and start driving switching strategy
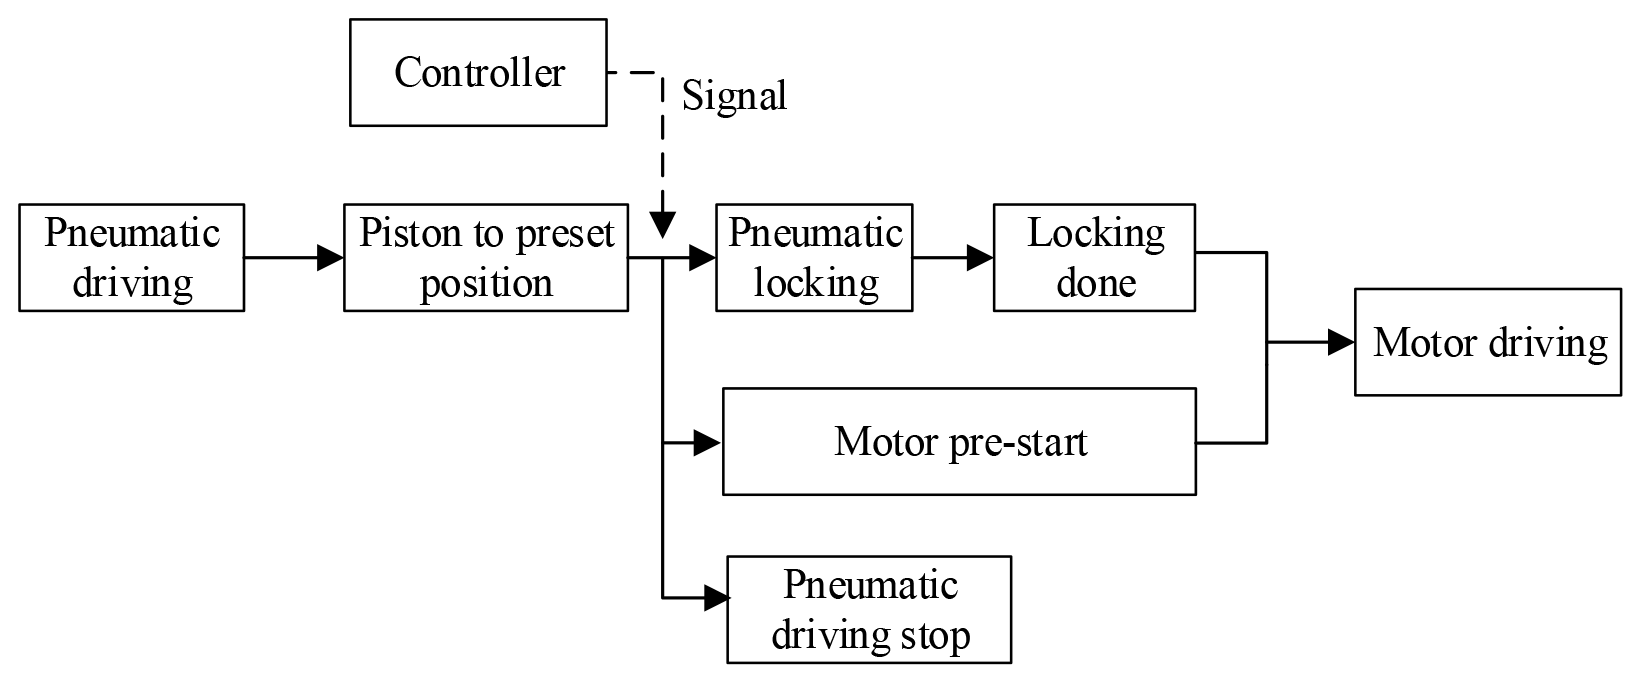
To reduce and eliminate the velocity fluctuation caused by the stop then restart control strategy, a new drive switching control strategy was formulated. Since it took 55 ms for the locking mechanism to lock the piston rod, the motor drive could be started at the same time to prevent the velocity from reducing to zero. As shown in Fig. 14, the switching signal sent by the controller controlled both the locking and motor starting. This method was called the “lock and start” driving switching strategy.
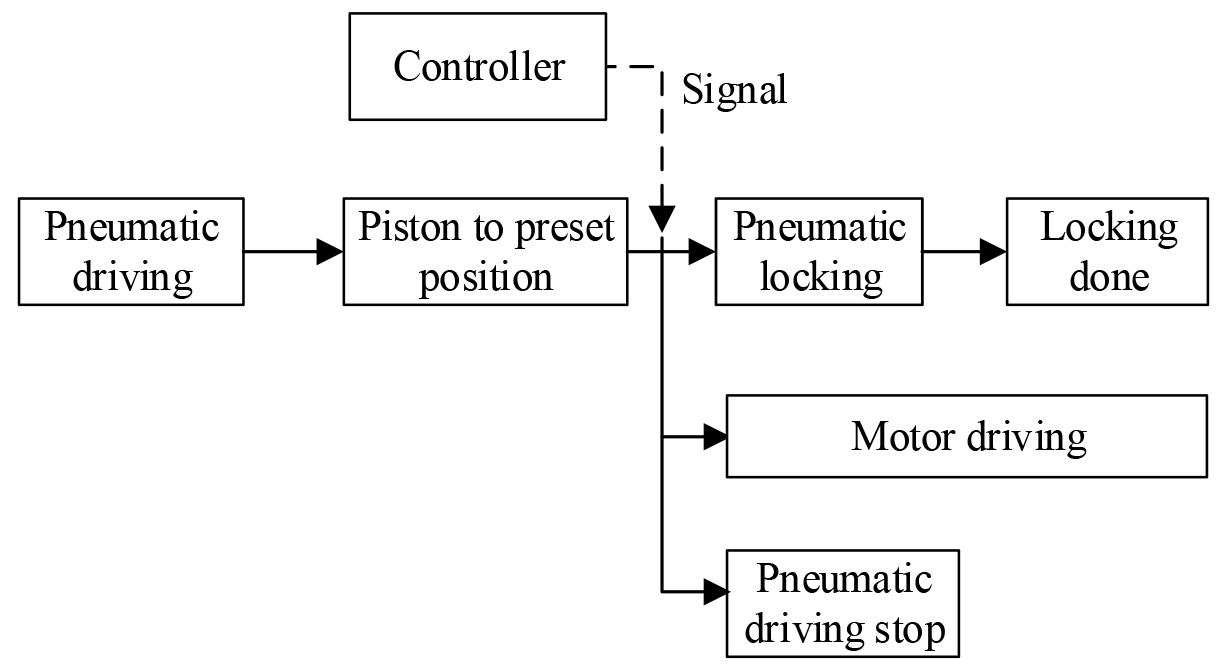
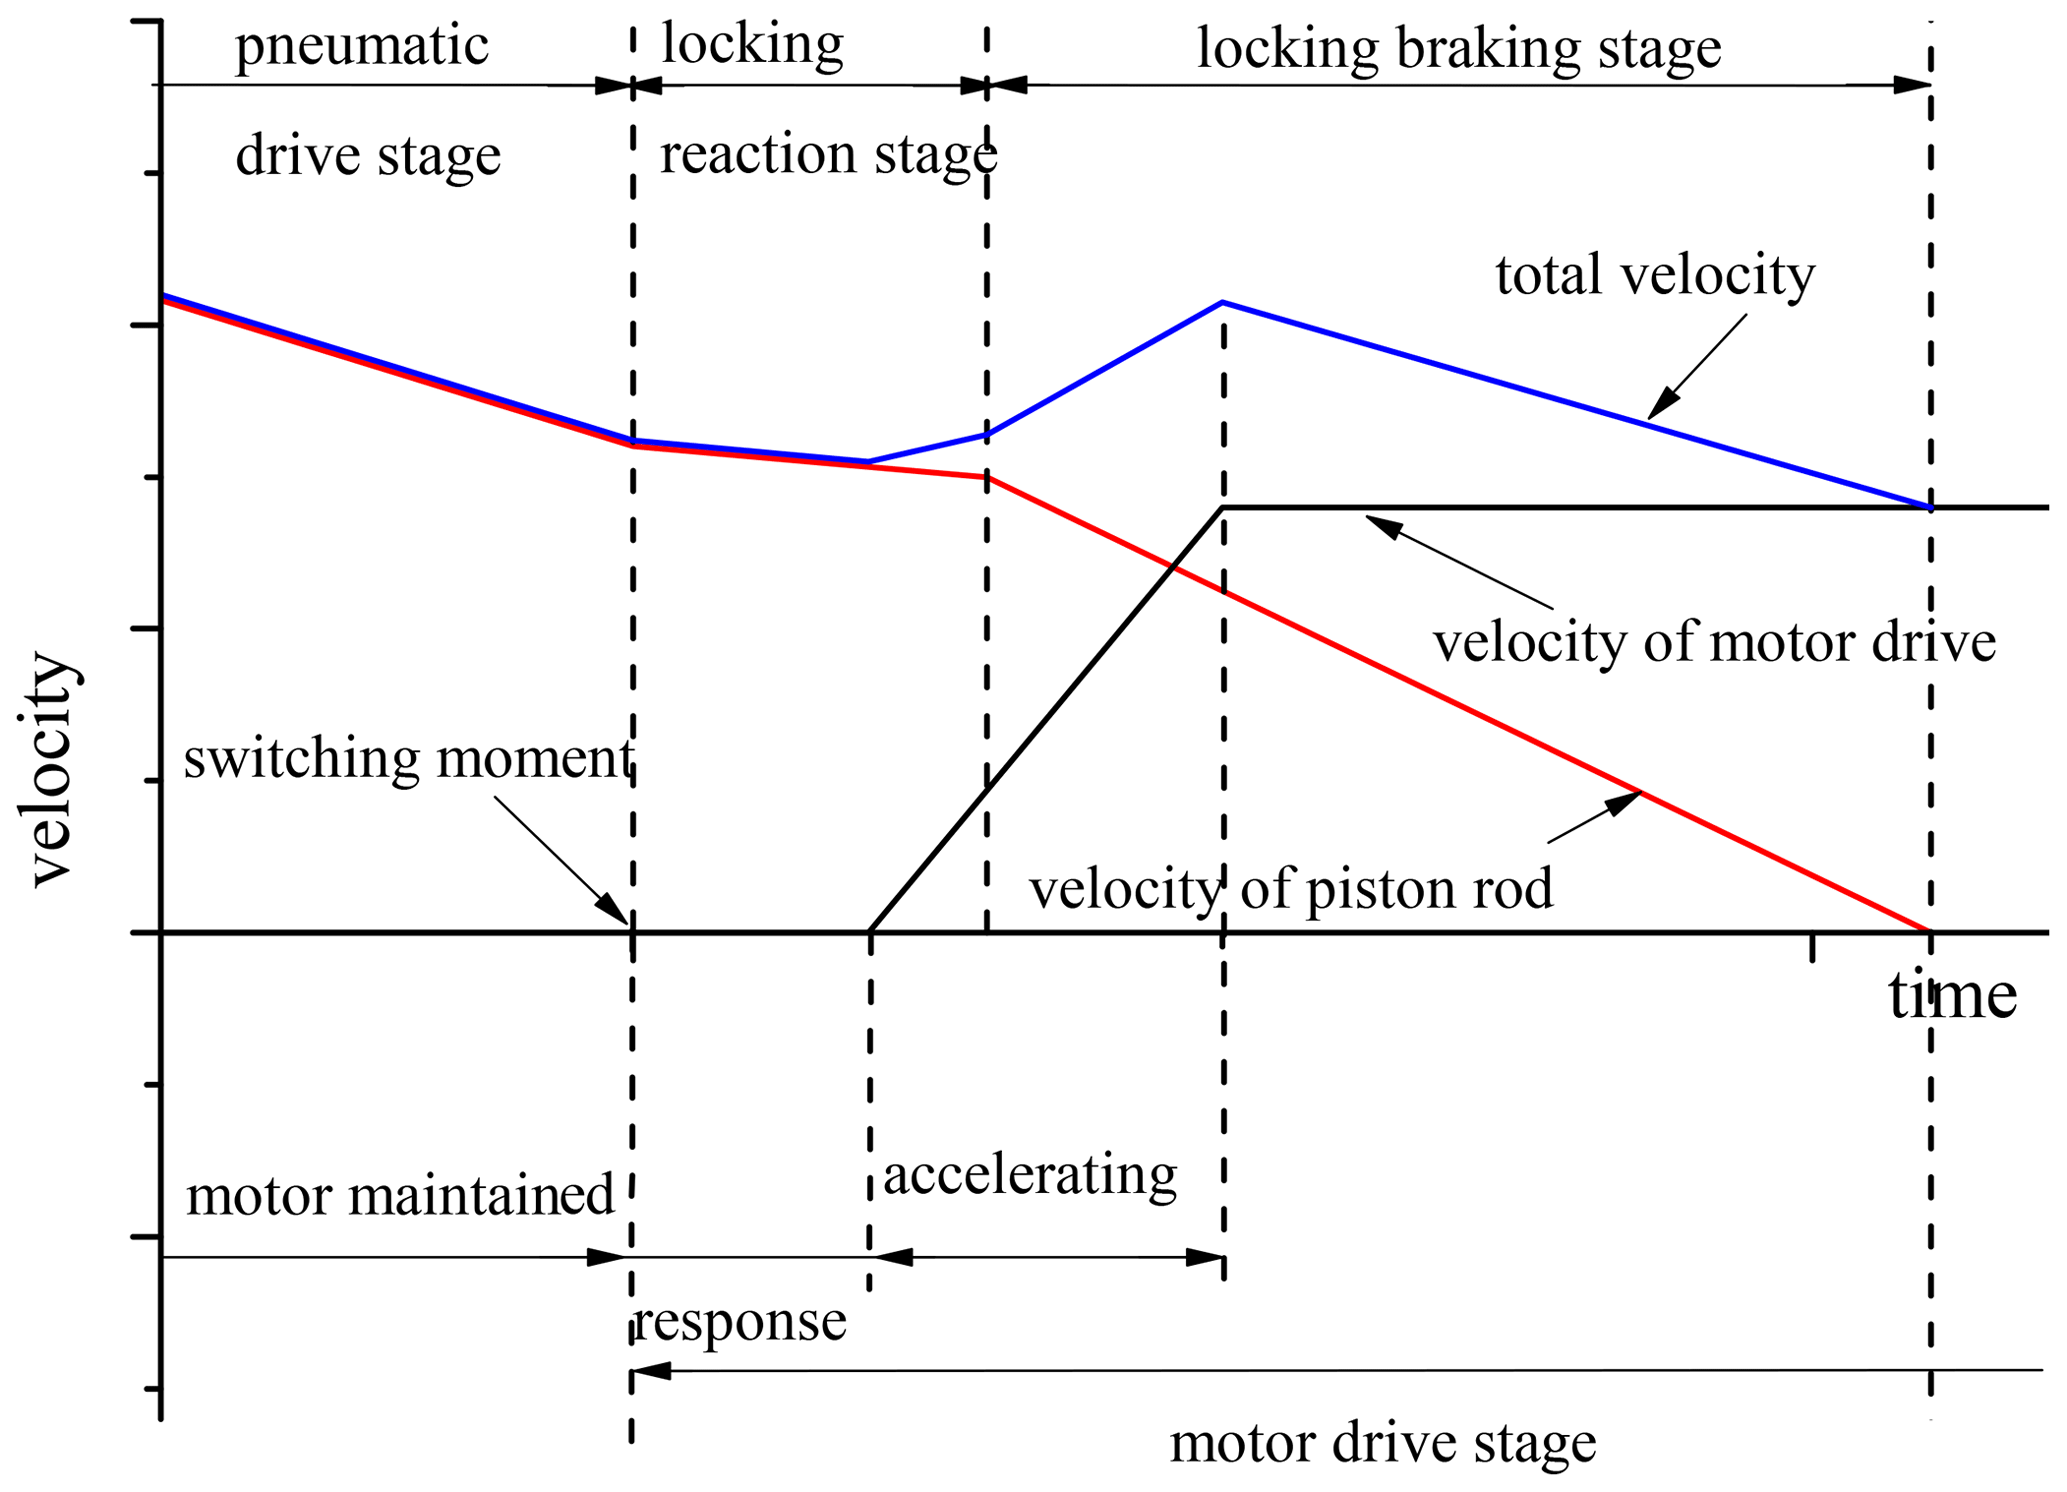
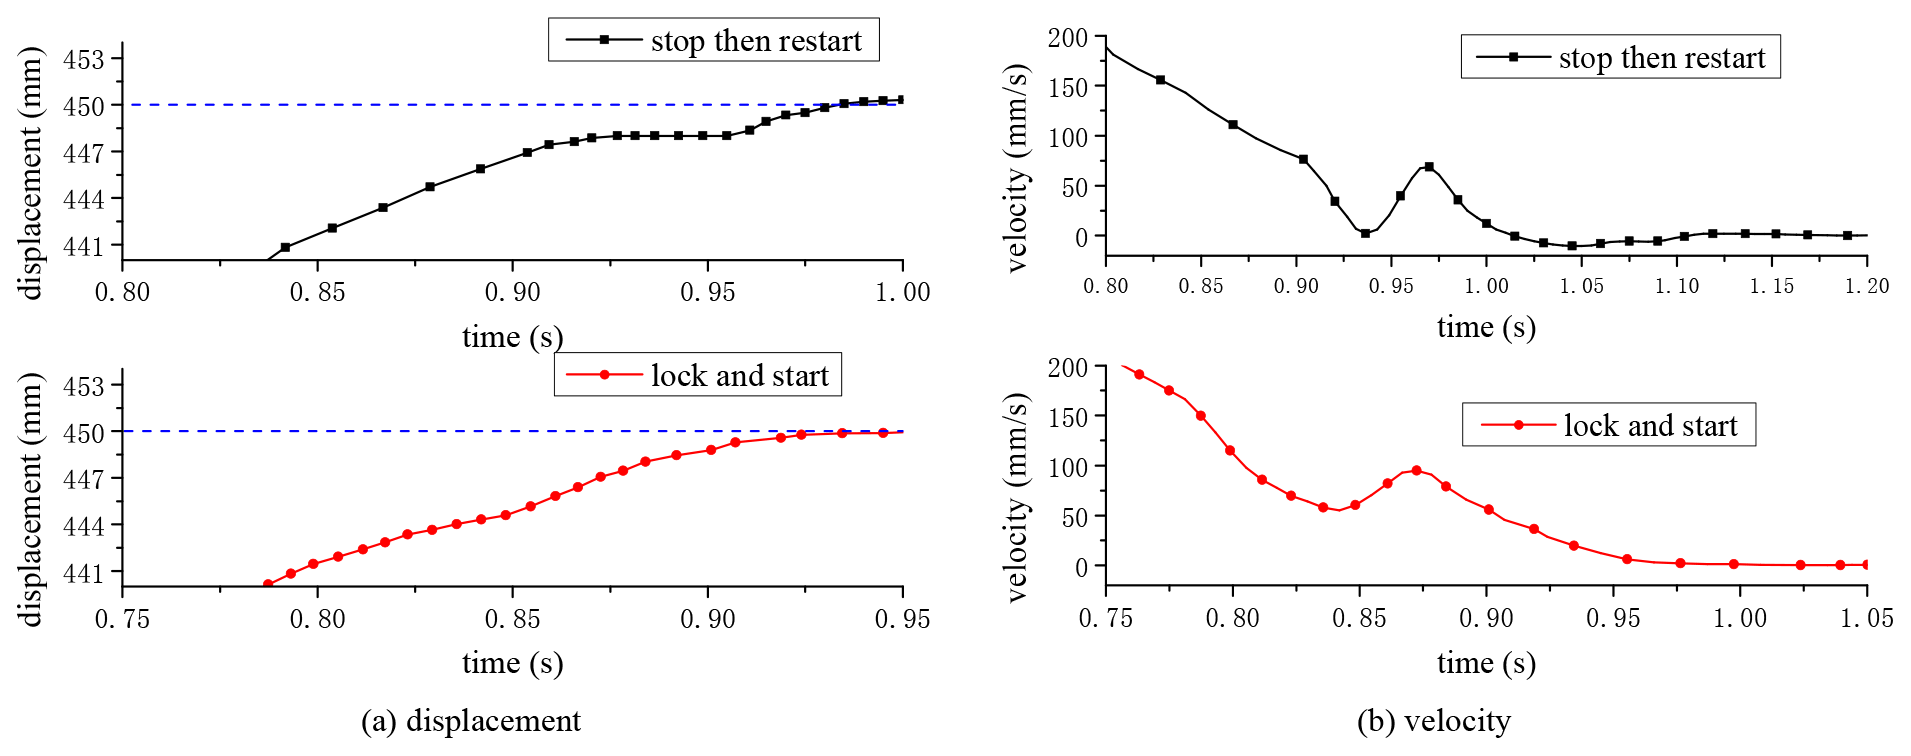
Figure 16Comparison of the positioning test of 0–450 mm with the strategies of lock and start and stop then restart.
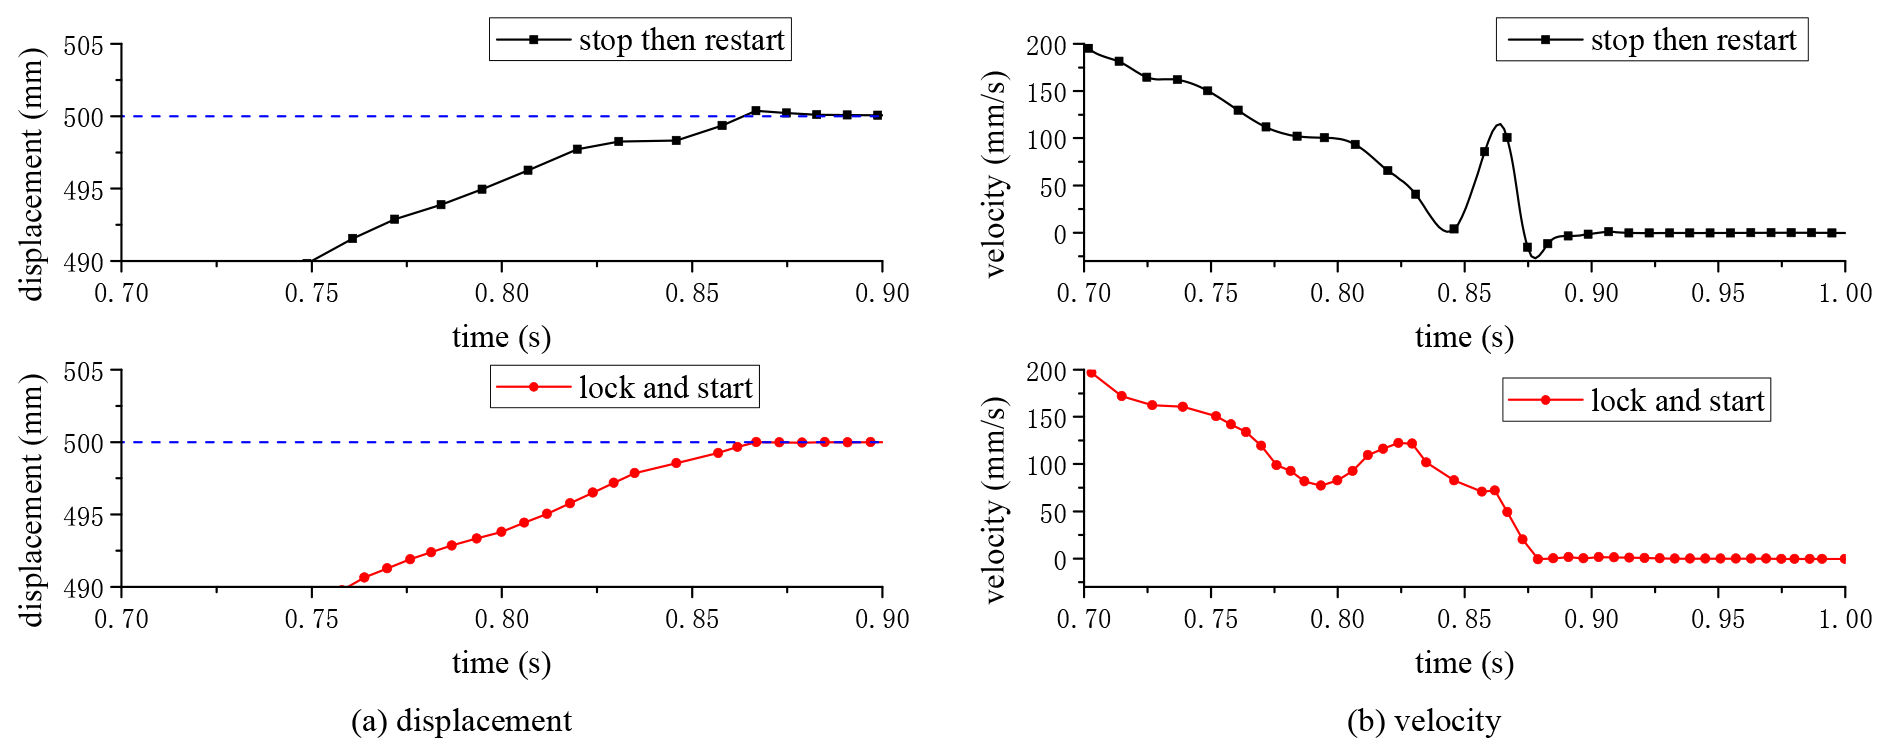
Figure 17Comparison of the positioning test of 0–450 mm with the strategies of lock and start and stop then restart.
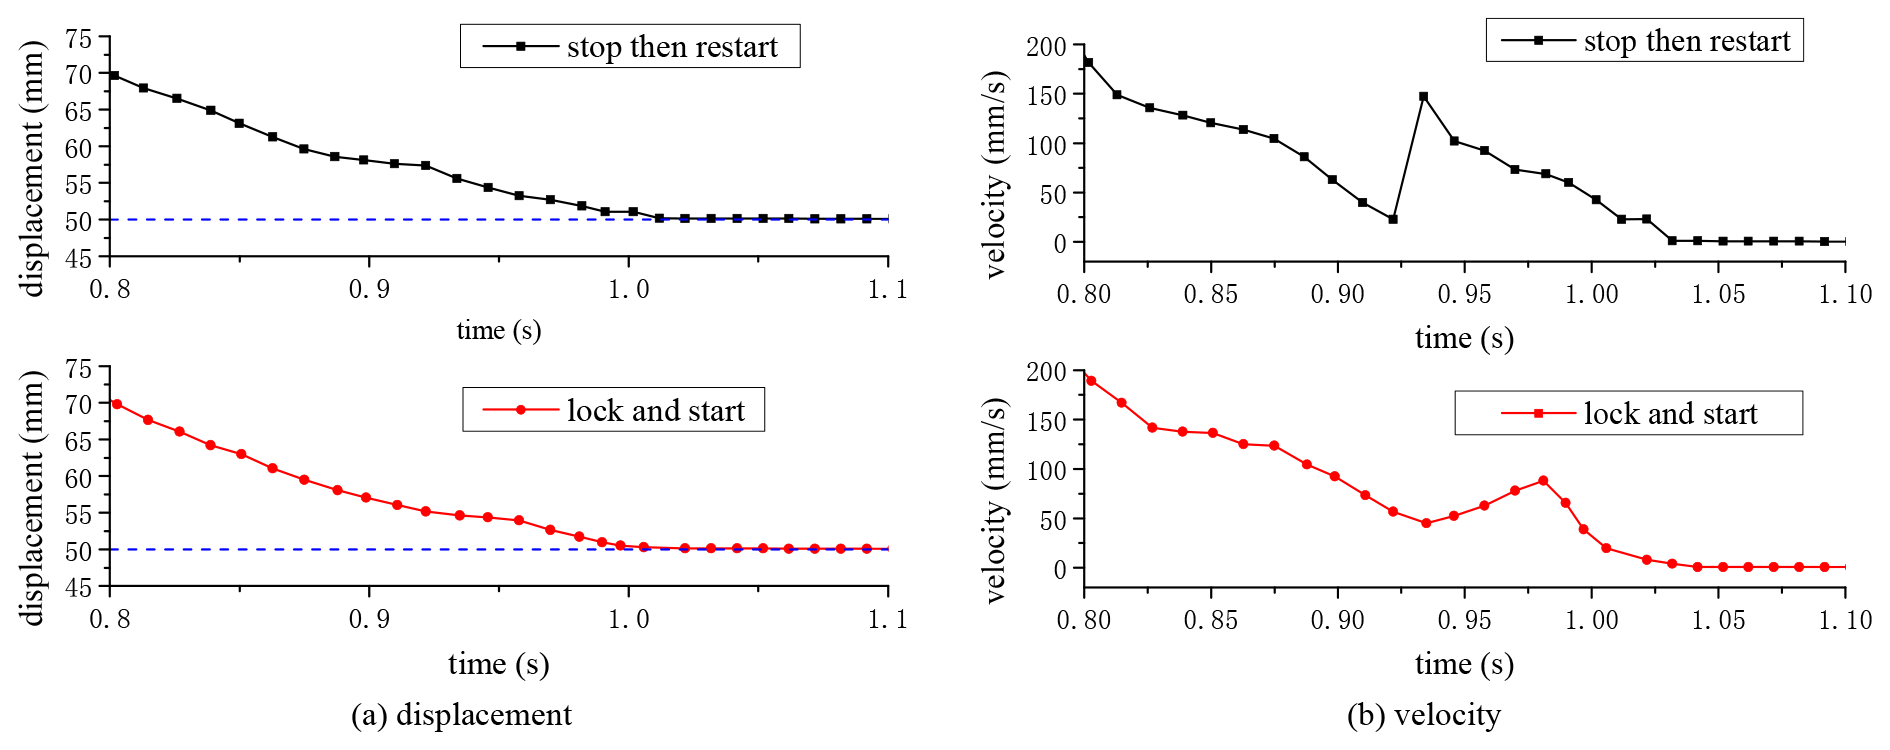
Figure 18Comparison of the positioning test of 0–450 mm with the strategies of lock and start and stop then restart.
In the lock and start strategy, the relationship between the piston rod velocity, motor driving velocity, and overall velocity is shown in Fig. 15. Because the PEHA was driven in series mode, the overall velocity was the sum of the piston rod velocity relative to the inner cylinder and the inner cylinder velocity driven by the motor. Before driving switching, the overall velocity was equal to the piston rod velocity and kept decreasing. When the position error reached 5 mm, the piston rod was locked by a locking mechanism, and the velocity decreased to zero. Meanwhile, the motor drive started, and the motor drive velocity increased rapidly. The overall velocity increased accordingly. The fluctuation of velocity would be reduced due to the start of motor drive compensating for the velocity loss.
The proportional fuzzy control was adopted in the pneumatic drive stage and the segmented frequency control was adopted in the motor drive stage (Yang et al., 2021). Combined with the drive switching strategy, the positioning tests at different locations were carried out to compare the displacement and velocity fluctuations under the two drive switching strategies of lock and start and stop then restart.
It can be seen from Fig. 16a that, under the stop then restart switching strategy, a small horizontal displacement occurred due to the locking mechanism during the process of approaching the target position of 450 mm. It meant the braking state was completed. At this time, the distance from 450 mm was 2 mm, and then the motor drive was started for accurate positioning. It can be seen from the velocity curve in Fig. 16b that, when approaching the target position, the velocity decelerated to 2 mm s−1 and then rapidly increased to 70 mm s−1. The velocity fluctuation was 68 mm s−1. However, under the lock and start switching strategy, the velocity fluctuation was significantly reduced. The minimum velocity was 58 mm s−1 and then increased to 94 mm s−1, with a fluctuation range of 36 mm s−1. Compared with the stop then restart strategy, the fluctuation range was reduced by 47 %.
Figure 17 showed the 100–500 mm positioning test. It can be seen from Fig. 17a that, under the stop then restart strategy, there was also an approximate horizontal displacement at 498 mm; that is, the locking mechanism completed the locking. Then the PEHA was switched to the motor drive and continued to the target position. However, there was no horizontal displacement under the lock and start strategy. As can be seen from Fig. 17b, under the stop then restart strategy, the minimum velocity during switching reached 4 mm s−1. Then it increased to 98 mm s−1 by the motor drive. The fluctuation amplitude was 94 mm s−1. However, under the lock and start strategy, the minimum speed was 77 mm s−1, and the maximum speed was 121 mm s−1. Compared with the stop then restart strategy, the fluctuation range was reduced by 53 %.
Figure 18 shows the 500–50 mm positioning test. Under the stop then restart strategy, the speed fluctuation range was 124 mm s−1. However, under the lock and start strategy, the speed fluctuation range was 43 mm s−1, which was reduced by 65 %. Therefore, the amplitude of the velocity fluctuation could be reduced by the lock and start strategy, but could not be completely eliminated.
4.2 Relay and run driving switching strategy
In the lock and start driving switching strategy, the motor was started in advance to prevent the velocity from reducing to zero and to reduce the velocity fluctuation. However, since the starting velocity of the motor was not controlled, there was still a small fluctuation.
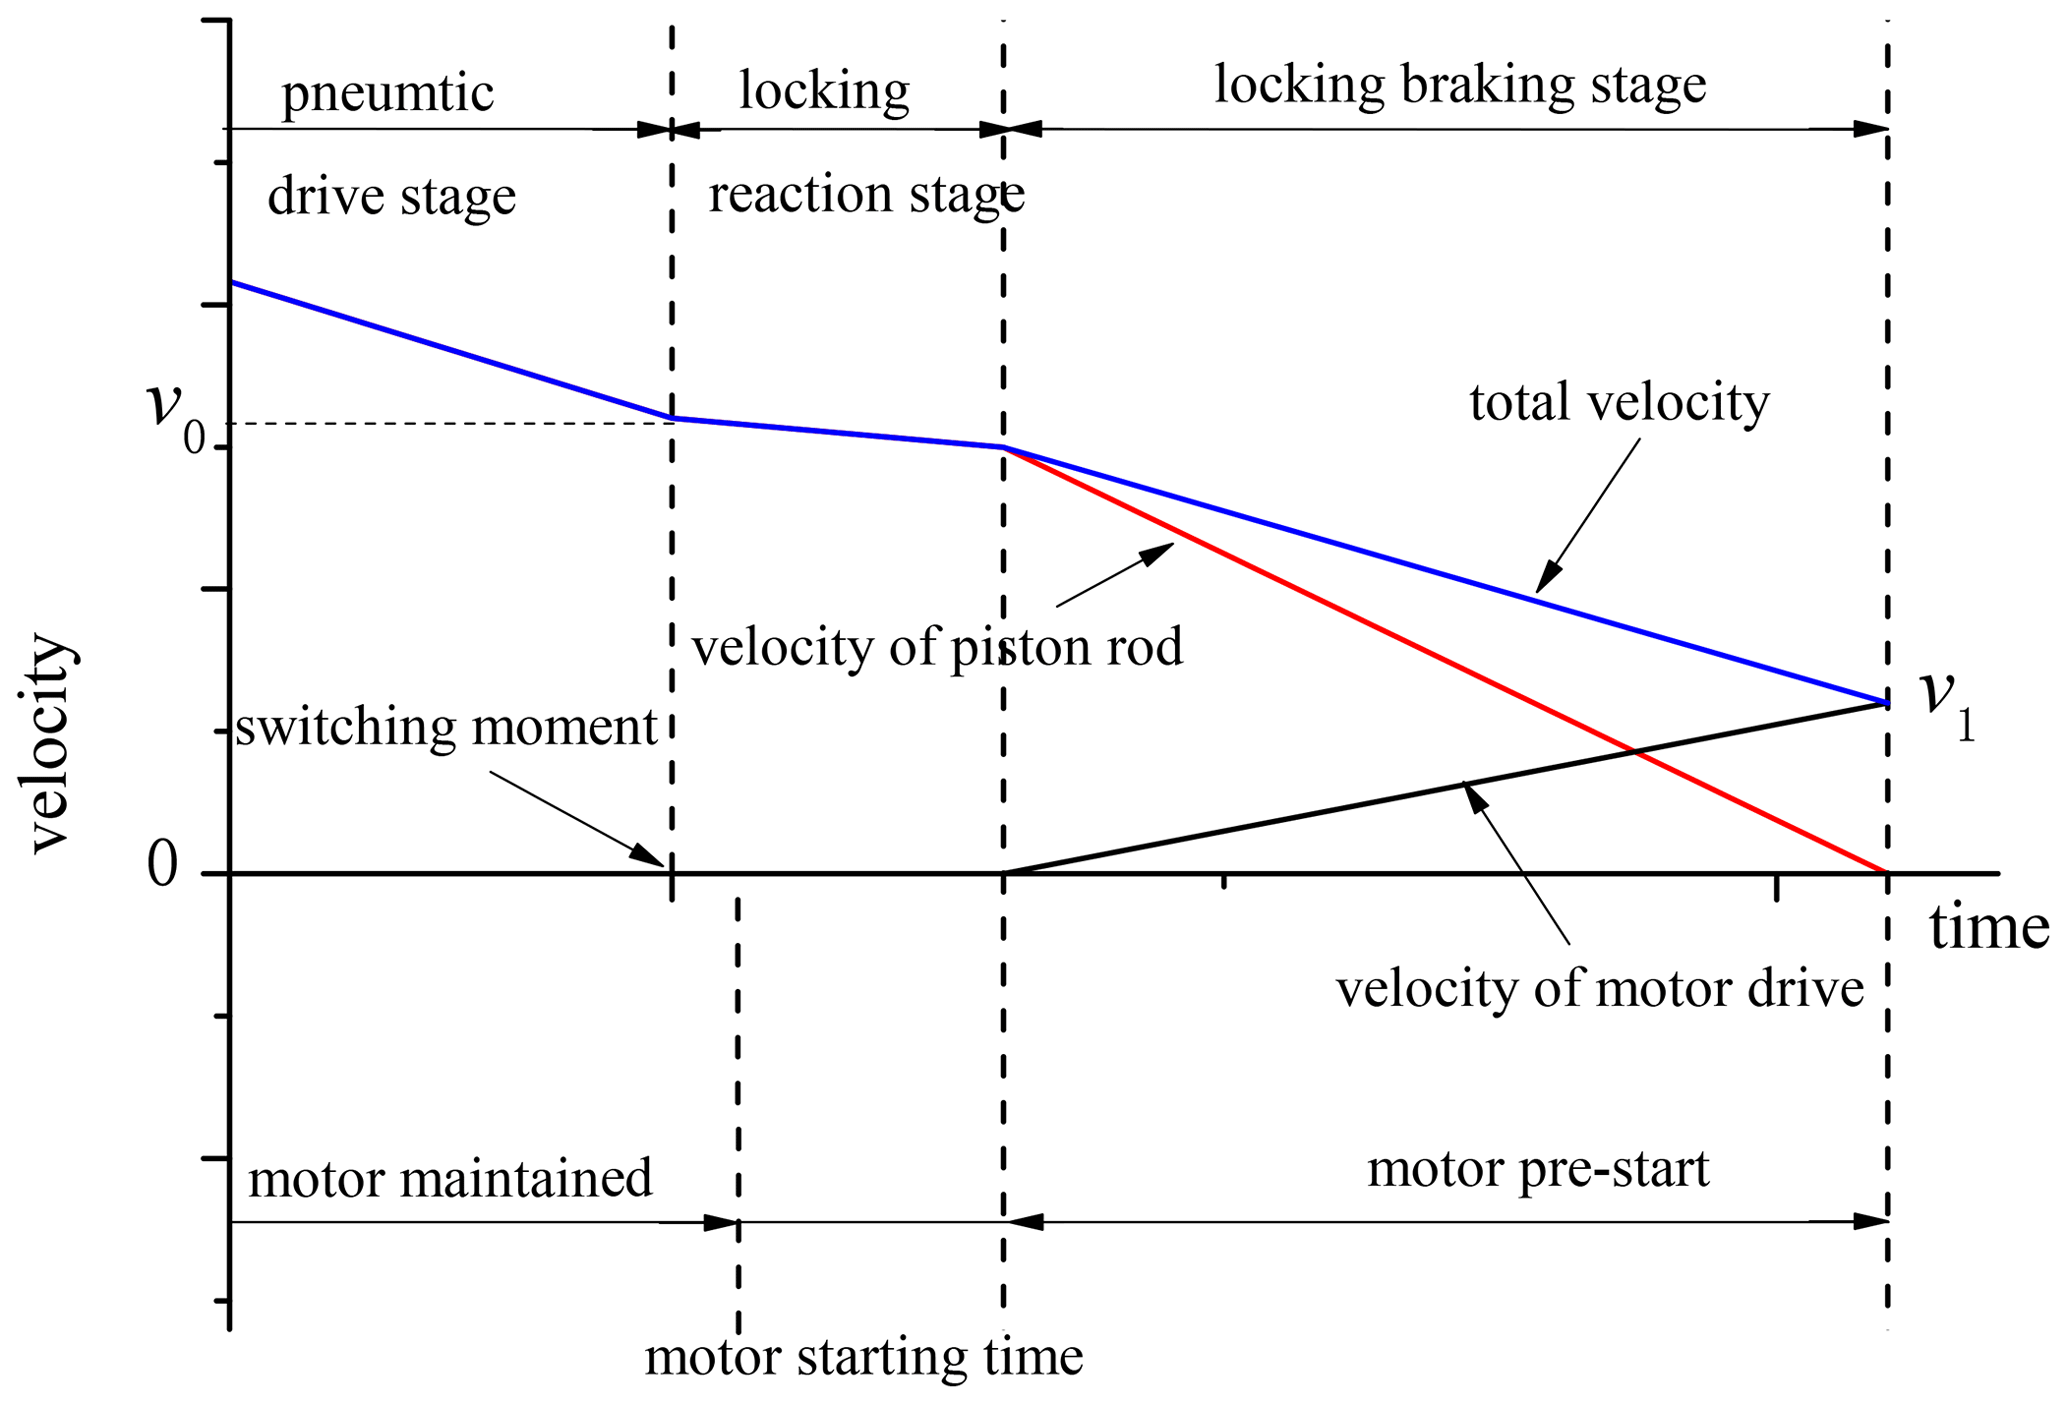
It was known through test and theoretical derivation that, in the locking reaction stage, the velocity of the piston rod decreased slightly, while in the locking braking stage, the piston rod decelerated at a constant acceleration until it stopped. According to this characteristic, the motor was controlled to start at an appropriate time and accelerate during the deceleration period of the piston rod to make the overall velocity smooth. The switching process is shown in Fig. 19. Similar to the relay race, with the former decelerating and the latter accelerating, this strategy was called the relay and run driving switching strategy.
The velocity curve during the switching of the relay and run is shown in Fig. 20. In the pneumatic driving stage, when the piston approached the target position, it was continuously decelerated by the control strategy. During this time, the motor was powered on and maintained. When the position error was less than 5 mm, the controller sent a signal to stop the air supply of the inner cylinder. The locking mechanism started to lock the piston rod, assuming the velocity as being v0. The motor started after 5 ms at the switching moment, so that the locking braking stage coincided with the motor pre-start stage. The velocity of the piston rod reduced evenly to zero, while the velocity of motor drive increased to v1. As the overall velocity was the sum of the piston rod velocity and the motor drive velocity, it was accelerating uniformly from the velocity v0 to v1. The relationship was set . Then the system switched to the motor driving stage.
Assuming that the piston velocity at the beginning of braking was v0, and the overall velocity at the end of braking after velocity compensation was v1, the control frequency given by the controller to the motor in the locking braking stage should be Eq. (7), as follows:
where τ is relative time.
Proportional–integral–derivative (PID) control was adopted in the motor driving stage. To avoid the situation that the velocity in the motor driving stage was greater than that in the locking braking stage, the maximum velocity was set as v1, i.e., Eq. (8), as follows:
The positioning tests of 0–450, 100–500, and 500–50 mm were repeated to compare the velocity fluctuation under the two driving switching strategies of the relay and run and stop then restart strategies, as shown in Figs. 21 to 23. As can be seen from Fig. 21a, under the relay and run strategy, the displacement curve continued to approach the 450 mm target position, and there was no horizontal displacement as seen under the stop then restart strategy. From the velocity curve in Fig. 21b, it can be seen that, under the relay and run strategy, the velocity continued to decrease to zero. There was no fluctuation phenomenon during the driving switching time.
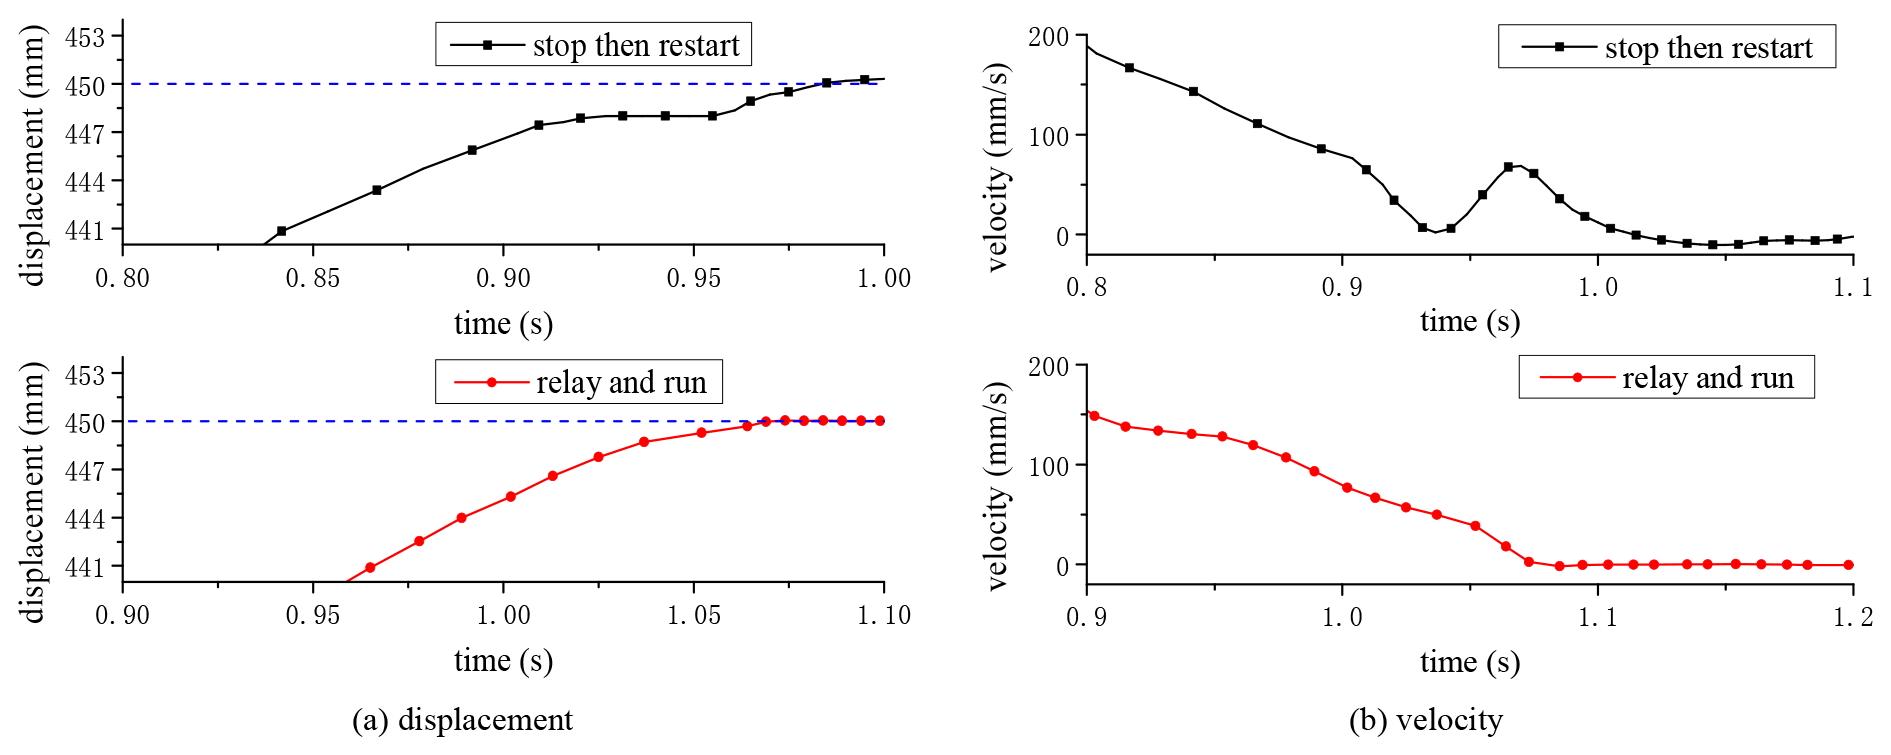
Figure 21Comparison of the positioning test of 0–450 mm with the strategies of relay and run and stop then restart.
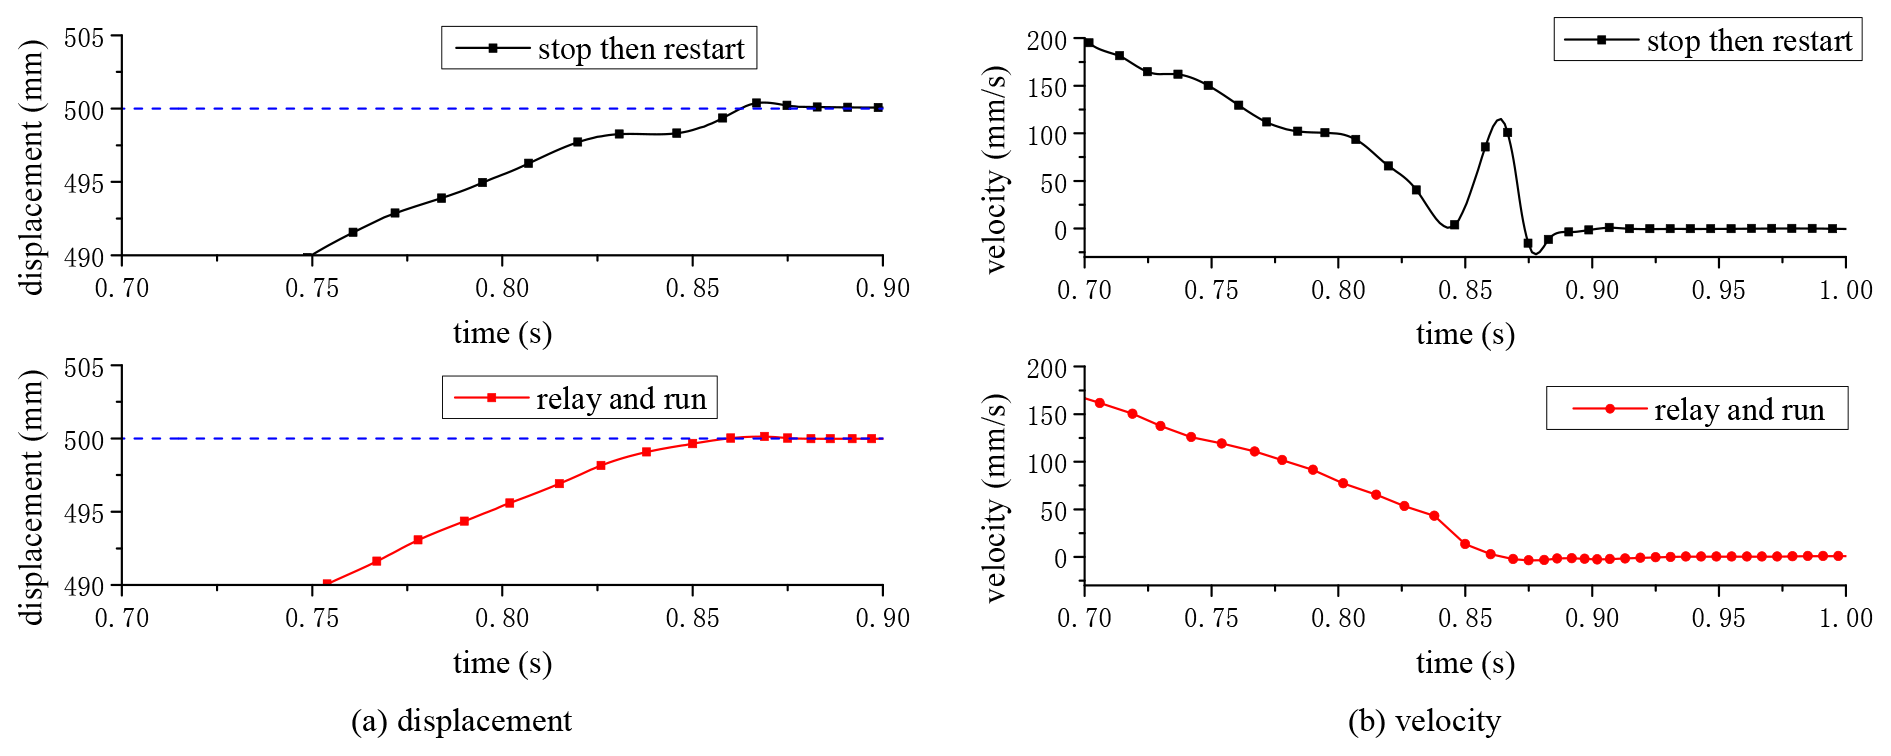
Figure 22Comparison of the positioning test of 100–500 mm with the strategies of relay and run and stop then restart.
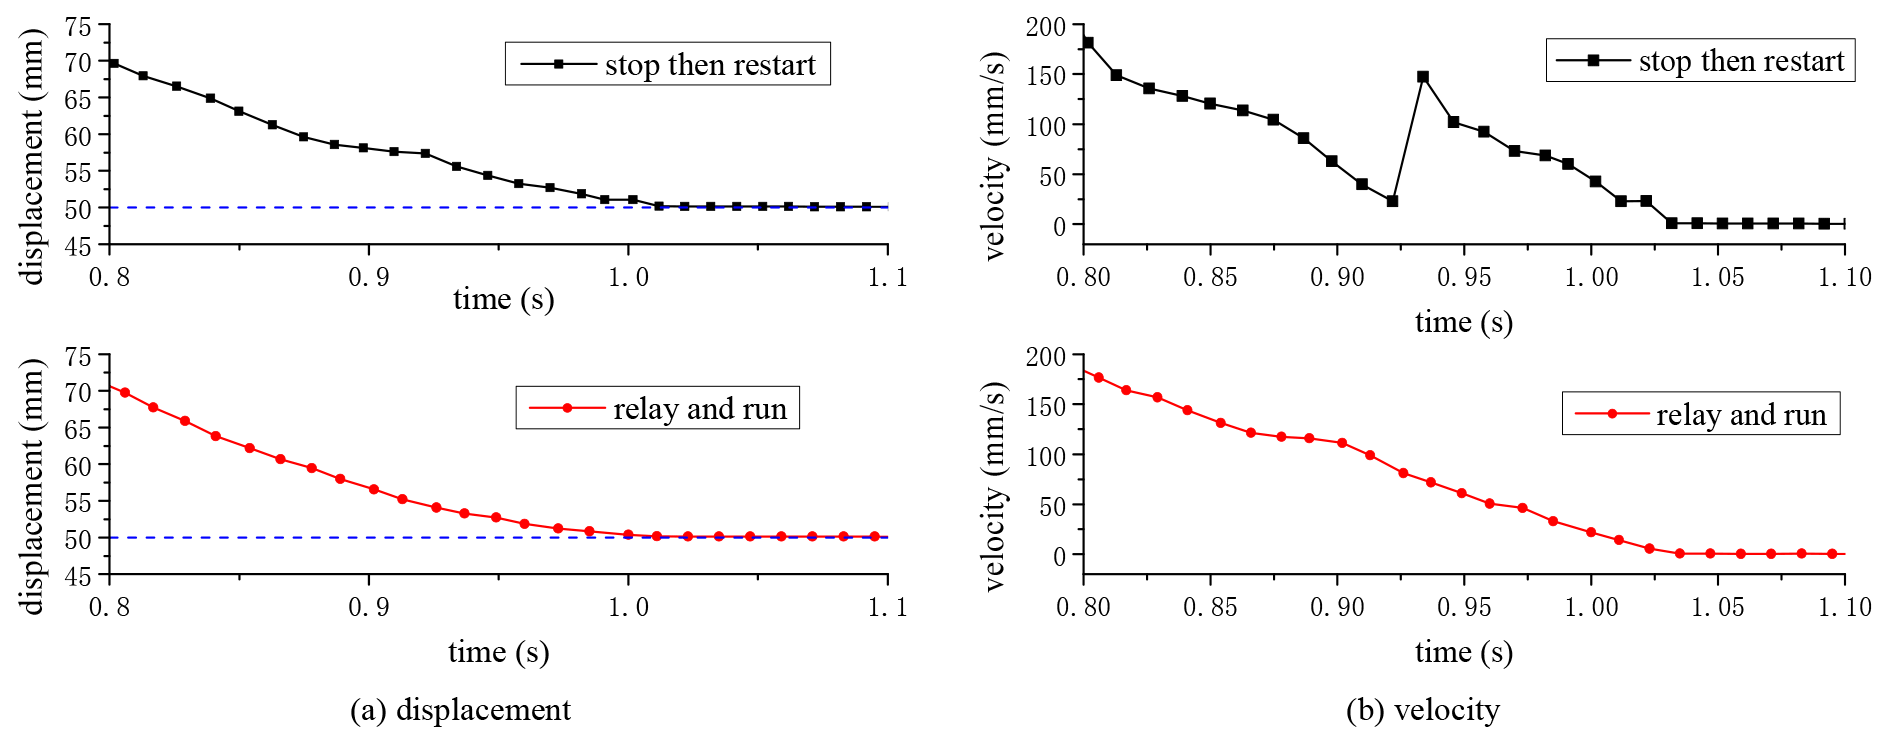
Figure 23Comparison of the positioning test of 500–50 mm with the strategies of relay and run and stop then restart.
Similarly, the same conclusion could be obtained in the comparison of the 100–500 mm positioning test shown in Fig. 22 and the 500–50 mm positioning test shown in Fig. 23. Therefore, it was proved that the velocity fluctuation caused by the stop then restart strategy was effectively solved under the driving switching strategy of relay and run. Moreover, the conclusion was obtained from the positioning tests so that different position parameters did not affect the control effect.
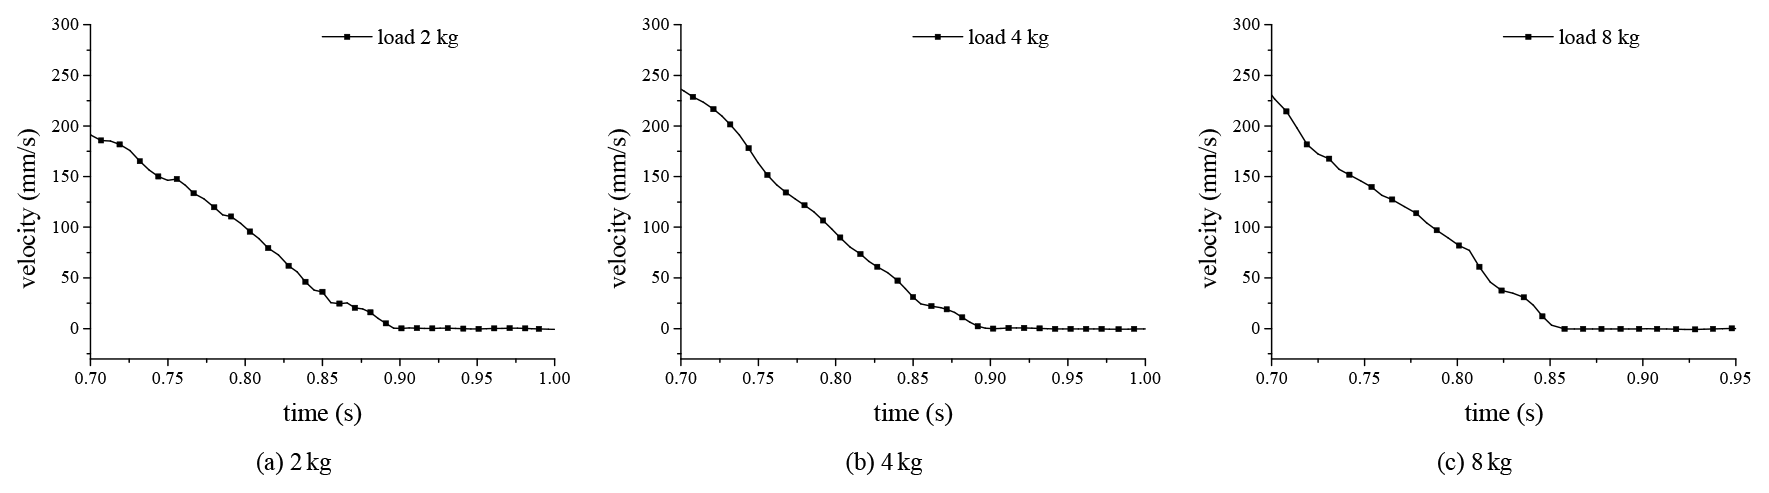
Several 100–500 mm positioning tests were conducted to examine the robustness of the relay and run strategy under different loads, as shown in Fig. 24. It can be seen that the velocities continued to decrease to zero under different loads from 2 to 8 kg. There was no velocity fluctuation, indicating that the strategy had good robustness.
In the positioning process of the new pneumatic electric hybrid actuator, the problem of velocity fluctuation occurred due to the driving switching strategy of stop then restart. To solve this problem, the response characteristics of the locking mechanism locking the piston rod were analyzed and studied. Through experiments and theoretical derivation, the theoretical mathematical model of the pneumatic locking process was obtained. The starting characteristics of the motor lead screw pair were tested.
According to the response characteristics of the locking mechanism and the starting characteristics of the motor lead screw pair, two driving switching strategies of lock and start and relay and run were formulated and compared. Positioning tests at different positions and loads were carried out. The results showed that the velocity fluctuation was eliminated under the relay and run switching strategy. Therefore, the new pneumatic electric hybrid actuator could locate accurately, without velocity fluctuation, to better meet the application requirements.
In future research on the new PEHA, the following two aspects deserve more exploration: (1) the motion model of the piston rod in locking braking stage. At present, the conclusion has been drawn from the experiments that the piston rod makes a uniform deceleration movement at the locking braking stage. This method is not accurate enough. An attempt should be made to establish an accurate physical model and mathematical description. (2) The optimization of speed smoothing strategy. In the current strategy, the driving switching signal only depends on the position information of the piston rod. A switching signal integrating position, velocity, acceleration, and other information should be studied to make the switching time more reasonable.
All the data used in this paper can be obtained from the corresponding author upon request.
JY and XL conceived the presented idea. JY did the experiments, organized the paper structure, and wrote the paper. XL reviewed and edited it.
The authors declare that they have no conflict of interest.
Publisher's note: Copernicus Publications remains neutral with regard to jurisdictional claims in published maps and institutional affiliations.
The authors would like to thank anonymous reviewers for their valuable comments and suggestions that enabled us to revise the paper.
This paper was edited by Peng Yan and reviewed by two anonymous referees.
Dong, D. and Li, X.: Development of a novel parallel-spool pilot operated high-pressure solenoid valve with high flow rate and high velocity, Chin. J. Mech. Eng., 28, 369–378, https://doi.org/10.3901/CJME.2015.0104.001, 2015.
Jiang, Q., Li, X., Lu, J., and Teng, Y.: Study of Testing Methods of Low Value Friction of Pneumatic Cylinders, Machine Building and Automation, 40, 45–48, https://doi.org/10.3969/j.issn.1671-5276.2011.01.015, 2011 (in Chinese).
Li, X. and Yang, J.: Pneumatic-electric hybrid controll actuator, Chinese Patent: ZL201811208567.2, 5 June 2020 (in Chinese).
Paul, J. C. and Kenneth, J. W.: Characterization of an Electric-Pneumatic hybrid prismatic actuator, J. Mech. Robot., 2, 1–8, https://doi.org/10.1115/1.4001087, 2010.
Qi, H., Zhang, B., Zhang, N., Zhang, M., and Chen, Y.: Enhanced Lateral and Roll Stability Study for a Two-Axle Bus via Hydraulically Interconnected Suspension Tuning, SAE International Journal of Vehicle Dynamics, Stability, and NVH, 3, 5–18, https://doi.org/10.4271/10-03-01-0001, 2018.
Qi, H., Chen, Y., Zhang, N., Zhang, B., Wang, D., and Tan B.: Improvement of both handling stability and ride comfort of a vehicle via coupled hydraulically interconnected suspension and electronic controlled air spring, P. I. Mech. Eng. D-J. Aut., 234, 552–571, https://doi.org/10.1177/0954407019856538, 2020.
Rouzbeh, B. and Bone, G. M.: Position control and force allocation algorithms for hybrid Pneumatic-Electric linear actuators, in: Proceedings of the 7th International Conference of Control Systems, and Robotics, Niagara Falls, Canada, 1–3 November 2020, 137, https://doi.org/10.11159/cdsr20.137, 2020.
Saravanakumar, D., Mohan, B., and Muthuramalingam, T.: A review on recent research trends in servo pneumatic positioning systems, Precis. Eng., 49, 481–492, https://doi.org/10.1016/j.precisioneng.2017.01.014, 2017.
Shang, C., Tao, G., Zuo, H., and Meng, D.: Modeling and adaptive robust posture control of 3-rps pneumatic parallel platform, in: Proceedings of the ASME 2015 International Design Engineering Technical Conferences & Computers and Information in Engineering Conference, Boston, Massachusetts, USA, 2–5 August 2015, DETC2015-46427, https://doi.org/10.1115/DETC2015-46427, 2015.
Tan, B., Wu, Y., Zhang, N., Zhang, B., and Chen, Y.: Improvement of ride quality for patient lying in ambulance with a new hydro-pneumatic suspension, Adv. Mech. Eng., 11, 1–20, https://doi.org/10.1177/1687814019837804, 2019.
Wang, M., Zhang, B., Chen, Y., Zhang, N., and Zhang, J.: Frequency-Based Modeling of a Vehicle Fitted With Roll-Plane Hydraulically Interconnected Suspension for Ride Comfort and Experimental Validation, IEEE Access, 8, 1091–1104, https://doi.org/10.1109/ACCESS.2019.2935260, 2020.
Yang, J. and Li, X.: Study on flow characteristics and linearization of pneumatic high-velocity on-off valve, J. Phys. Conf. Ser., 1654, 012063, https://doi.org/10.1088/1742-6596/1654/1/012063, 2020.
Yang, J. and Li, X.: Research and development of a novel pneumatic-electric hybrid actuator, J. Mech. Sci. Technol., 35, 2593–2603, https://doi.org/10.1007/s12206-021-0530-3, 2021.
Zhang, J., Zhang, B., Zhang, N., Wang, C., and Chen, Y.: A novel robust event-triggered fault tolerant automatic steering control approach of autonomous land vehicles under in-vehicle network delay, Int. J. Robust Nonlin., 31, 2436–2364, https://doi.org/10.1002/rnc.5393, 2021.
Zhang, T.: Research on a pneumatic-electric composite drive actuator and its characteristics – according to the report of Shi Guanglin, associate professor of Shanghai Jiao Tong University, Hydraulics Pneumatics and Seals, 4, 98–102, 2018 (in Chinese).
Zhang, Y. and Cai, M.: Overall life cycle comprehensive assessment of pneumatic and electric actuator, Chin. J. Mech. Eng., 27, 584–594, https://doi.org/10.3901/CJME.2014.03.584, 2014.
Zong, Y., Xiang, D., and Bao, G.: The characteristics of a new type of integrated electric-pneumatic hybrid actuator, in: Proceedings of 8th International Conference on Fluid Power and Mechatronics (FPM), Wuhan, China, 10–13 April 2019, 360–370, https://doi.org/10.1109/FPM45753.2019.9035890, 2019.
- Abstract
- Introduction
- Working principle of the new PEHA and analysis of velocity fluctuation
- Analysis of the response characteristics of basic components
- Scheme of the driving switching process based on the braking characteristics
- Conclusions
- Data availability
- Author contributions
- Competing interests
- Disclaimer
- Acknowledgements
- Review statement
- References