the Creative Commons Attribution 4.0 License.
the Creative Commons Attribution 4.0 License.
 | 21 Jul 2022
Research on adaptive speed control method of an autonomous vehicle passing a speed bump on the highway based on a genetic algorithm
Long Wang
Zhiyong Yang
Xiangdong Chen
Ruixiang Zhang
Yu Zhou
When autonomous vehicles pass through uneven roads, especially the consecutive speed control humps (SCHs) on expressways, the speed of them will have a significant influence on the safety and comfort of driving. How to automatically select the most appropriate speed has become a practical research subject. This paper studies the nonlinear vibration process of the suspension system when the autonomous vehicle passes through the SCHs on a highway. Firstly, the paper establishes a four-degree-of-freedom (4-DOF) nonlinear half-vehicle model and a stimulation function of trapezoidal SCHs and then uses the Runge–Kutta method to numerically solve the differential equations of motion of the suspension system. In the next part, the paper chooses the genetic algorithm to build a multi-objective optimization problem model, which selects the vertical displacement of the vehicle body, the suspension's dynamic deflection and the dynamic load of the tire as optimization objectives and combines the method of the unified objective function to find the optimal passing speed. Finally, the paper designs and carries out the solution process of the multi-objective optimization problem for the vehicle under three scenarios, conventional passive suspension, semi-active suspension, active suspension, and compares the optimized state with the pre-optimized state to prove the effectiveness of the optimization model.
- Article
(2513 KB) - Full-text XML
- BibTeX
- EndNote


With the rapid development of sensing control and artificial intelligence technology, vehicles have shown the development trend of automation and intelligence, and the field related to autonomous driving has become a hot topic in automotive development. For autonomous vehicles, comfort is a vital factor affecting passenger evaluation (Wang et al., 2020). However, current research related to autonomous driving is mainly conducted on the premise of flat roads (Malikopoulos et al., 2016; Song et al., 2021), and there is relatively little research on the comfort of autonomous vehicles when passing through consecutive speed control humps (SCHs). Vehicle speed has a great impact on the comfort of autonomous vehicles (Du et al., 2018; Yan et al., 2021). When drivers drive over SCHs, they tend to adjust velocity based on subjective experience in order to reduce the sensation of bumping, which is not accurate enough (Jian et al., 2020).
In our previous research, based on the lightweight neural network, we realized the specific classification of SCHs by using the information obtained from the onboard camera and network, so that we can get the relevant parameters and the types of SCHs encountered during driving. As an extension of previous research, this paper selects appropriate evaluation criteria of a vehicle's comfort and safety to establish a multi-objective optimization model and studies and simulates the comfort optimization process when the vehicle passes through the SCHs. As a result, we obtain the optimal speed and related parameters and prove its effectiveness.
The 4-DOF half-vehicle model is relatively closer to the actual vehicle (Yang et al., 2014a). The model not only reflects the vertical and pitch motions of the vehicle body, but also allows the study of the deformation of front and rear wheels. The Runge–Kutta method is a high-precision single-step algorithm which is widely used in engineering to find the numerical solution of the differential equations. The paper selects the 4-DOF nonlinear vehicle model as the research's object, defines the trapezoidal SCH simulation excitation function, establishes the nonlinear differential equations of motion for the vehicle suspension and uses the fourth- to fifth-order Runge–Kutta method in MATLAB to seek its numerical solution.
A genetic algorithm (GA) is a parametric optimization method that simulates biological evolution and natural genetic principles. It has the advantages of simplicity, great generality, parallelism, and robustness and is suitable for finding optimizing solutions to complex objective functions with good capability for a global solution search, and the elite set can accelerate the convergence of the algorithm (Deng et al., 2022). GA has been widely applied in engineering for optimization solution scenarios; for example, Sun et al. (2017) optimized multiple indicators of vehicle active suspension characterization performance and achieved a better balance between ride comfort and stability through GA. Gao and Qi (2021) enhanced the vehicle ride comfort after optimization and matching of the suspension parameters by GA. However, current research on vehicle safety and comfort focuses on using GA or other intelligent algorithms to solve optimization problems considering a suspension's design parameters as variables to obtain the best vehicle suspension design parameters (Tey et al., 2016; Wang et al., 2019; Rodrigues et al., 2021) or the optimal parameters of the SCHs (Gheibollahi and Masih-Tehrani, 2021), and vehicle speed often exists as a hypothetical condition. This paper uses GA with an elitist strategy to obtain the optimal speed of an autonomous vehicle passing highway SCH to achieve the requirement of adaptive speed control in a real-world scenario.
The vehicle suspension is currently classified into passive, semi-active and active suspensions according to the different control forces. The paper uses GA to design and study the optimal speed for an autonomous vehicle passing highway SCHs in each case of these three suspensions and takes advantage of the established multi-objective optimization model to carry out experimental analysis and compare it with the pre-optimization condition to prove the effectiveness of the optimization.
The remainder of this paper is organized as follows. The second part of this paper presents the 4-DOF nonlinear half-vehicle model, the trapezoidal SCH simulation excitation function and the simulation-related parameters. In the third part, this paper constructs a multi-objective function optimization algorithm model based on GA. In the fourth part, the paper designs and carries out the specific applications of the optimization model of the three cases of passive suspension, semi-active suspension and active suspension and analyzes the optimization results. In the last part, the paper summarizes the research.
2.1 Nonlinear 4-DOF half-vehicle model
The simplified view of the 4-DOF half-vehicle model shown in Fig. 1 could be regarded as a fully symmetrical mechanical structure, mainly consisting of unsprung mass, spring, suspension and tire. The 4 degree of freedom includes front and rear wheel deformation, vertical body vibration and body pitch motion. The paper also considers the nonlinear characteristics of springs and dampers of front and rear suspension and front and rear wheels (Yang et al., 2014b).
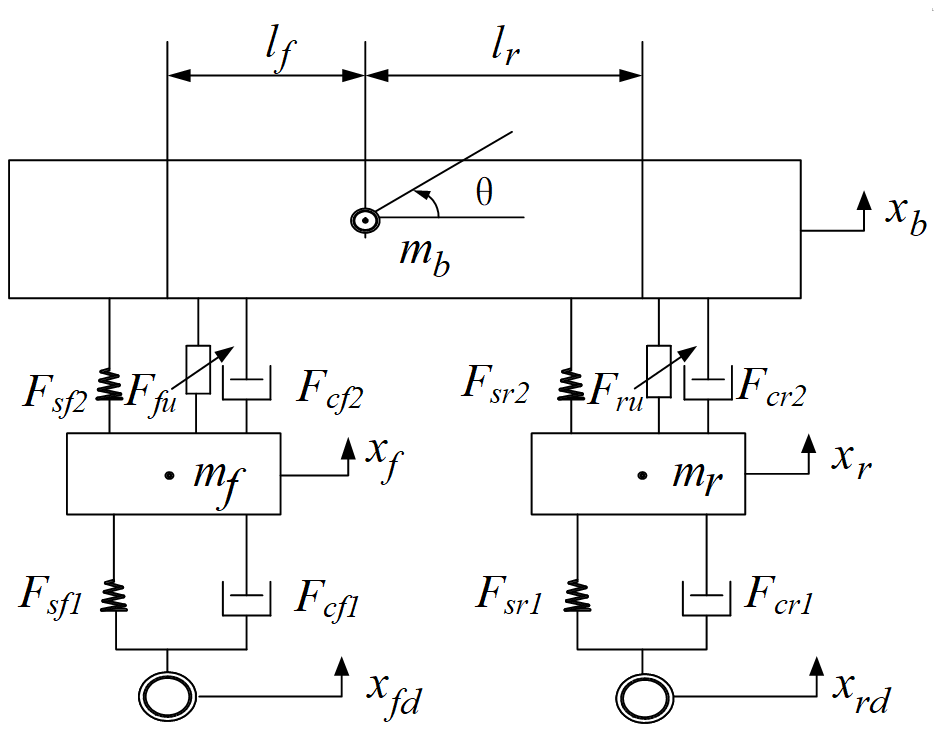
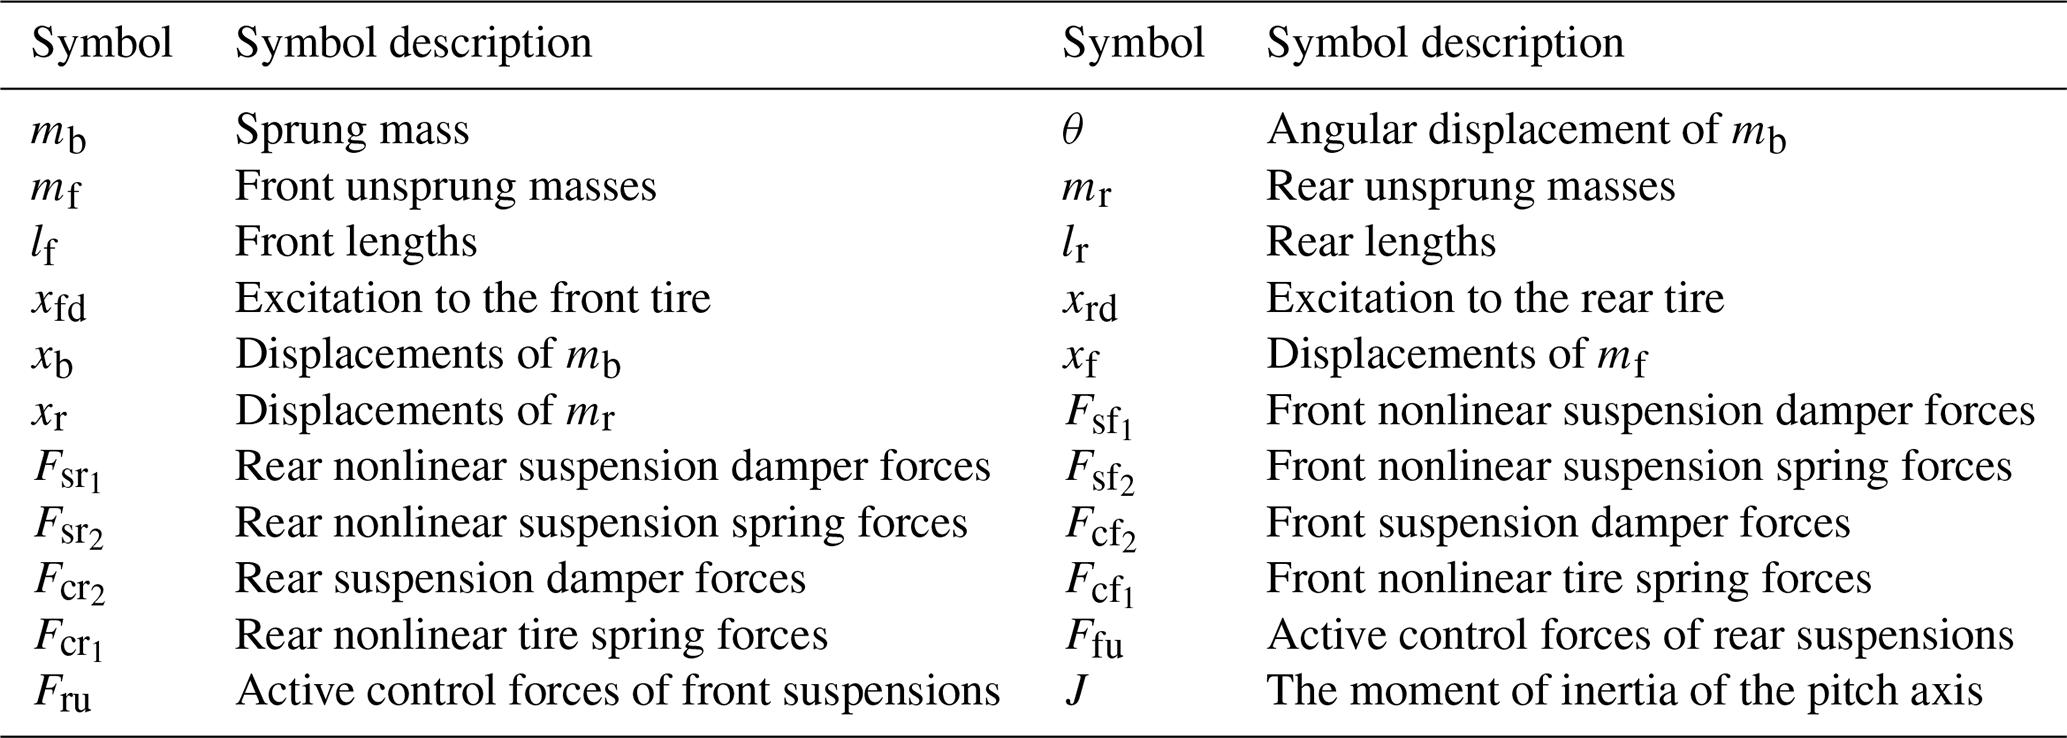
Table 1 lists the specific meanings of the symbols used in the model.
Based on Newton's second law, we obtain the following model expression:
Setting x1=xb, , x3=θ, , x5=xf, , x7=xr, , the system state equations could be shown as Eq. (2):
The paper uses the fourth- to fifth-order Runge–Kutta method to solve numerically in MATLAB. It is an adaptive step method for the solution to ordinary differential equations that uses the fourth-order method to provide candidate solutions and the fifth-order method to control errors.
2.2 Excitation function of the consecutive speed bump
Figure 2 shows a simulated view of the geometry of consecutive trapezoidal SCHs (Yang et al., 2022).
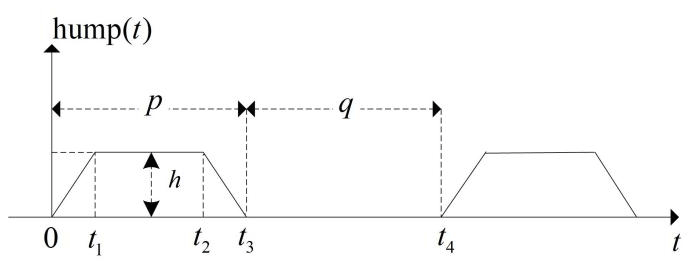
p is the length of SCHs, h is the height of SCHs, q is the distance between two adjacent SCHs and v is the vehicle's passing velocity. So, the period of SCH excitation could be presented as , and the relationship between v and excitation frequency f could be shown as follows:
The excitation shown in Fig. 2 could be presented as
Δt represents the time difference when the front and rear wheels are excited, and lf, lr represent the distance between the front and rear wheels to the center, so we can obtain
Equations (3) and (5) lead to
Considering the effect of road roughness, A is the amplitude of road roughness excitation, and froad is the frequency of road roughness excitation. Front-wheel excitation xfd and rear-wheel excitation xrd could be represented respectively as follows:
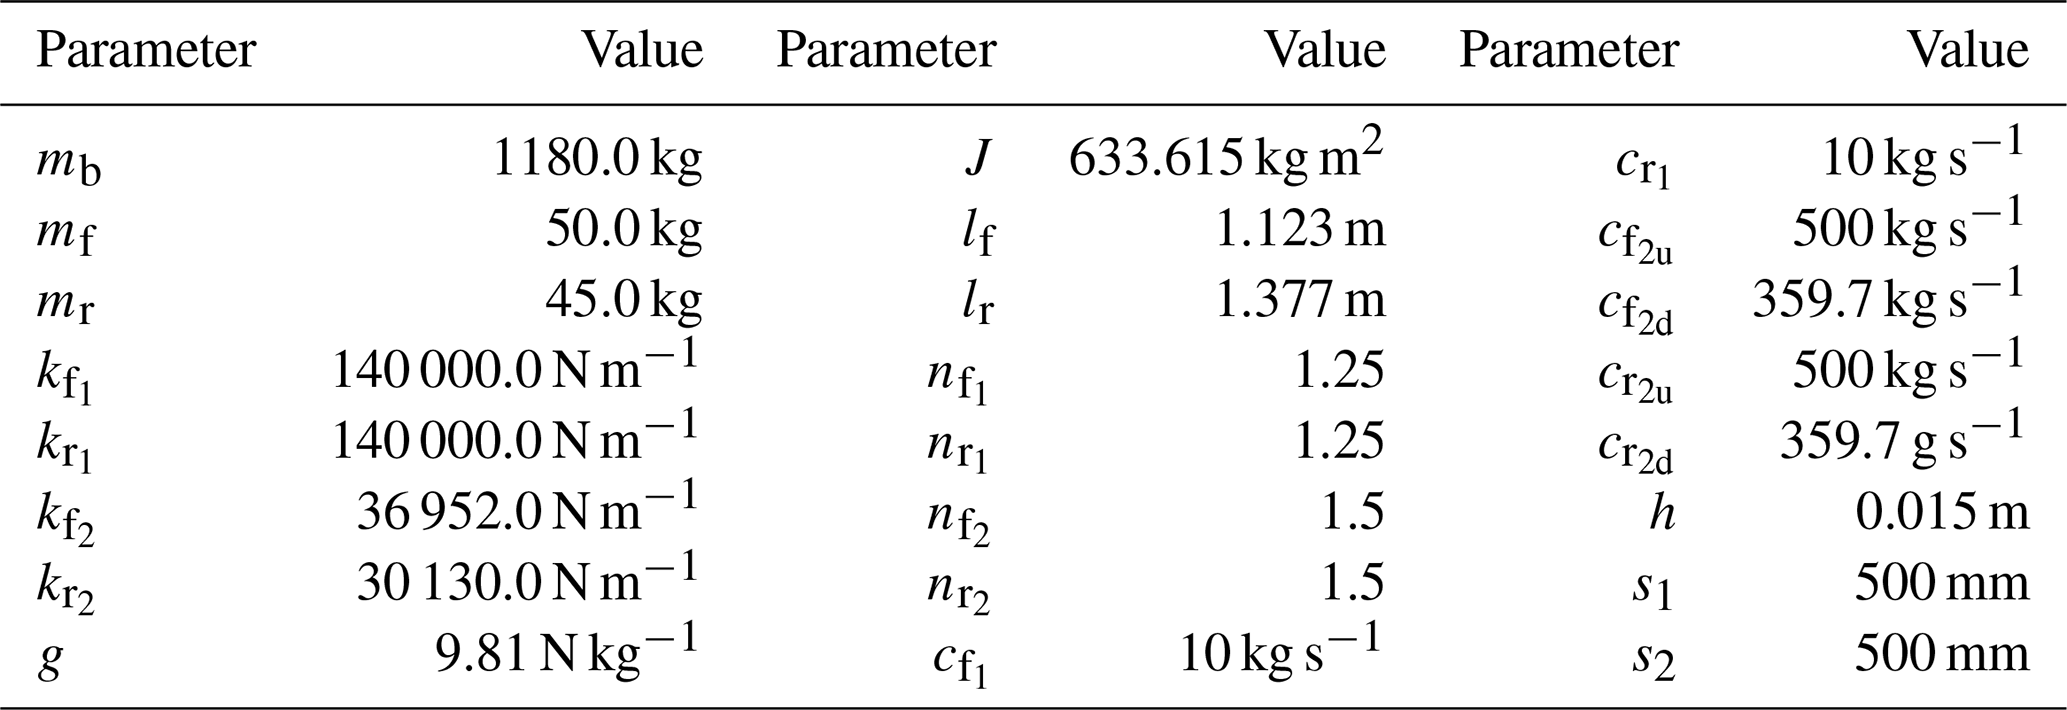
2.3 Simulation parameters
Table 2 shows the specific parameters of the simulation. We set the initial balanced simulation parameters to [] = []. According to experience, the simulation step is set to 0.02 km h−1, and the time of vehicle motion simulation is set to 120 s to ensure the accuracy of the simulation.
3.1 Determine the objective function
In order to measure the comfort of the vehicle, this paper chose the vertical displacement of the vehicle body f1 as the performance measure (Huang et al., 2015); combining Eqs. (1) and (2), we have
To evaluate the stability of operation, the paper chooses the front suspension dynamic deflection and the rear suspension dynamic deflection (Guo and Zhang, 2017), respectively, shown as follows:
To meet the requirement of safety in driving, the paper chooses the dynamic load of the tire of front wheels and the dynamic load of the rear wheels , which measures the tire's grounding performance (Liu et al., 2017) and sets the front wheel and rear wheel stiffness coefficient to , and sets the road surface excitation to the front wheel and rear wheel to xfd, xrd. The dynamic loads of the front wheel and rear wheel are presented, respectively, as
The paper uses the linear weighting method to allocate the corresponding weight according to the different importance of sub-objective functions. The sub-objective functions are multiplied by their weight values and then are added together to form a unified objective function. Root-mean-square (rms) values could reduce the impact of unexpected factors (Jiang et al., 2014), and after dimensionless processing of each sub-objective function of the optimization model, the paper can represent the objective function F as
are the weights of the corresponding items and here take approximately as examples, respectively, according to engineer experience.
This paper mainly concerns how to find the optimal values of the variable speed v, and here the paper takes an example of a decelerated road with a speed limit of 60 km h−1, which limits the constraint condition of 0 km h km h−1.
3.2 Procedure of the optimization model based on GA
Figure 3 shows the basic procedure of the optimization model based on GA. The basic idea of the GA simulates the genetic structure and behavior of the population's chromosomes. The paper chooses the inverse of the objective function F established in Sect. 3.1 as the fitness function of individuals to calculate the fitness of each individual, which means that the higher the value of fitness, the better the individual performed. According to a series of experiments and a comparison of the effect of choosing different parameters, this paper decides to set the maximum evolution number to 200. The selection operation adopts the classic roulette algorithm, which means the chromosome with a higher fitness value is more likely to be selected in the roulette so as to pass the chromosomes of more excellent individuals to the next generation. Crossover operation simulates mating between individuals, so that different genes can be randomly combined. According to the results of multiple experiments, the paper decides to set the crossover rate to 0.6. Mutation operation simulates gene mutation in nature, which inserts random genes into offspring for the sake of maintaining the diversity of the population. Based on the comparisons of parameters in many experiments, the mutation rate is set to 0.1. The selection operation keeps the good chromosome, while the crossover and mutation operation embody the global searching ability of the algorithm.
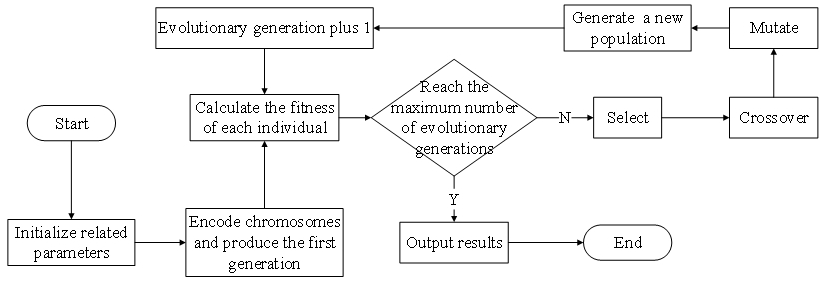
The input of this model is the initial value of speed: 40 km h−1 and the value range of relevant parameters. The model uses the elitist strategy when generating new populations, which means replacing the worst individuals of the current generation with the best individuals of the previous generation, ensuring that the genetic structure of the best individuals is not destroyed, which is also a guarantee of the convergence of the algorithm. When the number of evolutionary generations reaches the maximum number of generations, the evolutionary process ends and outputs the best individual searched so far, and the output of this model is the optimal value of speed and related parameters.
4.1 Classification of the vehicle suspension system
At present, vehicle suspension is divided into passive suspension, semi-active suspension and active suspension according to the different control forces. Figure 4 shows the structural diagram of three kinds of suspension. In Fig. 4, m1 represents sprung mass, m2 represents unsprung mass, k1, k2 represents the vibration isolation spring, c represents the damper, and u represents the actuator.

Figure 4Structure of three types of suspension. (a) Passive suspension. (b) Semi-active suspension. (c) Active suspension.
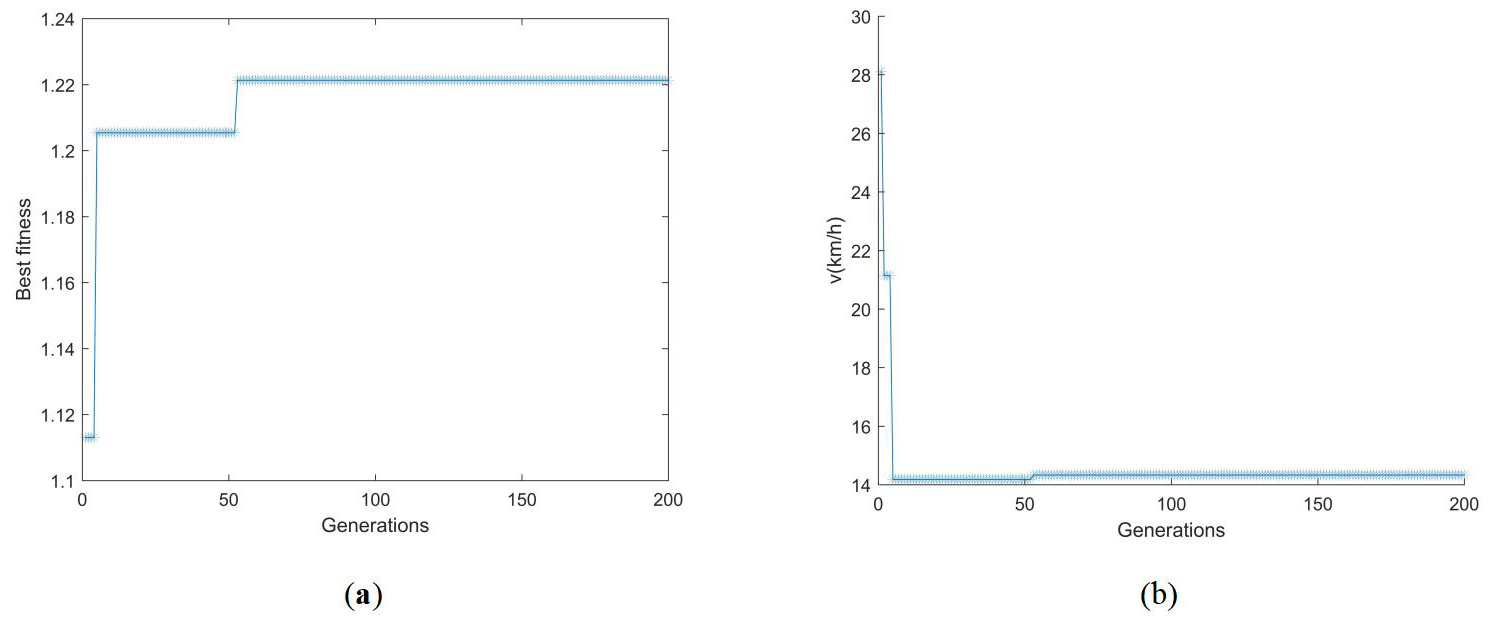
Figure 5The iterative process of each variable of the passive suspension vehicle. (a) All individuals' optimal fitness. (b) Optimal individual's v.
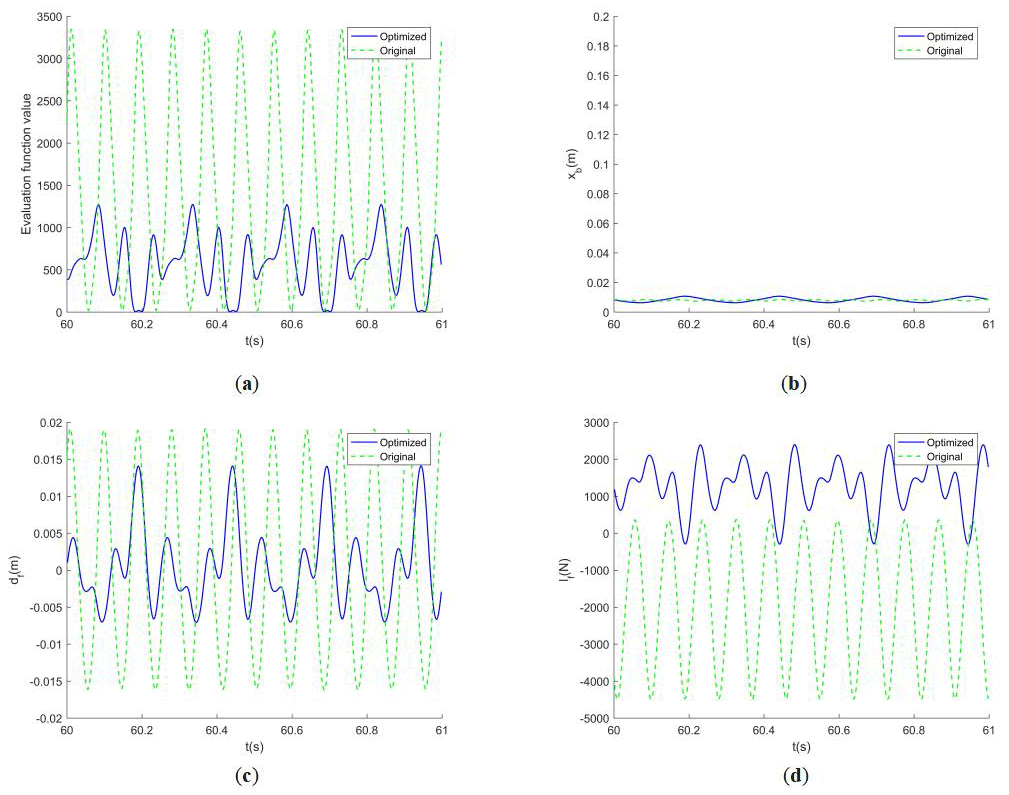
Figure 6Comparison of system response curves of each parameter of a passive suspension vehicle before and after optimization. (a) Objective function F. (b) The vehicle body's vertical displacement. (c) The front suspension's dynamic deflection. (d) The front wheel's dynamic load.
Most vehicle suspension systems are equipped with springs and shock absorbers. There is no energy supply device in the suspension system, and its elasticity and damping cannot change based on external working conditions. This kind of suspension is called passive suspension, as shown in Fig. 4a.
Semi-active suspension can be regarded as a suspension system composed of spring and shock absorber with variable characteristics, which is relatively simple, stable and with low cost (Tran et al., 2010). The damping coefficient of the semi-active suspension shock absorber is variable, and it can adjust the damping state of the shock absorber according to the parameter instructions stored in the computer under various conditions. The damping coefficient of the damper can be adjusted, as shown in Fig. 4b.
The active suspension has a direct force generator of the actuator, which could exercise the optimal feedback control according to the input and output, so that the suspension has better damping characteristics to improve the car ride and handling stability. The U shown in Fig. 4c represents the actuator that can produce the active control force.
4.2 Multi-objective optimization model in passive suspension vehicles passing the SCHs
For the traditional passive suspension, the design variable of the optimization model only needs to include the speed v, and the constraint condition is set to 0 km h km h−1. After the experiment of the optimization model established in Sect. 3, the optimal individual's v of the population after 200 generations of evolution is 14.33 km h−1, and the optimal fitness is stable at 1.2213.
Figure 5 shows that the optimal fitness reached a stable state roughly between 40 and 60 generations, and v also reached an optimal value roughly between 40 and 60 generations.
We draw the response curves of various parameters of the vehicle suspension system when it enters the steady state and compare them with the response curves before optimization.
The vehicle speed before the optimization is 40 km h−1, while it becomes 14.33 km h−1 after optimization. According to Fig. 6, while the vertical displacement of the body has little difference, the objective function value, the system response value of the dynamic deflection of the suspension and the dynamic load of the wheel after optimization are significantly lower than those before optimization, which proves the effectiveness of the optimization model.
4.3 Multi-objective optimization model in semi-active suspension vehicles passing the SCHs
For the semi-active suspension, the design variables of the optimization model need to include the vehicle speed v, the front suspension damping coefficient and the rear suspension damping coefficient . The constraint conditions are 0 km h km h−1, 0 kg s 2000, 0 kg s kg s−1. After the experiment of the optimization model in the third part, the optimal fitness of the optimal individual after the 200 generation evolutionary is 1.2361, v is 15.20 km h−1, is 1823 kg s−1, and is 1372 kg s−1.
Figure 7 shows that the optimal fitness reaches a stable state between 140 and 160 generations, v reaches the optimal value between 60 and 80 generations, converges between 100 and 120 generations, and remains unchanged between 100 and 120 generations.
We draw the system response curve of various parameters of the vehicle suspension system when entering the steady state and compare it with the response curve before optimization.
The vehicle speed before the optimization is 40 km h−1, and the speed after optimization is 15.20 km h−1. According to Fig. 8, while the vertical displacement of the vehicle body has little difference, the value of the objective function, the system response value of suspension dynamic deflection and wheel dynamic load after optimization are obviously lower than those before optimization, which proves the effectiveness of the optimization model.
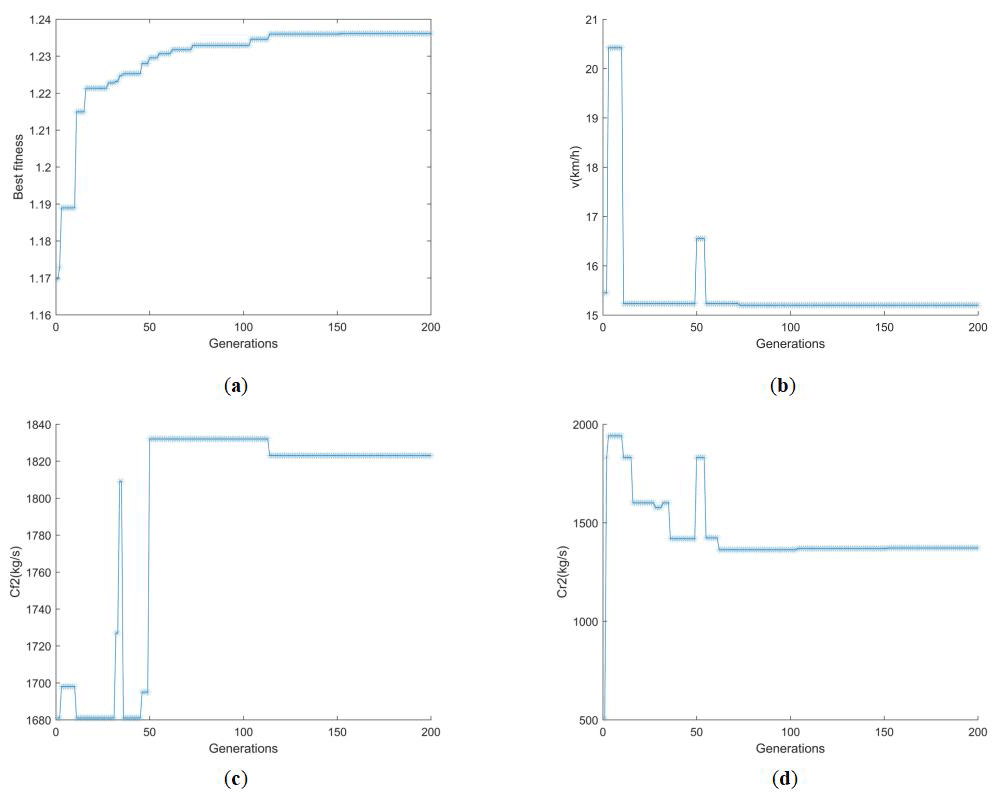
Figure 7The iterative process of each variable of the semi-active suspension vehicle. (a) All individuals' optimal fitness. (b) Optimal individual's v. (c) Optimal individual's . (d) Optimal individual's .
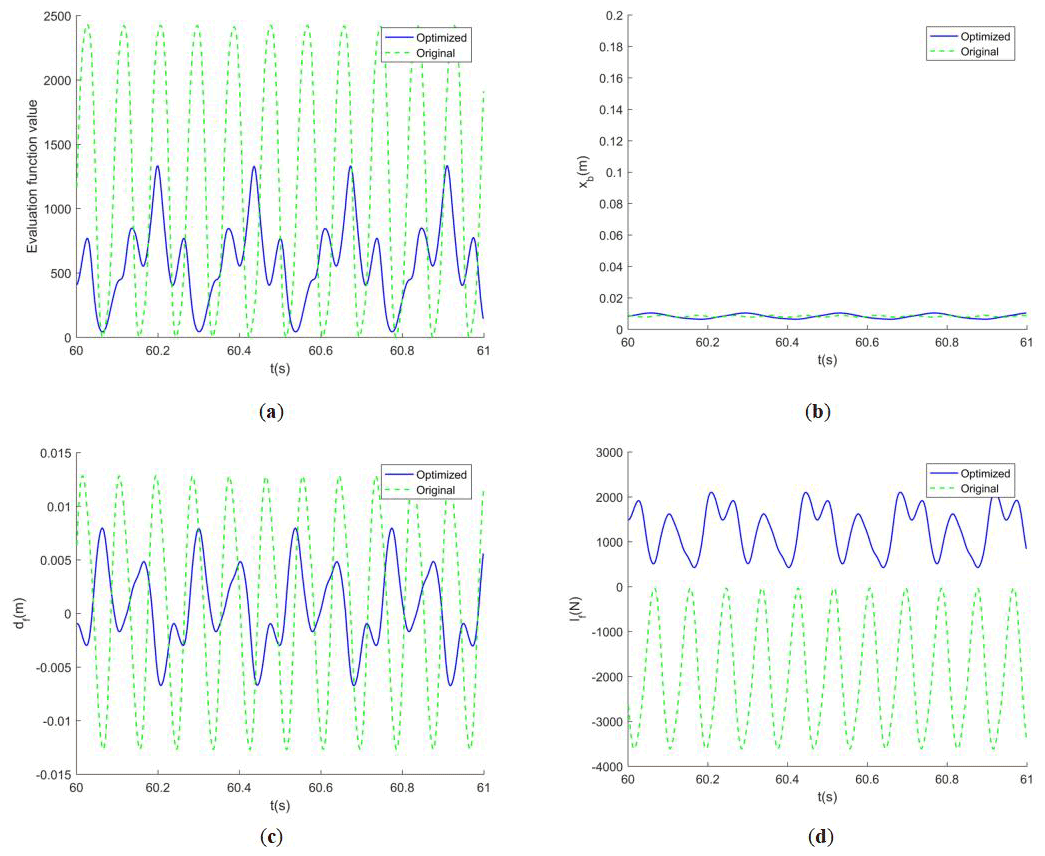
Figure 8Comparison of system response curves of each parameter of the semi-active suspension vehicle before and after optimization. (a) Objective function F. (b) The vehicle body's vertical displacement. (c) The front suspension's dynamic deflection. (d) The front wheel's dynamic load.
4.4 Multi-objective optimization model in active suspension vehicles passing the SCHs
For the active suspension, the design variables of the optimization model need to include the vehicle speed v, the front suspension active control force Ffu and the rear suspension active control force Fru. The constraint conditions are set to 0 km h km h−1, −2000 N < Ffu≤2000, −2000 N < Fru≤2000 N. After the experiment of the optimization model in the third part, the optimal individual v after the 200 generations' evolutionary is 14.72 km h−1, Ffu is 1982 N, and Fru is 1047 N.
Figure 9 shows that the optimal fitness reaches a stable state between 120 and 140 generations, and v reaches the optimal value between 20 and 40 generations, Ffu converges roughly between 120 and 140 generations, and Fru begins to remain stable between 120 and 140 generations.
We draw the system response curve of various parameters of the vehicle suspension system when entering the steady state and compare it with the response curve before optimization.
The vehicle speed before the optimization is 40 km h−1, and the speed after optimization is 14.72 km h−1. From Fig. 10, we can see that the objective function value, the system response values of suspension dynamic deflection and wheel dynamic load after optimization are significantly lower than those before optimization, which proves the effectiveness of the optimization model.
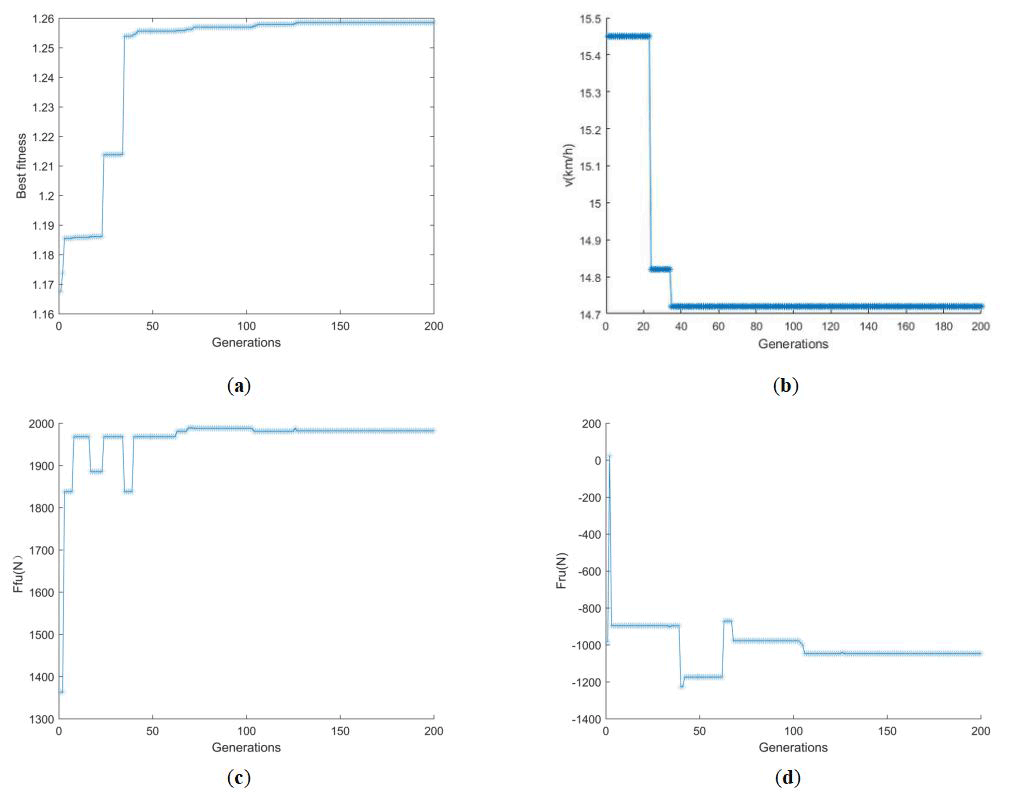
Figure 9The iterative process of each variable of the active suspension vehicle. (a) All individuals' optimal fitness. (b) Optimal individual's v. (c) Optimal individual's Ffu. (d) Optimal individual's Fru.

Figure 10Comparison of system response curves of each parameter of the active suspension vehicle before and after optimization. (a) Objective function F. (b) The vehicle body's vertical displacement. (c) The front suspension's dynamic deflection. (d) The front wheel's dynamic load.
4.5 Comparison and analysis of optimal results of three types of suspension
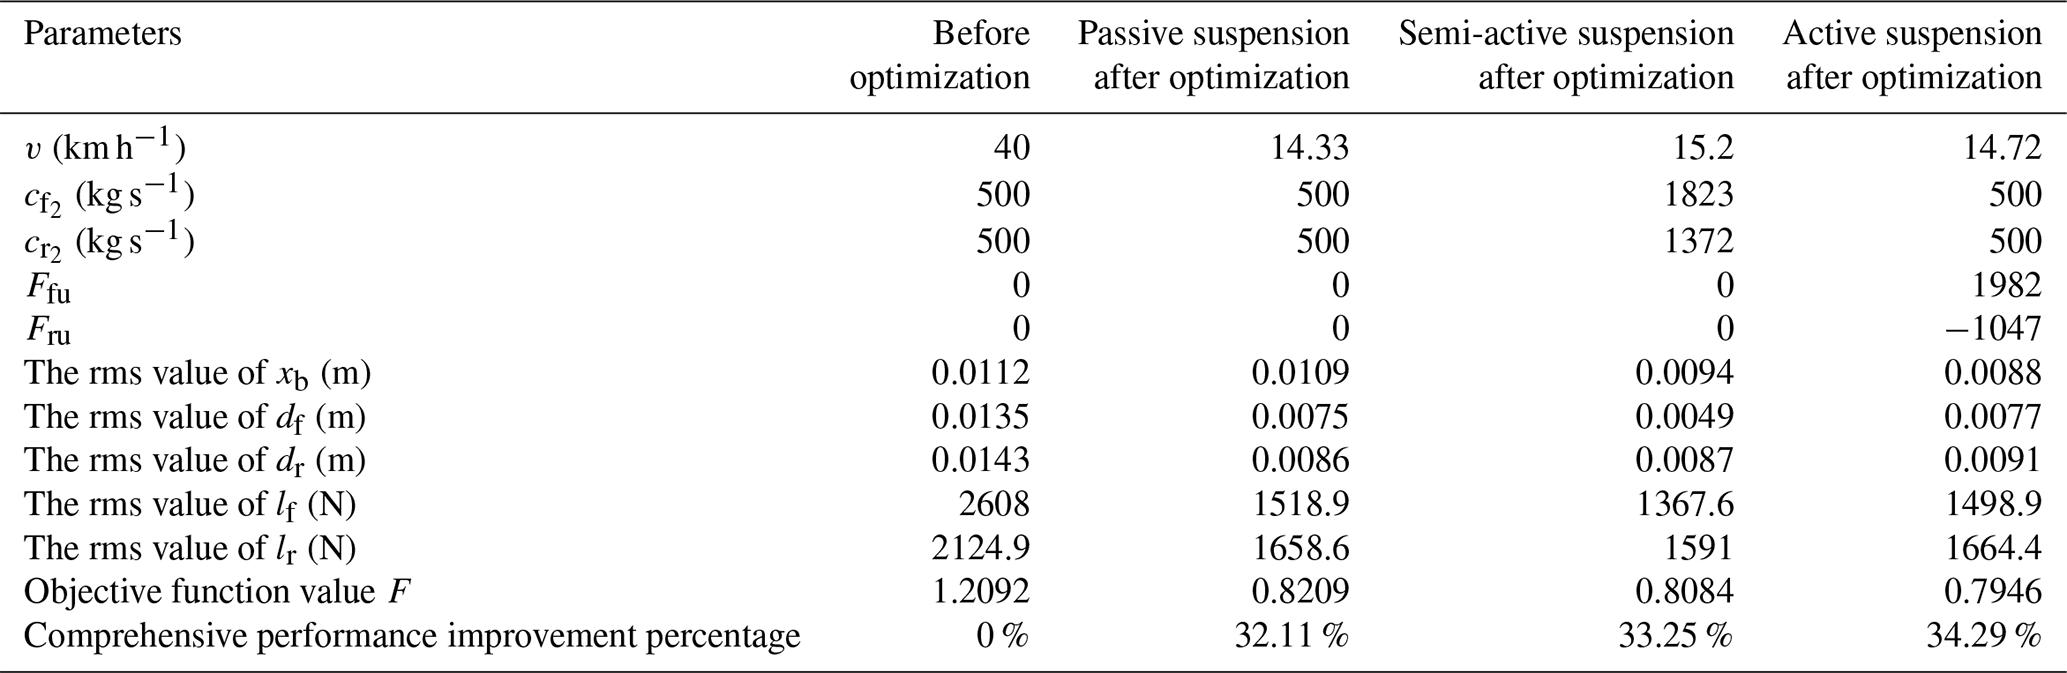
By analyzing Table 3, we can find that, after using the optimization model, three suspension systems obtain the optimal passing speed and relevant parameter values. Compared with those before optimization, the indexes of vehicle safety and comfort have been significantly improved, and the optimization degree of active suspension is the most obvious, followed by semi-active suspension, and the optimization effect of passive suspension is relatively the lowest.
Table 3Comparison of optimal results of three types of suspension.
In this paper, by establishing a multi-objective optimization model based on GA with the elitist strategy and selecting the vertical displacement of the vehicle body, the dynamic deflection of the suspension and the dynamic load of the wheels as the optimization objectives, carrying out the optimization experiment to seek the optimal speed and related design variables for the nonlinear 4-DOF half-car model under the simulated excitation function of trapezoidal SCHs, we could obtain the conclusions as follows.
- i.
The vehicles with the passive suspension, semi-active suspension or active suspension could get the optimal speed of passing through the SCHs on a highway by the multi-objective optimization model presented in the paper.
- ii.
In addition to the speed-adaptive control, the semi-active suspension can also adjust the damper damping coefficient according to the optimization model, and the active suspension can adjust the active control force. Both of them could further improve vehicle safety and comfort.
- iii.
After the optimization of the three types of the suspension system, the safety and comfort of vehicles have been significantly improved. After the optimization and adjustment of the model, the comprehensive performance of safety and comfort of active suspension is best, followed by the semi-active suspension vehicle, and the passive suspension's comprehensive performance is relatively the lowest. The comprehensive performance improvement percentage are, respectively, 34.29 %, 33.25 % and 32.11 %.
When the autonomous vehicle passes through the SCHs, the central processing system of the vehicle can get the specification of the SCHs by using the information obtained from the onboard camera and network (Yun et al., 2019). Then the central processing system informs the telex system of the pre-stored corresponding optimal speed and relevant parameters according to the specification of the SCHs. The telex system controls the mechanical device according to the signal and controls the vehicle to take corresponding actions so as to achieve the best balance between comfort and safety when passing through the SCHs.
The conclusion can provide an effective solution for the adaptive speed regulation of autonomous vehicles passing the highway SCHs and also provide a certain theoretical reference for the research of a vehicle's safety and comfort. In the follow-up, further verification and scheme optimization can be carried out through real-vehicle experiments. What is more, adding more constraints and objective functions to the optimization model during further research can make the design of the optimization model closer to the actual situation.
Most the data used in this article can be made available upon reasonable request. Please contact the first author (zyy@cqvie.edu.cn).
LW and ZY proposed and developed the overall concept of the paper. LW, ZY and YZ conducted the experimental realization and analysis. LW, XC and RZ wrote the whole paper.
The contact author has declared that none of the authors has any competing interests.
Publisher’s note: Copernicus Publications remains neutral with regard to jurisdictional claims in published maps and institutional affiliations.
The author is very grateful to the anonymous commentators for their valuable suggestions, the Fundamental Research Funds for the Program for Innovation Research Groups at Institutions of Higher Education in Chongqing (CXQT21032), the Fundamental Research Funds for the Science and Technology Research Project of Chongqing Municipal Education Commission, China (KJQN201903402), and the Fundamental Research Funds for the Natural Science Foundation of Chongqing, China (cstc2021ycjh-bgzxm0088) for support.
This research has been supported by the Chongqing Municipal Education Commission, the Fundamental Research Funds for the Science and Technology Research Project of Chongqing Municipal Education Commission, China (grant no. KJQN201903402) and the Chongqing Academy of Science and Technology, the Fundamental Research Funds for the Program for Innovation Research Groups at Institutions of Higher Education in Chongqing (grant no. CXQT21032) and the Fundamental Research Funds for the Natural Science Foundation of Chongqing, China (grant no. cstc2021ycjh-bgzxm0088).
This paper was edited by Daniel Condurache and reviewed by three anonymous referees.
Deng, M., Wu, Z., Yao, Z., and Chen, Y.: Unmanned Aerial Vehicle Jamming Resource Scheduling Based on Parallel Genetic Algorithm with Elite Set, J. Electron. Inf. Techn., 44, 2158–2165, https://doi.org/10.11999/JEIT210349, 2022.
Du, Y., Liu, C., and Li, Y.: Velocity Control Strategies to Improve Automated Vehicle Driving Comfort, IEEE Intell. Transp. Syst. Mag., 10, 8–18, https://doi.org/10.1109/MITS.2017.2776148, 2018.
Gao, J. and Qi, X.: Study of Suspension Parameters Matching to Enhance Vehicle Ride Comfort on Bump Road, Shock. Vib., 2021, 1–20, https://doi.org/10.1155/2021/5806444, 2021.
Gheibollahi, H. and Masih-Tehrani, M.: Optimal Speed Control Humps Design Based on Driver Comfort, Int. J. Automot. Mech. Eng., 18, 8941–8958, https://doi.org/10.15282/ijame.18.3.2021.08.0685, 2021.
Guo, P. and Zhang, J.: Numerical model and multi-objective optimization analysis of vehicle vibration, J. Zhejiang Univ.-Sc. A., 18, 393–412, https://doi.org/10.1631/jzus.A1600124, 2017.
Huang, Y., Na, J., Gao, G., Wu, X., and Guo, Y.: Robust adaptive control for vehicle active suspension systems with uncertain dynamics, in: Proceedings of the 34th Chinese Control Conference, Hangzhou, China, 28–30 July 2015, 8033–8038, https://doi.org/10.1109/ChiCC.2015.7260917, 2015.
Jiang, C., Yu, S., Xie, H., and Li, B.: Interval Uncertain Optimization of Vehicle Suspension for Ride Comfort, Comput. Model Eng. Sci., 98, 443–467, https://doi.org/10.1016/j.sandf.2014.02.015, 2014.
Jian, W., Zhou, H., and Liu Z., and Gu, M.: Ride Comfort Optimization via Speed Planning and Preview Semi-Active Suspension Control for Autonomous Vehicles on Uneven Roads, IEEE Trans. Veh. Technol., 99, 1–1, https://doi.org/10.1109/TVT.2020.2996681, 2020.
Liu, M., Gu, F., and Zhang, Y.: Ride Comfort Optimization of In-Wheel-Motor Electric Vehicles with In-Wheel Vibration Absorbers, Energies, 10, 1647, https://doi.org/10.3390/en10101647, 2017.
Malikopoulos, A., Hong, S., Park, B., Lee, J., and Ryu, S.: Optimal Control for Speed Harmonization of Automated Vehicles, IEEE Trans. Intell. Transp. Syst., 20, 2405–241, https://doi.org/10.48550/arXiv.1611.04647, 2016.
Rodrigues Moreira Resende da Silva, R., Lucas Reinaldo, I., Pinheiro Montenegro, D., Simão Rodrigues, G., and Dias Rossi Lopes, E.: Optimization of vehicle suspension parameters based on ride comfort and stability requirements, P. I. Mech. Eng. D-J. Aut., 235, 1920–1929, https://doi.org/10.1177/0954407020983057, 2021.
Song, M., Li, A., and Liu, L.: Speed control of vehicle automatic driving system based on 5G vehicle network, Int. J. Veh. Des., 86, 71, https://doi.org/10.1504/IJVD.2021.122253, 2021.
Sun, W., Li, Y., Huang, J., and Zhang N.: Efficiency improvement of vehicle active suspension based on multi-objective integrated optimization, J. Vib. Control, 23, 539–554, https://doi.org/10.1177/1077546315581731, 2017.
Tey, J., Ramli, R., and Abdullah, A.: A new multi-objective optimization method for full-vehicle suspension systems., P. I. Mech. Eng. D-J. Aut., 230, 1443–1458, https://doi.org/10.1177/0954407015611522, 2016.
Tran, G. Q. B., Pham, T. P., Sename, O., Costa, E., and Gaspar, P.: Integrated Comfort-Adaptive Cruise and Semi-Active Suspension Control for an Autonomous Vehicle: An LPV Approach, Electron., 10, 813, https://doi.org/10.3390/electronics10070813, 2010.
Wang, C., Zhao, X., Fu, R., and Li, Z.: Research on the Comfort of Vehicle Passengers Considering the Vehicle Motion State and Passenger Physiological Characteristics: Improving the Passenger Comfort of Autonomous Vehicles, Int. J. Environ. Res. Public Health., 17, 6821, https://doi.org/10.3390/ijerph17186821, 2020.
Wang, W., Niu, M., and Song, Y.: Integrated Vibration Control of In-Wheel Motor-Suspensions Coupling System via Dynamics Parameter Optimization, Shock Vib., 2019, 1–14, https://doi.org/10.1155/2019/3702919, 2019.
Yang, Z., Liang, S., Sun, Y., and Zhu, Q.: Chaotic vibration and control in nonlinear half-vehicle suspension under consecutive humps excitation, ICAMechS, 2014, 95–98, https://doi.org/10.1109/ICAMechS.2014.6911630, 2014a.
Yang, Z., Liang, S., Zhu, Q., Zhou, T., and Zeng, C.: Chaotic Vibration and Comfort Analysis of Nonlinear Full-Vehicle Model Excited by Consecutive Speed Control Humps, J. Math. Probl. Eng., 2014, 1–9, https://doi.org/10.1155/2014/370634, 2014b.
Yang, Z., Wang, L., Liu, F., and Li, Z.: Nonlinear dynamic analysis of constant-speed and variable-speed of autonomous vehicle passing uneven road., J. Vibroengineering, 24, 726–744, https://doi.org/10.21595/jve.2022.22250, 2022.
Yan, S., Liu, C., and Cao, J.: Comfort-Based Trajectory and Velocity Planning for Automated Vehicles Considering Road Conditions, Int. J. Automot. Technol., 22, 883–893, https://doi.org/10.1007/s12239-021-0080-9, 2021.
Yun, H., Kim, T., and Park, T.: Speed-Bump Detection for Autonomous Vehicles by Lidar and Camera, J. Electr. Eng. Technol., 14, 2155–2162, https://doi.org/10.1007/s42835-019-00225-7, 2019.