the Creative Commons Attribution 4.0 License.
the Creative Commons Attribution 4.0 License.
Research on automated guided vehicle (AGV) path tracking control based on laser simultaneous localization and mapping (SLAM)
Wei Wang
Zhenhao Bao
Jiqiang Zheng
Tianbo Wang
In recent years, the application of automated guided vehicles (AGVs) in the industrial field has been increasing, and the demand for their path planning and tracking has become more and more urgent. This study aims to improve the effectiveness of AGV path planning and path-tracking control and to design a comprehensive hardware and software system in combination with the Robot Operating System (ROS) to improve the practicality of the system. First, the real-time performance and accuracy of path planning by optimizing window size and dynamic adjustment strategies are improved. Secondly, the research on the fusion of the improved particle swarm algorithm and PID (proportional, integral, differential) control applied to path tracking is discussed in depth. By combining the two organically, the accuracy and robustness of AGV path tracking in complex environments are improved. In the hardware and software system design phase, the ROS provides a more flexible and modular solution for the AGV system, and the introduction of ROS not only simplifies the integration of system components, but also provides a convenient framework for future system upgrades and expansions. In the experimental phase, the methodology adopted in the study is described in detail, and the superior performance of the improved method over the traditional method is demonstrated. The experimental results not only confirm the effectiveness of the improved method in improving path planning and path-tracking accuracy, but also provide strong support for the active role of the ROS in AGV system design.
- Article
(5175 KB) - Full-text XML
- BibTeX
- EndNote
As automated guided vehicles (AGVs) are widely used in industrial environments, real-time and accurate localization and map construction become the key to ensuring their safe and efficient operation. Laser SLAM (simultaneous localization and mapping) technology has attracted much attention because of its excellent performance in complex environments. This chapter discusses the principle, application, and key role of laser SLAM in AGV path planning and control.
1.1 AGV modeling
1.1.1 AGV kinematic modeling
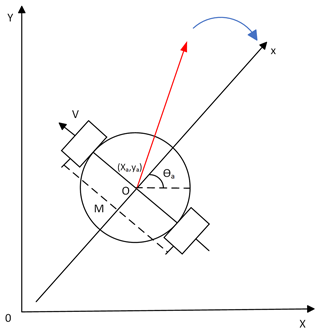
When exploring the navigation and control of automated guided vehicles (AGVs), researchers usually use a simplified two-dimensional planar motion model (Wang et al., 2023). This model focuses on the movement of the AGV in the horizontal plane and only considers its displacement changes in the lateral and longitudinal directions while omitting motion considerations in the vertical direction (Peng et al., 2024). The AGV kinematic model in this paper is shown in Fig. 1.
The longitudinal position, lateral position and angle of the automated guided vehicle can be described as in Eq. (1) below.
where (xa,ya) is the AGV center point, r the radius of the AGV body, ω the angular velocity, v the linear velocity, and θa the angle between horizontal direction and AGV direction.
Hence, is the state of the robot and M the distance between the two wheels of the AGV.
We can derive the nonlinear kinematics used in the differential-drive two-wheeled automated guided vehicle in Eq. (2).
1.1.2 TF coordinate system transformations
The transformation framework (TF) is a library for performing coordinate transformations in the Robot Operating System (ROS). The TF library provides basic matrix calculations for coordinate transformations as well as a publisher–subscriber communication mechanism for transforming points, vectors, and transformations between different coordinate systems (Yan, 2024). The purpose of coordinate transformations during robot motion is to consistently characterize the current position of the robot in different coordinate systems so that the robot's position information can be applied to the entire map. The position information obtained from the sensors is usually in the sensor's coordinate system, and the introduction of coordinate transformations helps to consistently describe the robot's position and orientation in different reference systems, thus improving the flexibility and accuracy of robot control and navigation in ROSs.
Suppose that at moment t, the coordinates of the feature point obtained by the automated guided vehicle (AGV) under the map coordinate system are and the basis of its linear space is . Meanwhile, the coordinates of the same feature point under the sensor coordinate system are , and the basis of its linear space is . Then, the following can be obtained according to the definition of coordinate transformation:
Move the base, , of the linear space under the map coordinate system to the right as follows:
where R is the rotation matrix and is orthogonal.
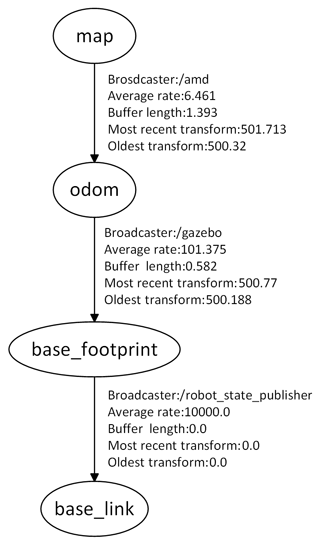
In the Robot Operating System (ROS), the transformation framework (TF) builds a system for coordinate transformations, which establishes the specification and architecture of coordinate transformations. In this system, each coordinate system is assigned a superordinate coordinate system and can have multiple subordinate coordinate systems. The TF is responsible for managing the transformation relationships between all coordinate systems within the system and is able to dynamically construct and update transformations between superordinate and subordinate coordinate systems. Using the visualization software rqt, users can easily view the TF tree built in the simulation environment to better understand and debug the relationships of coordinate transformations in the ROS as shown in Fig. 2 (P. et al., 2023).
The odometry coordinate system plays a crucial role in revealing detailed information about the spatial layout of the entire environment. By utilizing the coordinate transformation framework (TF), the odometry coordinate system is able to publish the position estimation data collected through the odometers, which are essential for accurately tracking the robot's trajectory. Furthermore, the base_link coordinate system represents the core part of the robot, while the base_footprint coordinate system is an abstract coordinate system usually located at the bottom center point of the robot. The introduction of this virtual coordinate system greatly simplifies the processing of collision detection and other related tasks, thus improving the efficiency and safety of robot operation. These coordinate systems are related to each other through TF coordinate transformations, forming a coordinate system for the robot in the environment, which provides accurate spatial references for navigation, perception, and control, enabling the robot to move and localize accurately in complex environments (Xue et al., 2023).
1.1.3 Lidar model
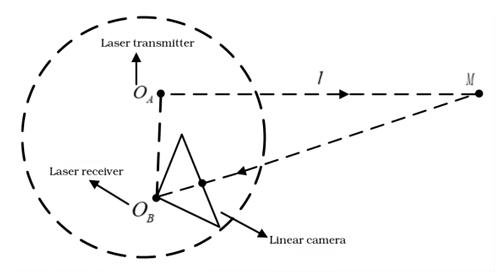
Lidar is a key sensor that can be used to acquire position data. The ranging mechanism of this sensor is based on two main principles: triangulation and time-of-flight (TOF) techniques. The triangulation method is suitable for some specific applications due to its high accuracy at medium to close ranges and relatively low cost. On the other hand, the TOF technique offers a wide range of ranging capabilities, high-accuracy distance measurements, and strong anti-jamming properties, which makes it useful in more diverse environmental conditions. In this paper, triangulation is chosen to be the type of ranging, taking full account of its advantages in medium- and short-range applications, and its principle is shown in Fig. 3.
In Fig. 3, l is the distance between the lidar and the detected object, M the detected object, OA the transmitter of the lidar, and OB the laser receiver.
1.1.4 Odometer model
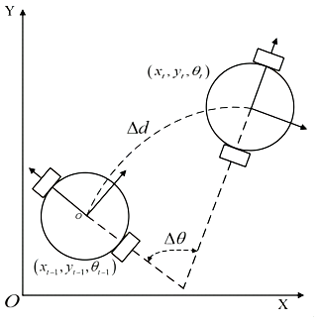
Odometry is a technique used to measure the position and orientation of a robot or vehicle. Odometry models typically involve calculating the transition from a known position on the robot or vehicle to the current position. The model takes into account a variety of sensor data, such as wheel speed encoders, gyroscopes, and accelerometers to estimate the change in position of the vehicle or robot in its frame of reference. Automated guided vehicles (AGVs) are usually fitted with wheel encoders on each wheel and these encoders are responsible for measuring the odometer data. A schematic of the odometer model is shown in Fig. 4. By monitoring the rotation of the wheels, the odometer is able to calculate the displacement and orientation changes of the robot during motion, providing important data for robot localization in space (Yu et al., 2023). This multi-sensor fusion can improve the accuracy and robustness of localization, enabling the robot to sense and understand its surroundings more accurately.
In Fig. 4, is AGV's position at moment t−1, is AGV's position at moment t, Δd is the amount of displacement in a given direction, and Δθ is the amount of change in the heading angle.
1.2 Brief description of the SLAM working principle
Autonomous mobile robots solve three major problems: where am I, where am I going, and how do I get there, i.e., robot localization, mapping, and path planning. These three are closely related: localization requires maps, mapping requires accurate positioning, and path planning must have accurate positioning and maps. SLAM technology can solve the robot localization and mapping problems well (Michał et al., 2023).
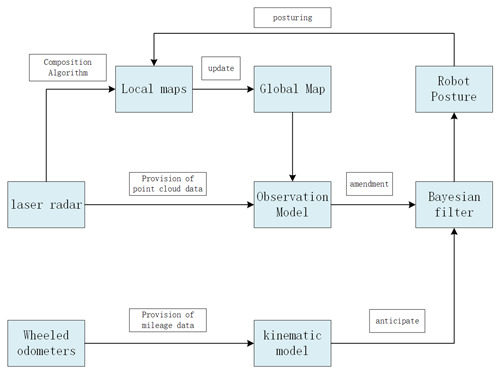
SLAM is synchronized localization and mapping technology, which mainly includes two parts: localization and mapping. Localization means that the robot, through its own sensors (lidar, depth camera, or IMU), can obtain information about the surrounding environment with the system known map correlation matching and then, in the process of continuous movement, calculate its own accurate position information; mapping means that the robot builds and updates the map based on its own position and the information of the surrounding environment during the process of movement (Sun et al., 2024). The working principle is shown in Fig. 5.
As shown in Fig. 5, SLAM technology firstly utilizes the wheel odometer carried by the robot itself to obtain the four-wheel mileage information of the robot and inputs the odometer information into the kinematic model to predict the current position information on the robot X1. Secondly, the lidar carried by the robot itself continuously obtains the information of the robot's surroundings and, at the same time, matches the obtained laser point cloud information with the known global map to calculate the more accurate position information on the robot. The robot's more accurate position information is labeled X2; then, X2 is used to correct X1, which leads to the robot's accurate position information, X3. The local map is then constructed using the X3 position information and the composition algorithm; finally, the local map is loaded into the global map and updated (Hu et al., 2024).
1.3 AGV positioning algorithm
1.3.1 Monte Carlo particle filtering
Monte Carlo localization (MCL) is a state estimation method for nonlinear and non-Gaussian noise systems. It represents the likelihood of an automated guided vehicle (AGV) being at each point by randomly distributing a set of particles on an environmental map and assigning each particle a corresponding probability density based on the sensor data. The MCL algorithm achieves continuous tracking of the AGV's position by constantly updating the weights and positions of these particles. This approach is able to handle uncertainty information and shows strong robustness in the presence of imperfect sensor data (Wang et al., 2024). This method is suitable for both global and local localization, enabling the robot to achieve efficient and accurate self-localization in different environments.
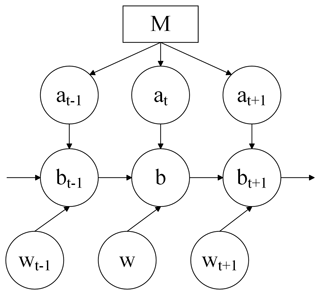
The Monte Carlo localization process is shown in Fig. 6.
In the figure, b is the vehicle's position, w the control volume, a the observed volume of the lidar, and M the known a priori map.
The Monte Carlo method is a powerful computational technique that focuses on solving physical and mathematical problems by modeling stochastic processes. The core of this method lies in the use of state equations combined with a priori knowledge of probability as a means to derive probability distributions for state variables. Specifically, the Monte Carlo method first randomly generates a series of observable particles that represent possible states or solutions.
Subsequently, the method determines the weight of each particle by comparing the observed data of these particles with the actual observations. This step is performed based on the consistency between the observed data and the actual data. Each particle is assigned a different weight based on its proximity to the actual observations, with particles with higher weights representing more likely states or solutions.
Next, the Monte Carlo method represents the current state by randomly selecting particles from the particle population. This random selection process takes into account the weights of each particle and is therefore more likely to select particles with higher weights. In this way, the Monte Carlo algorithm is able to track and update the localization state efficiently.
The process is iterative, meaning that it repeats itself over and over again, with each iteration updating the weights of the particles based on new observations and re-selecting the particles that represent the current state. As the iterations proceed, the Monte Carlo algorithm is able to gradually approximate the true solution of the problem, providing accurate probability distribution estimates of the state variables (Yang and Ni, 2023).
Overall, the Monte Carlo method is a computational method based on stochastic simulation, which effectively solves various complex physical and mathematical problems by combining state equations and prior probability knowledge along with iteratively updating particle weights and selection processes.
The model of the Monte Carlo algorithm is defined as follows. The kinematic model is defined as
where wt, bt, and yt denote the control variables, state variables, and motion noise at moment t, respectively; bt−1 denotes the state variable at moment t−1; and f is the state transition function of the robot. The observation model is defined as
In the equation, It, ct, and bt denote the observed variables, observation noise, and state variables of the system at moment t, respectively, and k is the measurement function of the robot observation.
Combining Eqs. (5) and (6), the main goal of the Monte Carlo localization algorithm is to estimate the current robot position on a known map of the environment using state information and observations from the previous moment. The algorithm continuously optimizes the estimation of the robot's position using a discrete set of particles to characterize the potential position of the robot and updating the state of these particles with the help of probabilistic methods (Li et al., 2022). By resampling the particles, the Monte Carlo algorithm is able to derive the posterior distribution of the state variables.
The specific steps of the Monte Carlo algorithm include initialization, updating particles, calculating weights, and resampling. A key step in the Monte Carlo localization algorithm is resampling, which aims to maintain the stability and accuracy of the algorithm when the number of valid particles decreases after several iterations of sampling. During resampling, particles are selected based on their weights, and particles with higher weights have a higher probability of being selected, which helps to prevent the phenomenon of particle degradation due to the reduction of effective particles. The algorithm evaluates the degree of particle degradation using the number of effective particles, Nff. The number of effective particles is calculated by the algorithm. Since it is not possible to calculate Nff precisely, Eq. (7) is used to represent the approximation:
When Nff is smaller than the set fixed threshold, Nth, it means that the particle set cannot effectively represent the posterior distribution of the state variable, indicating that the algorithm has a serious particle degradation problem in the current state; in order to cope with this situation, a resampling operation is needed to increase the number of effective particles to improve the stability and accuracy of the algorithm and to ensure that the robot can obtain reliable localization results in different states.
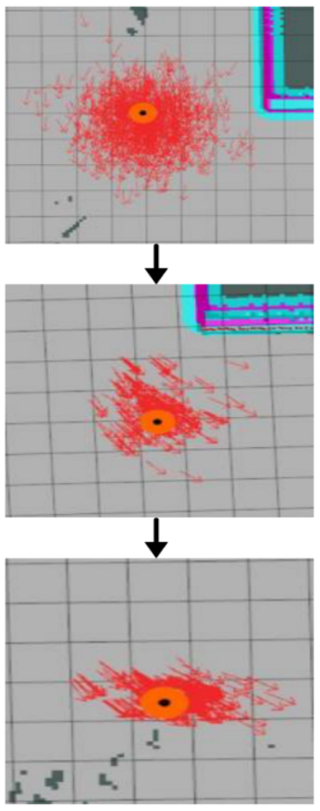
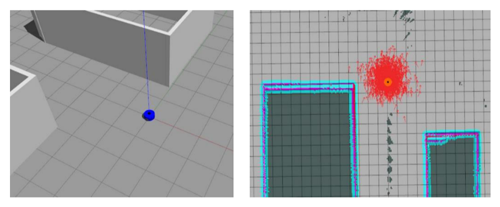
Figure 7 illustrates part of the Monte Carlo localization process during the ROS simulation.
In the Monte Carlo localization algorithm, a set of particles is randomly sprinkled in the environment that represent the possible positions and orientations of the robot. The particle filter works based on the assumption that the particles that best match the environment actually perceived by the robot represent the locus that is most likely to be the true position of the robot. As the robot moves, these particles move accordingly and predict the new position of the robot. When the sensor data detect a change in the environment, the algorithm updates the particle population, recalculating its probabilities and weights for each particle based on the match between the sensor data and the predicted data. This method is effective in estimating the precise position of the robot in complex environments. Then, the set of particles, N, is redistributed according to the weight, , so that the distribution density is proportional to the weight, , thus better reflecting the robot's current possible position. This process is iterated to continuously improve the accurate estimation of the robot's position.
1.3.2 Extended Kalman filtering
The Kalman filter, as a recursive filter, plays an important role in system state estimation. Its core principle is to estimate the system state at the current moment by weighting the observation data. The key lies in the measurement accuracy of the sensors, and the observation of high-precision sensors has a greater weight in Kalman filtering, which helps to improve the accuracy of the estimation. Kalman filtering is widely used in several fields and especially excels in systems that require real-time control and iterative updates. However, due to the nonlinear nature of many real systems, the extended Kalman filter (EKF) has been developed to address the problem of the localization of nonlinear systems. The core idea of the EKF is to expand the nonlinear system model in a Taylor series as a way to achieve local linearization of the system. This approach allows the EKF to maintain high efficiency and accuracy when dealing with nonlinear problems, making it suitable for a wider range of application scenarios. In this way, the EKF is able to efficiently deal with nonlinear characteristics in robot localization, such as nonlinear motion trajectories and nonuniform environment mapping. This innovative approach allows the Kalman filter to be more flexibly adapted to state estimation tasks for a variety of complex systems.
One of the main steps in implementing extended Kalman filtering is to create a system state transfer model and an observation model. In order to deal with nonlinear systems, it is common to use differentiable nonlinear functions f and h instead of the linear equations of the traditional Kalman filter (Sun, 2020). The most important effect of this modification is that the form of the state transfer equations and observation models of the extended Kalman filter are modified to be more consistent with the properties of nonlinear systems. The state transfer equation and observation model formulations of the extended Kalman are as follows:
where pt+1, it+1, rt+1, and ct+1 denote the motion noise, observation noise, control variable, and state variable at time t+1, respectively. f and h denote the state transition function. The observation function, pt+1, with it+1, is as follows:
Furthermore, the following applies:
where Qt+1 denotes the process noise covariance matrix at moment t+1.
The EKF employs linearization by means of a first-order Taylor expansion to approximate the state transition function, f, and the observation function, h. The linear equation is
where is the a posteriori estimate of the state vector at moment t; ∇fc is the Jacobian matrix of the state8 transfer equation and the derivative of the function f at , rt with respect to ; and the superscript dash denotes the predicted value.
The measurement model is then approximated as a linear equation using a first-order Taylor expansion as follows:
where is the a priori estimate of the state vector at moment t+1 and ∇hc the Jacobi matrix of the observation model and the derivative of the function h at with respect to .
Suppose that an AGV has a trajectory, which is determined by a set of control variables, n. Included in this set of control variables are two key parameters, the linear velocity, v, and the angular velocity of the traverse pendulum, ω. To concretize this scenario, we set the maximum linear velocity of the AGV to be 0.1 m s−1, which is a relatively slow speed suitable for a precisely controlled environment. Meanwhile, the range of the traverse angular velocity, ω, is limited to ±0.1 rad s−1. This setting ensures that the AGV has enough of both flexibility and stability when performing steering.
The whole running process of the AGV was set to 60 s. This is a medium-length running cycle, which is enough for us to observe the motion behavior of the AGV under different control parameters. In order to analyze the motion of the AGV in more detail, we chose the sampling time, dt, to be 0.1 s. This means that during the whole running process of the AGV, we will obtain 600 discrete sampling points (60 s divided by 0.1 s equals 600), and each sample point represents the position and attitude of the AGV at that moment.
Based on these settings, the trajectory of the AGV can be subdivided into three main parts: longitudinal displacement, X; lateral displacement, Y; and traverse angle, θ. The longitudinal displacement, X, describes the positional change of the AGV in the straight-ahead direction, which is obtained by the accumulation of the linear velocity, v, over time. The lateral displacement, Y, describes the position change of the AGV in the transverse direction, which is the result of the combined effect of the angular velocity of the pendulum, ω, and the linear velocity, v. The lateral displacement, Y, on the other hand, describes the position change of the AGV in the lateral direction. The traverse angle, θ, on the other hand, describes the angular change of the AGV with respect to the initial direction, which is obtained by the accumulation of the traverse angular velocity, ω, over time. Its observation model is
where U is the input variable and R is the observation noise:
The observation model is a further interpretation and modeling of the AGV's trajectory, which includes sensor readings, possible noise, and sources of error. This model helps us understand how the AGV behaves in actual operation and is crucial for the design of control and navigation algorithms. By observing the model, we can accurately know the position and attitude of the AGV at any given moment, thus ensuring that it can follow a predetermined path accurately (Li et al., 2024).
To summarize, by meticulously analyzing and modeling the AGV's trajectory, we are able to not only understand the AGV's behavior under different control parameters, but also design a more accurate and reliable navigation system. This kind of analysis is extremely important for both research and applications in the field of automated transportation and robotics.
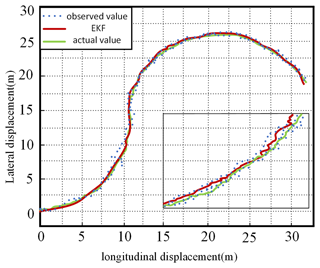
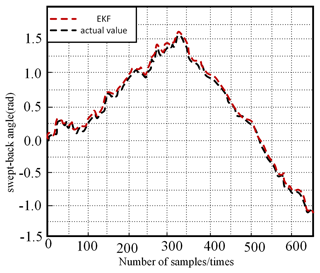
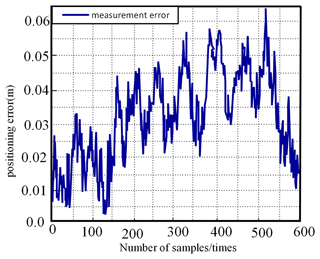
The AGV is sampled 650 times from the initial position (0, 0), and the simulation results are shown in Figs. 8, 9, and 10.
Figures 8, 9, and 10 vividly demonstrate the excellent results of the extended Kalman filter (EKF) for localization and traverse angle measurements. For positioning, the EKF shows high stability and successfully reduces to an average positioning error of 0.025 m. Regarding traverse angle measurement, the EKF also achieved remarkable success, with an average measurement error of only 0.003 rad, which is in high agreement with the actual value. These results fully demonstrate the excellent effectiveness of the extended Kalman filter in localization and traverse angle estimation and provide strong support for its widespread use in practical applications.
1.4 Fusion algorithm for odometry and IMUs
1.4.1 Sensor fusion localization
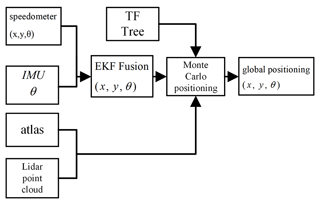
In the case of an automated guided vehicle operating for a long period of time, the use of an odometer for localization may introduce a cumulative error, especially when the tilt rate is gradually increasing. To address this problem, this study uses the extended Kalman filter (EKF) algorithm to achieve more accurate estimation of position information by merging odometer and inertial measurement unit (IMU) data. The merged position information not only improves the positioning accuracy, but also provides more reliable support for AGV global navigation using Monte Carlo positioning algorithms, TF trees, lidar scanning point clouds, and global positioning map information (Zhang et al., 2022). For detailed steps and processes of the whole localization scheme, refer to Fig. 11.
Assuming the AGV's position value at moment t, the data from the odometer are used in the EKF for state prediction, and the data from the , IMU are used for measurement update.
State prediction
At moment t+1, the observation information of the odometer is denoted as . This observation information includes data such as speed, position, direction, and other data related to the movement state of the AGV. Meanwhile, the control variable, , of the AGV involves a parameter or instruction for adjusting the movement of the AGV, such as the traveling direction, speed, and stopping.
The kinematics of the automated guided vehicle at moments is modeled as Eq. (17), and the Jacobian matrix is as in Eq. (18):
Measurement update
An observation from the inertial measurement unit (IMU) is labeled θt+1 at time point t+1. This observation follows a specific observation model (Eq. 19), which is used to describe the relationship between the IMU measurements and the actual state. In order to accurately estimate the state variables, it is necessary to calculate the Jacobian matrix (Eq. 20) of the measurement model, which characterizes the sensitivity of the measurements to the state variables. With this Jacobian matrix, the prediction error in the Kalman filter can be adjusted more accurately. Ultimately, based on this information and the Kalman filter algorithm, the Kalman gain is calculated as in Eq. (21). The Kalman gain is a key parameter that determines the relative weights of the observed and predicted values in updating the state estimate.
pt+1 denotes the motion noise at time t+1. ∇hx denotes the Jacobi matrix for measurement models.
Let the covariance matrix Rt+1 of the observation noise be
where σθ denotes the noise variance of the IMU measurement, θ.
From this, the Kalman gain can be derived as follows:
The final error covariance matrix can be updated as follows:
The efficient integration of the localization algorithm with the Monte Carlo algorithm is achieved by utilizing the results of the extended Kalman filter as the a priori distribution data in the prediction step of the Monte Carlo fusion localization algorithm and combining the results of the lidar and point cloud data fitting for the update step (Zhang and Li, 2024). This fusion process plays a key role in global localization, ensuring that the AGV can accurately perceive its position in the environment and finally realizing the global localization of the AGV.
1.4.2 Simulation test and result analysis
In the study, firstly, a simulated cart was built in the Gazebo simulation environment and the corresponding environment map was constructed. Then, a comparative study of the localization effect of AGV carts with and without fusion algorithms was conducted. This process was tested using the Robot Operating System (ROS) for simulated localization as shown in Fig. 12. In this test, the parameter settings of the lidar were carefully adjusted to ensure high efficiency and accuracy: the update frequency was set to 10 times per second, i.e., 10 Hz, which provides smooth and continuous environment sensing data; the sampling range reaches 360°, which realizes all-around environment coverage. The maximum and minimum sampling angles are set to ±3.15°, respectively. This configuration helps to focus on scanning specific areas and improve the accuracy of measurements; as for the detection distance, it is precisely limited to between 0.1 and 1 m, a proximity range that is particularly suitable for occasions requiring high-resolution and high-precision data, such as robotic navigation or the detection of obstacles in the proximity of self-driving vehicles.
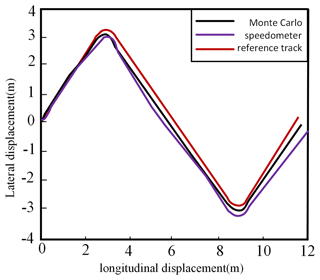
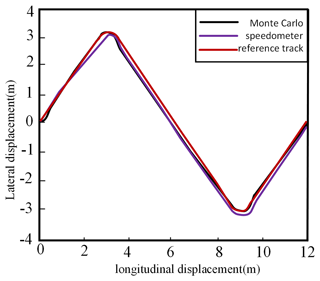
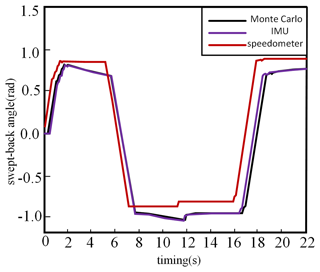
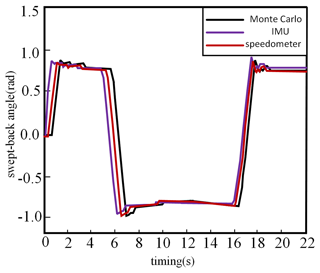
A path is planned from the starting point (3, 3) then to (9, −3) and finally to (12, 0), the command $rosbag-a record is executed during the movement of the vehicle and records all the contents of the ROS topic, which includes data from various sensors as well as information processed by the algorithm. Eventually, by analyzing this data, a series of measurements can be obtained. As shown in Figs. 13, 14, 15, and 16.
By comparing Figs. 13 and 14 in the experiment, it can be observed that before the fusion of EKF is added, there is a significant difference between the position measured by the odometer alone and the actual position, especially after the vehicle is turned. The position deviation gradually increases, which seriously affects the accuracy of global localization, especially at the end point. The Monte Carlo localization error without EKF can reach up to 0.552 m. And after adding the EKF, the localization error is significantly reduced, and the maximum error is only 0.171 m, which indicates that the EKF can effectively correct the localization error when fusing the odometer and IMU data and improve the accuracy of local localization.
In addition, by comparing the transformation of quaternions in Figs. 15 and 16, the error of the traverse angle (i.e., the steering angle of the vehicle) gradually increases over time in the localization system without the integration of the extended Kalman filter (EKF), a phenomenon that is particularly noticeable when the vehicle undergoes a turning operation. This is due to the fact that conventional localization algorithms have difficulty in accurately handling and compensating for sensor noise as well as external disturbances, resulting in increasing cumulative errors.
However, when the EKF is integrated into the positioning system, even if there is some deviation in the sensor measurements, the EKF is still able to process and optimize these data efficiently. The EKF is able to adjust and correct the estimate of the traverse angle in real time by taking into account the uncertainty of the system model. This algorithm is able to not only closely track the actual transverse pendulum angle changes, but also significantly improve the accuracy and stability of the transverse pendulum angle estimation.
The experimental results show that the EKF has a significant effect in improving the accuracy of vehicle traverse angle estimation, which is of great significance for application in the fields of vehicle navigation, automatic driving, and vehicle stability control. By accurately estimating the traverse angle, the safety and stability of vehicle traveling can be improved, and it also helps to improve the performance and efficiency of the vehicle control system. Therefore, EKF, as an advanced filtering technique, has a wide range of applications in vehicle positioning and navigation systems.
2.1 Fusion navigation algorithm
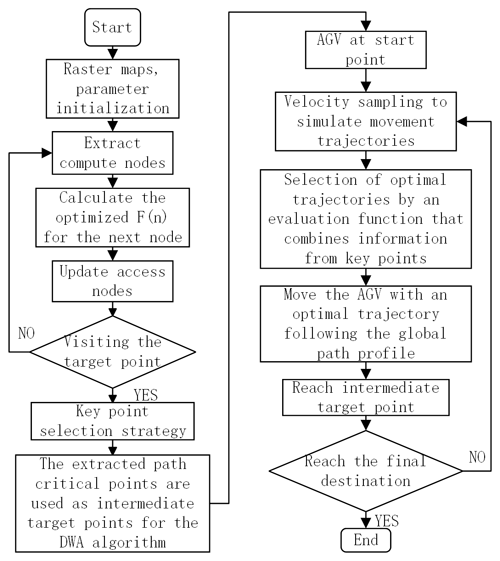
The dynamic window approach (DWA) algorithm performs well in local obstacle avoidance; however, it mainly relies on a single final destination point for navigation, which may lead the algorithm to fall into the problem of a locally optimal solution. The paths plotted by the A* algorithm are rather one-sided, containing only the start point, end point, and critical nodes in the navigation paths, but the algorithm cannot avoid the unknown obstacles in the environment (Hu et al., 2023). In view of this, this study proposes a fusion method that combines the DWA algorithm with a global-path critical-point extraction method. In the DWA algorithm, these critical points are used as intermediate targets in the navigation process. Based on this, the fusion method of multi-source information is utilized to achieve the overall optimization of the mobile robot on the motion trajectory and the obstacle avoidance on the motion trajectory (Fig. 17) shows the detailed flow of the algorithm.
Firstly, with the help of the A* algorithm, a route is planned as a whole, and then based on the optimal objective function of A* algorithm, the route is optimized twice, and finally the key nodes in the route are determined. Secondly, in DWA, we will temporarily use the method as an intermediate objective point, and on the basis of this, we will carry out local path planning for AGVs. The DWA algorithm simulates the robot's motion trajectory by sampling multiple sets of velocities and selects the optimal trajectory with the help of the evaluation function and key point information. By fusing it with the improved A* algorithm, the combination of global path planning and local obstacle avoidance can be realized. The AGV will gradually approach or arrive at the intermediate target point according to the planned path and finally reach the target point. In this process, the set of pathway nodes needs to be continuously updated, and redundant nodes are excluded, and necessary pathway nodes are retained.
2.2 Simulation test
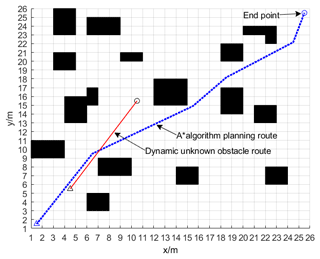
A 25×25-field raster map is constructed for simulation experiments to verify whether the fusion navigation algorithm is effective. On the global path of the robot planned by the A* algorithm, four unknown static obstacles are randomly set, and an unknown uncertain dynamic obstacle is also set in the simulated system. In the raster map, the black raster represents an obstacle area, while the white raster represents a blank area that can be moved by the AGV, △ denotes the starting position where the AGV is located, and ∘ denotes the goal point that the AGV is trying to reach.
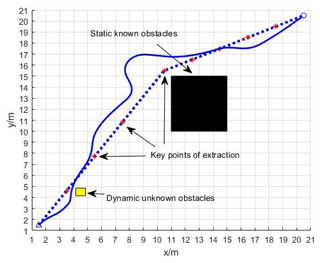
Figure 18 shows the result of the simulation test run of the fusion algorithm; the black grid in Fig. 18 is the static known obstacles, the dashed blue line is the global path planning of the A* algorithm in the static environment, and the solid red line is the route planned by the A* algorithm for the dynamic unknown obstacles.
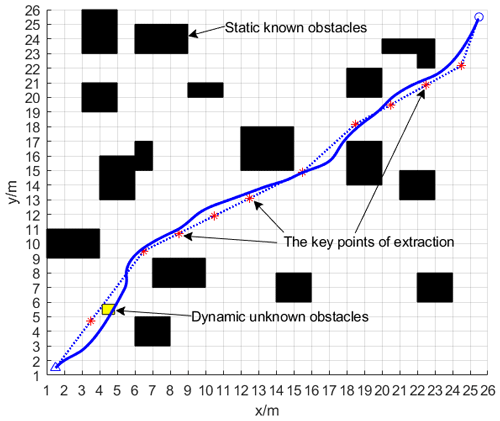
As shown in Fig. 19, in the A* algorithm, the search process generates a path from the start point to the end point which passes through a number of grids (also called nodes). Among them, the * symbol indicates the path-critical nodes in the A* algorithm, which are some special nodes on the path. These nodes are important for path optimization in the A algorithm. When fusing the A* algorithm with the DWA algorithm, these critical nodes are used as intermediate target points in the DWA algorithm to obtain a smoother path. In addition, the yellow squares indicate dynamic unknown obstacles.
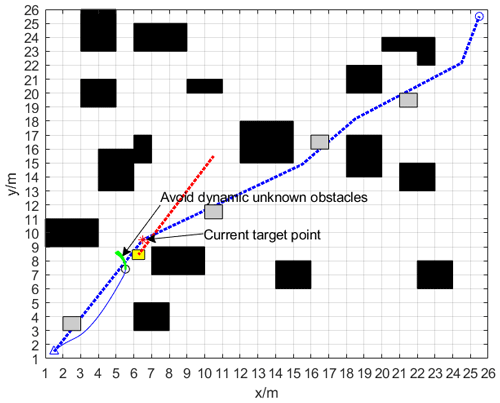
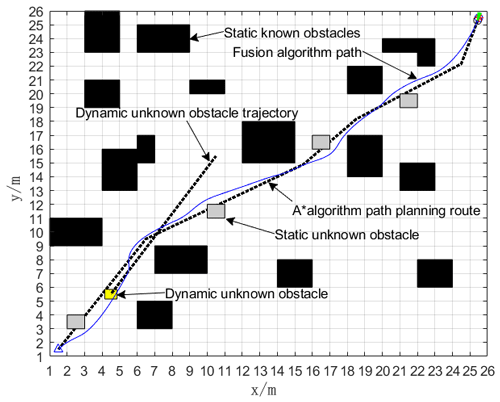
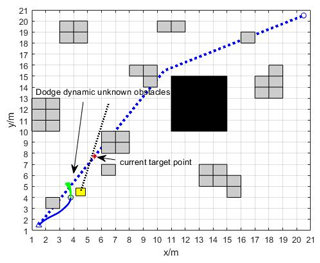
Figure 20 shows that the gray grid is used to model static unknown obstacles randomly appearing in the environment; the AGV first bypasses the static unknown obstacles, and then encounters dynamic unknown obstacles, and the DWA algorithm starts to perform local dynamic path planning as a means of bypassing dynamic unknown obstacles.
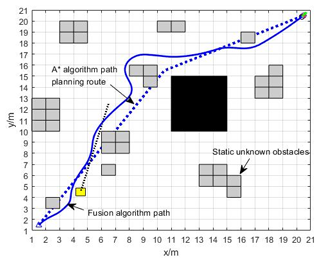
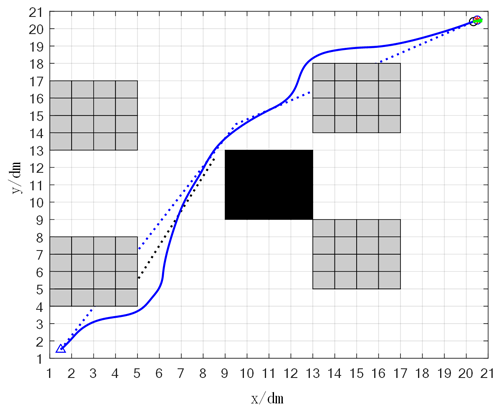
As shown in Fig. 21, the automated guided vehicle (AGV) successfully navigates from the starting point to the end point through dynamic path planning, ensuring the optimization of the overall path. In this process, the green line at the end of the track represents the simulated track, the dashed black line indicates the moving trajectory of the dynamic unknown obstacle, and the solid blue line is the navigation path generated by the fusion algorithm.
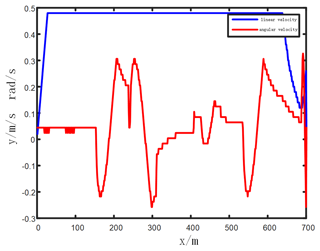
From Fig. 22, it can be seen that the maximum linear velocity of the AGV in the simulation test of the fusion algorithm is 0.48 m s−1, and the angular velocity is 0.3 rad s−1.
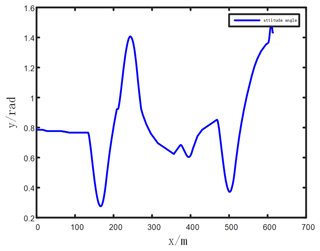
Figure 23 shows that the maximum attitude angle of the AGV in the fusion simulation test is 1.48 rad.
As can be seen from Table 1, the improved algorithm further improves not only the efficiency of the algorithm, but also the smoothness of the path.
Through the simulation of the method, this paper finds a new method of local trajectory planning based on the temporary target point using the key point of the route extracted by the A* algorithm and using this key point as an intermediate temporary target point for the dynamic window method. By classifying the categories of known obstacles, the interference of the path is reduced so that the planned path can effectively avoid the unknown obstacles in the shortest time.
In order to overcome the limitations of traditional PID control methods and further improve the accuracy and robustness of AGV path-tracking control, researchers propose various improvement and optimization schemes. Among them, the introduction of optimization algorithms is a highly efficient solution. As a heuristic optimization algorithm, particle swarm optimization has the global search ability and strong adaptability and has achieved remarkable results in optimization problems (Sebastian et al., 2023). Therefore, the method of particle swarm optimization fused with PID control can theoretically further improve the efficiency of AGV path-tracking control.
This paper modifies the fusion scheme of the particle swarm algorithm and PID control to optimize the accuracy and robustness of AGV path-tracking control. Through the adaptive adjustment of PID controller parameters and the online optimization of the particle swarm algorithm, the path-tracking error is minimized (Liu, 2021). By comparing traditional PID control methods, this study aims to verify the effectiveness and superiority of the improved scheme. We believe that by improving and optimizing AGV path-tracking control, we cannot only improve the work efficiency and accuracy of automated guided vehicles, but also promote the development of automated logistics and manufacturing (Yuan et al., 2023).
3.1 AGV path-tracking control method
AGV path-tracking control is a key task to realize the accurate travel of automated guided vehicles according to the planned path. To achieve this goal, researchers have proposed a variety of different path-tracking control methods. These methods can be categorized into two main groups: traditional control methods and control methods based on intelligent algorithms (Ye et al., 2023).
3.1.1 Traditional control methods
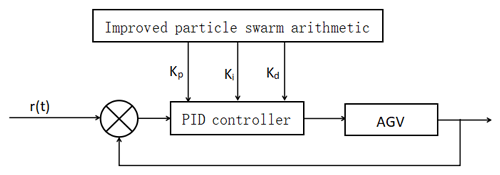
Traditional control methods have a wide range of applications in AGV path tracking. Here, the PID (proportional, integral, differential) control algorithm is the most common method (Yang et al., 2021). PID control keeps the AGV on the desired path by adjusting the control signal according to the proportional, integral, and differential components of the current deviation. The PID control schematic is shown in Fig. 24.
For the PID controller, as a widely used control strategy in the field of industrial control, the key is to make the actual response of the system as close as possible to the predetermined control target by adjusting the control variables of the controlled system (Zou et al., 2023). The fundamentals of a PID controller cover four main components. The first is the target signal, which is the signal that indicates the desired output of the control system.
Next is the deviation calculation, in which the system calculates the current deviation by comparing the target signal with the actual output. Next is the PID calculation, including the proportional, integral, and differential terms, which is calculated according to the size of the deviation, the rate of change, and the integral value to obtain the control output, whose formula is shown in Eq. (25).
where is the control deviation, Kp the proportionality coefficient, Ki the integration coefficient, and Kd the differentiation coefficient.
Finally, the control quantities from the PID calculations are applied to the controlled objects, adjusting the program's behavior so that the corresponding outputs are close to the set desired values.
Among the key points of the PID controller, the performance indicators are the key criteria for evaluating the effectiveness of PID control, which usually include the steady-state error of the system, the rise time, and the amount of overshoot (Zhang et al., 2023). The smaller the value of these performance metrics, the smaller the impact of the PID controller on the system and the more desirable the system response.
Performance optimization is a central goal in PID controller design because different combinations of PID parameters result in different values of performance metrics. By finding an optimal set of parameter values, the system can be optimized in terms of performance metrics, such as minimum steady-state error, shortest rise time, and minimum overshoot. This optimization process is designed to achieve higher control accuracy and response speed than the PID control system to meet the control requirements under different operating conditions (Sun et al., 2023).
Practical requirements are crucial for parameter optimization of PID controllers. Different industrial application scenarios have different requirements for system performance, so the PID parameters need to be adjusted according to specific practical requirements to accomplish the desired control effect of the system under different operating conditions (Lu et al., 2022). This flexibility allows PID controllers to be used in a wide range of applications.
In AGV path tracking, the PID control method has many advantages, including simplicity, being easy to understand and adjust, and good real-time performance. Many research efforts have focused on the improvement and optimization of PID control methods to improve the performance of path tracking. For example, researchers have tried to improve the accuracy, stability, and robustness of path tracking by adjusting PID parameters and using methods such as adaptive PID control or fuzzy PID control.
However, traditional PID control methods have certain limitations in dealing with dynamic environments, uncertainty, and nonlinear characteristics. When the AGV encounters external disturbances or changes in system parameters, traditional PID control may not achieve accurate path tracking. Therefore, further research and optimization are necessary for AGV path tracking based on PID control.
3.1.2 Control method based on intelligent algorithm
With the development of intelligent algorithms, more and more studies have begun to apply these algorithms to AGV path-tracking control. These include fuzzy control, neural network control, and genetic algorithms (Zhao et al., 2022).
Fuzzy control methods deal with uncertainty and ambiguity by applying fuzzy logic to rule inference in path-tracking control. Neural network control uses the powerful nonlinear modeling capabilities of neural networks to achieve path-tracking control. Genetic algorithms optimize the parameters and structure of path-tracking control by simulating natural evolutionary processes.
These intelligent algorithm-based control methods have shown superior performance in some cases, especially when dealing with nonlinear, complex environments and fuzzy input and output. However, these methods often require more complex computation and training processes, and parameter tuning is relatively difficult.
In summary, when reviewing the existing AGV path-tracking control methods, the traditional PID control methods have been widely adopted in practical applications and achieved certain success. At the same time, the control method based on an intelligent algorithm also has a certain amount of potential. However, for AGV path tracking based on PID control, further research and optimization are still necessary to improve the performance and robustness of path tracking (Wu et al., 2021).
In order to overcome the limitations of traditional PID control methods, the introduction of the improved particle swarm optimization algorithm and PID control fusion scheme provides a very efficient solution. As a heuristic optimization algorithm, particle swarm optimization has the global search ability and strong adaptability and can achieve significant results in optimization problems. The integration of the particle swarm algorithm and PID control can further promote the accuracy and robustness of AGV path-tracking control.
3.2 Fusion algorithm AGV path planning
There is a close relationship between path planning and path-tracking control, which complement each other and together constitute the complete navigation and control process of AGV system (Miao and Niu, 2021). In this study, in order to achieve the optimization of AGV path-tracking control, the first step is to plan the path so as to determine the ideal path of the AGV.
3.2.1 AGV path-planning simulation experiment
A 25×25 grid map was built for simulation experiments to verify whether the fusion navigation algorithm was effective. On the global path that the robot must pass through by the A* algorithm, four unknown stationary obstacles are randomly set. At the same time, an unknown and uncertain dynamic obstacle is also set in the simulated system. In a raster map, a black raster represents an obstacle area, while a white raster represents a blank area that can be moved by an AGV, △ represents the starting point where the AGV is located, and ∘ represents the target point to be reached by the AGV.
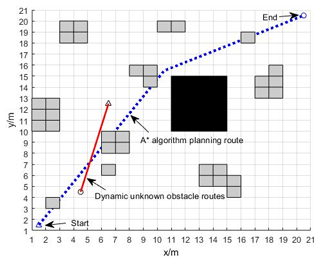
The result of the simulation test run of the fusion algorithm is shown in Fig. 25. The black grid in Fig. 25 is the static known obstacles, the dashed blue line is the global path planning of the A* algorithm in the static known environment, and the solid red line is the route planned by the A* algorithm for the dynamic unknown obstacles.
As shown in Fig. 26, in the A* algorithm, the search process generates a path from the start point to the end point which passes through a number of grids (also called nodes). Among them, the red star symbol represents the path critical nodes in the A* algorithm, that is, some special nodes on the path. These nodes are an important basis for path optimization in algorithm A. When fusing the A* algorithm with the DWA algorithm, these key nodes are used as mid-target points for the DWA algorithm, resulting in smoother paths. In addition, the yellow squares indicate dynamic unknown obstacles.
The gray grid in Fig. 27 is used to model random stationary unknown obstacles in the environment; AGV first bypasses stationary unknown obstacles, then encounters dynamic unknown obstacles, and then starts DWA algorithm to perform local dynamic path planning to bypass dynamic unknown obstacles.
As can be seen in Fig. 28, the automated guided vehicle (AGV) successfully navigates from the origin to the destination through dynamic path planning, making sure that the overall route is optimized.
In the figure, the green line at the end of the track is the simulated track, the dashed black line is the moving track of the dynamic unknown obstacle, and the solid blue line is the track generated by the fusion algorithm.
The improved algorithm further improves not only the efficiency of the algorithm, but also the smoothness of the path. It is important to lay the foundation for subsequent path control.
3.2.2 Complementary navigation and control relationships
The objective of the path-tracking control phase is to have the AGV navigate accurately along the planned path. In the process of path-tracking control, the current status information of the AGV is obtained through the sensor, and the feedback control algorithm, such as PID control, is used to adjust the speed, direction, and attitude of the AGV so that it moves according to the planned path. The key to path-following control is to modify the control parameters in real time to guarantee that the AGV accurately follows the intended path and adapts to changes in the environment (Tao, 2021).
The close relationship between path planning and path-tracking control plays a key role in realizing autonomous navigation and precise control of AGV systems. Proper path planning can provide suitable navigation goals for path-trace control, while optimization of path trace control depends on accurate path-planning results (Zhu et al., 2023). Through in-depth understanding of the correlation between path planning and path-tracking control, this paper lays the foundation for the design and realization of the subsequent improved particle swarm algorithm and PID control fusion scheme, which further improves the performance and effect of AGV path-tracking control.
3.3 Improved particle swarm optimization PID fusion algorithm
3.3.1 Principles of standard particle swarm arithmetic
Particle swarm optimization (PSO) is a group-intelligence-based optimization tool that simulates the foraging behavior of a flock of birds to find an optimal solution to a problem (Yuan et al., 2021). PSO operates on a D-dimensional search space, where D denotes the dimensionality of the problem. Each particle flies through the search space by constant iteration and evaluates its own performance based on the adaptation values determined by the objective function (Ye, 2021). The target of PSO is to gradually converge the particle swarm to the optimization solution of the problem by performing a global search in the entire search space to find a globally optimal solution. This population cooperative search strategy makes PSO show good performance in complex optimization problems.
The velocity and position update updates the velocity and position of the particle based on information about the current velocity, individual optimum, and global optimum (Vijayakumar and Sudhakar, 2024). The velocity update formula is as follows:
The position update formula is as follows:
where vi and xi are the velocity and i the position of the particle; ω the inertia weights, which control the particle velocity and persistence; pbesti the individual optimal position of particle i; and gbest the global optimal position of the particle population.
d1 and d2 are acceleration coefficients, which control the attraction of the particles towards the individual optimal and global optimal positions and a1 and a2 are random numbers in the interval [0, 1].
When the maximum number of the iterations is reached, the particle will approximate the global optimum solution within the error margin and output the global optimum solution.
3.3.2 Improved particle swarm arithmetic
In order to enhance the performance of particle swarm optimization algorithm (PSO), this paper proposes an improved algorithm which is optimized through the following aspects:
-
Dynamic inertia weight adjustment. In the standard PSO algorithm, the inertia weight is a fixed value, which may cause the algorithm to be too aggressive in exploring the solution space at the initial stage, while it may be too conservative at the later stage. Therefore, this paper introduces a dynamic inertia weight-adjustment strategy, which is formulated as follows:
where ωt is the inertia weight at the time step, ωmin and ωmax the minimum and maximum values of the inertia weight, and T the total number of iterations. This formula causes the inertia weights to decrease linearly with the number of iterations, thus providing greater exploration capabilities in the early stages of the calculation algorithm and enhanced local search capabilities in the later stages.
-
Local optimal solution update. In order to increase the diversity of the particle swarm and avoid premature convergence, this paper proposes that in each iteration, the particles not only update their velocity and position according to the global optimal solution, but also adjust according to the local optimal solution. The updating formula of the local optimal solution is as follows:
where ω is the inertia weight, the value of the velocity of the ith particle in the jth dimension at iteration t+1, d1 and d2 the acceleration coefficients, a1 and a2 random numbers in the interval [0, 1], the value of the global optimal solution in the jth dimension, the value of the local optimal solution of the ith particle in the jth dimension, and the value of the ith particle in the jth dimension.
With these improvements, the algorithm augments the local search capability while maintaining the global search capability and improves the ability of the algorithm to spring from the locally optimal solution, thus achieving better performance in multi-dimensional complex optimization problems.
3.3.3 Improved particle swarm algorithm for optimizing PID parameters
The fitness function is formed by transforming the input values of the evaluation function, whereby the improved particle swarm optimization (PSO) technique adjusts the parameters Kp, Ki, and Kd, aiming at improving the system control performance.
Figure 29 illustrates the process of tuning the PID parameters using the improved PSO algorithm. The six specific steps are listed below.
-
Considering the parameters Kp, Ki, and Kd in the PID controller as potential solutions in a three-dimensional space, the solution set range of the parameters Kp, Ki, and Kd is first determined empirically. Next, initial values are assigned to the inertia weights ωstart and ωend; the maximum value, Vmax, and minimum value, Vmin, of the particle velocity; and the number of iterations. The acceleration constants, d1 and d2, are set as follows:
where a4 and a5 are uniformly distributed random numbers between 0 and 1.
In the initial stage of the algorithm, it is necessary to set the initial position of the sensitive particles, determine the size of the particle swarm, and assign an initial velocity value to each particle. It is also necessary to define a threshold for the maximum number of iterations.
-
The fitness function is as follows:
In the initial particle swarm, the individual with the highest fitness is first identified and set as the globally optimal solution, Gbest. Subsequently, according to the fitness of each particle, each of them is set as the individual optimal solution, Pbest.
First, set the limit of the integral to infinity, i.e., time T. Next, discretize the continuous time so that T=mΔt, and, here, m is a positive integer. Specifically, a time array, t(i), is created, where i takes values from 0 to m. Finally, the error, e(t), is computed at each discrete time point, where i again takes values from 0 to m.
-
Particle update module according to the following:
Here, d1 and d2 are the acceleration constants, which are usually , and a1 and a2 are random numbers in the range (0, 1).
, , ..., is the global optimal position, , , ..., is the individual optimal position, and , , ..., is the initial position.
-
When the adaptive values of the sensitive particles change by more than a predetermined threshold, the positions and velocities of all particles in the swarm will be reinitialized according to a specific ratio.
-
Check whether the optimal solution in the current environment has been found. If it has been found, return to step (2) to continue iteration; if it has not been found, jump out of the loop.
-
Through this process, we can obtain the global optimal particle in the dynamic environment, which is the optimal Kp, Ki, and Kd parameter value of the PID.
3.4 Experimental simulation
A dynamic environment refers to a scenario in which the optimal solution and its position change over time during the search process, and such an environment is suitable for measuring the adaptability of an algorithm to dynamic changes. It is possible to create a dynamic environment containing multiple peaks through MATLAB, where the optimal value and optimal position of the particle swarm will change over time, which is expressed as follows:
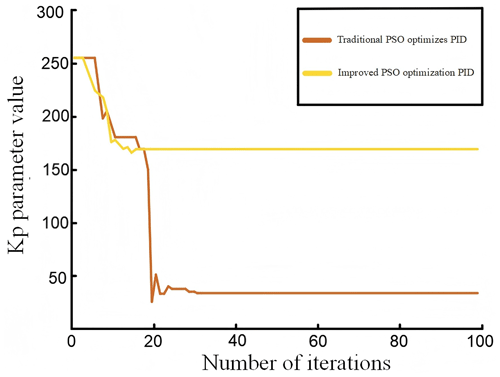
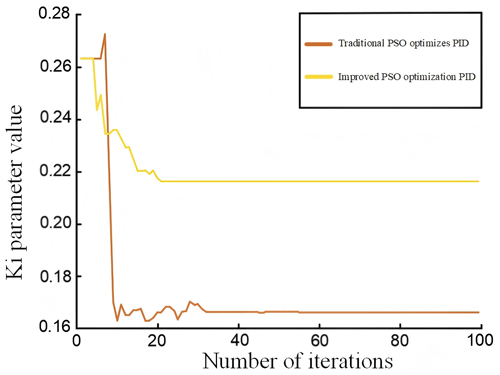
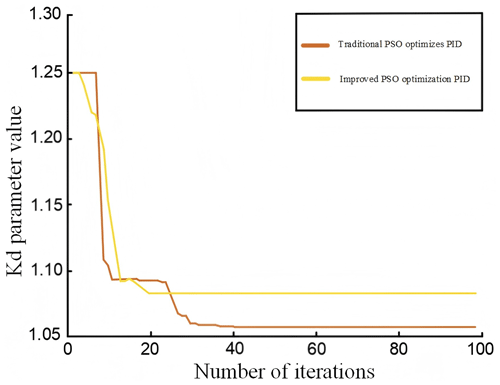
The improved particle swarm algorithm is used for the optimal goal search in a dynamic environment, with a total of 1200 environment changes and a population containing 20 particles. The algorithm is iterated 100 times within each environment, and there are 20 sensitive particles. The population reset condition is that the sensitive particle fit value changes more than a certain percentage of 1. The improved algorithm is optimized on a traditional basis, and the effect of PID optimization is verified experimentally and compared with the optimization results of PID parameters of the traditional algorithm. The three parameters Kp, Ki, and Kd of the PID were tuned using conventional and modified particle swarm algorithms, and the related graphs are displayed in Figs. 30, 31, and 32, respectively.
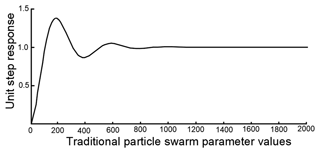
Figure 33Unit step response curve corresponding to the optimal parameters of the traditional particle swarm.
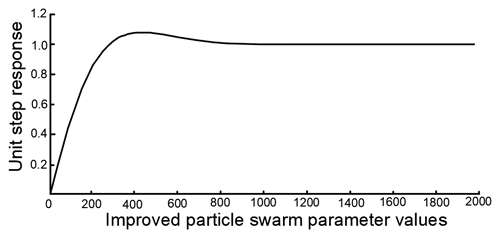
Figure 34The improved unit step response curve corresponding to the optimal parameters of the particle swarm.
As can be seen from Figs. 30, 31, and 32, the traditional particle swarm optimization algorithm often encounters the oscillation problem when adjusting the PID parameters and usually requires about 40 iterations to reach a stable state, which is not satisfactory. In contrast, the modified particle swarm optimization algorithm significantly diminishes the oscillation phenomenon when adjusting the PID parameters and converges in only about 20 iterations, showing higher stability and reliability. This tuning process was accomplished with a unit step signal input, which is consistent with the system conditions, using the traditional particle swarm optimization algorithm.
The PID parameters are adjusted from the original values of Kp=33.782, Ki=0.167, and Kd=1.058 to the improved values of Kp=168.623, Ki=0.216, and Kd=1.083 by means of algorithmic optimization. The corresponding step response curves for these parameters are displayed in Figs. 33 and 34, respectively. The dynamic performance metrics of the optimized PID control system with the particle swarm algorithm are listed in Table 2.
Observing Figs. 33 and 34, the modified particle swarm optimization PID controller outperforms the conventional particle swarm optimization PID controller in terms of control performance. Although the improved system has a longer rise time of 136 s, its regulation time is reduced by 24 %, and the amount of overshoot is reduced by 0.27 %. This shows that the revised particle swarm algorithm has enhanced the performance of the control system in optimizing the PID parameters.
In summary, the proposed particle swarm optimization (PSO) algorithm is the basis of PID control, and it is more effective in improving the control performance compared with the standard PSO algorithm. This improved PSO control is able to meet the high-precision requirements of automatic guided vehicle guidance, thus verifying the practical effectiveness of the improved PSO-optimized PID controller in track-following control.
With the rapid development of industrial automation, AGV plays an increasingly important role in realizing intelligent and flexible production. This thesis takes the mobile robot xBot as the research object and carries out in-depth research around the path-tracking control.
4.1 ROS-based laser SLAM real vehicle test
4.1.1 AGV real vehicle building test
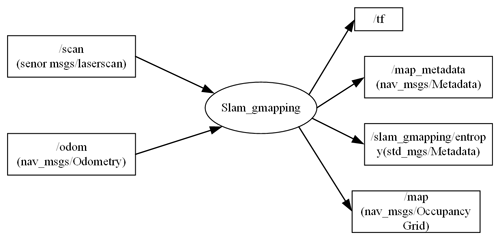
In this paper, the operating system of the AGV (automated guided vehicle) uses the Ubuntu 16.04 operating system with integrated ROS (Robot Operating System) kinetic version. Among the core nodes of the AGV, the slam_gmapping node undertakes the task of building the map, and it realizes the exchange of information with other nodes through the topic of ROS. Figure 35 illustrates the topic relationship between these nodes.
The slam_gmapping node subscribes to two main topics: odometer information (/odom) and lidar scan data (/scan). The odometer information provides the current position and attitude of the AGV, while the lidar scan data provide detailed information about the surrounding environment. After processing these data, the node publishes coordinate transformation information (/tf), which describes the interrelationships between the lidar coordinate system, the base coordinate system, and the odometer coordinate system.
These coordinate transformation messages are critical for the entire AGV system to work together as they provide accurate position and attitude information that allows the AGV to properly understand and respond to its surroundings for navigation and mission execution.
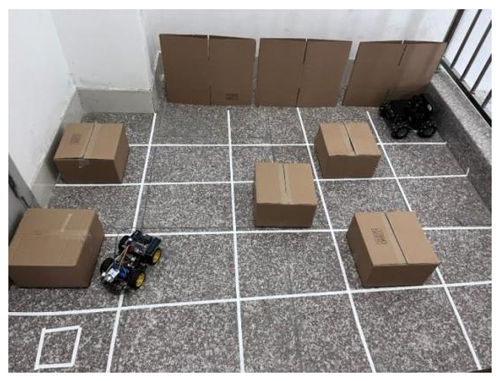
This paper describes the use of a lidar-equipped xBot platform to collect environmental data and vehicle position information. A keyboard control node is used to remotely operate the vehicle by inputting commands from a PC. In a ROS (Robot Operating System) environment, initiating a SLAM (synchronized localization and map building) process typically involves running a series of ROS nodes that work in concert to build a map of the environment. This is typically accomplished through the following steps:
-
Starting the ROS core. First, ensure that the ROS core is started. This can be done by running a command in the terminal.
$roscore
-
Starting SLAM-related nodes. Next, start the nodes responsible for SLAM. This typically includes sensor driver nodes, SLAM algorithm nodes, and visualization tools.
$roslaunch my_robot_slam.launch
Here, my_robot_slam.launch is a startup file that contains all the nodes and parameters needed to start the SLAM process.
-
Controlling robot movement. In order to build the map, the robot needs to be controlled to move in order to scan the environment. A predefined path planner is used for automatic navigation.
$roslaunch my_robot_navigation navigation.launch
-
Viewing the map building process. Use the Rviz visualization tool to view the SLAM process and the built map. It can be run in another terminal.
$rosrun rviz rviz-d `rospack find my_robot_rviz_config`/slam.rviz
-
Saving the map. When the map is built, you can use the map save tool to save the map for subsequent use.
$rosrun map_server map_saver-f my_map
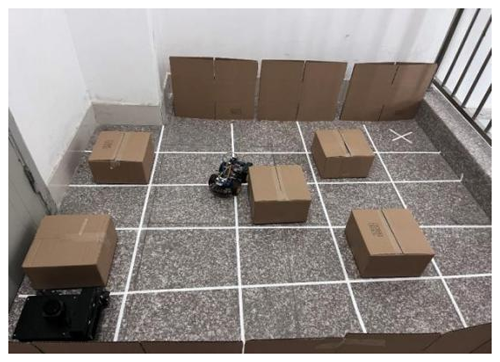
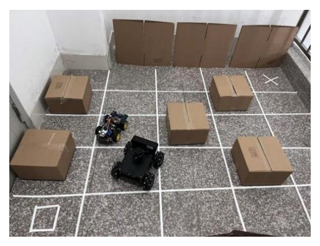
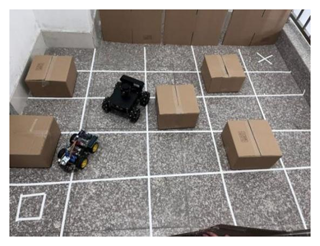
According to the simulation (Fig. 36), complete the real vehicle test as shown in Figs. 37 to 40.
4.1.2 Sensor fusion localization test
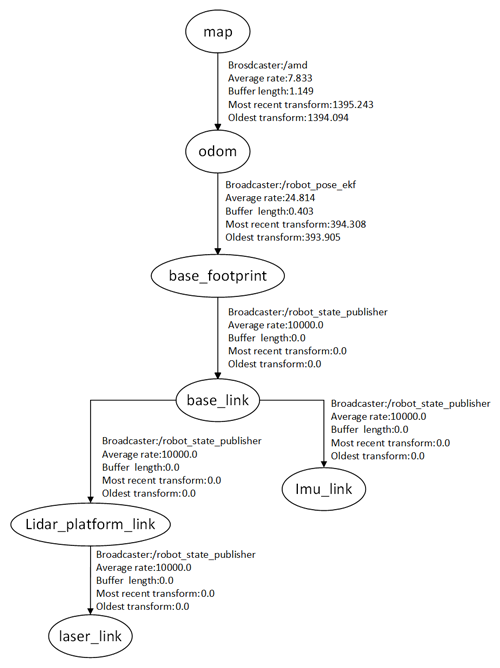
In order to test the accuracy of the fused localization algorithms, it is indeed necessary to accurately determine the coordinate transformation relationships between the IMU and the lidar and the vehicle coordinate system (base_link). In the ROS (Robot Operating System), this is usually done by means of a TF (transform framework), which is used to manage the transformations between different coordinate systems.
Two coordinate transformation relations have been set up correctly:
-
Transformation between base_link and imu_link.
This transformation specifies the fixed position and orientation of the IMU relative to the vehicle coordinate system.
args=”0 0 0.05 0 0 0 0 1 /base_link /imu_link” means that the IMU is located 0.05 m directly above the origin of the base_link coordinate system and has no rotation (a quaternion of 1 means no rotation).
-
Conversion between base_link and lidar_platform_link.
This transformation specifies the position and orientation of the lidar platform relative to the vehicle coordinate system.
args=”0.05 0 0 0 0 0 0 0 1 /base_link /lidar_platform_link” means that the lidar platform is located 0.05 m to the right of the origin of the base_link coordinate system and is not rotated.
These transformations are published via the static_transform_publisher node, which is used in ROS to publish static coordinate transformations. Make sure that these transformation parameters match your actual hardware configuration, which is critical for accurate positioning and navigation.
The fused coordinate relationships are shown in Fig. 41.
Implement the xBot to rotate for 1 week around the starting point and return to the starting position and collect data through the encoder and IMU, then integrate this data using the extended Kalman filter (EKF) following the steps below.
First, a keyboard control node is activated in order to manually control the movement of the xBot. Through keyboard input, control the xBot to rotate around the starting point for 1 week and ensure that it eventually returns to the starting position. Ensure that the nodes for the encoder and IMU are started and post data to the appropriate ROS topics. Encoder data are posted to the /odom topic, and IMU data is posted to the /imu_data topic. The extended Kalman filter node is launched, subscribes to the /odom and /imu_data topics, integrates this information, and publishes the fused data to the /robot_pose_ekf/odom_combined topic. Log all sensor data using the rosbag tool. Once logging is complete, use the rosbag tool to extract the required data and save it in .csv format.
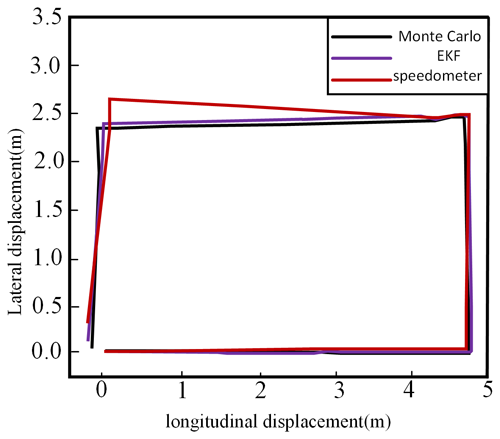
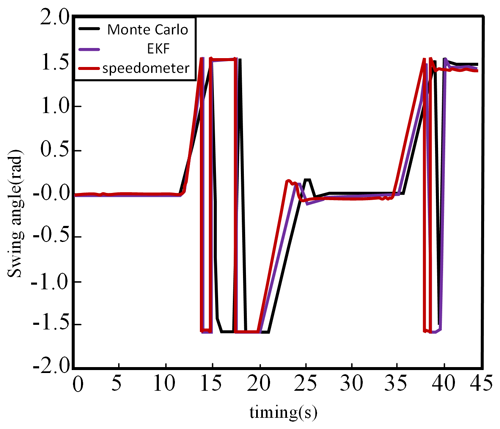
The experimental results demonstrate the dynamic characteristics of the xBot's position and attitude changes as well as the traverse angle through these data. Figures 42 and 43 show the measurement results during the movement of the xBot.
According to the data shown in Figs. 42 and 43, the three different localization methods (Monte Carlo localization, EKF localization, and odometer localization), all with starting coordinates of (0, 0), have position and traverse angles change as follows:
-
The end point coordinates for the Monte Carlo localization were (−0.167, 0.116), and the traverse angle increased from 0 to 1.502.
-
The end point coordinates for the EKF localization were (−0.209, 0.159), and the traverse angle increased from 0 to 1.468.
-
The end point coordinates for the odometer localization are (−0.228, 0.31), and the cross pendulum angle increases from 0 to 1.421.
From Figs. 42 and 43, it can be observed that Monte Carlo localization provided the highest localization accuracy in this experiment, and its end point position was the closest to the theoretical graph trajectory. EKF localization was the next closest, and its end point position was also relatively close to the graph trajectory, but there was a certain gap compared with Monte Carlo localization. The error of odometer localization is larger, and its end position is obviously deviated from the graph trajectory. This indicates that the odometer does not perform as well as the Monte Carlo and EKF methods in dealing with nonlinear problems caused by rotation.
This paper focuses on the laser SLAM-based AGV path-tracking control method, which realizes efficient and stable AGV path tracking in complex industrial environments through laser SLAM localization, path planning with improved dynamic windowing method, and fusion of the particle swarm algorithm and PID control. The following summarizes the present main results.
First, the positioning algorithm applicable to AGVs is selected and optimized by thoroughly studying different laser SLAM positioning methods. The algorithm performs well in experiments, with high localization accuracy and robustness, providing a reliable foundation for subsequent path tracking.
Secondly, this paper proposes and applies the AGV path-planning algorithm based on the improved dynamic window method. The algorithm is able to efficiently plan a safe and fast path when facing complex situations such as dynamic environment and obstacle changes. The experimental results show that the algorithm is able to achieve satisfactory path-planning results under various environmental conditions.
In addition, we fuse the particle swarm algorithm with PID control to improve the control performance of AGV path tracking. The experimental results show that this fusion strategy can effectively improve the stability and robustness of the system and effectively overcome some of the limitations of traditional PID control in nonlinear systems.
The data and code that support the findings of this study are available upon request from the corresponding author.
Conceptualization: JZ, WW, and ZB; methodology: JZ and ZB; software: JZ; validation: JZ, ZB, and WW; formal analysis: JZ and TW; investigation: ZB and TW; resources: WW and TW; data organization: JZ and ZB; writing (original draft preparation): JZ and ZB; writing (review and editing): JZ and ZB; visualization: WW and TW; project management: WW and TW; funding acquisition: WW. All authors have read and agreed to the published version of the paper.
The contact author has declared that none of the authors has any competing interests.
Publisher's note: Copernicus Publications remains neutral with regard to jurisdictional claims made in the text, published maps, institutional affiliations, or any other geographical representation in this paper. While Copernicus Publications makes every effort to include appropriate place names, the final responsibility lies with the authors.
This work has been supported by the National Natural Science Foundation of China (grant no. 52105260).
This research was funded by the National Natural Science Foundation of China (grant no. 52105260) as part of the “Hybrid quantitative decoupling research on the in-cylinder mixing performance of gas fuel based on the systematic quantitative evaluation mechanism” project.
This paper was edited by Daniel Condurache and reviewed by two anonymous referees.
Hu, H. T., Yang, X. R., Xiao, S. C., and Wang, F. Y.: Anti-conflict AGV path planning in automated container terminals based on multi-agent reinforcement learning, Int J. Prod Res., 61, 65–80, https://doi.org/10.1080/00207543.2021.1998695, 2023.
Hu, Y. J., Xie, F., Yang, J. Q., Zhao, J., Mao, Q., Zhao, F., and Liu, X. X.: Efficient Path Planning Algorithm Based on Laser SLAM and an Optimized Visibility Graph for Robots, Remote Sens-Basel., 16, 2938–2938, https://doi.org/10.3390/RS16162938, 2024.
Li, J., Shi, C. H., Chen, J., Wang, R. S., Yang, Z. Y., Zhang, F., and Gong, J. H.: A monocular visual SLAM system augmented by lightweight deep local feature extractor using in-house and low-cost LIDAR-camera integrated device, Int. J. Digit Earth., 15, 1929–1946, https://doi.org/10.1080/17538947.2022.2138591, 2022.
Li, Z. Y., Li, H. G., Liu, Y., Jin, L. Y., and Wang, C. Q.: Indoor fixed-point hovering control for UAVs based on visual inertial SLAM, Robot. Intell. Autom., 44, 648–657, https://doi.org/10.1108/RIA-06-2023-0081, 2024.
Liu, D.: A data association algorithm for SLAM based on central difference joint compatibility criterion and clustering, Robotica, 39, 1674–1691, https://doi.org/10.1017/S0263574720001435,2021.
Lu, Y., Xia, C. Y., Rong, C. C., Zhao, S. Z., Liu, Y. H., Chen, M. M., Yang, Z. Y., and Li, W. L.: Optimization design of coupling mechanism for dynamic static hybrid AGV WPT systems, Electr. Eng., 104, 4509–4520, https://doi.org/10.1007/S00202-022-01625-1, 2022.
Miao, J. J. and Niu, P. J.: Design of path tracking control system for magnetic navigation AGV, Combination of machine tools and automated machining technology, Modular Mach. Tool Auto., 9, 107–110+116, https://doi.org/10.13462/j.cnki.mmtamt.2021.09.024, 2021.
Michał, S., Jarosław, P., Leszek, B., Wojciech, K., Piotr, P., and Szymon, B.: Identification of Differential Drive Robot Dynamic Model Parameters, Materials, 16, 683–683, https://doi.org/10.3390/MA16020683, 2023.
Peng, H. R., Zhao, Z. Y., and Wang, L. G.: A Review of Dynamic Object Filtering in SLAM Based on 3D LiDAR, Sensors, 24, 645, https://doi.org/10.3390/S24020645, 2024.
Sebastian, B., Roman, W., Marek, K., Krystian, K., Radosław, M., Wojciech, P., Oskar, S., Mateusz, S., and Łukasz, W.: Using Gesture Recognition for AGV Control: Preliminary Research, Sensors, 23, 3109, https://doi.org/10.3390/S23063109, 2023.
Sun, H. L., Fan, Q. W., Zhang, H. Q., and Liu, J. J.: A real-time visual SLAM based on semantic information and geometric information in dynamic environment, J. Real-Time Image. Pr., 21, 169–169, https://doi.org/10.1007/S11554-024-01527-4, 2024.
Sun, R. T., Yuan, Q. N., Yi, J. H., and Bai, H.: Improved Particle Swarm Optimization and Dynamic Window Method for Dynamic Path Planning, Small Micro Comput. Syst., 44, 1707–1712, https://doi.org/10.20009/j.cnki.21-1106/TP.2021-0975, 2023.
Sun, X. D.: Research on navigation and obstacle avoidance technology of medical logistics robot based on McNamee wheel, Southeast University, 2020, 3685, https://doi.org/10.27014/d.cnki.gdnau.2020.003685, 2020.
Tao, Q. Y.: Research on AGV scheduling problem based on improved particle swarm algorithm,Liaocheng University, 2021, 076, https://doi.org/10.27214/d.cnki.glcsu.2021.000076, 2021.
Vijayakumar, S. and Sudhakar, N.: Golden eagle optimized fractional-order PI controller design for a PFC SEPIC converter in EV charging, Sci. Rep-UK., 14, 20954–20954, https://doi.org/10.1038/S41598-024-69653-4, 2024.
Vlachos, L., Martinez, R. P., George, Z., Panagiotis, R., and Mihalis, G.: Lean manufacturing systems in the area of Industry 4. 0: a lean automation plan of AGVs/IoT integration, Prod Plan. Control., 34, 345–358, https://doi.org/10.1080/09537287.2021.1917720, 2023.
Wang, T., Li, A. J., Guo, D. J., Du, G. K., and He, W. K.: Global Dynamic Path Planning of AGV Based on Fusion of Improved A* Algorithm and Dynamic Window Method, Sensors, 24, 2011, https://doi.org/10.3390/S24062011, 2024.
Wang, X. W., Fu, K. Y., and Lu, J. J.: Research on AGV task path planning based on improved A* algorithm, Virtual Real. Intellig. Hardware, 5, 249–265, https://doi.org/10.1016/J.VRIH.2022.11.002, 2023.
Wu, Y. Y., Xie, Z. J., and Lu, Y.: Steering Wheel AGV Path Tracking Control Based on Improved Pure Pursuit Model, J. Phys. Conf Ser., 2093, 12005, https://doi.org/10.1088/1742-6596/2093/1/012005, 2021.
Xue, G. H., Li, R. X., Zhang, Z. H., and Liu, R.: Research status and development trend of SLAM algorithm based on 3D LiDAR, Inform. Control., 52, 18–36, https://doi.org/10.13976/j.cnki.xk.2023.2254, 2023.
Yan, F.: Research on autonomous navigation and motion control technology of mobile robot based on vision SLAM, Nanchang University, 2024, 1686, https://doi.org/10.27232/d.cnki.gnchu.2024.001686,2024.
Yang, R., Liu, Y. B., Yu, Y. H., He, X., and Li, H. S.: Hybrid improved particle swarm optimization-cuckoo search optimized fuzzy PID controller for micro gas turbine, Energy Reports, 2021, 75446–5454, https://doi.org/10.1016/J.EGYR.2021.08.120, 2021.
Yang, X. and Ni, J.: A cloud-edge combined control system with MPC parameter optimization for path tracking of unmanned ground vehicle, P. I. Mech. Eng. D, 237, 48–60, https://doi.org/10.1177/09544070221080312, 2023.
Ye, K.: Differential AGV trajectory tracking control based on particle swarm algorithm,China Jiliang University, 2021, 0382, https://doi.org/10.27819/d.cnki.gzgjl.2021.000382, 2021.
Ye, Y. T., Wang, Y. T., Wang, L., and Wang, X. F.: A modified predictive PID controller for dynamic positioning of vessels with autoregressive model, Ocean Eng., 2023, 284, https://doi.org/10.1016/J.OCEANENG.2023.115176, 2023.
Yu, L. X., Zheng, M. K., Ou, W. J., and Wang, Z. B.: Optimization and system implementation of outdoor laser SLAM algorithm for mobile robots with multi-sensor fusion, J. Electro. Measure. Instrum., 37, 48–55, https://doi.org/10.13382/j.jemi.B2205747, 2023.
Yuan, P., Zhou, J., Yang, Z. B., Wu, D., and Huang, P. L.: Research on AGV path planning and deviation correction, Modern Manuf. Eng., 4, 26–32, https://doi.org/10.16731/j.cnki.1671-3133.2021.04.005, 2021.
Yuan, P., Xu, C. F., Zhou, J., and Yang, Z. B.: Research on improved anti-interference fuzzy PID of AGV control system, Machinery Design & Manufacture, 3, 212–216+220, https://doi.org/10.19356/j.cnki.1001-3997.2023.03.022, 2023.
Zhang, J. Z., Zhang, T., Zhang, G., and Kong, M.: Parameter optimization of PID controller based on an enhanced whale optimization algorithm for AVR system, Oper. Res.-Ger., 23, 787, https://doi.org/10.1007/S12351-023-00787-5, 2023.
Zhang, S. B., Xia, Q. X., Cheng, S. Z., Chen, M. X., and Xiao, G. F.: Research on Lyapunov-based Predictive Path Following Control of AGV Based on Time Constraint, Int. J. Control Autom., 20, 4005–4014, https://doi.org/10.1007/S12555-021-0492-3, 2022.
Zhang, Y. L. and Li, Y. Y.: Implementing nonlinear least squares approach to simulate the dynamic response of laminated nanocomposite arch with magnetorheological elastomer matrix, Eng Anal. Bound Elem., 166, 105859–105859, https://doi.org/10.1016/J.ENGANABOUND.2024.105859, 2024.
Zhao, M. Y., Yan, J., Shi, D. X., Wang, Y. Z., Pan, J. H., and Du, J.: Research on Visual Servo Control of UAV Pod Based on Improved PID Algorithm, J. Phys. Conf Ser., 2224, 012112, https://doi.org/10.1088/1742-6596/2224/1/012112, 2022.
Zhu, G. Z., Jie, H., and Hong, W. R.: Nonlinear Model Predictive Path Tracking Control for Autonomous Vehicles Based on Orthogonal Collocation Method, Int J. Control. Autom., 21, 257–270, https://doi.org/10.1007/s12555-021-0812-7, 2023.
Zou, W. Q., Pan, Q. K., Meng, L. L., Sang, H. Y., Han, Y. Y., and Li, J. Q.: An effective self-adaptive iterated greedy algorithm for a multi-AGVs scheduling problem with charging and maintenance, Expert Syst. Appl., 2023, 216, https://doi.org/10.1016/J.ESWA.2023.119512, 2023.
- Abstract
- Research on laser SLAM positioning method
- AGV path planning based on improved dynamic window method
- Improved particle swarm algorithm and PID control fusion
- AGV test and result analysis
- Conclusions
- Code and data availability
- Author contributions
- Competing interests
- Disclaimer
- Acknowledgements
- Financial support
- Review statement
- References


