the Creative Commons Attribution 4.0 License.
the Creative Commons Attribution 4.0 License.
 | 02 Dec 2025
Discrete element method analysis of cutter forces and cutter tooth wear in cutter suction dredgers
Yaowei Hu
Pan Jiang
Chenghui Cao
Hang Li
During dredging operations, cutter teeth undergo severe mechanical wear due to continuous rock impact and abrasion, significantly reducing operational efficiency and equipment lifespan. This study investigates force distribution and wear mechanisms using a three-dimensional discrete element model developed in EDEM (commercial discrete element method software developed by DEM Solutions, UK), incorporating a bonded-particle rock representation to simulate excavation under varying operational parameters. Simulation results reveal distinct mechanical patterns: cutter teeth located at the hub side experience substantially higher stress concentrations, with wear accumulation approximately 30 times greater than that on the large-ring side. Material loss is most pronounced on the upper surfaces of the teeth. Cutting force increases nonlinearly with traverse speed and decreases with rotational speed, while variations in cutting angle have a minimal effect within the tested range. Systematic analysis identifies the optimal operational regime as a traverse speed of 0.2 m s−1 combined with a rotational speed of 20 rpm, corresponding to the lowest specific energy consumption. These findings provide a theoretical basis for improving dredger performance through targeted reinforcement of key components, optimization of operational parameters, and predictive maintenance based on quantified wear patterns.
- Article
(10286 KB) - Full-text XML
- BibTeX
- EndNote


Dredging engineering is a critical infrastructure component supporting global economic development and socio-environmental sustainability. In the Chinese context, it plays a pivotal role in coastal infrastructure development, particularly in harbor construction, navigational channel maintenance, and ecological remediation projects. The cutter-head system, serving as the core component of cutter suction dredgers (CSDs), determines operational efficiency through its rock-cutting performance. However, prolonged marine and fluvial operations present a significant engineering challenge: continuous rock cutting induces severe structural degradation and abrasive wear on cutter teeth. Empirical observations confirm that wear progression correlates directly with exponential efficiency decline, manifested in increased energy consumption (12 %–18 % per 100 operating hours) and reduced excavation rates. A mechanistic understanding of cutter tooth stress distribution and wear patterns is thus essential for enhancing operational efficiency and optimizing maintenance protocols in modern dredging systems.
In recent years, research on tool cutting has advanced rapidly. Evans (1965) derived a cutting-force equation by studying the mechanical process of cutting coal rock with cutter teeth; their theoretical model integrated tensile strength with geometric parameters. Miedema (1989) developed a dynamic cutting-force model for water-saturated sandy soils, coupling nonlinear soil–tool interactions with ship motion equations. Their work highlighted the critical impact of wave-cutting force and anchorage system coupling on dredger motion continuity. Abo-Elnor et al. (2004) simulated soil–blade interaction and soil-cutting forces in sandy soil using advanced three-dimensional finite-element analysis. Ibrahmi et al. (2013) applied finite-element analysis to optimize cutter tool design. Huang et al. (2016) conducted numerical simulations of the rock-cutting process using a single conical tooth under deep-well mining conditions. Ouyang et al. (2020) proposed the Crushed Zone Expansion-Induced Tensile Damage (CEIT) model to predict the peak cutting force of cutters. Liu et al. (2023) investigated the effects of deep-sea pressure on cutting force and specific energy in rock breaking using a single gouge pick. Their findings indicated that hydrostatic pressure increases both cutting force and energy requirements, while reducing rock fragment size. Vijayan et al. (2021) examined the influence of shaft size and coupling strength on vibration transmission under shock loads during dredger operation. Yuan et al. (2025) proposed a predictive method based on an improved specific cutting energy model that integrates parameters of the cutting and pumping systems to evaluate the cutting energy efficiency of cutter suction dredgers.
Due to the inherent fractures and cracks within rock, the discrete element method (DEM) offers effective simulation of geotechnical properties in marine engineering contexts. Kozicki and Donzé (2008) developed open-source software using a discrete material description to study geotechnical materials. Yu and Xia (2012) used DEM to simulate rock samples with two initial cracks at varying angles. Wang and Yin (2020) modeled crushed particles via a substitution method and explored particle crushing effects on caisson foundation behavior. Wang et al. (2024) calibrated coal–rock parameters of a discrete element model through laboratory tests and statistical design to improve the accuracy of coal-cutting simulation. Li et al. (2025) used a discrete element model to investigate how kinematic parameters and rock properties affect the cutting performance and energy consumption of oscillating disk cutters. Li et al. (2021) built a three-dimensional DEM cutting model to evaluate the structure of a reverse-rotating milling machine and compared cutting loads between reverse and single-drum configurations. Nieuwboer et al. (2023) proposed a discrete element method–finite-volume method (DEM–FVM) coupling approach to simulate spills, using a smoothing kernel to map forces and concentrations between discrete and fluid meshes. Ling et al. (2024) used EDEM to study the influence of tool insertion depth, spacing, installation radius, and phase difference on average tool load in disk hob cutting, identifying conditions for minimal specific energy. Song et al. (2022) analyzed the drilling performance of impregnated microbits and discussed the influence of operating parameters on cutting forces and wear characteristics, providing valuable insights into rock-breaking and tool wear mechanisms. Yin et al. (2025) investigated the tooth surface wear behavior of helical gears under mixed elastohydrodynamic lubrication using a modified Archard wear model, which offers a useful reference for wear prediction and energy dissipation analysis in cutting processes. Verhoef (2017) investigated rock properties affecting mechanical cutting and tool wear, validating a predictive model for mechanical excavation. Zhang et al. (2023) developed a DEM-based numerical model for bottom-cutting circular cutters, analyzing the effects of depth of cut, tip width, and cutting angle on wear. Although DEM is widely applied in simulating tool–rock interaction, its application in modeling dredging cutter wear remains relatively underdeveloped.
This study uses EDEM to establish a cemented particle model of rock, simulates the cutter's dynamic cutting process, and analyzes the wear patterns and forms on different cutter teeth. Through cutter tooth assembly modeling, forces, torque, and specific energy under various working conditions are examined to identify optimal conditions for improving the operational efficiency of CSDs.
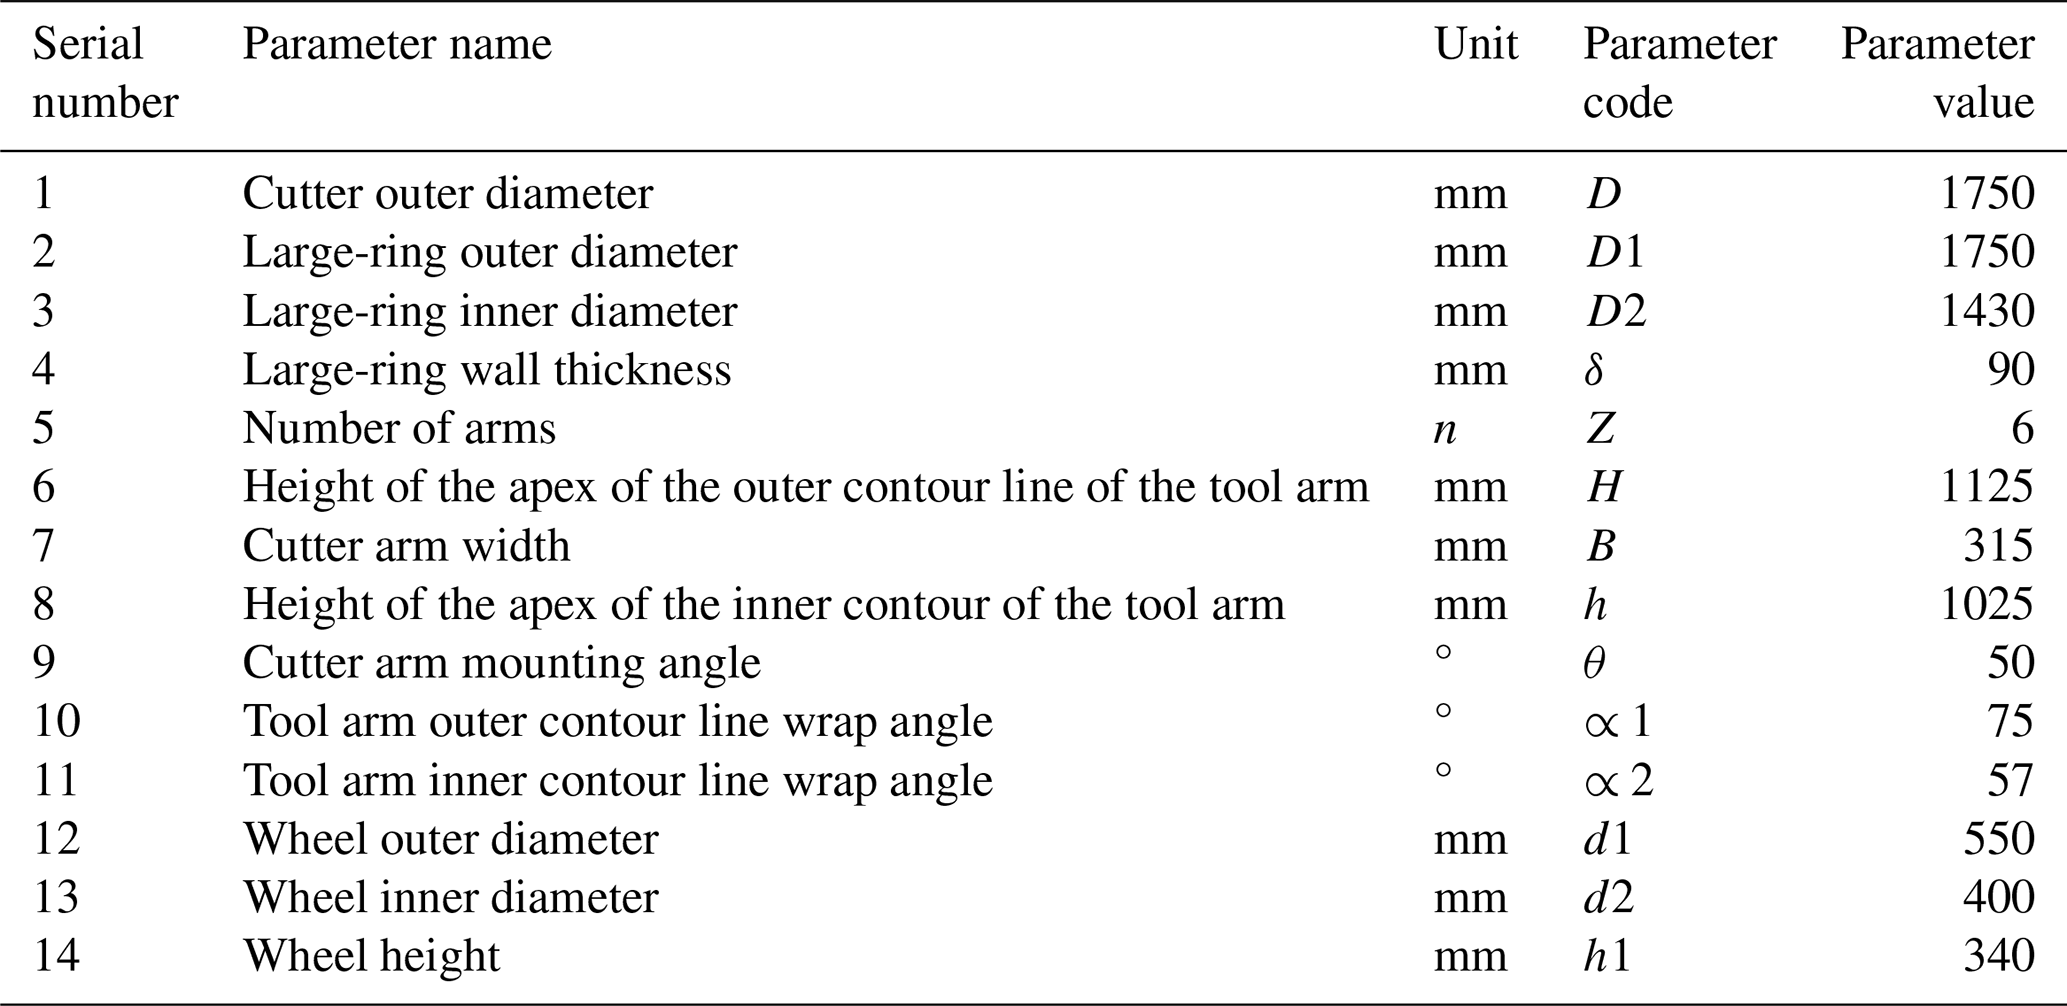
The most complex aspect of three-dimensional cutter modeling is the spatial geometry of the cutter arm. The surface is defined by two contour lines – inner and outer – and their intersection in space determines the cutter arm's profile. This requires transforming the problem into one involving projections in the cutter axis and cutter planes. The structural parameters of the rock-cutting cutter are listed in Table 1.
Referring to the cutter arm contour line equation, the expression of the arm contour line equation is calculated as
-
the spatial equation of the outer contour line of the knife arm,
-
the spatial equation of the inner contour line of the knife arm,
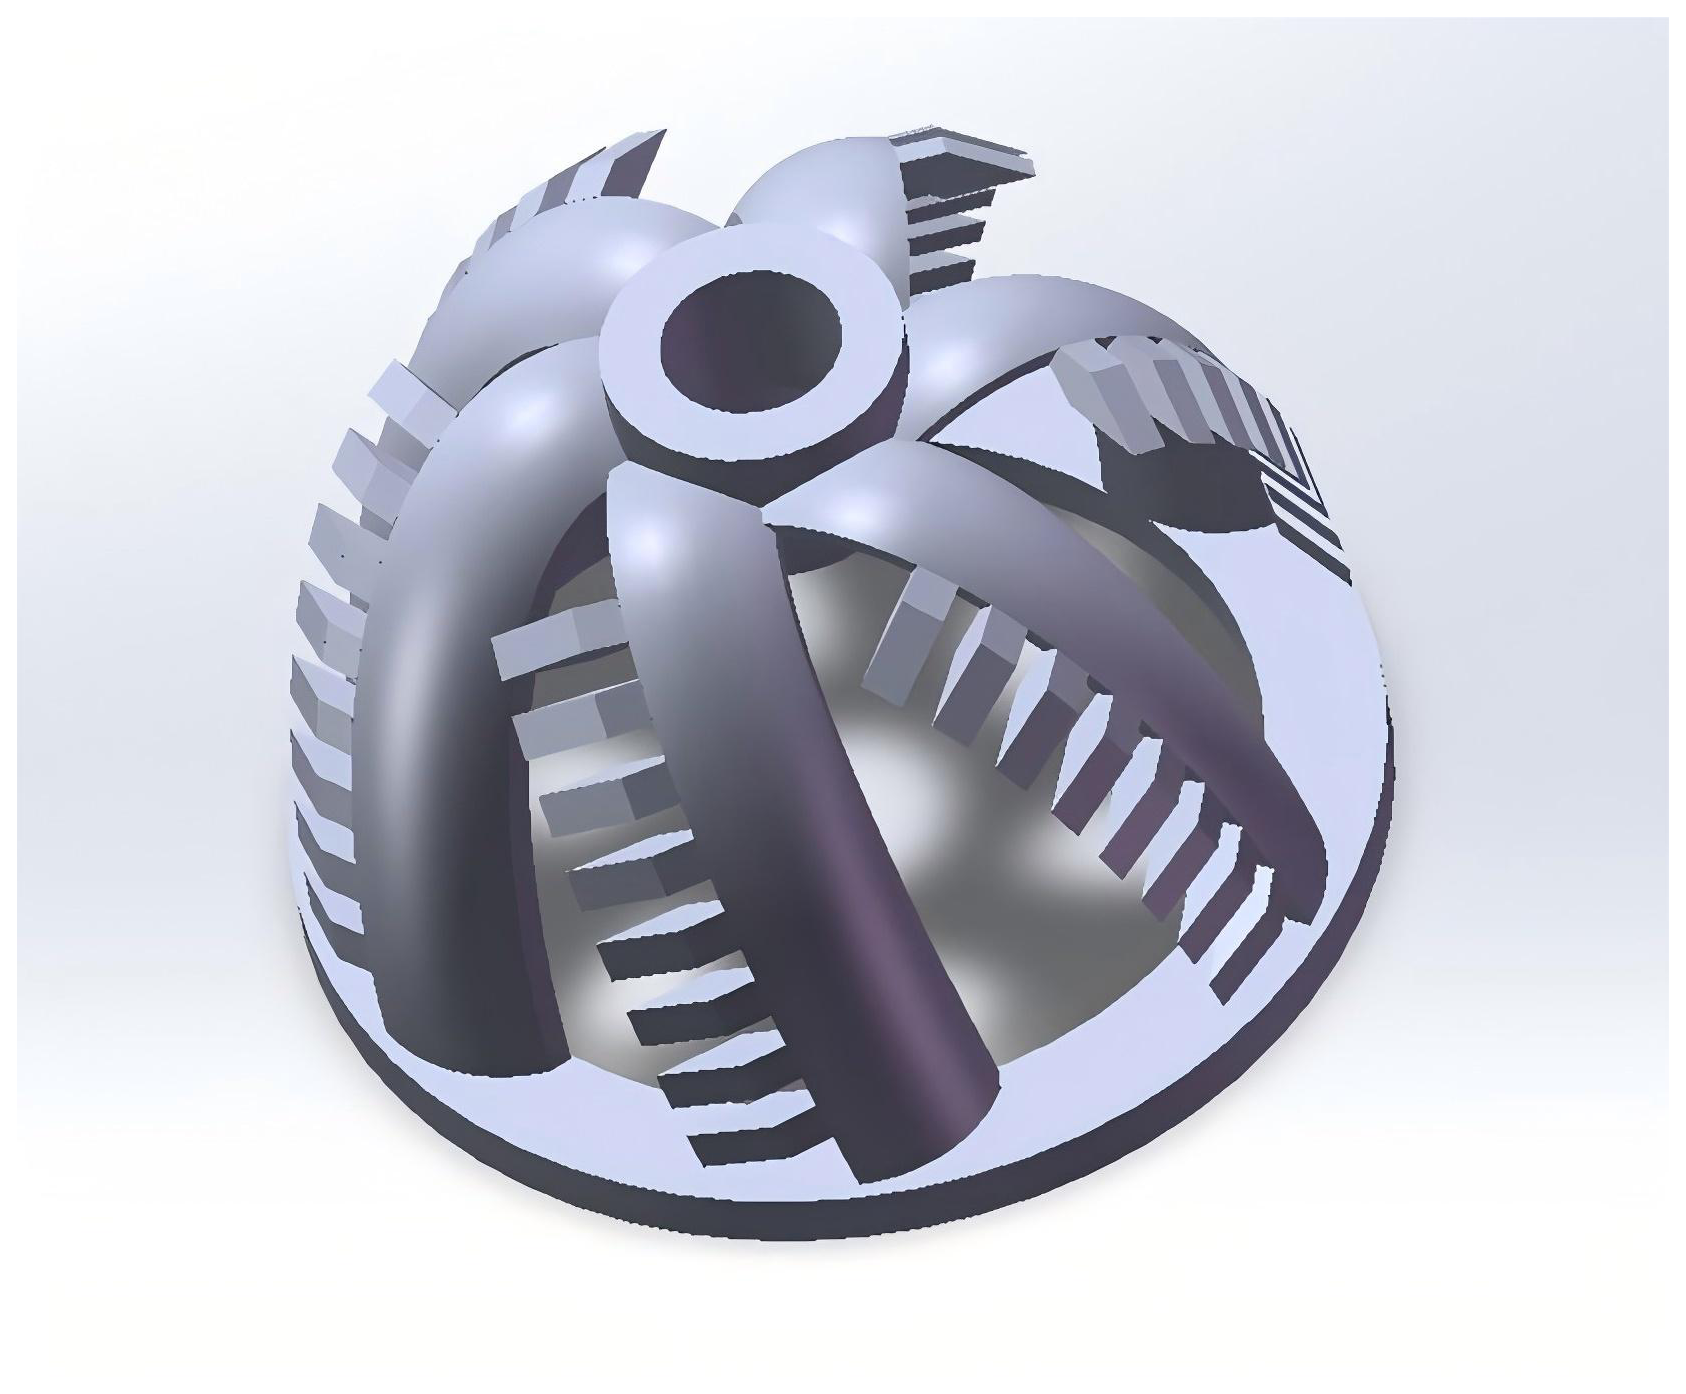
To analyze wear on different cutter teeth, the cutter arm and teeth were assembled during modeling, allowing individual tooth analysis in EDEM's post-processing stage. The three-dimensional cutter assembly model is shown in Fig. 1.
3.1 Hertz–Mindlin contact model
The contact model selection is based on the nature of the materials. Rock, an anisotropic and non-homogeneous material, breaks and fractures under cutting forces. To simulate particle bonding, this study adopts the Hertz–Mindlin contact model, which is the default in EDEM due to its accuracy and computational efficiency. In this model, the normal force Fn is a function of the normal overlap δn, defined as
Equivalent Young's modulus E∗ and equivalent radius R∗ are defined as
where Ei, vi, and Ri and Ej, vj, and Rj are the Young's modulus, Poisson's ratio, and radius of each contact sphere.
The damping force is
where e is the recovery coefficient, and is the relative normal velocity.
3.2 Bonding v2 model
The Hertz–Mindlin with bonding model describes interactions between bonded particles. A bond is created upon contact and resists both normal and tangential motions until the stress exceeds a critical threshold, at which point the bond breaks. This effectively simulates fracture and crushing in rock and concrete. Once bonding is established, forces and torques are initialized to zero and adjusted incrementally at each time step as follows:
where and .
The bond is broken when the normal and tangential shear stresses exceed predefined values:
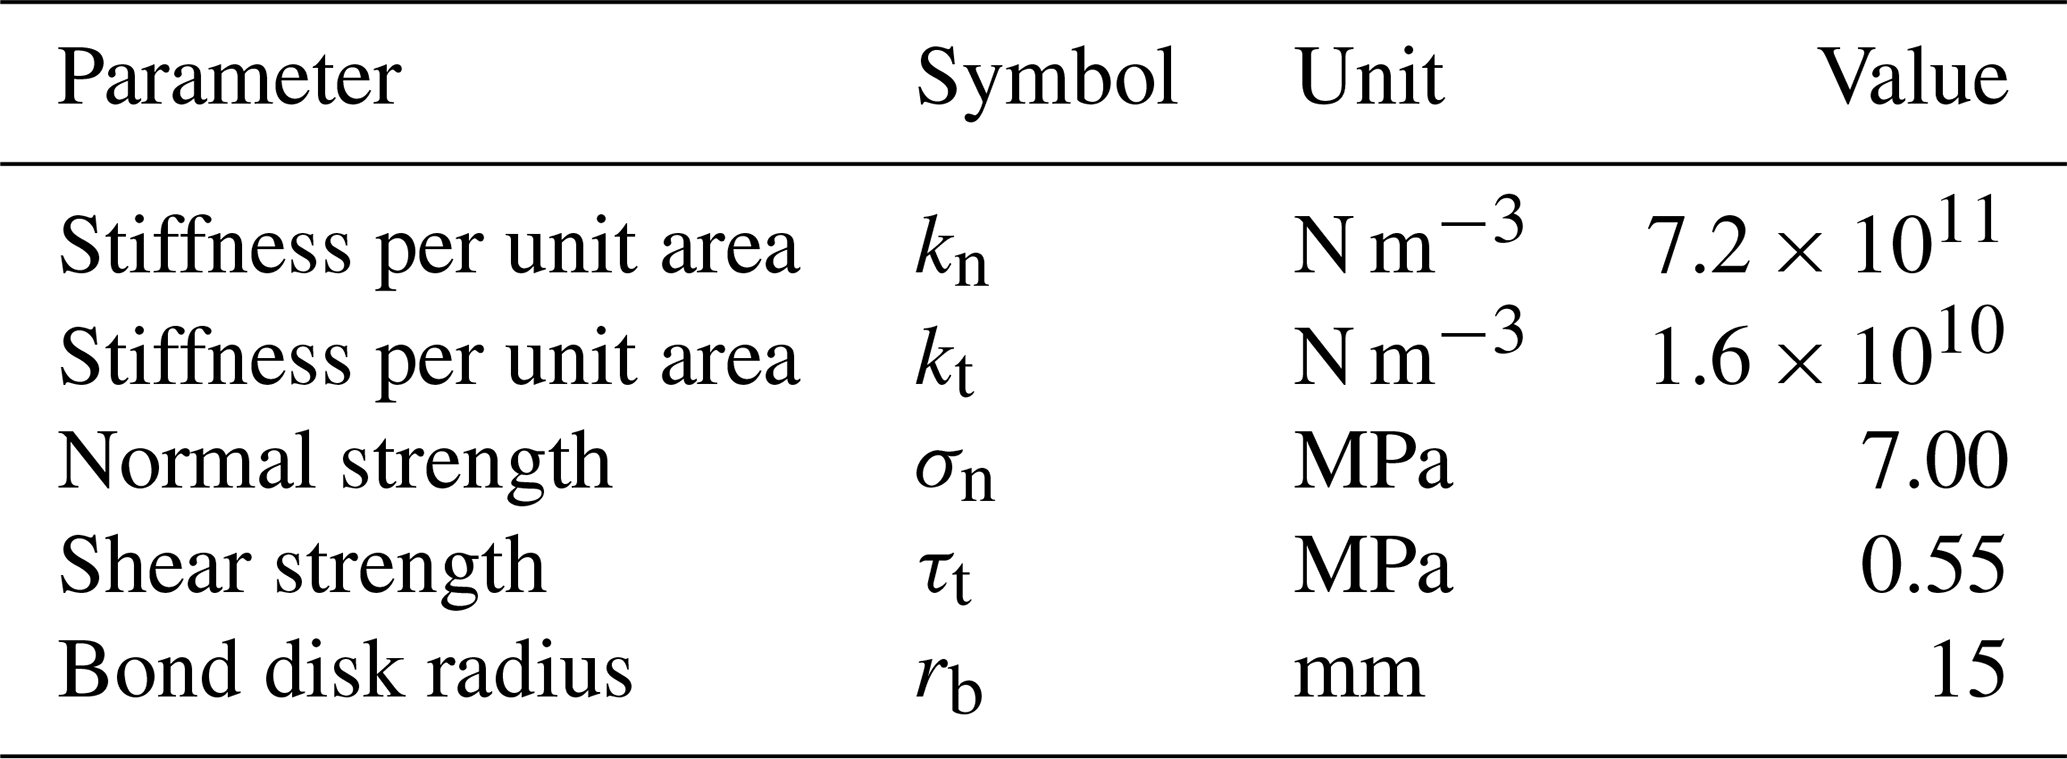
This study uses a soft-rock material with a compressive strength of 2.40 MPa and tensile strength of 0.5 MPa. The key bonding parameters are listed in Table 2 (Tian et al., 2019).
Virtual uniaxial compression and Brazilian splitting tests were conducted to determine the compressive and tensile strengths of the bonded-particle model. Strength is calculated from the force at which the bonded particles fail macroscopically.
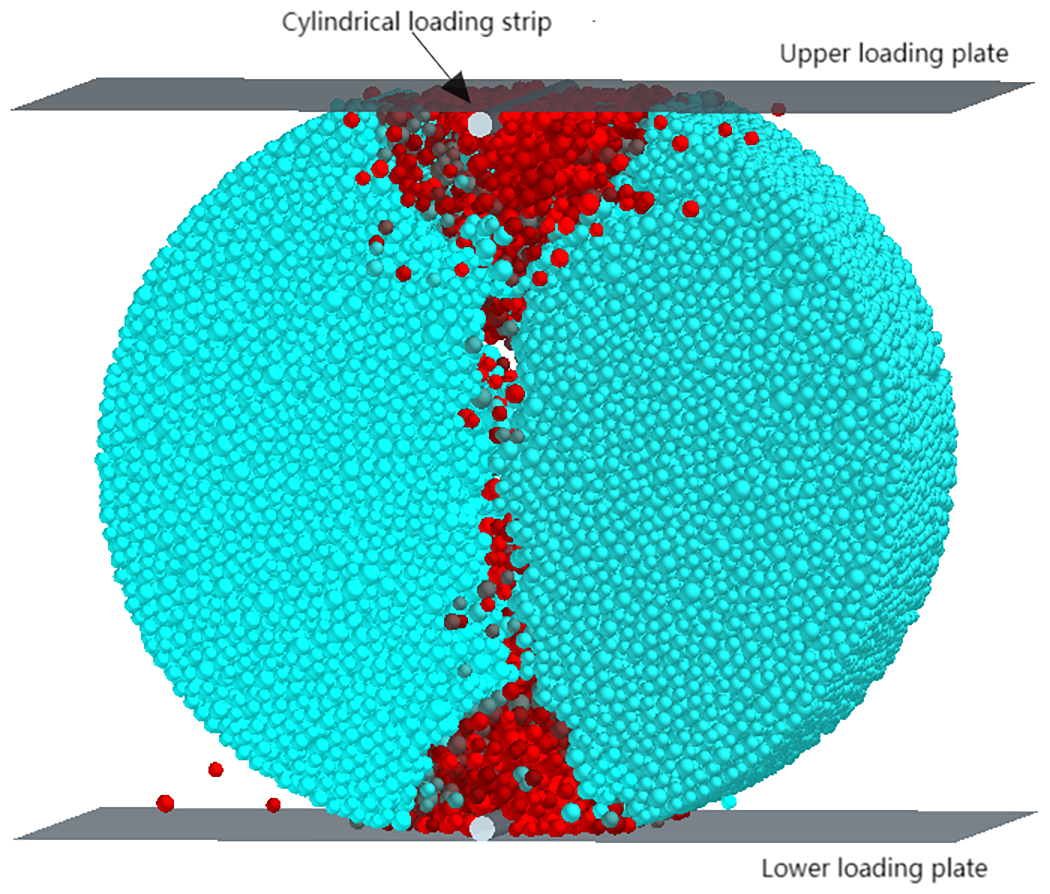
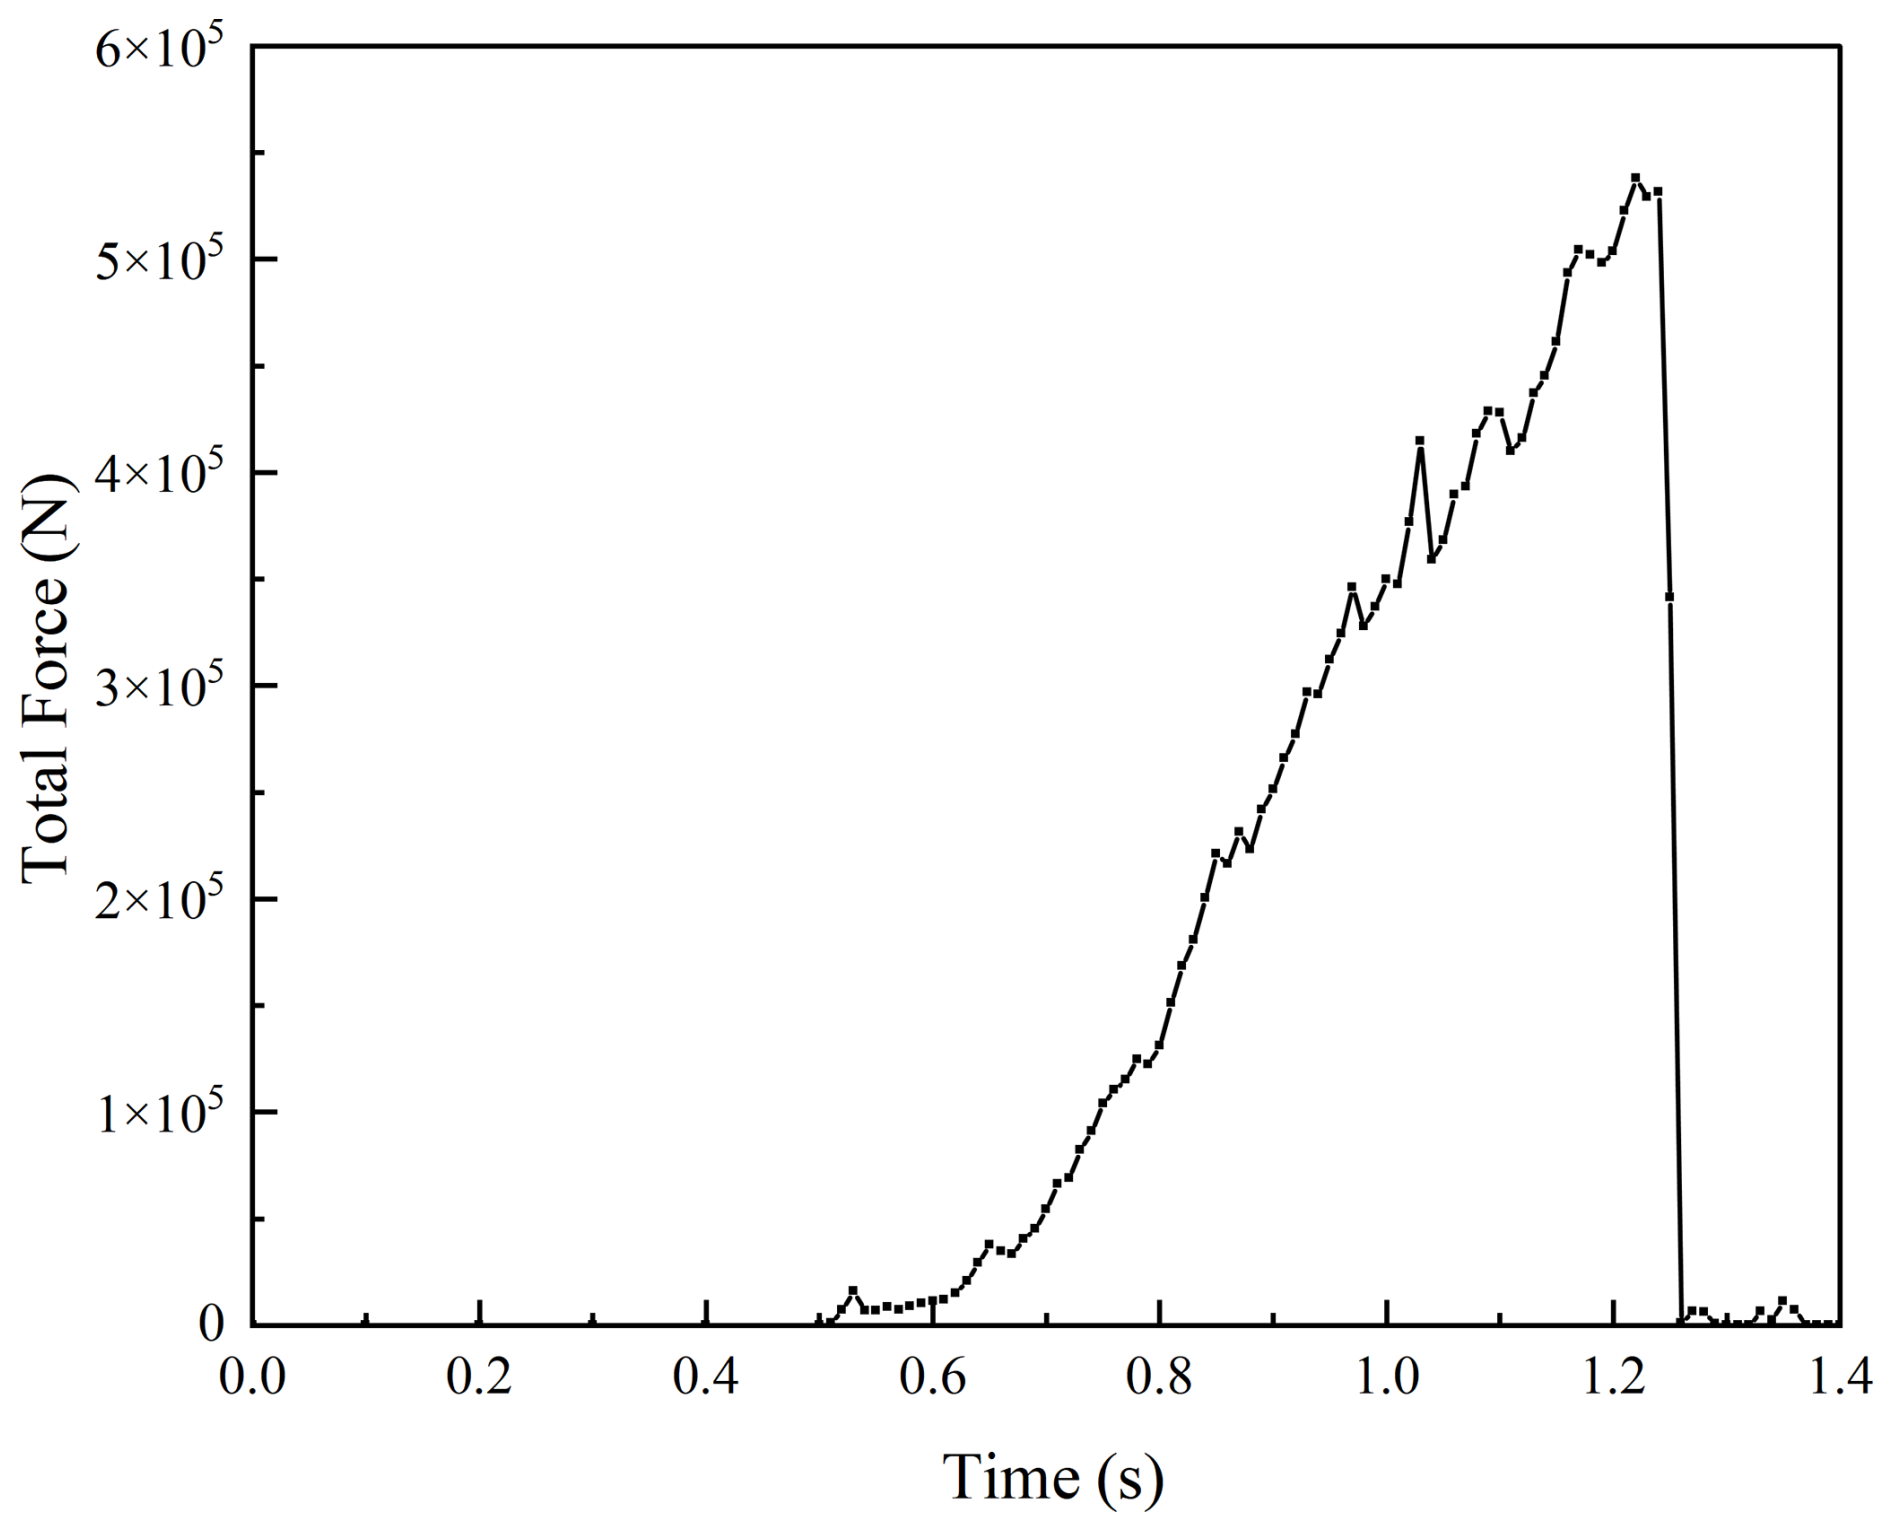
For the Brazilian test, the particle bed was modeled as a 1200 mm diameter, 600 mm thick disk. At t = 0, the upper platen applied pressure at 0.1 m s−1 until the sample split. The schematic and force diagrams are shown in Figs. 2 and 3, respectively.
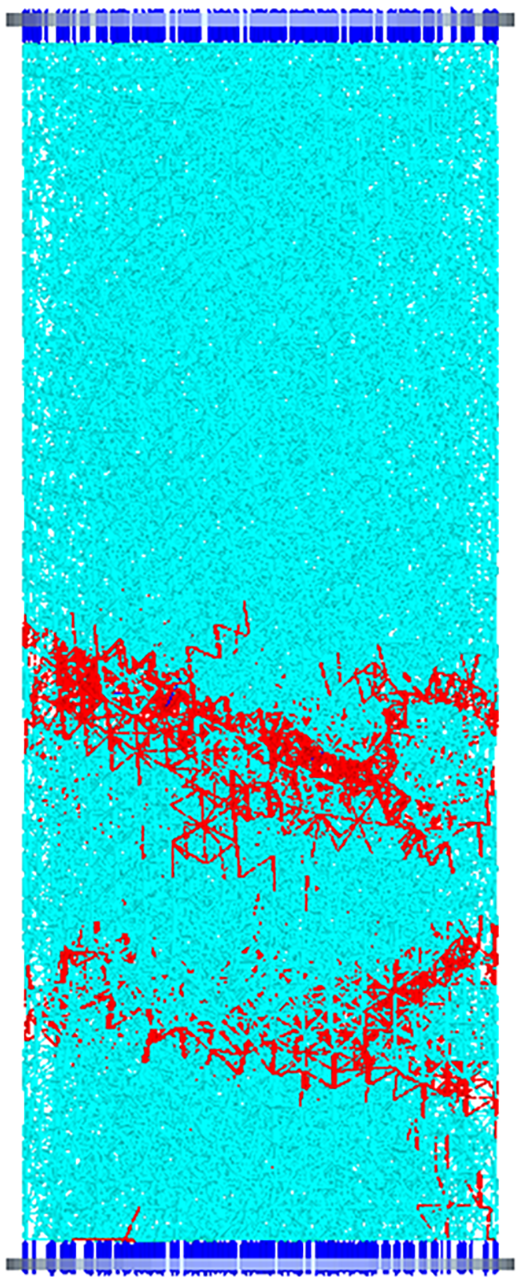
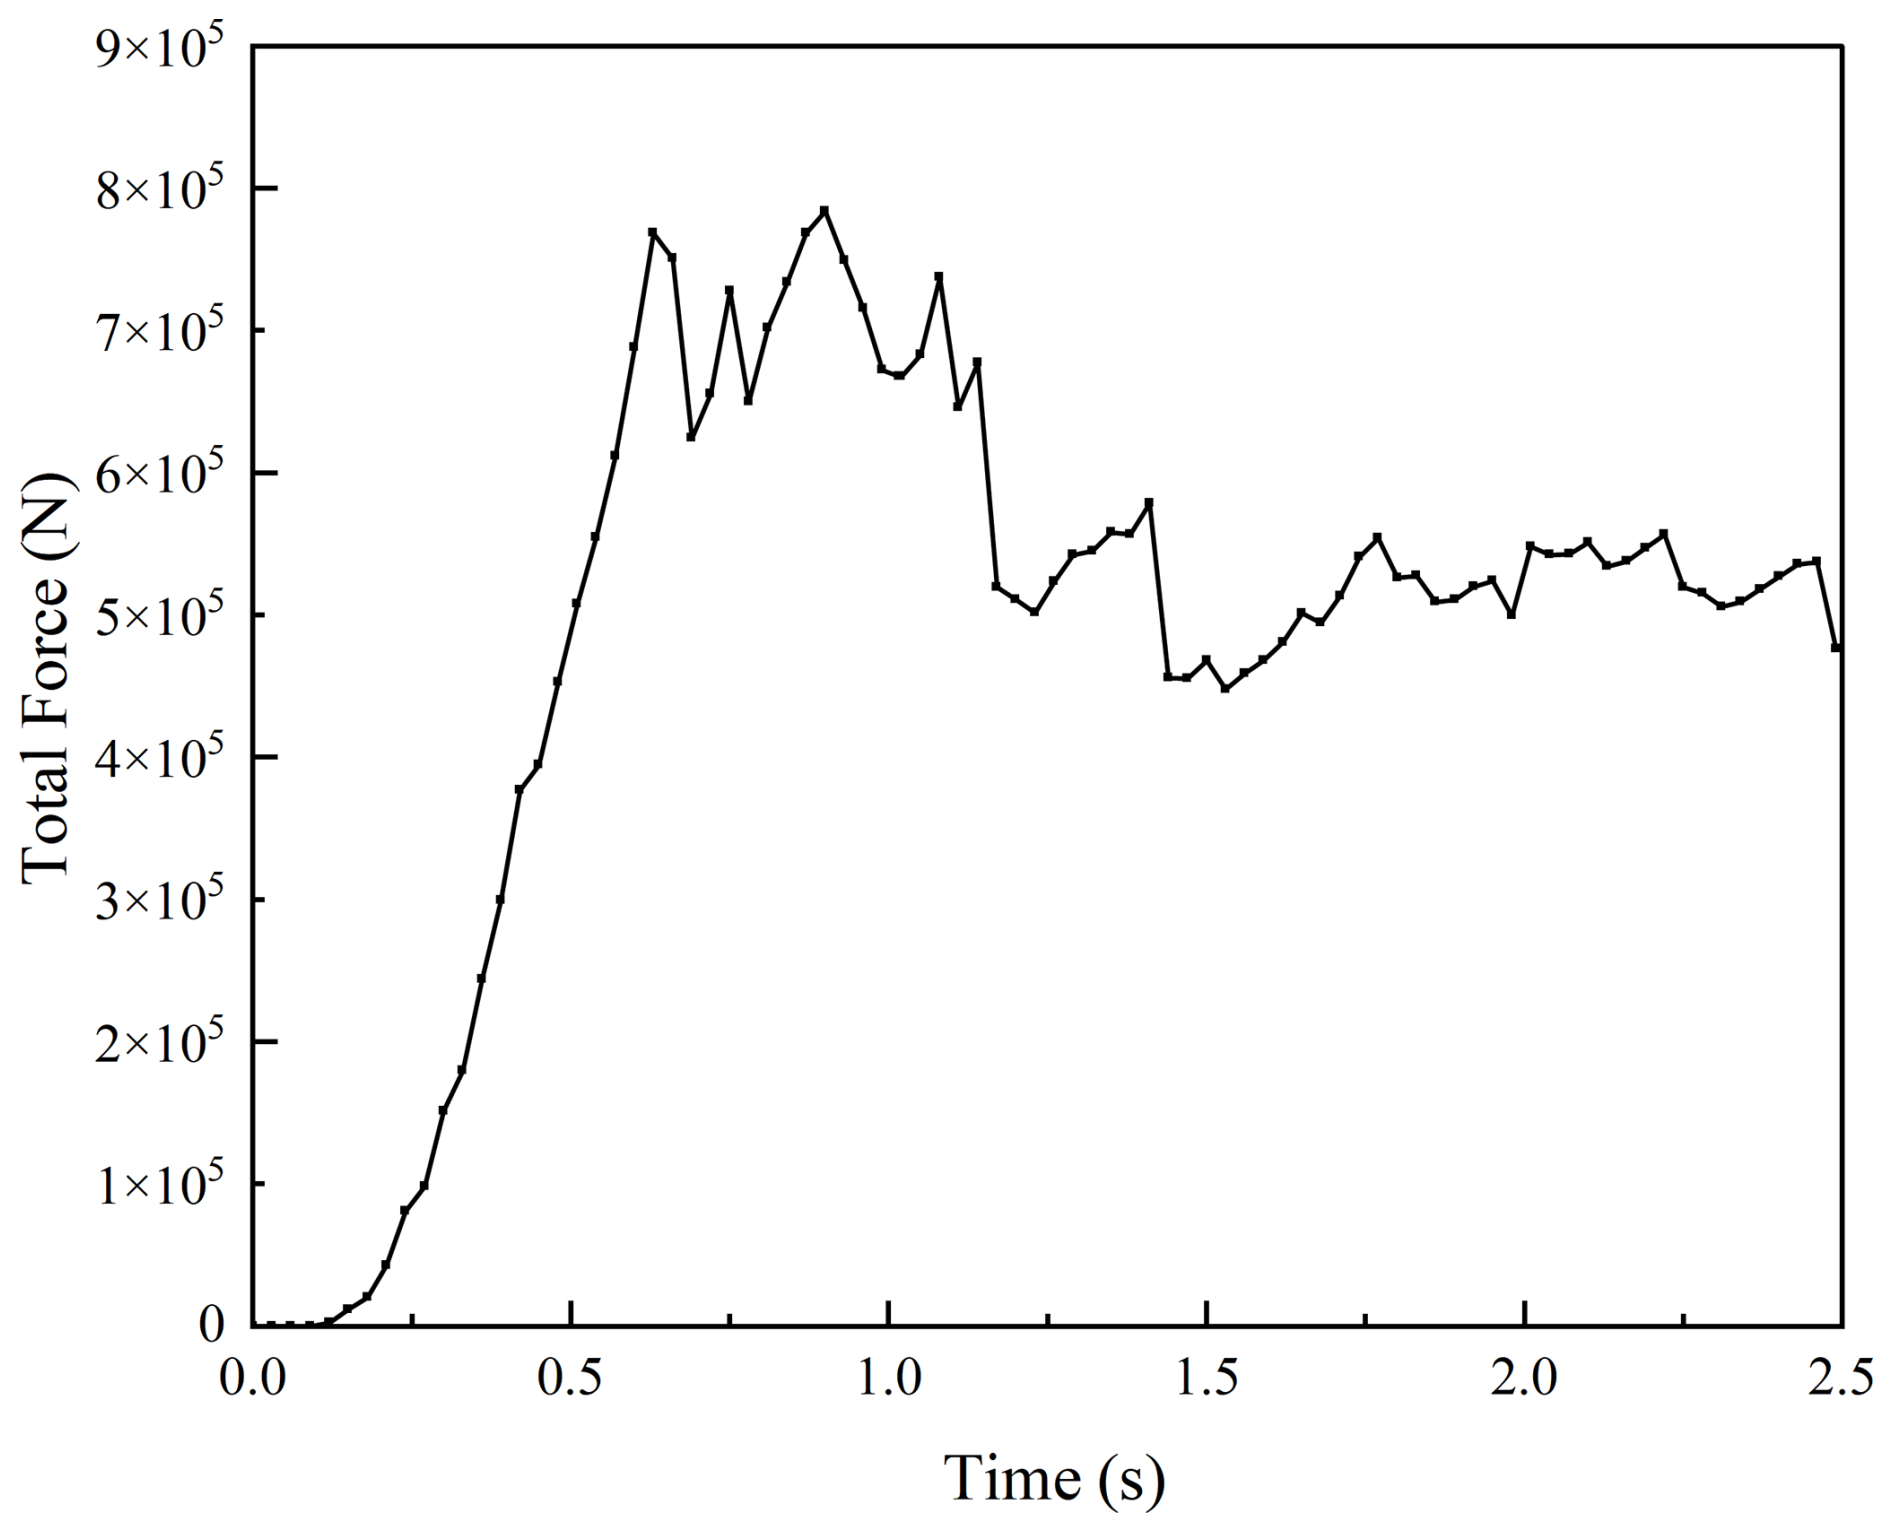
The uniaxial compression test used a cylinder with a 350 mm radius and 1600 mm height. At t = 0, the upper platen compressed the sample downward at 0.01 m s−1 until failure. The virtual uniaxial compression simulation showed that bond breakage was first initiated in the central region of the specimen and gradually propagated along an inclined plane, forming a typical shear failure pattern consistent with the failure mode observed in the physical uniaxial compression test.The resulting damage schematic and force diagrams are shown in Figs. 4 and 5.
The compressive and tensile strengths were calculated by substituting the peak platen forces into the following equations:
The calculated uniaxial compressive strength is 2.11 MPa, and the Brazilian splitting strength is 0.47 MPa. These values meet the required strength criteria for soft-rock simulation, indicating that the parameter calibration is complete.
3.3 Archard wear model
The Archard wear model is a contact model that extends the base interaction model to estimate the depth of wear on geometric surfaces. Developed by John F. Archard in 1953, the model is based on the principle that the volume of material removed from a surface is proportional to the frictional work performed by particles sliding over it. The model defines wear depth using Archard's equation, which incorporates both frictional energy and the geometric characteristics of the surface. Archard's equation is expressed as follows:
where Q is the volume of material removed, dt is the tangential distance traveled, and W is the wear constant initially defined as
where K is a dimensionless constant, and H is the hardness measure of the softest surface (based on Vickers hardness in Pa). This was reduced to a single wear constant for ease of use in EDEM.
As the equations predict volumetric material removal, they are rearranged in the software to yield wear depth at each computational cell.
In the EDEM software, we set the wear constant W in Pa−1. In this study, given the limited cutting time, the actual wear generated is minimal and difficult to quantify experimentally. Therefore, the wear constant W = 1 × 10⁻¹² was selected based on literature research to enable qualitative analysis of the cutter's wear behavior.
4.1 Establishment of rock particle beds
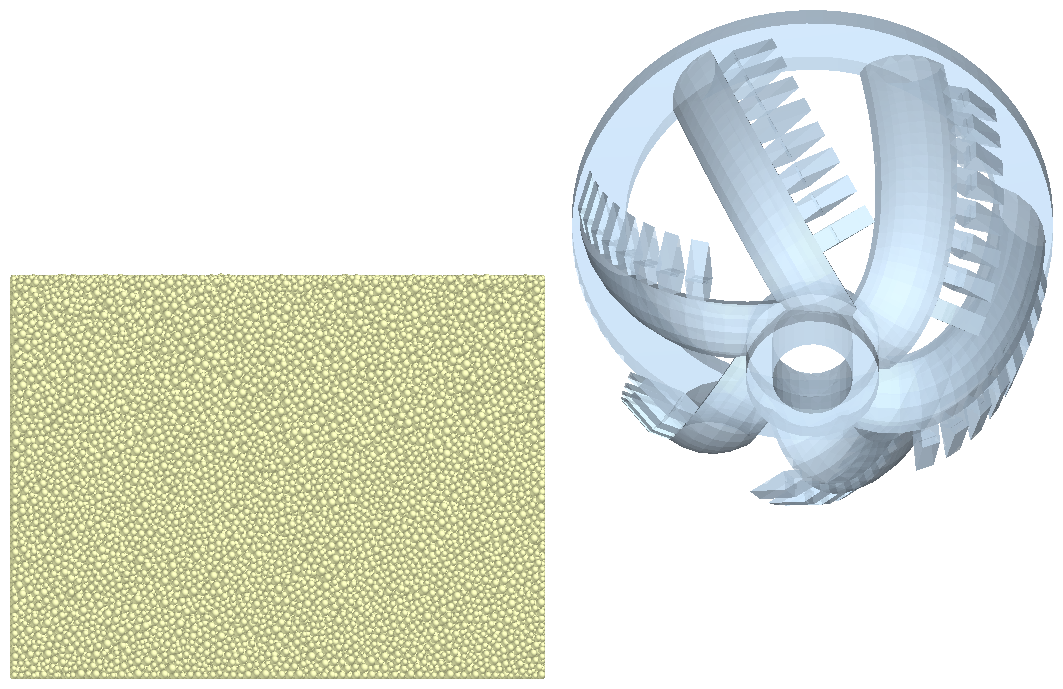
For the EDEM particle bed generation, spherical particles were used to simplify calculations. The particle radius was set to 15 mm with a standard deviation of 0.5 under a normal distribution, producing particles ranging from 11.25 to 18.75 mm. The bonding contact radius was set to 20 mm. The particle bed dimensions were 2 m (length) × 1.5 m (width) × 1.5 m (height). A total of 199 813 particles were generated using dynamic particle generation.
The cutter model, designed in SolidWorks (Sect. 1), was imported into EDEM. Material properties were defined as follows: Poisson's ratio = 0.3, density = 7800 kg m−3, shear modulus = 8 × 10¹⁰ Pa, and Young's modulus = 2.08 × 10¹¹ Pa. The cutter and cutter teeth were positioned appropriately. The initial position is shown in Fig. 6.
4.2 Simulation parameter settings
Before conducting the numerical simulation of cutter–rock interaction, it is necessary to appropriately define the simulation domain and related computational parameters to ensure both accuracy and efficiency. The setup mainly includes (1) defining the cutter motion, (2) determining the simulation domain, (3) specifying the total simulation time and time step, (4) setting the data output frequency, and (5) defining the mesh size.
-
Setting the motion state of the cutter head. After importing the cutter-head model, linear translation and rotation were applied to define its motion. The “move-with-body” option was enabled for the rotational motion to ensure that the rotation axis followed the cutter body, and appropriate transverse velocity and rotational speed were assigned according to actual operating conditions.
-
Determination of the simulation domain. The size of the simulation domain has a significant influence on computational efficiency and result accuracy. An excessively large domain increases the computational cost, while an overly small one may cause particles to escape from the boundaries, leading to unrealistic results. Since the cutting process of the cutter head proceeds continuously, an auto-capture approach was adopted in this study to dynamically adjust the simulation domain during cutting.
-
Time step and total simulation time. In EDEM, the time step is defined as a fraction of the Rayleigh time step to ensure numerical stability. In this study, the time step was set to 5 % of the Rayleigh time, corresponding to 6.7 × 10⁻⁷ s, and the total simulation time was set to 7 s. These values provide a good balance between computational accuracy and stability.
-
Data output frequency. The data output frequency determines the temporal resolution of the recorded data during simulation. A very small output interval increases storage requirements, whereas a large interval reduces the accuracy of the results. Considering both precision and computational efficiency, the data output interval was set to 0.1 s.
-
Definition of mesh size. During the discrete element simulation, the computational domain is discretized into grids for contact detection and force calculation. The mesh size directly affects both numerical accuracy and computational speed. In this study, the mesh size was defined as 3Rmin, where Rmin is the minimum particle radius, which ensures a suitable balance between accuracy and efficiency.
4.3 Visualization of the cutter cutting process
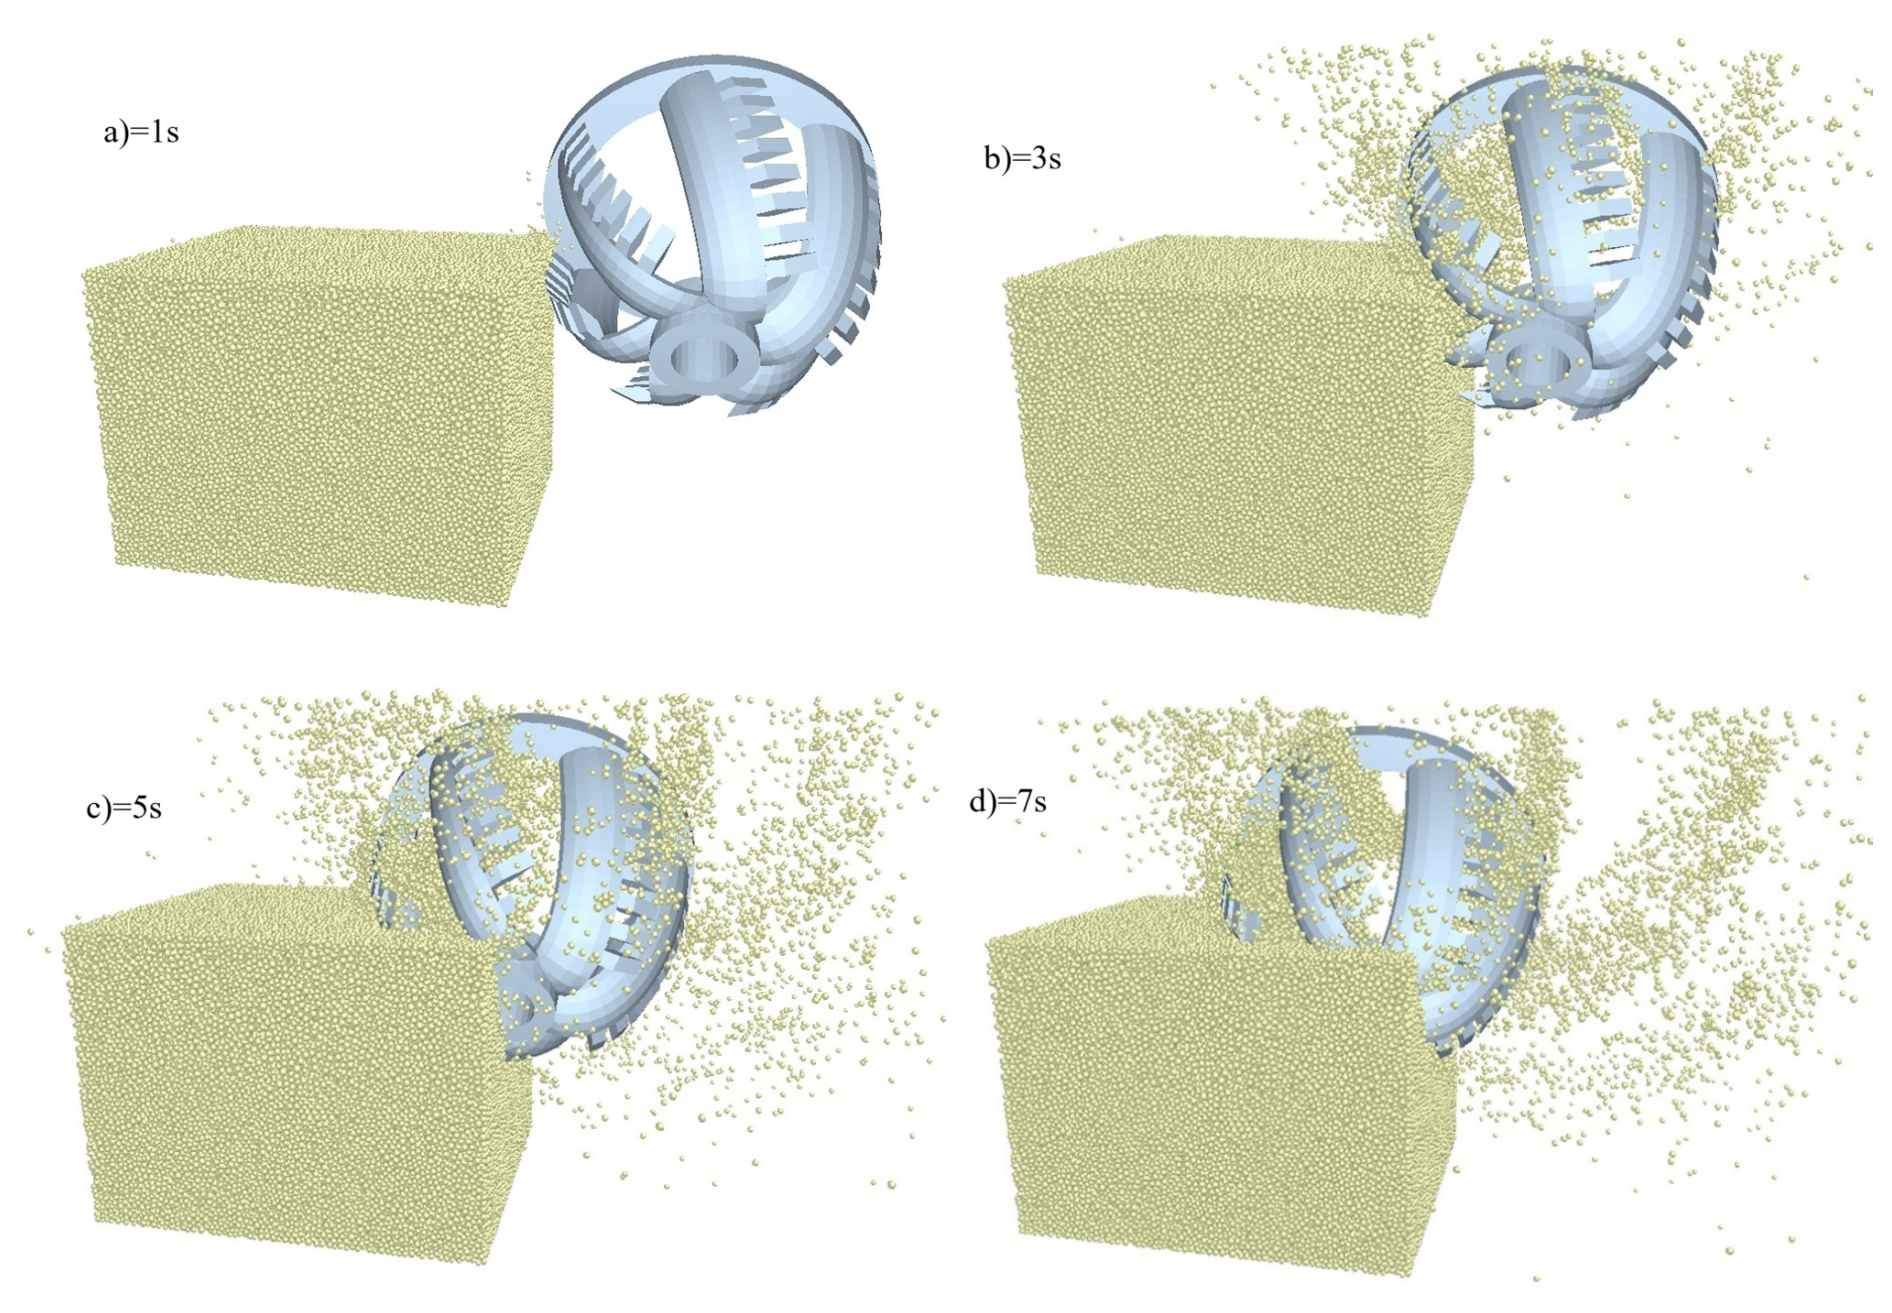
At 0.8 s, the cutter begins reverse cutting as it contacts the particle bed. As the cutter rotates, it applies force to the bed, breaking the bonds between particles. The rock material beneath the cutter teeth fractures into varying fragment sizes. Some unbroken bonded regions cause rock particles to be ejected outside the cutter's envelope, while others are retained inside the cutter arms. To guide debris flow for subsequent removal, the cutting process continues until 7 s, ensuring each cutter arm completes at least two full cutting cycles. The cutting process is illustrated in Fig. 7.
5.1 Cutter teeth wear
With a traverse speed of 0.2 m s−1, rotational speed of 30 rpm, and cutting angle of 30°, eight cutter teeth on one cutter arm were selected for wear analysis. The wear of cutter teeth no. 1 through no. 8 is shown in Fig. 8. The maximum wear per tooth is shown in Table 3. Each tooth exhibits a stepped wear pattern due to simultaneous engagement with the rock. Friction between the rock and teeth increases cutting force, leading to rapid wear until the rock fractures. Once broken, the cutter tooth force drops sharply, and the wear curve flattens.
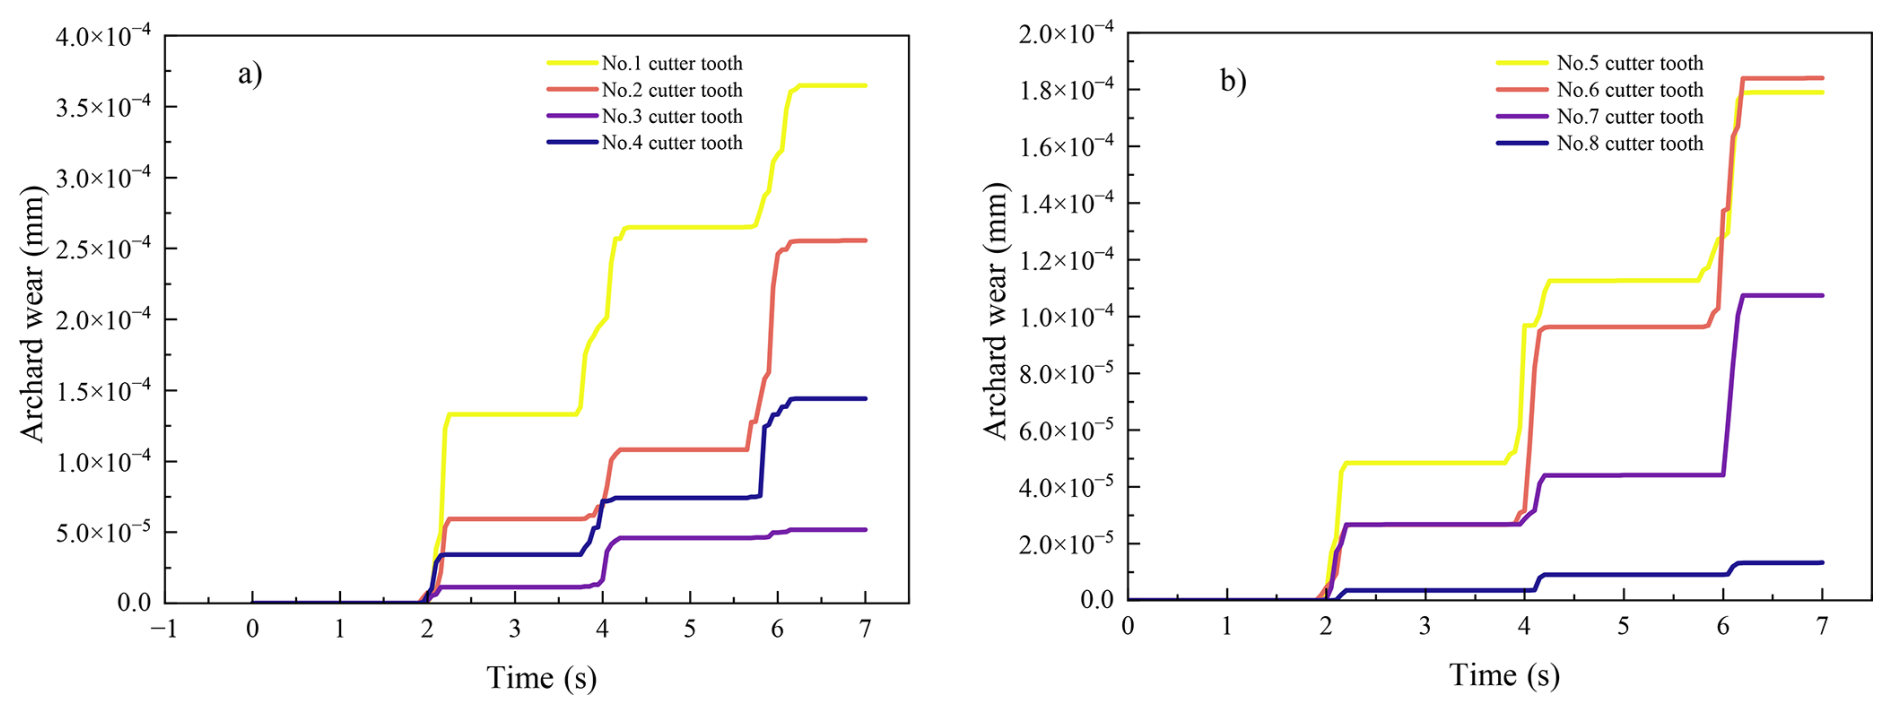
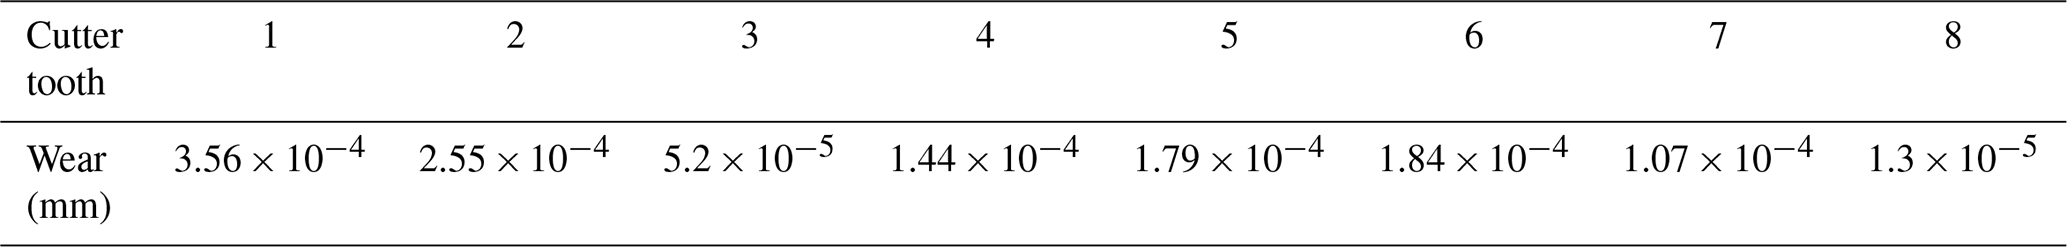
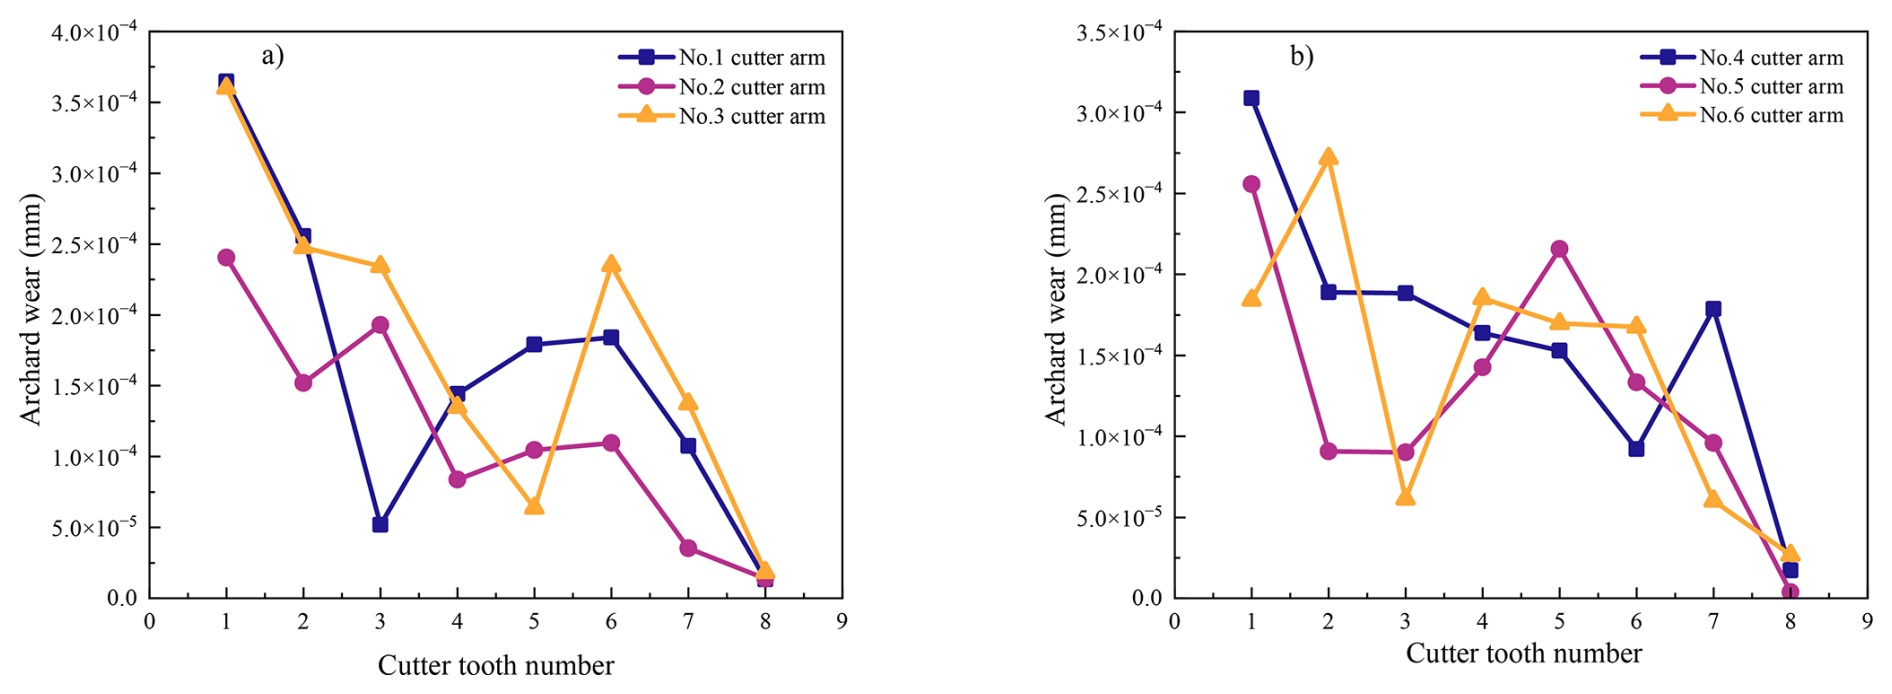
Quantitative analysis of the wear gradient distribution reveals that tooth no. 1, located near the hub, experiences the most wear (average thickness loss on the front/side/rear flanks: 3.56 × 10⁻⁴ mm), while tooth no. 8, located near the outer ring, shows the least wear (average thickness loss: 1.3 × 10⁻⁵ mm) – a nearly 30-fold difference. This aligns with real-world wear behavior. Teeth on the outer ring experience lower contact angles and shallower cuts, which reduce abrasive and adhesive wear. In contrast, hub-side teeth encounter larger cutting angles and deeper cuts, altering the direction of resultant cutting forces. This increases interface friction and prolongs cutting time, intensifying deformation and wear diffusion. Wear results for all six cutter arms are presented in Fig. 9, confirming the consistent pattern of greatest wear at the hub side and the least wear at the outer ring. These findings suggest that hub-side teeth require closer monitoring and timely replacement.
5.2 Knife tooth contact mechanism
The Relative Wear model in EDEM identifies regions of high-impact (normal) and abrasive (tangential) wear by analyzing relative velocity and contact forces between particles and geometry. While EDEM does not calculate an absolute material removal rate, forward and tangential cumulative contact energies provide insight into wear intensity. These values represent energy from direct particle impacts and sliding along the surface, respectively. In this study, the forward and tangential cumulative contact energies for the most worn cutter tooth were extracted to analyze the wear mechanism. A comparative energy profile is shown in Fig. 10.
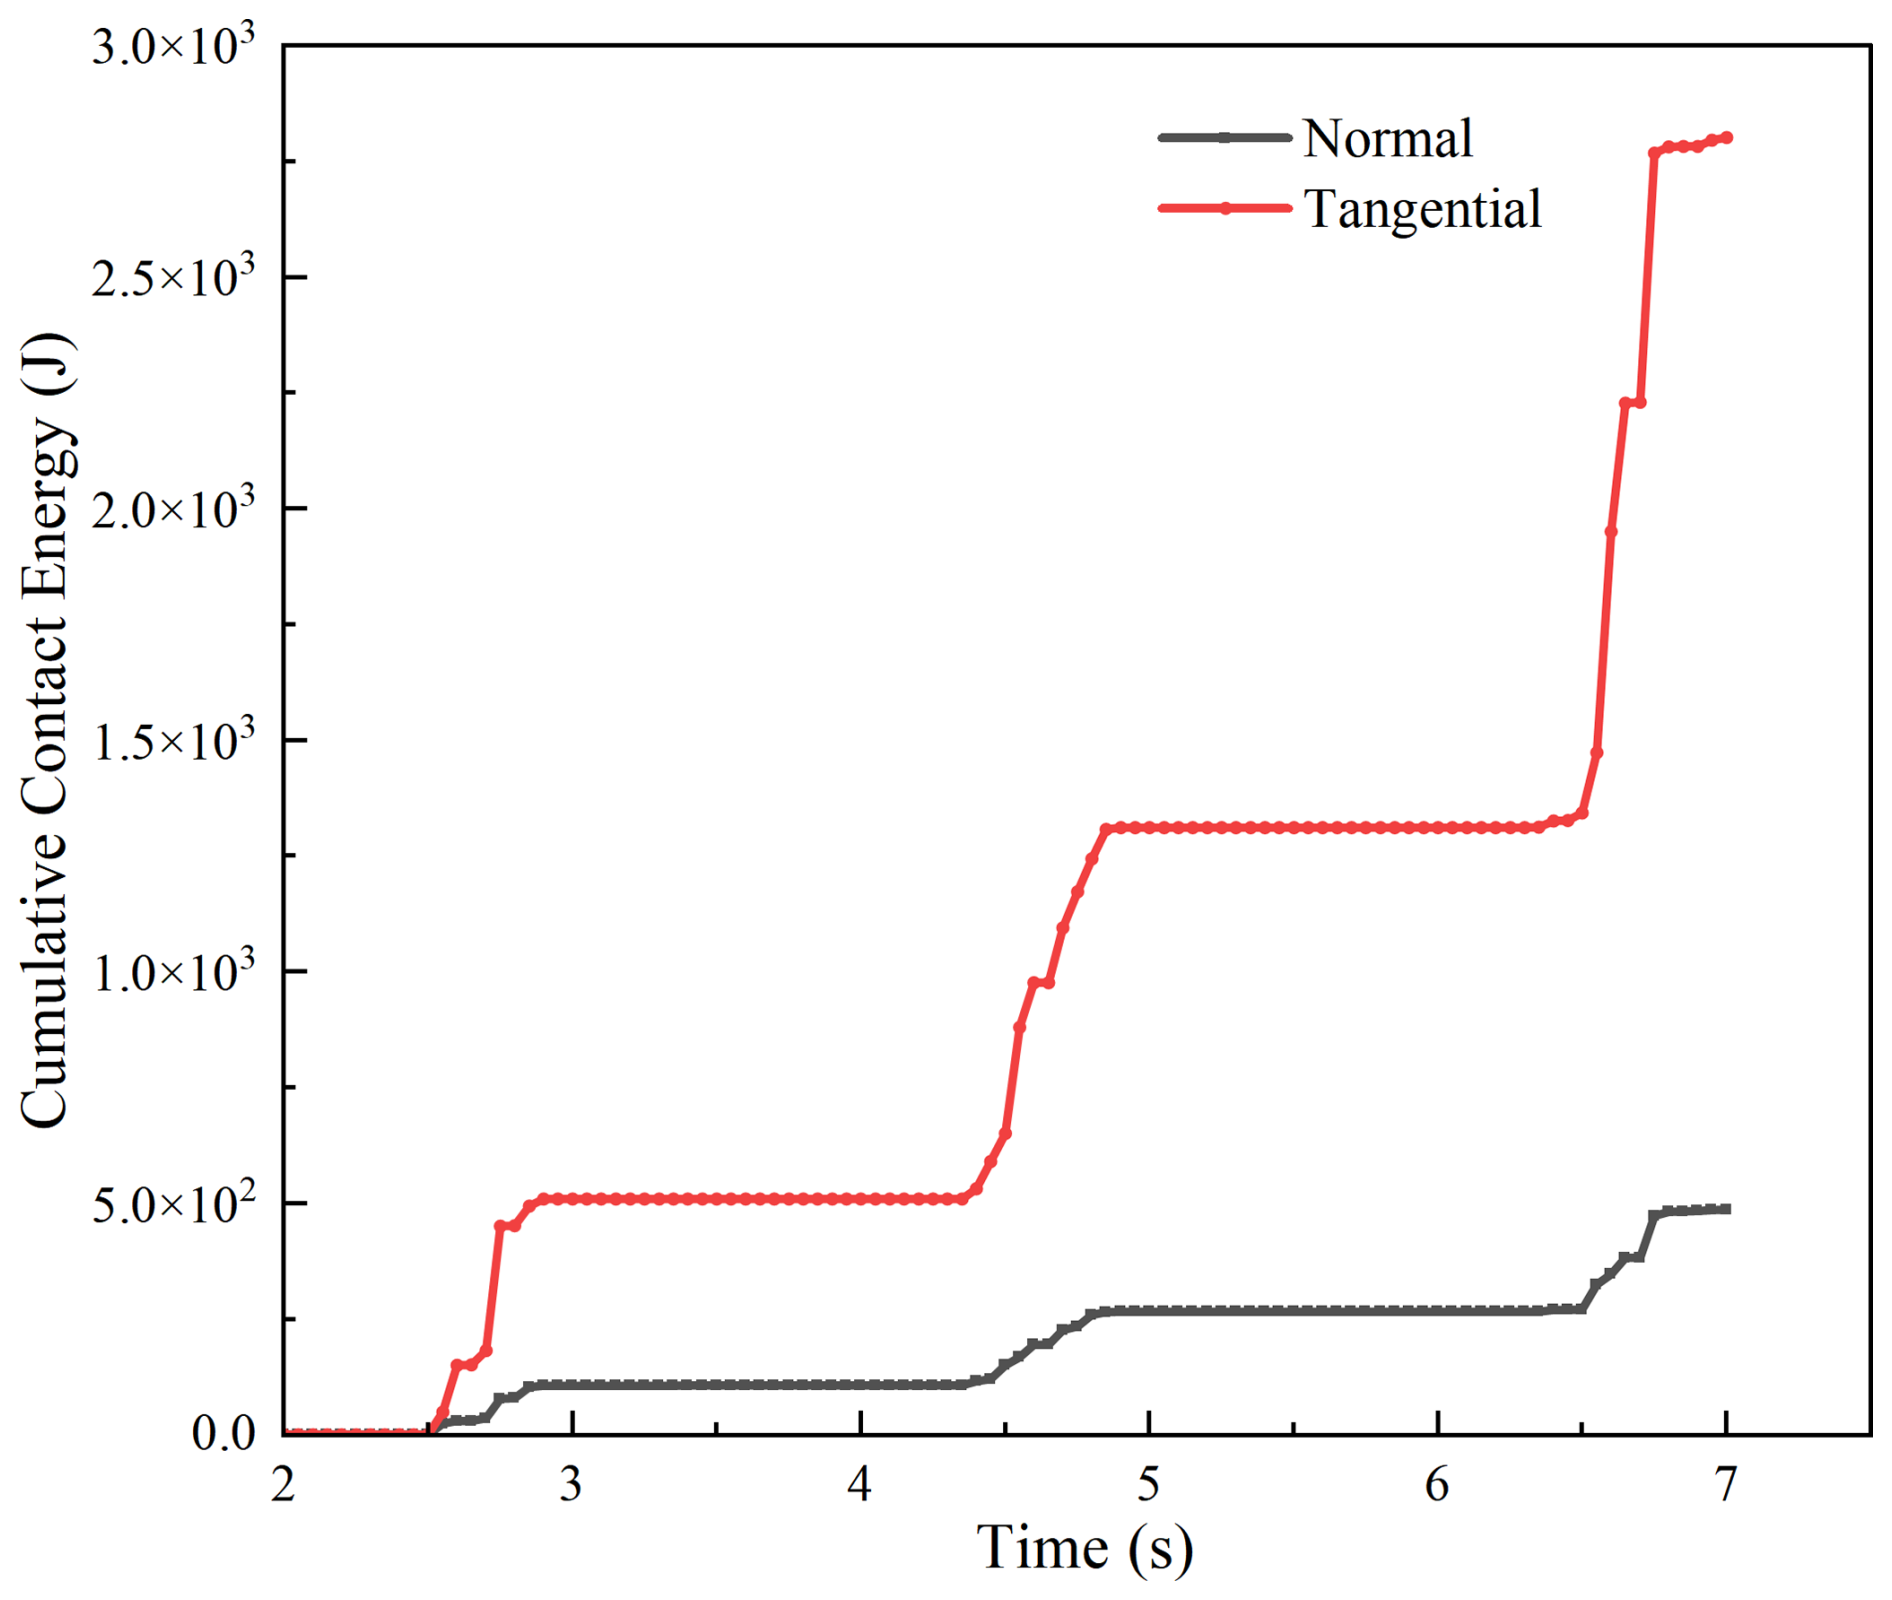
The interaction force between the rock and cutter tooth surface can be decomposed into normal force (N) and tangential force (T). The normal force presses the material into the tooth surface, while the tangential force causes it to slide along the surface, generating wear. As shown in the figure, tangential cumulative contact energy exceeds forward energy, indicating that chisel-type abrasive wear is the dominant wear mode. This is consistent with microscopic cutting mechanisms. Similar wear energy patterns were verified for the other cutter teeth.
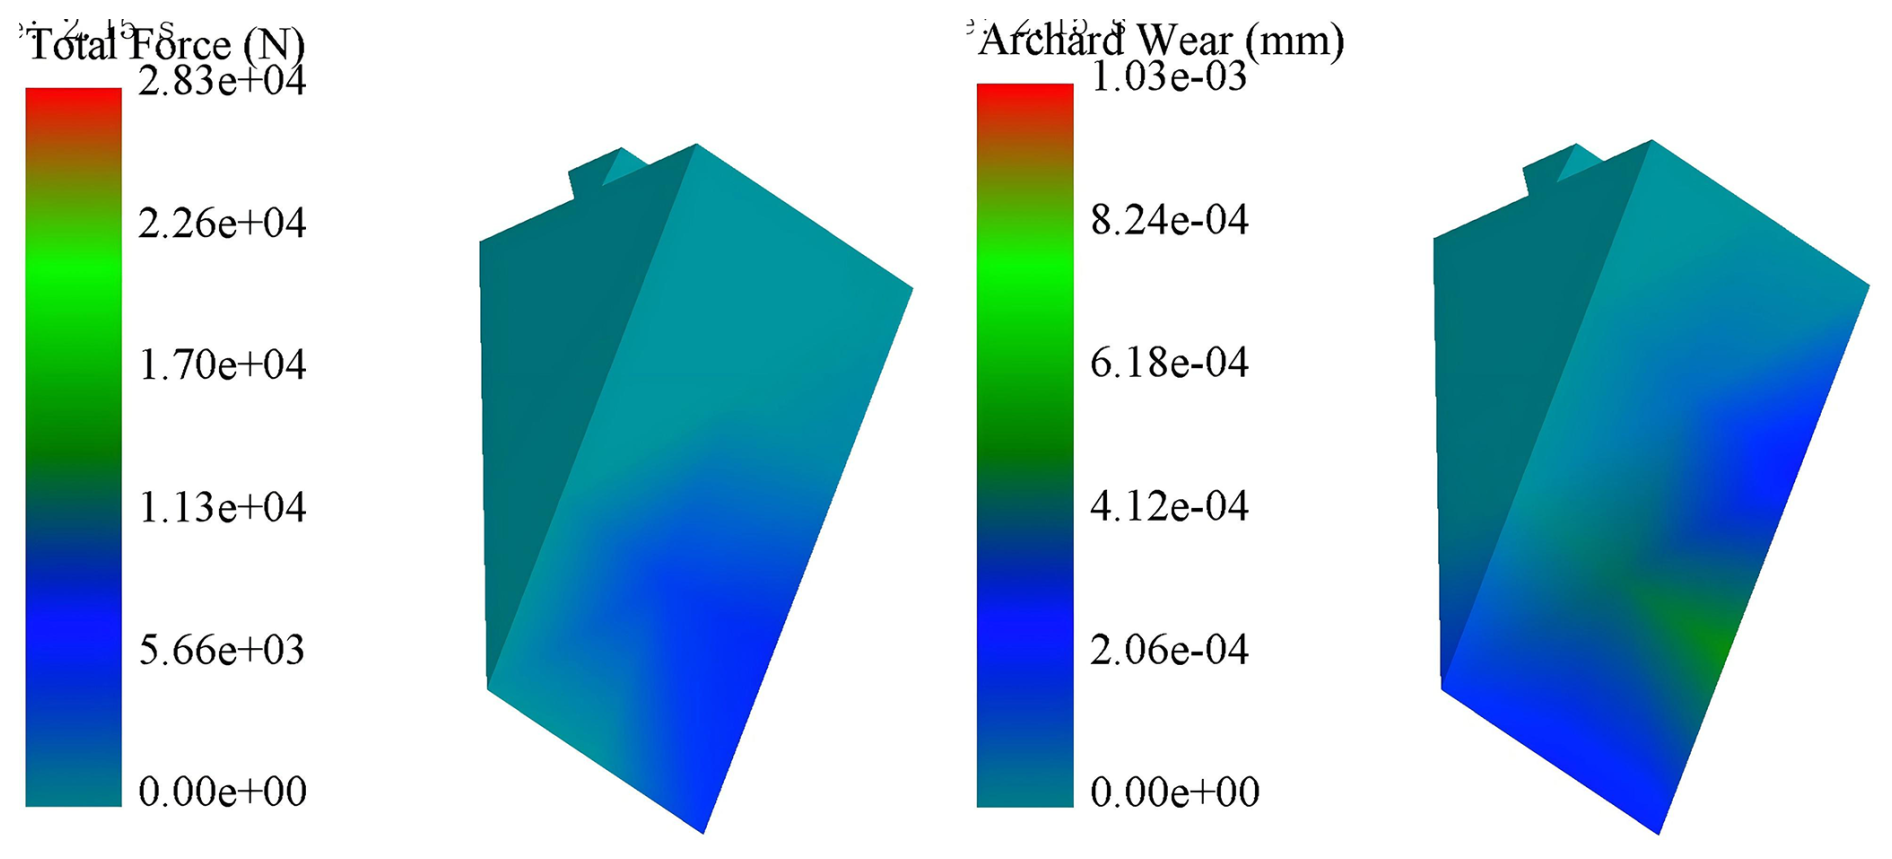
During post-processing, the moment of maximum cutter tooth engagement was selected, and both force and wear distribution maps were extracted (Fig. 11). These reveal that regions experiencing higher forces closely align with areas of severe wear, particularly at the tooth tip and the lower side. Wear on the upper surface of the tooth was also found to be more pronounced than on the lower surface.
5.3 Cutter rock-cutting force and torque analysis
In the above study, the force and wear of the cutter were analyzed under conditions of a traverse speed of 0.2 m s−1, a rotational speed of 30 rpm, and a cutting angle of 30°. In the post-processing stage, the total cutting force and torque of the cutter were examined. These are shown in Fig. 12. During the rock-cutting process, fractured rock pieces detach from the surface, causing the force and torque values to exhibit pronounced oscillations and intermittent zeros. As the cutting deepens, the cutter engages more fully with the material, resulting in a gradual increase in force, consistent with realistic cutting conditions.
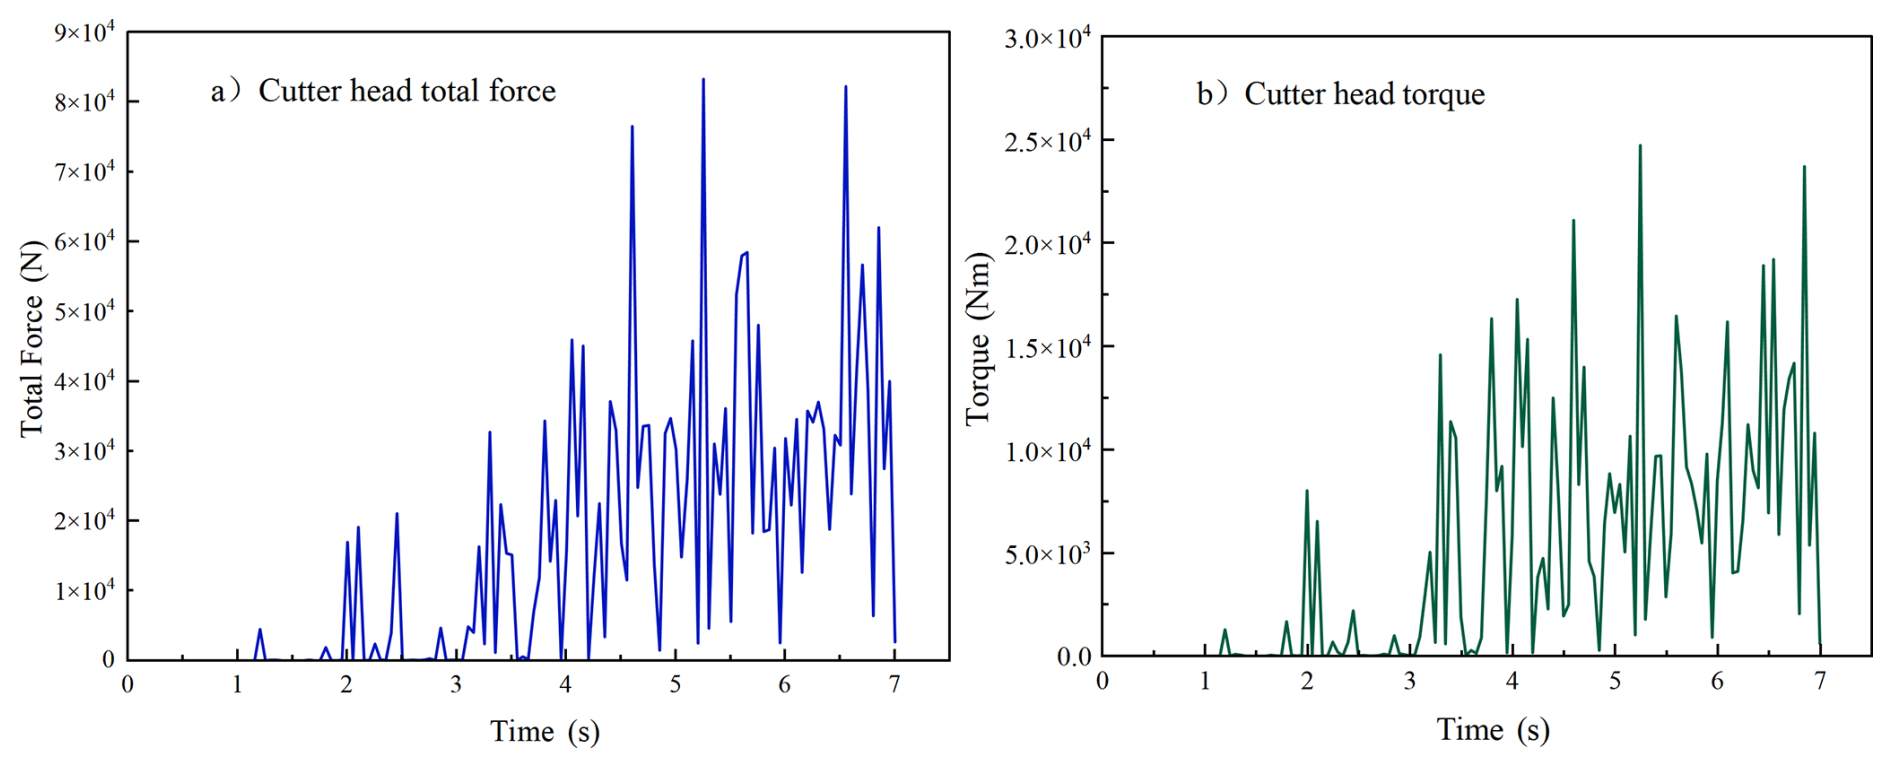
For soft rock with a compressive strength of 2.40 MPa and a tensile strength of 0.5 MPa, experimental studies by Zhang et al. (2018) report an average cutting torque of 5464 Nm. The average simulated torque in this study is 6093.3 Nm, with a relative error of 11 %, indicating good agreement between the simulation results and experimental data.
5.4 Analysis of cutter cutting under different working conditions
In practical dredger operations, cutter parameters must be adjusted according to working conditions. These include traverse speed, rotational speed, and cutting angle, all of which significantly influence cutting force and torque. In this section, the impact of these parameters is analyzed by varying them individually to explore their effects and to identify general trends.
The selection of working condition parameters was based on typical operating ranges of cutter suction dredgers in soft-rock dredging projects, as reported in engineering practice and previous studies. To ensure the representativeness and practical relevance of the simulations, traverse speeds of 0.15–0.3 m s−1, rotational speeds of 20–40 rpm, and cutting angles of 20–40° were adopted. These ranges correspond to the common operating conditions under moderate soil resistance, allowing for a comprehensive analysis of the influence of each parameter on cutter forces, torque, and energy consumption.
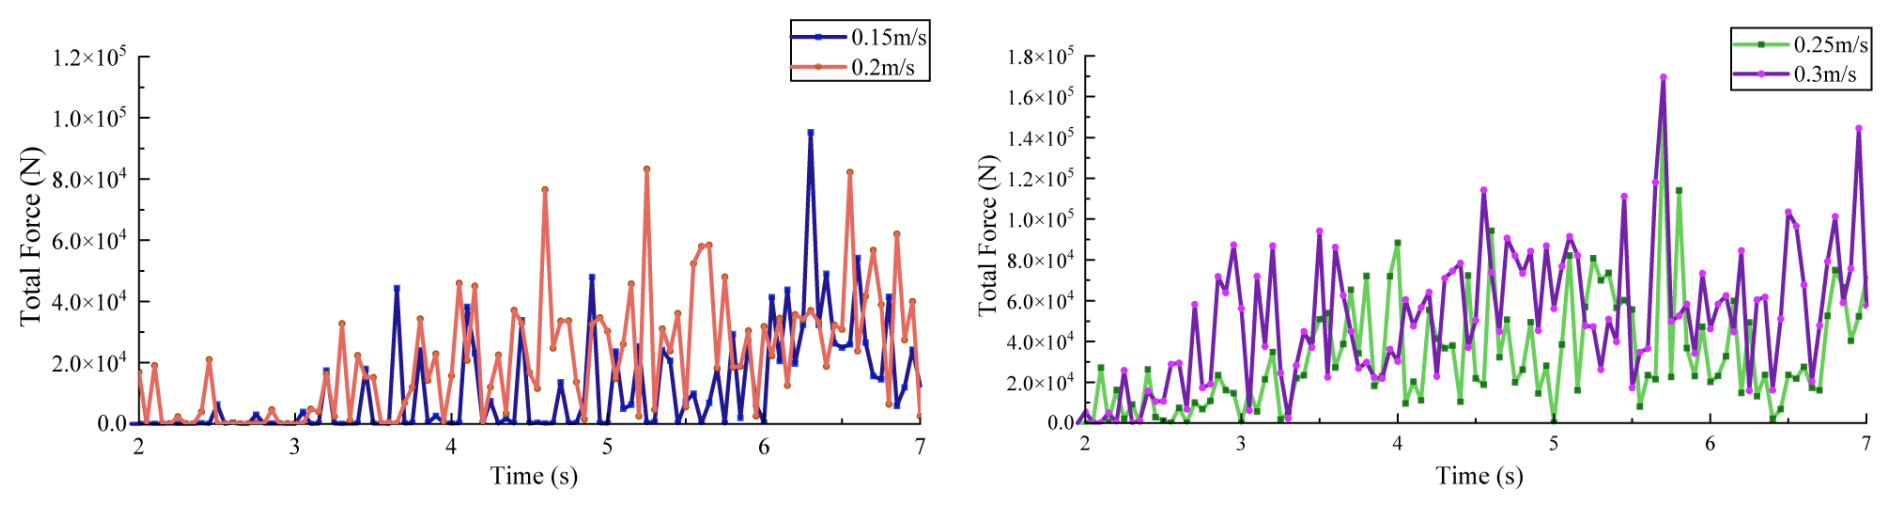
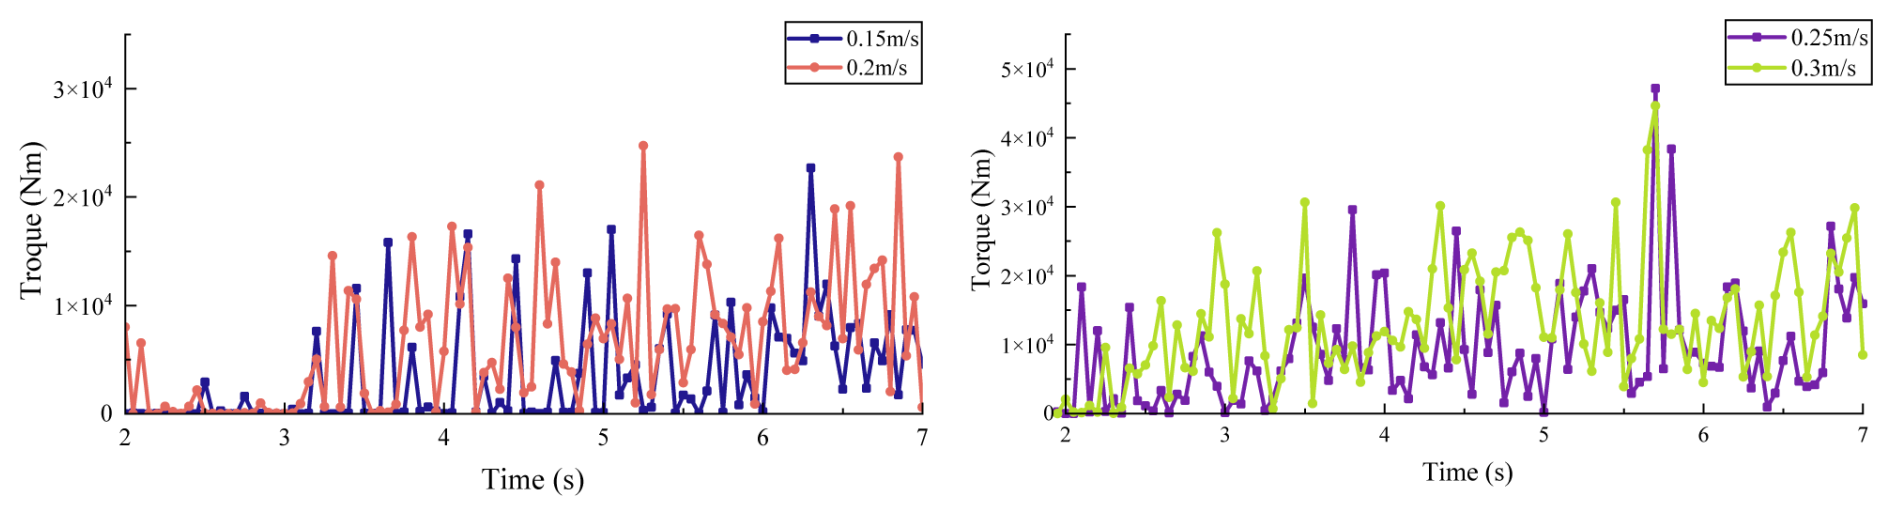
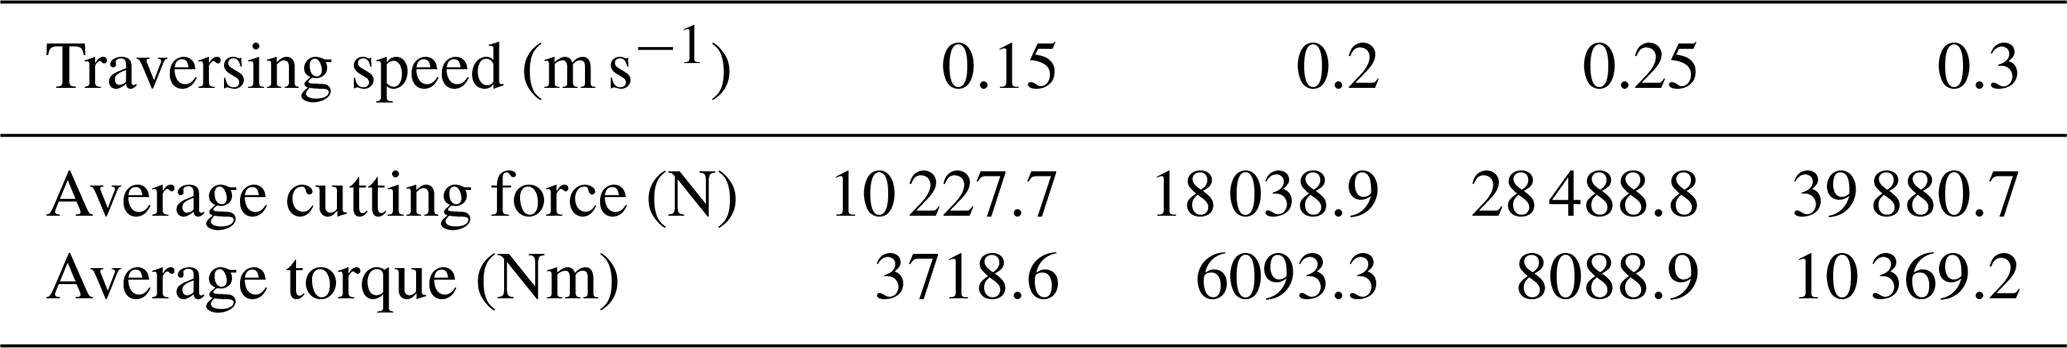
Table 4Average total force and torque of the cutter at different speeds.
First, keeping the cutter's rotational speed fixed at 30 rpm and the cutting angle at 30°, the traverse speed was varied across four values: 0.15, 0.2, 0.25, and 0.3 m s−1. Simulations were conducted, and data from 2 s onward (when the cutter fully engages with the rock) were analyzed. Figure 13 presents the cutting force at different traverse speeds, Fig. 14 shows the corresponding torque, and Fig. 15 summarizes the average values. The average total force and torque of the cutter at different speeds are shown in Table 4.
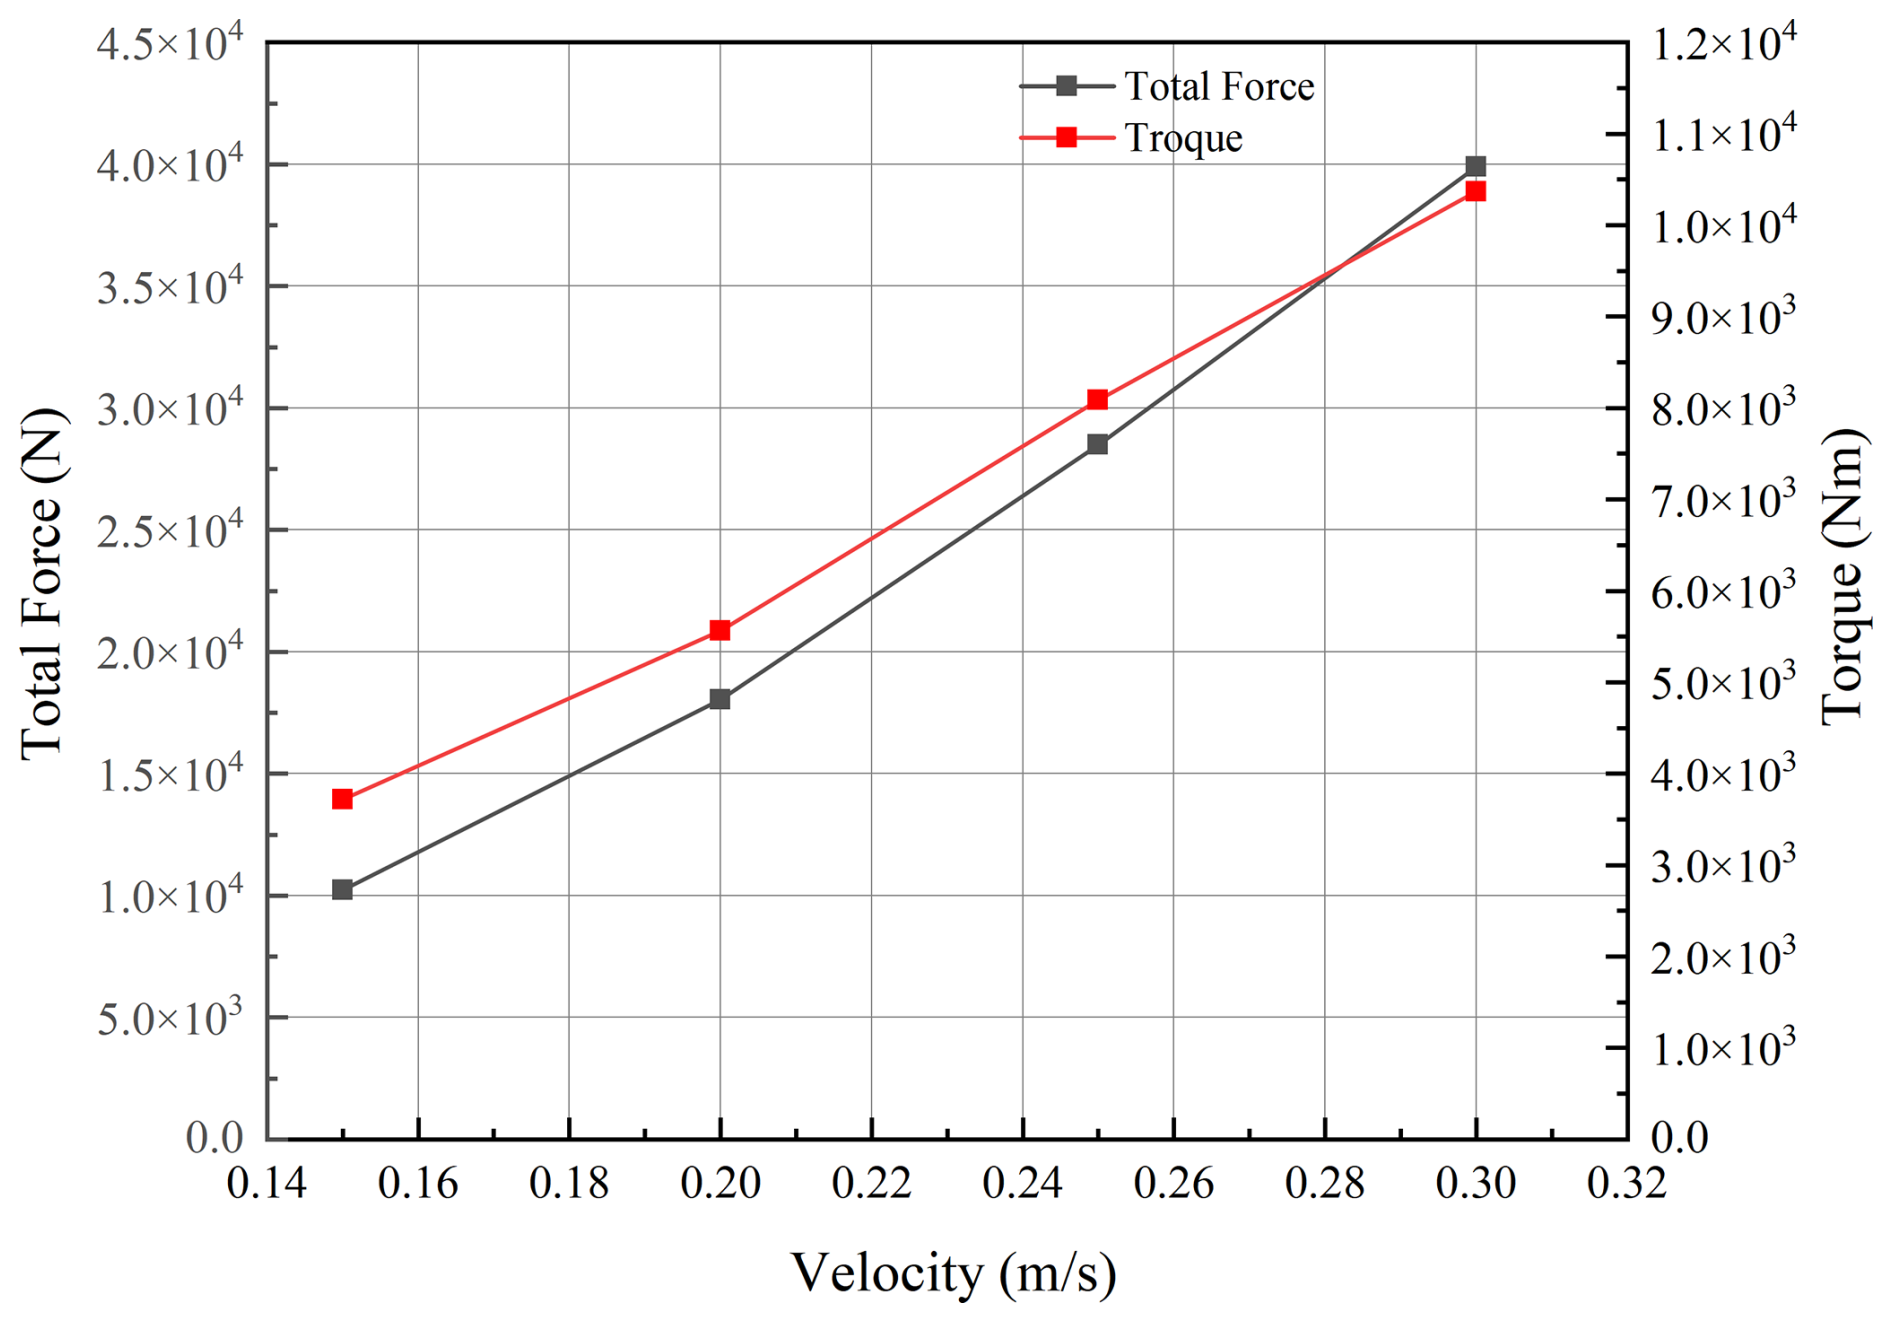
The results clearly demonstrate that traverse speed significantly affects cutter force. As traverse speed increases from 0.15 to 0.3 m s−1, average cutting force rises from 10 227.7 to 39 880.7 N, while average torque increases from 3718.6 to 10 369.2 Nm. This nonlinear increase follows a quadratic relationship: as traverse speed increases, so does cutting thickness, leading to a squared growth in cutting force (i.e., F∝v2). Therefore, in conditions involving excessive cutter loading, reducing traverse speed can effectively lower the resultant force on the cutter head and improve operational safety.
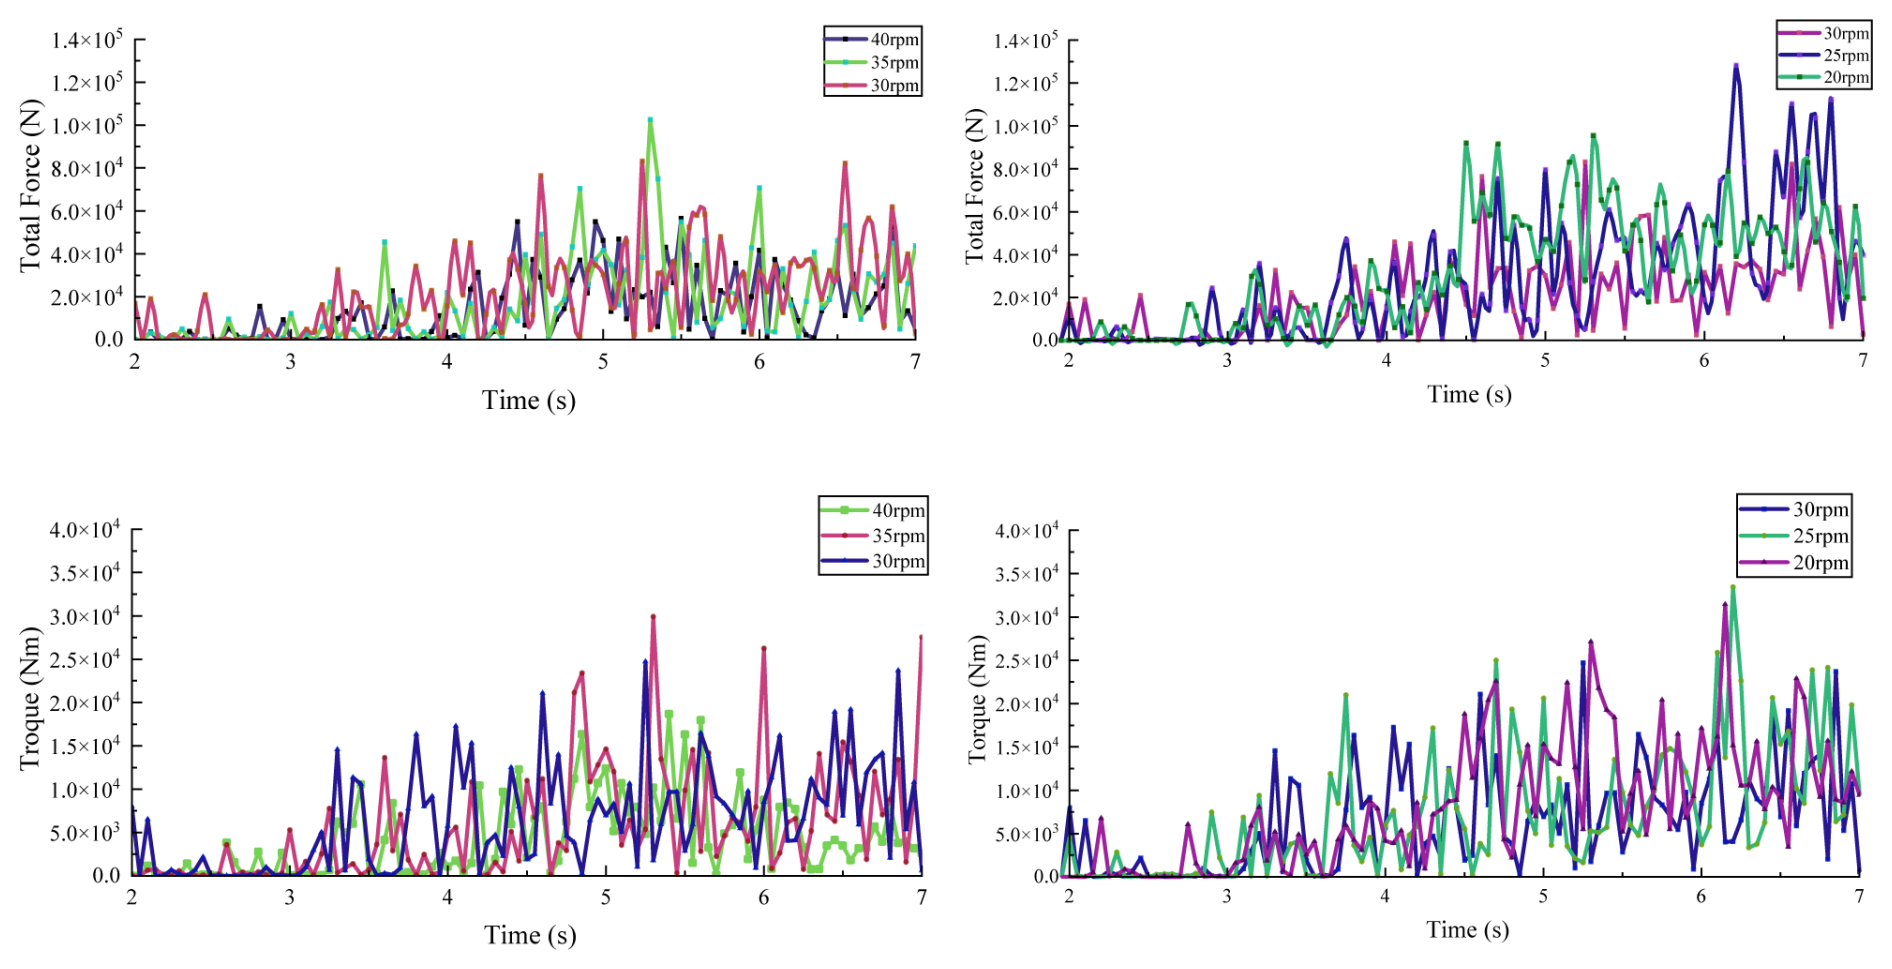
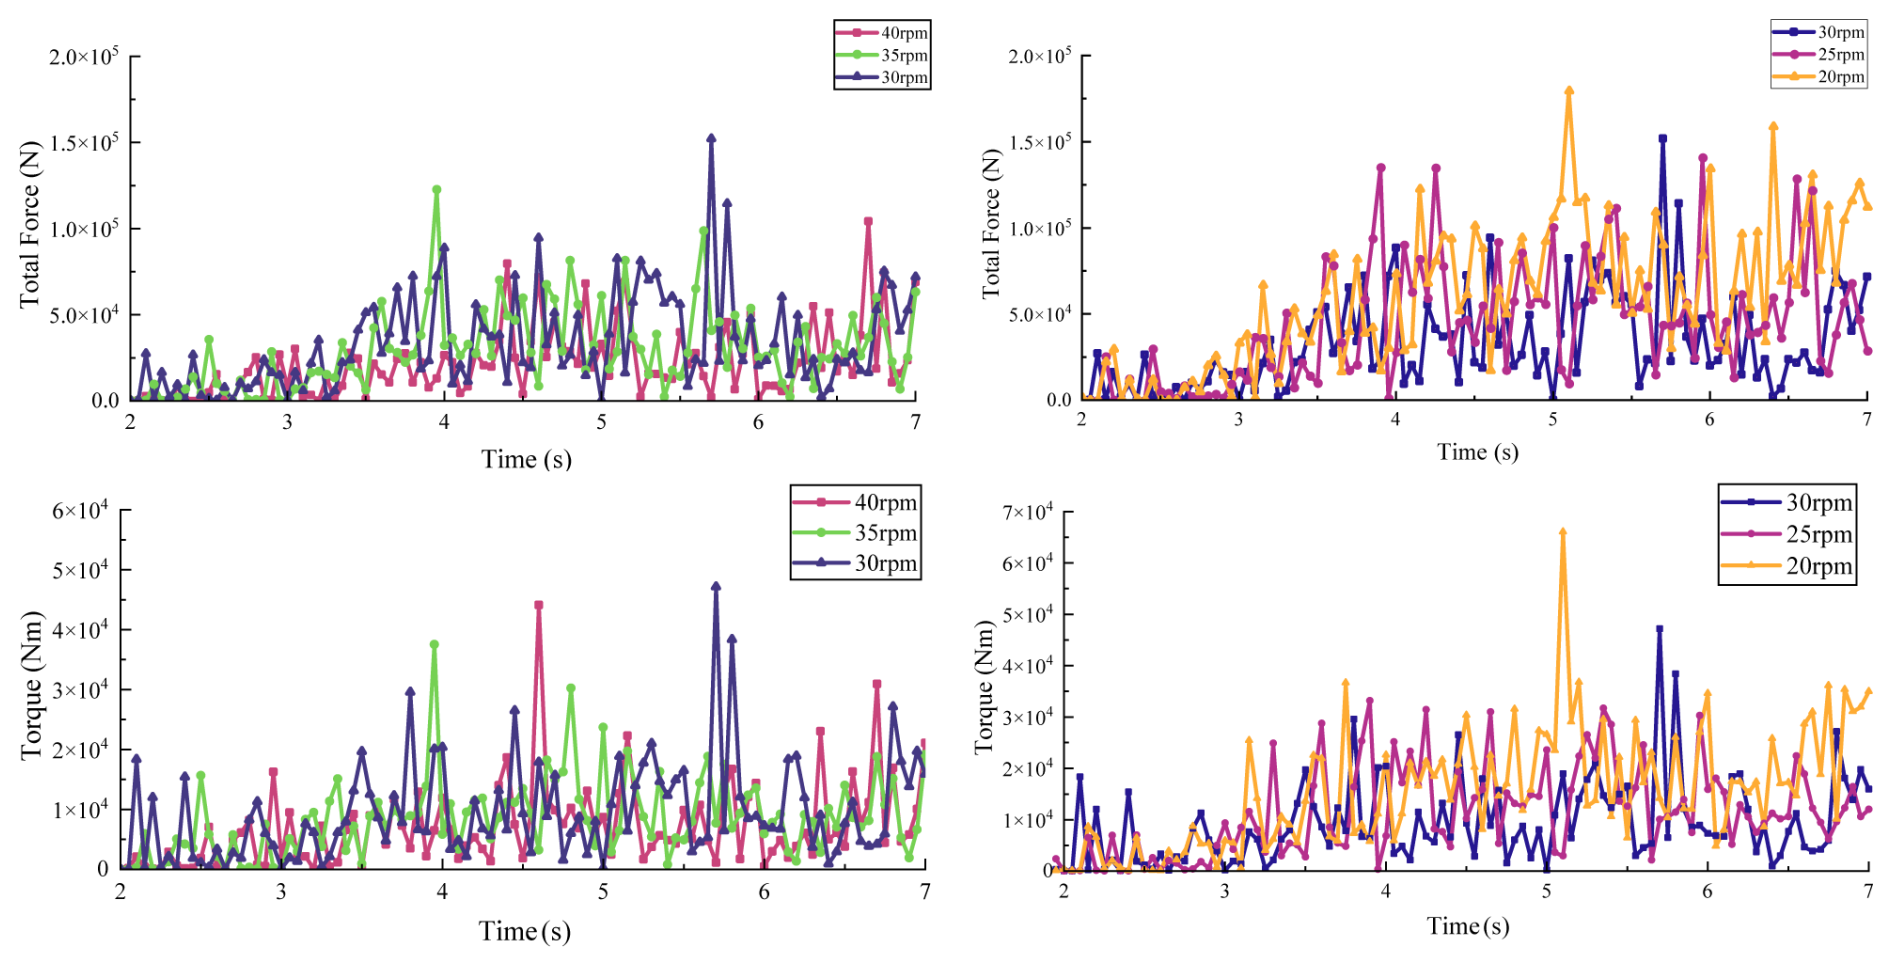
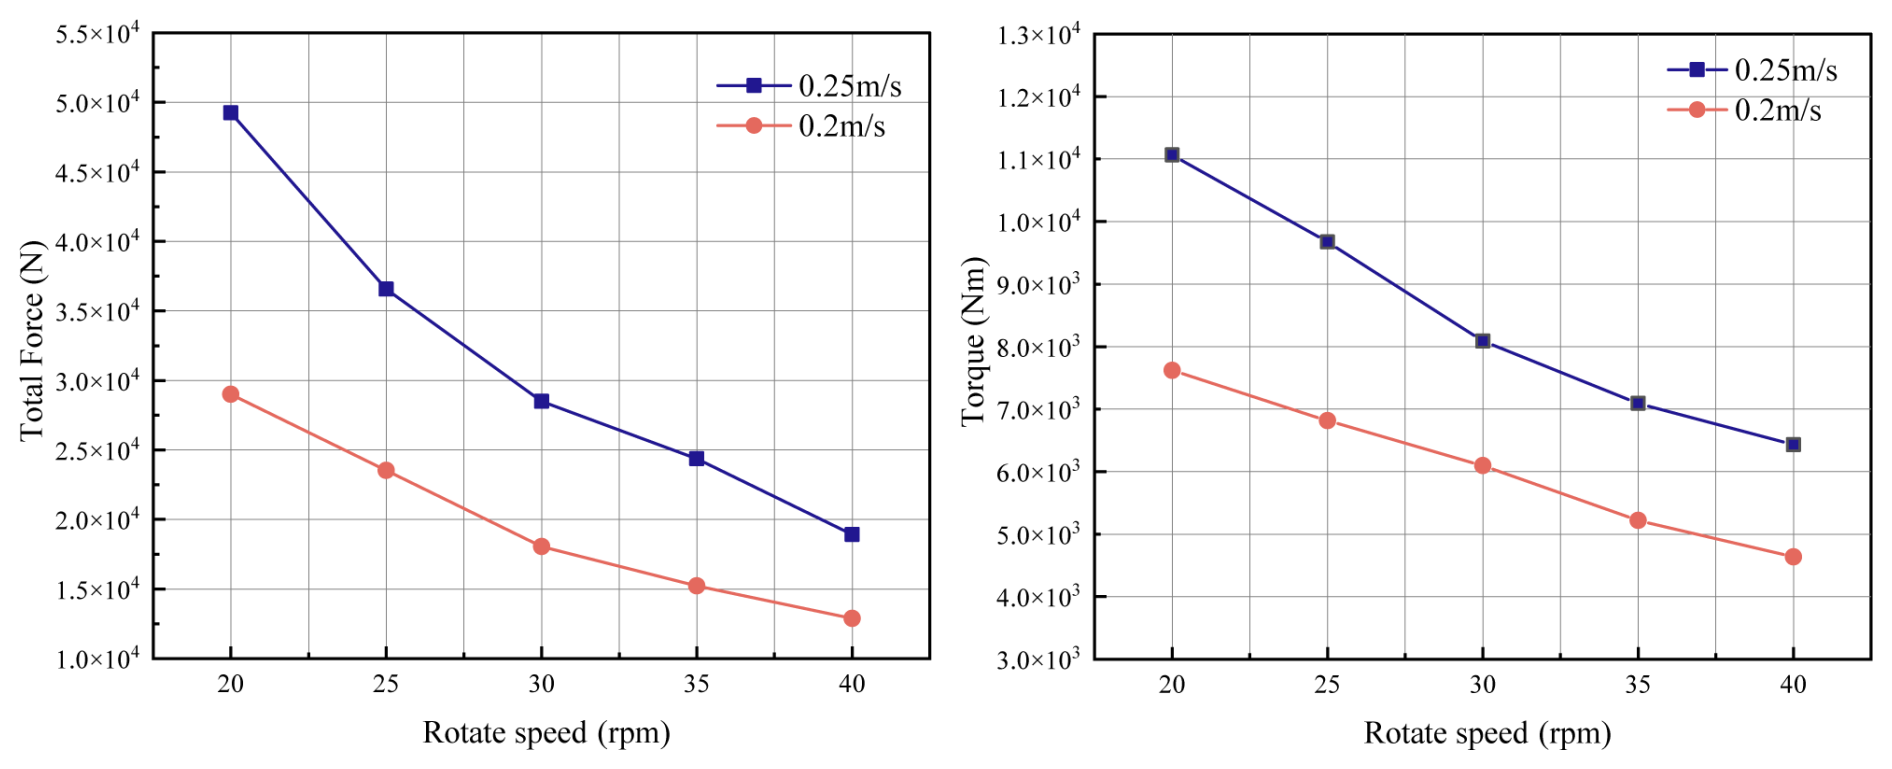
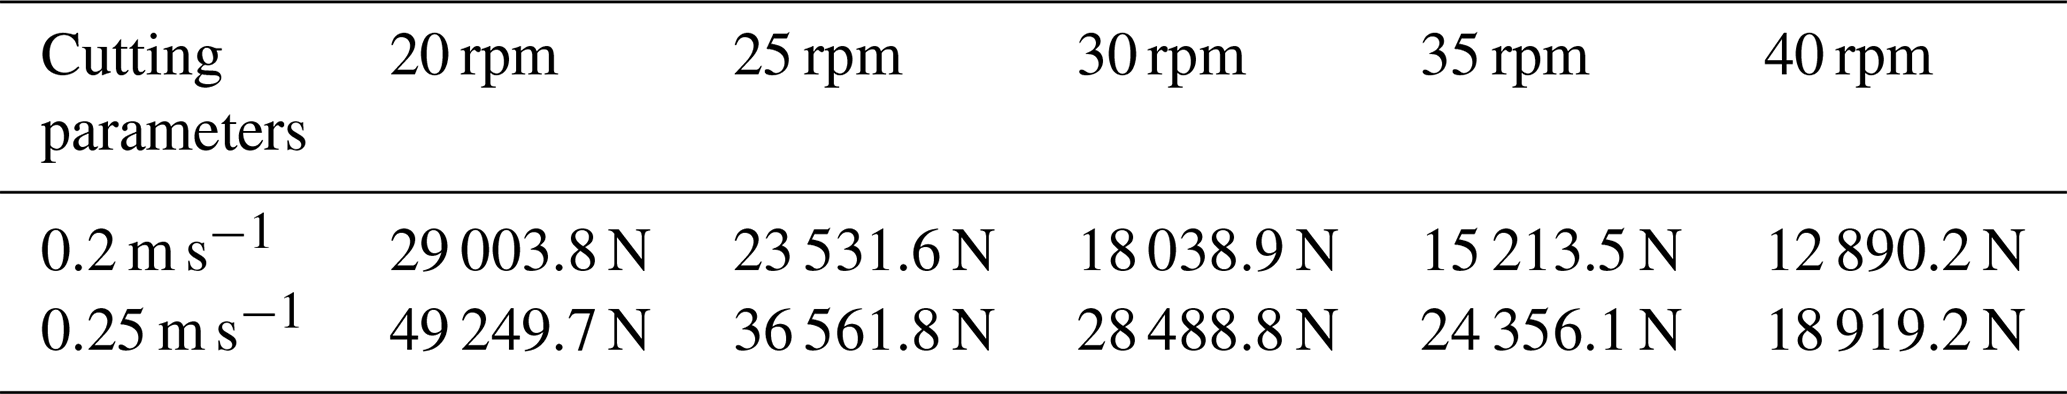
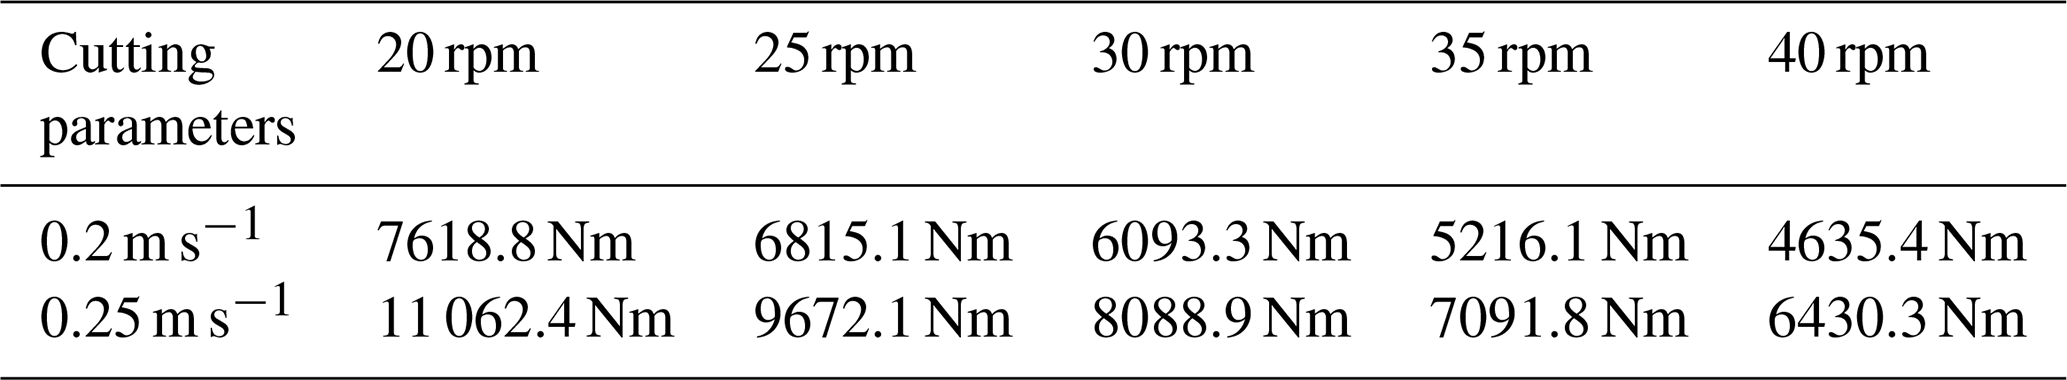
Next, cutter rotational speeds of 20, 25, 30, 35, and 40 rpm were tested at fixed traverse speeds of 0.2 and 0.25 m s−1, with a constant cutting angle of 30°. The force and torque data under these conditions are shown in Figs. 16 and 17, and the average values are compared in Fig. 18. Average total force and torque data are shown in Tables 5 and 6.
By comparing cutter forces under different rotational speeds at traverse speeds of 0.2 and 0.25 m s−1, the total cutting force and torque were obtained. It was observed that both total force and torque decrease as the cutter's rotational speed increases. This phenomenon arises from the influence of cutting thickness on the rock crushing force. As the cutter's rotational speed increases, the frequency of contact between the cutter teeth and the rock increases per unit time, leading to a decrease in the cutting thickness per tooth. At lower rotational speeds, the cutter experiences higher cutting forces and torque. As the speed increases, the load on the cutter decreases and gradually stabilizes, with the relationship between cutting force and rotational speed approximated as . Cutter speed also significantly affects fragment size: higher speeds produce smaller rock fragments, which facilitates debris transport. Compared with traverse speed, the cutter's rotational speed has a smaller impact on cutter load. Therefore, it is recommended to first calibrate the traverse speed to control peak loads, followed by adjustments to the rotational speed to optimize energy consumption in practical applications. The following section analyzes the effect of cutting angle on cutter performance. The cutting forces and torques under different cutting angles are shown in Fig. 19. Average total force and torque under different cutting angles are shown in Table 7.
Table 7Average total force and torque for cutters with cutting angles of 10, 20, and 30°.
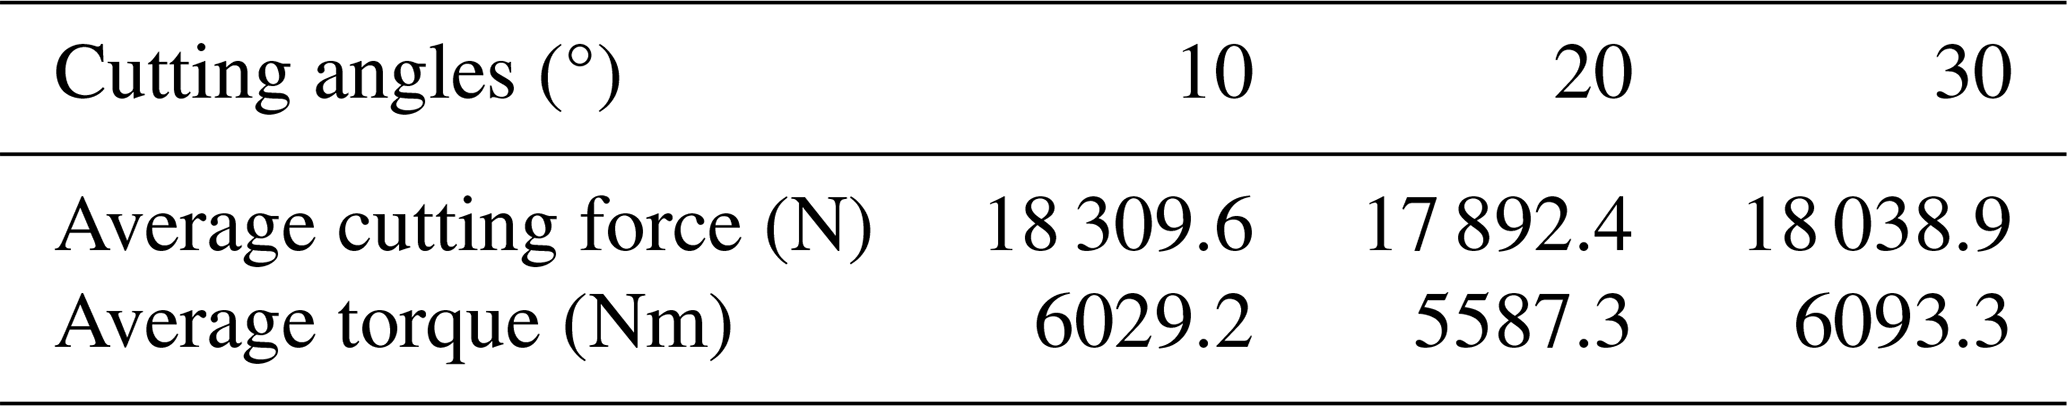
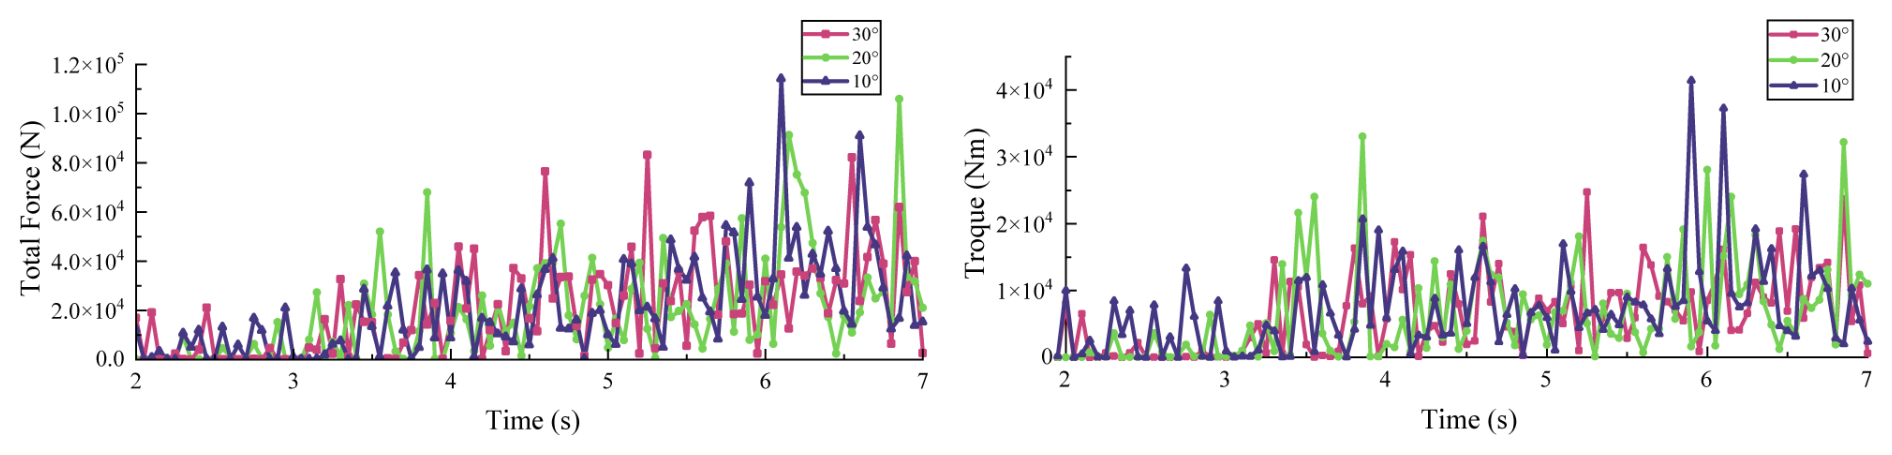
When only the cutter angle is varied, the average cutting force and torque remain within a normal fluctuation range at angles of 10, 20, and 30°, suggesting that the cutting angle has limited influence on average force and torque. However, the fluctuations in force and torque are more pronounced at smaller cutting angles. The cutter operates more smoothly at a cutting angle of 30°, indicating improved operational stability under this condition.
According to the calculation based on the results under various operating conditions, the optimal scenario for minimizing force and wear on the cutter involves a lower traverse speed and higher rotational speed. However, excessively high rotational speed can increase power consumption, and excessively low traverse speed can reduce dredging efficiency. Therefore, operational parameters should be selected based on a balanced consideration of energy efficiency, equipment wear, and project timelines.
5.5 Specific energy of cutter cutting under different working conditions
Notably, force and torque alone are not sufficient indicators of cutting efficiency. A more comprehensive metric is specific cutting energy, defined as the energy consumed per unit volume of removed material. It is a key parameter for evaluating cutting performance and is calculated as
where n is the rotational speed of the cutter, T is the torque of the cutter, Fn is the transverse cutting force of the cutter, v is the transverse speed of the cutter, and S is the cutting area of the cutter. As shown in Fig. 20, the cutter cutting area S was calculated as 0.699 m2 using EDEM post-processing. The transverse cutting forces under different conditions are listed in Table 8.
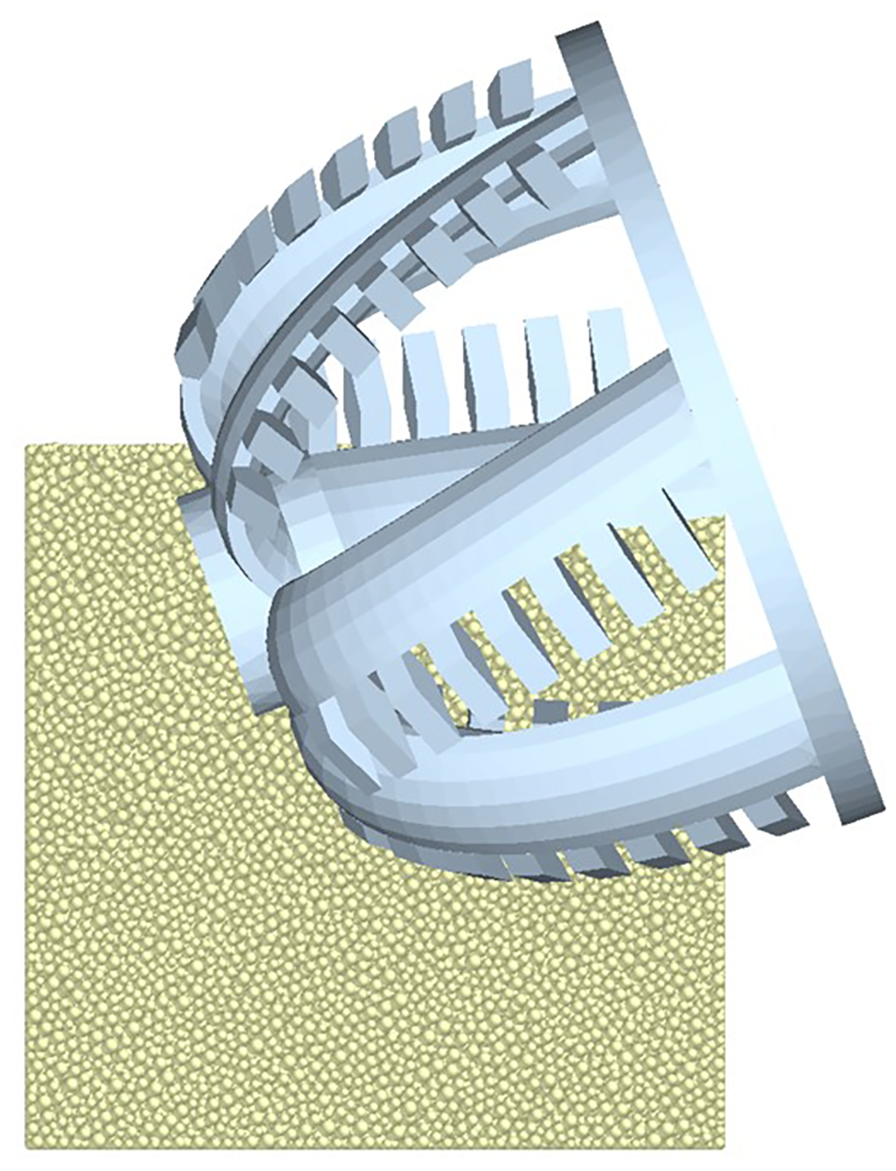
Table 8Transverse cutting force under different working conditions.
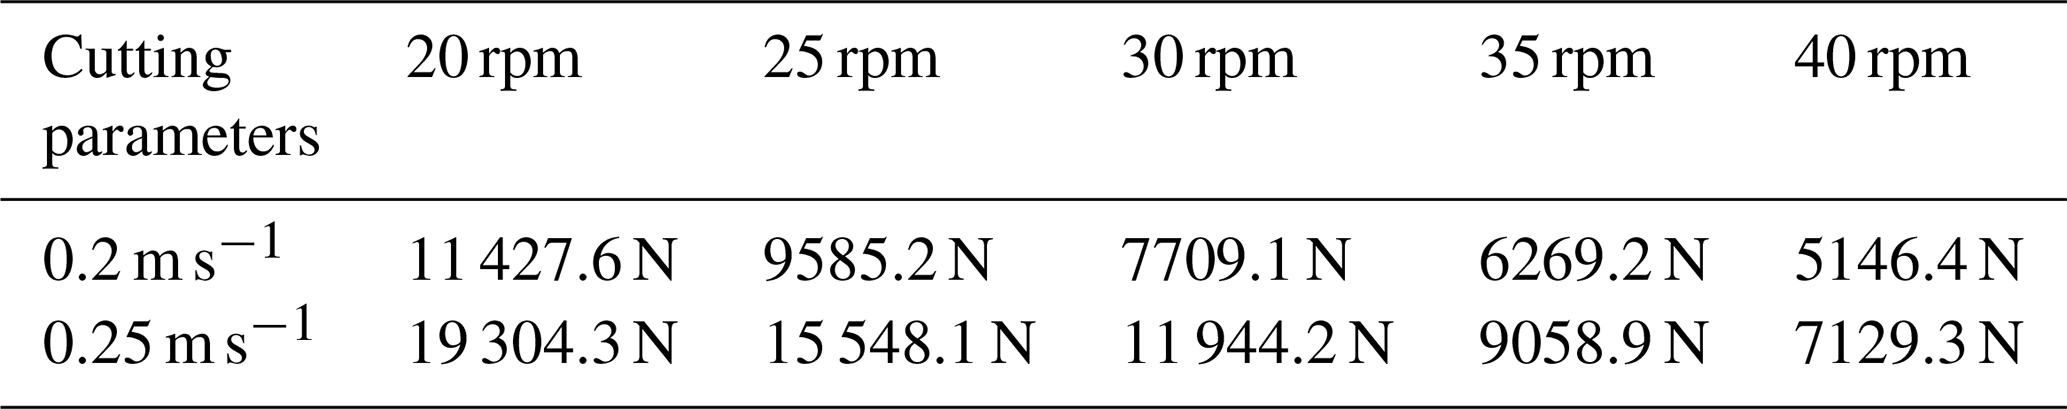
Table 9Specific energy of cutter cutting under different working conditions.
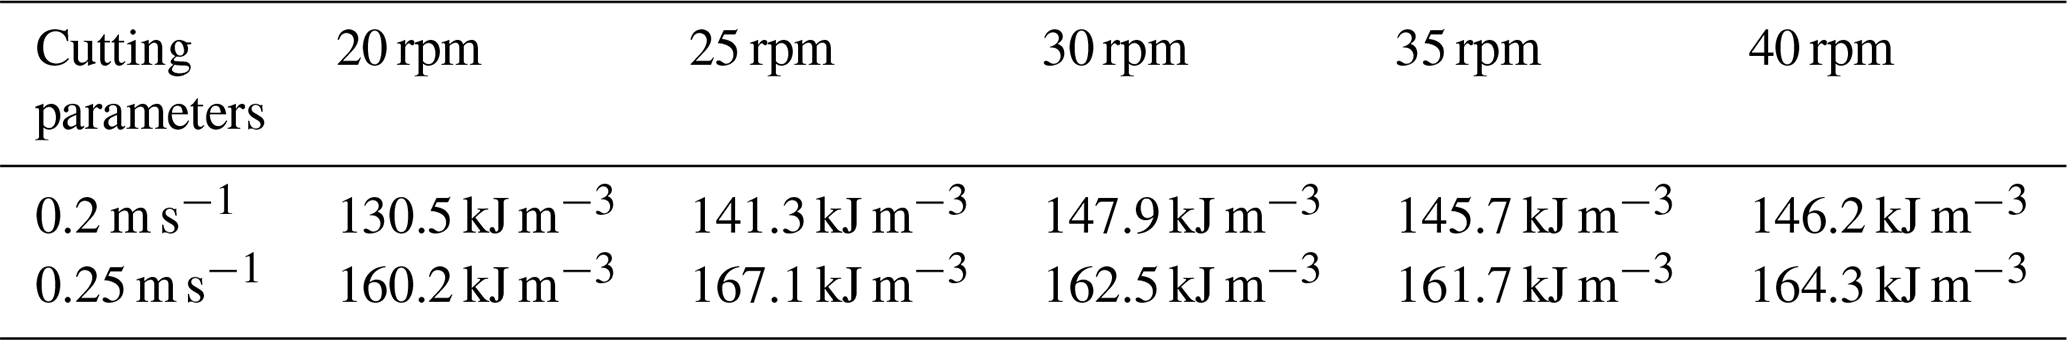
Substituting the relevant values into Eq. (21), the specific energy results are shown in Fig. 21 and Table 9.
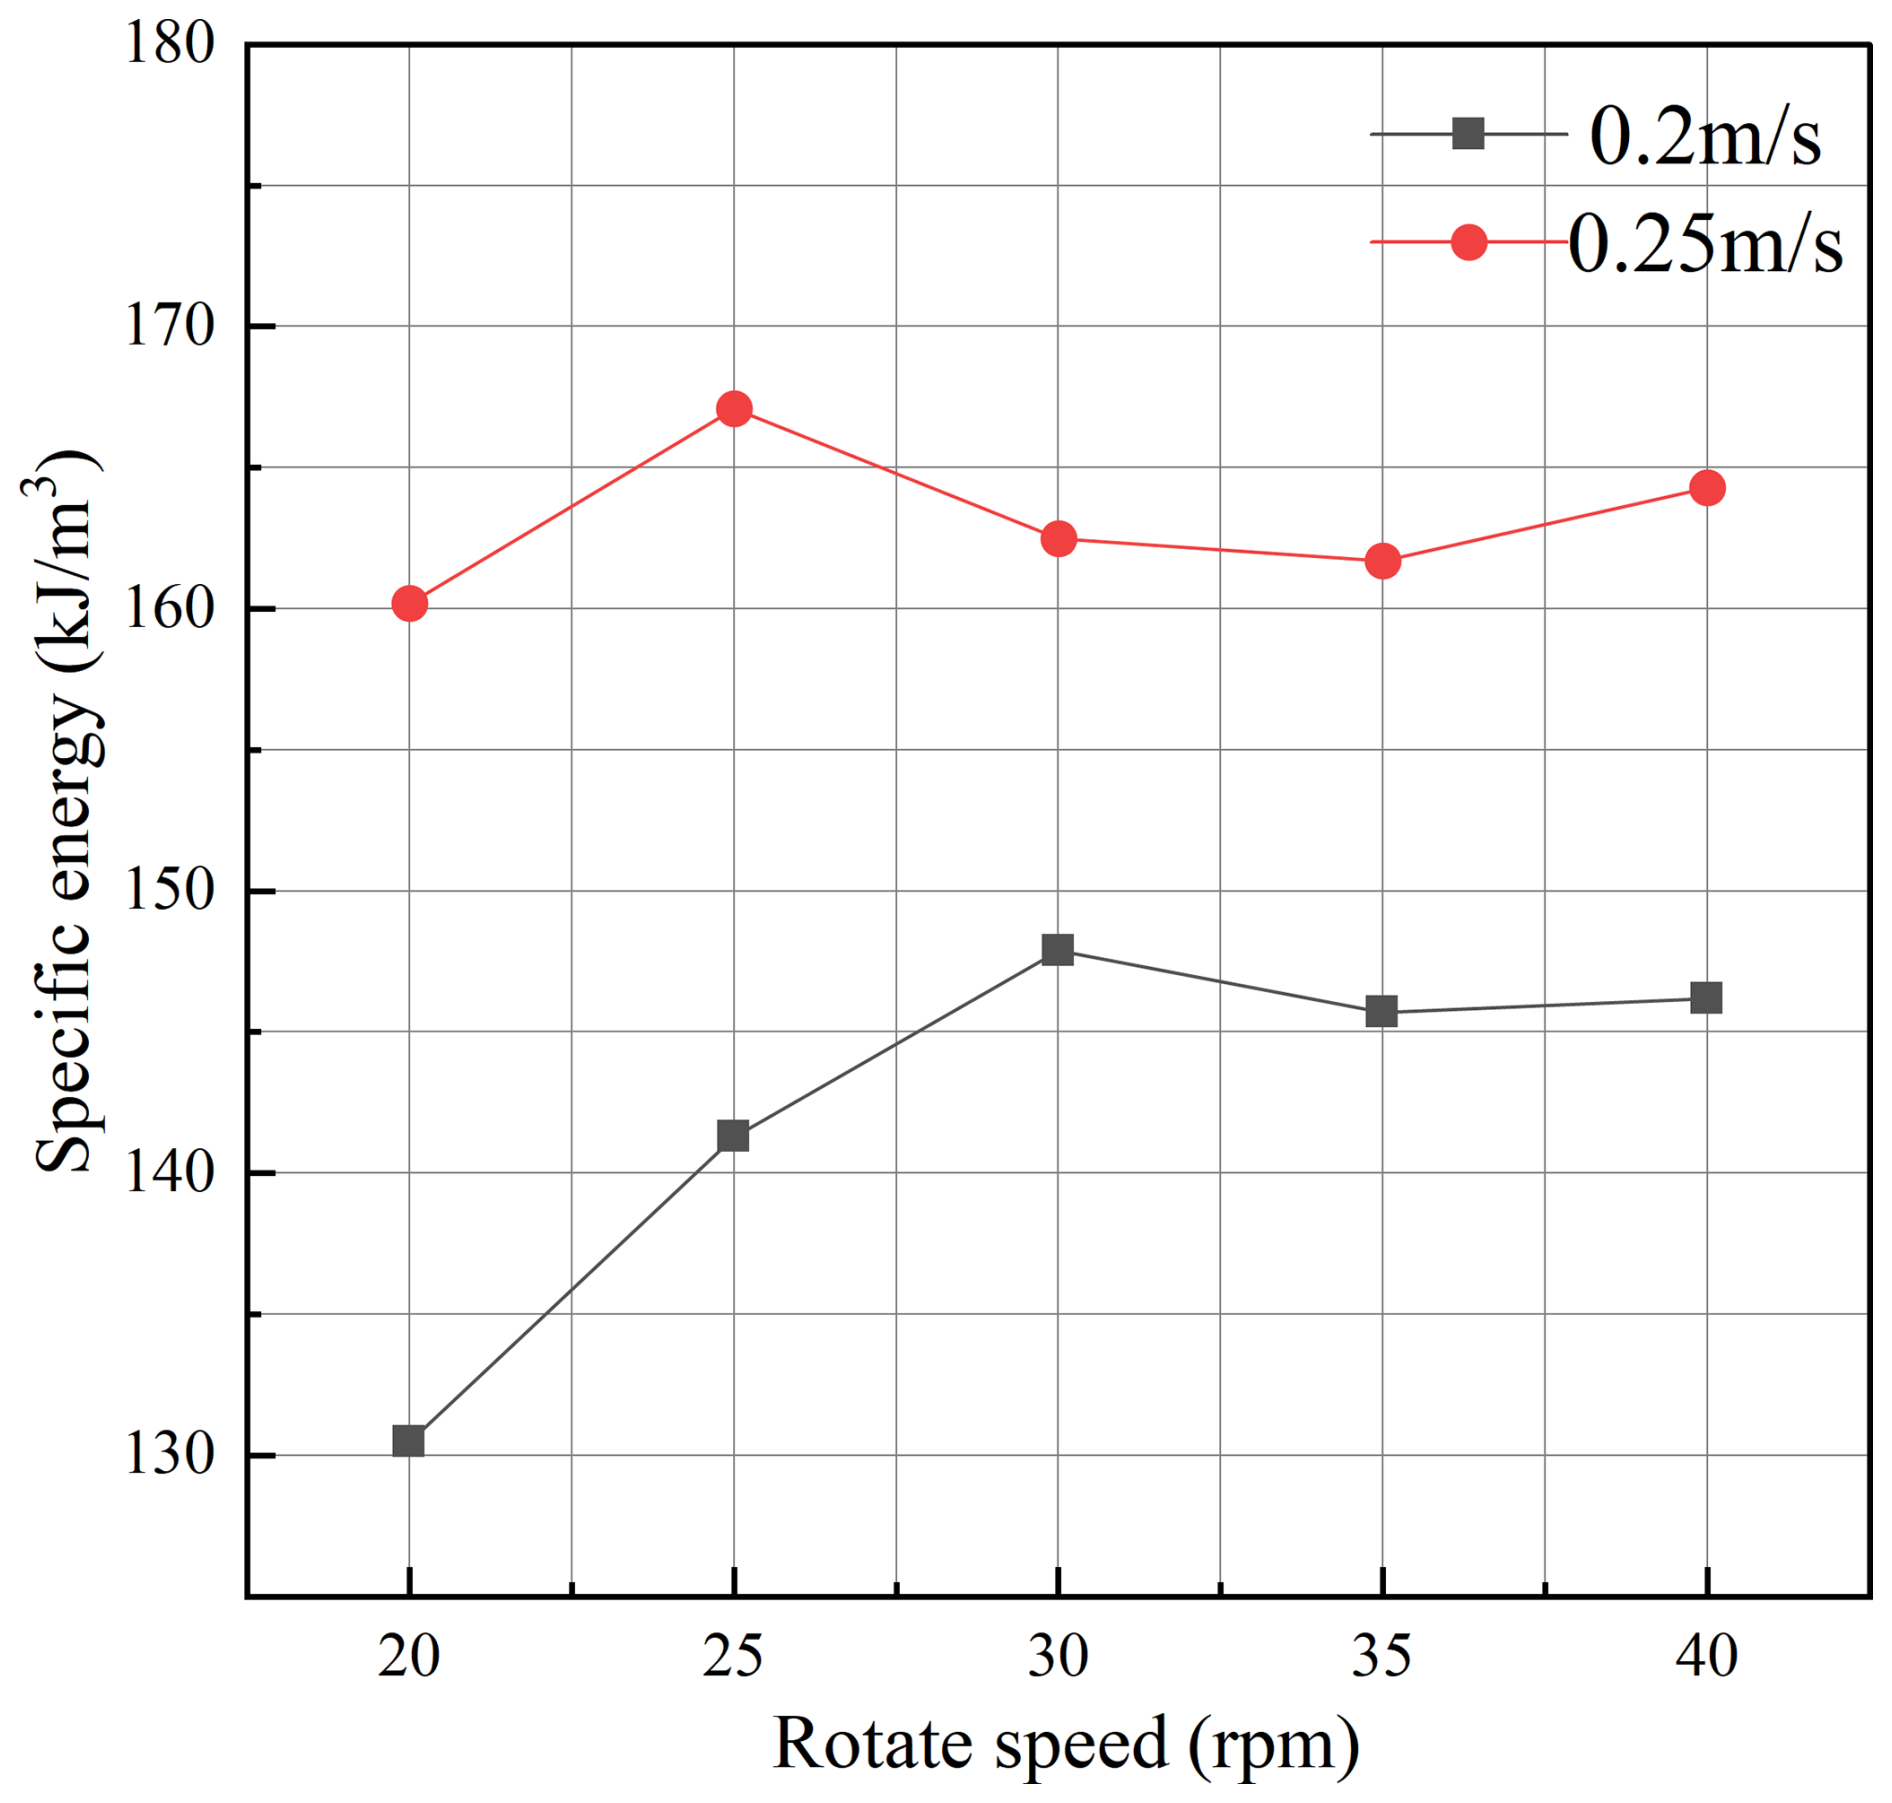
Analysis of the specific energy values shows that at lower rotational speeds, specific energy increases noticeably with speed, but the rate of change levels off at higher speeds. Conversely, an increase in traverse speed leads to a significant rise in specific energy. From the results, the optimal operating condition for cutting soft rock is a traverse speed of 0.2 m s−1 and a rotational speed of 20 rpm, yielding the lowest specific energy of 130.5 kJ m−3. Under this condition, cutter force and wear are also minimal, making it the most efficient configuration for soft-rock cutting.
This paper simulates the behavior of a dredger cutter cutting soft rock using the discrete element method (DEM); analyzes the wear of different cutter teeth; and studies cutter force, torque, specific energy, and other parameters under varying working conditions. The main conclusions are as follows:
-
A bed of rock particles was established using the Hertz–Mindlin contact model and the bonded-particle model. The reliability of the constructed model was verified through virtual uniaxial compression and Brazilian splitting tests. Cutter tooth wear was analyzed using the Archard wear model. On the same cutter arm, the average wear depth of cutter tooth no. 1 (hub side) reached 3.56 × 10⁻⁴ mm, while that of cutter tooth no. 8 (outer ring side) was only 1.3 × 10⁻⁵ mm – a difference of nearly 30 times. The cumulative tangential contact energy was found to be 5 times greater than the forward contact energy, indicating that tangential friction is the dominant contributor to wear. Severe wear was observed at the tooth tip, upper surface, and lower side. Therefore, in practical engineering applications, special attention should be given to the wear of cutter teeth near the hub. Surface-hardening techniques may be applied to the tooth tip and upper surface to increase hardness and extend service life.
-
The cutter's force and torque under different operating conditions were analyzed. When the traverse speed increased from 0.15 to 0.3 m s−1, the average cutting force rose from 10 227.7 to 39 880.7 N. Conversely, when the rotational speed increased from 20 to 40 rpm, the average cutting force decreased from 29 003.8 to 12 890.2 N. These results show that cutter force and torque have an approximately inverse linear relationship with rotational speed and a quadratic growth relationship with traverse speed. Cutting angle had minimal influence on cutter force and torque. Regarding specific cutting energy, both increased traverse speed and rotational speed led to higher specific energy consumption, though the rate of increase tapered off at higher rotational speeds. For the soft-rock conditions studied, the optimal cutting parameters were a traverse speed of 0.2 m s−1 and a rotational speed of 20 rpm. This configuration achieved the lowest specific energy, cutting force, and torque, thus improving cutting efficiency and reducing cutter tooth wear.
The data and materials in this paper are available upon request made directly to the corresponding author.
YH: writing – original draft, writing – review and editing, and software. PJ: methodology and project administration. CC: formal analysis and supervision. HL: conceptualization and data curation.
The contact author has declared that none of the authors has any competing interests.
Publisher's note: Copernicus Publications remains neutral with regard to jurisdictional claims made in the text, published maps, institutional affiliations, or any other geographical representation in this paper. While Copernicus Publications makes every effort to include appropriate place names, the final responsibility lies with the authors. Views expressed in the text are those of the authors and do not necessarily reflect the views of the publisher.
This paper was edited by Pengyuan Zhao and reviewed by two anonymous referees.
Abo-Elnor, M., Hamilton, R., and Boyle, J. T.: Simulation of soil–blade interaction for sandy soil using advanced 3D finite element analysis, Soil Tillage Res., 75, 61–73, https://doi.org/10.1016/S0167-1987(03)00156-9, 2004.
Evans, I.: The force required to cut coal with blunt wedges, Int. J. Rock Mech. Min. Sci. Geomech. Abstr., 2, 1–12, https://doi.org/10.1016/0148-9062(65)90018-5, 1965.
Huang, J., Zhang, Y., Zhu, L., and Wang, T.: Numerical simulation of rock cutting in deep mining conditions, Int. J. Rock Mech. Min. Sci., 84, 80–86, https://doi.org/10.1016/j.ijrmms.2016.02.003, 2016.
Ibrahmi, A., Bentaher, H., and Maalej, A.: Effect of the design moldboard on the tillage forces, Proc. 5th Int. Conf. on Modeling, Simulation and Applied Optimization (ICMSAO), 1–6, https://doi.org/10.1109/ICMSAO.2013.6552606, 2013.
Kozicki, J. and Donzé, F. V.: A new open-source software developed for numerical simulations using discrete modeling methods, Comput. Methods Appl. Mech. Eng., 197, 4429–4443, https://doi.org/10.1016/j.cma.2008.05.023, 2008.
Li, X., Wang, S., and Meng, Q.: Influence of kinematic parameters and rock properties on the cutting process with ODC based on discrete element method, Sci. Rep., 15, 14649, https://doi.org/10.1038/s41598-025-98587-8, 2025.
Li, Y., Li, M.-D., Dai, H., and Liang, K.-S.: Study on cutting-load characteristics of collecting cutter for seafloor massive sulfide, IEEE Access, 9, 51925–51939, https://doi.org/10.1109/ACCESS.2021.3070007, 2021.
Ling, J., Sun, C., Wang, Q., and Zhang, H.: Analysis of rock breaking load characteristics and efficiency optimization of roller cutters under multi-factor coupling, KSCE J. Civ. Eng., 28, 4055–4066, https://doi.org/10.1007/s12205-024-1864-z, 2024.
Liu, Z., Lv, R., Kong, C., Liu, K., and Wei, C.: Experimental study on rock breaking by single chisel pick under deep-sea hydrostatic pressure, Ocean Eng., 285, 115262, https://doi.org/10.1016/j.oceaneng.2023.115262, 2023.
Miedema, S. A.: On the cutting forces in saturated sand of a seagoing cutter suction dredger, Terra et Aqua, 41, 1–27, https://trid.trb.org/View/402715 (last access: 16 October 2025), 1989.
Nieuwboer, B. J., van Rhee, C., and Keetels, G. H.: Towards simulating flow-induced spillage in dredge cutter heads using DEM-FVM, Ocean Eng., 275, 113922, https://doi.org/10.1016/j.oceaneng.2023.113922, 2023.
Ouyang, Y., Yang, Q., Chen, X., and Xu, Y.: An analytical model for rock cutting with a chisel pick of the cutter suction dredger, J. Mar. Sci. Eng., 8, 806, https://doi.org/10.3390/jmse8100806, 2020.
Song, D., Ren, Z., Yang , Y., Chen, Y., Nie, G., Tan, L., Peng, H., Li, Z., Chen, X., Li, M., Ren, H., and Zuo, L.: Drilling performance analysis of impregnated micro bit, Mech. Sci., 13, 867–875, https://doi.org/10.5194/ms-13-867-2022, 2022.
Tian, L., Cai, Z. X., Zhang, L. B., and Su, Z. B.: Numerical simulation of rock cutting by dredger cutter using discrete element method, Mech. Sci. Technol., 38, 1805–1811, https://doi.org/10.13433/j.cnki.1003-8728.20190052, 2019.
Verhoef, P. N. W.: Wear of Rock Cutting Tools, Routledge, https://doi.org/10.1201/9780203733981, 2017.
Vijayan, K., Barik, C. R., and Sha, O. P.: Shock transmission through universal joint of cutter suction dredger, Ocean Eng., 233, 109185, https://doi.org/10.1016/j.oceaneng.2021.109185, 2021.
Wang, P. and Yin, Z. Y.: Micro-mechanical analysis of caisson foundation in sand using DEM: particle breakage effect, Ocean Eng., 215, 107921, https://doi.org/10.1016/j.oceaneng.2020.107921, 2020.
Wang, Y. D., Lin, G. C., Liu, X. A., Zhao, L. J., Jia, B. X., Wang, Y., and He, J. Q.: Research on coal rock parameter calibration based on discrete element method, Sci. Rep., 14, 26507, https://doi.org/10.1038/s41598-024-77538-9, 2024.
Yin, Z., Liu, B., Yang, C., Wang, H., Fu, X., Xu, J., and Fan, Z.: Study on the tooth surface wear characteristics of helical gears under mixed elastohydrodynamic lubrication, Mech. Sci., 16, 565–578, https://doi.org/10.5194/ms-16-565-2025, 2025.
Yu, T. T. and Xia, S. X.: DEM for modeling crack propagation in rocks under uniaxial compression tests, Adv. Mater. Res., 433–440, 4788–4793, https://doi.org/10.4028/www.scientific.net/AMR.433-440.4788, 2012.
Yuan, J., Yang, K., Yang, T., Xu, H., Xiong, T., and Fan, S.: Predictive study on the cutting energy efficiency of dredgers based on specific cutting energy, J. Mar. Sci. Eng., 13, 598, https://doi.org/10.3390/jmse13030598, 2025.
Zhang, L. B., Cai, Z. X., Li, R. X., Liu, F. L., and Han, M. D.: Numerical simulation of rock-cutting process by dredger cutter, J. Harbin Eng. Univ., 39, 371–376, https://doi.org/10.11990/jheu.201611015, 2018.
Zhang, X., Jiang, H., Tian, M., Li, H., and Chen, H.: Rock cutting performance and wear characteristics of undercutting disc cutter: based on experiment and DEM, Wear, 528–529, 204976, https://doi.org/10.1016/j.wear.2023.204976, 2023.