the Creative Commons Attribution 4.0 License.
the Creative Commons Attribution 4.0 License.
 | 31 Jul 2025
Micromilling of Ti-6Al-4V alloy for high-aspect-ratio thin walls and dimensional error compensation based on an online compensation system
Yang Li
Xiang Cheng
The requirements of fabrication quality of high-aspect-ratio (HAR) thin walls made of titanium alloy are increasing in various engineering fields. However, there is a lack of studies investigating the fabrication of HAR thin walls with high-dimensional accuracy. This paper studies micromilling characteristics of titanium alloy for fabricating HAR thin walls. First, micromilling experiments using straight edge polycrystalline diamond (PCD) end mills with different rake angles are conducted. Comparisons of the effects of tool shape on cutting force, cutting temperature, thin wall dimension error, tool wear, and surface morphology are analyzed systematically, and the optimal cutting edge shape has been identified. Second, a deformation prediction model for micromilling of titanium alloy is established and calibrated. The model can be applied to online compensation of thin wall deformations. Then, dimensional error compensation experiments on HAR thin walls are carried out. The result shows that the proposed prediction model is effective. A thin wall with an aspect ratio of 10:1 and a thickness of 60 µm is successfully fabricated with high-dimensional accuracy. The relative dimensional error is reduced from 16.5 % to 3.9 %. It also provides a method for guiding the thin wall machining of other difficult-to-machine materials.
- Article
(11345 KB) - Full-text XML
- BibTeX
- EndNote


Titanium alloys have been widely used in the aerospace industry due to their high strength-to-weight ratios. The most common titanium alloy is Ti-6Al-4V, originally developed for aircraft structural applications in the 1950s. It now accounts for more than 50 % of the titanium alloy world market. In medical applications, titanium alloys are also widely applied because of their oxidation resistance and bio-compatibility for manufacturing surgical tools, cardiovascular stents, dental and orthopedic implants, and artificial valves, which are constantly subjected to static and fatigue loads (Parmar et al., 2019). The fabrication of Ti-6Al-4V components is performed by casting and forging or, nowadays, additive manufacturing, followed by subsequent machining (Liu and Shin, 2019). Machining titanium alloys is not an easy task since the low heat dissipation rates (thermal conductivity 7.1 W m K−1 and specific heat 553 L kg K−1) cause very high cutting temperatures near the cutting edges (Machai et al., 2013). Also, this material has a low elastic modulus of 110 GPa compared to steels (∼ 200 GPa) and high chemical activation that increases tool wear and produces tool vibration during machining. For a high cutting speed, it is very important to develop advanced tool materials, such as single-crystalline diamond (SCD) or polycrystalline diamond (PCD) (Yan et al., 2010; Zong et al., 2010). For a similar surface finish and the same material removal rate, the recommended cutting speed for uncoated WC-Co inserts stays between 40 and 80 m min−1 when using PCD inserts around 120–160 m min−1 (Amin et al., 2007).
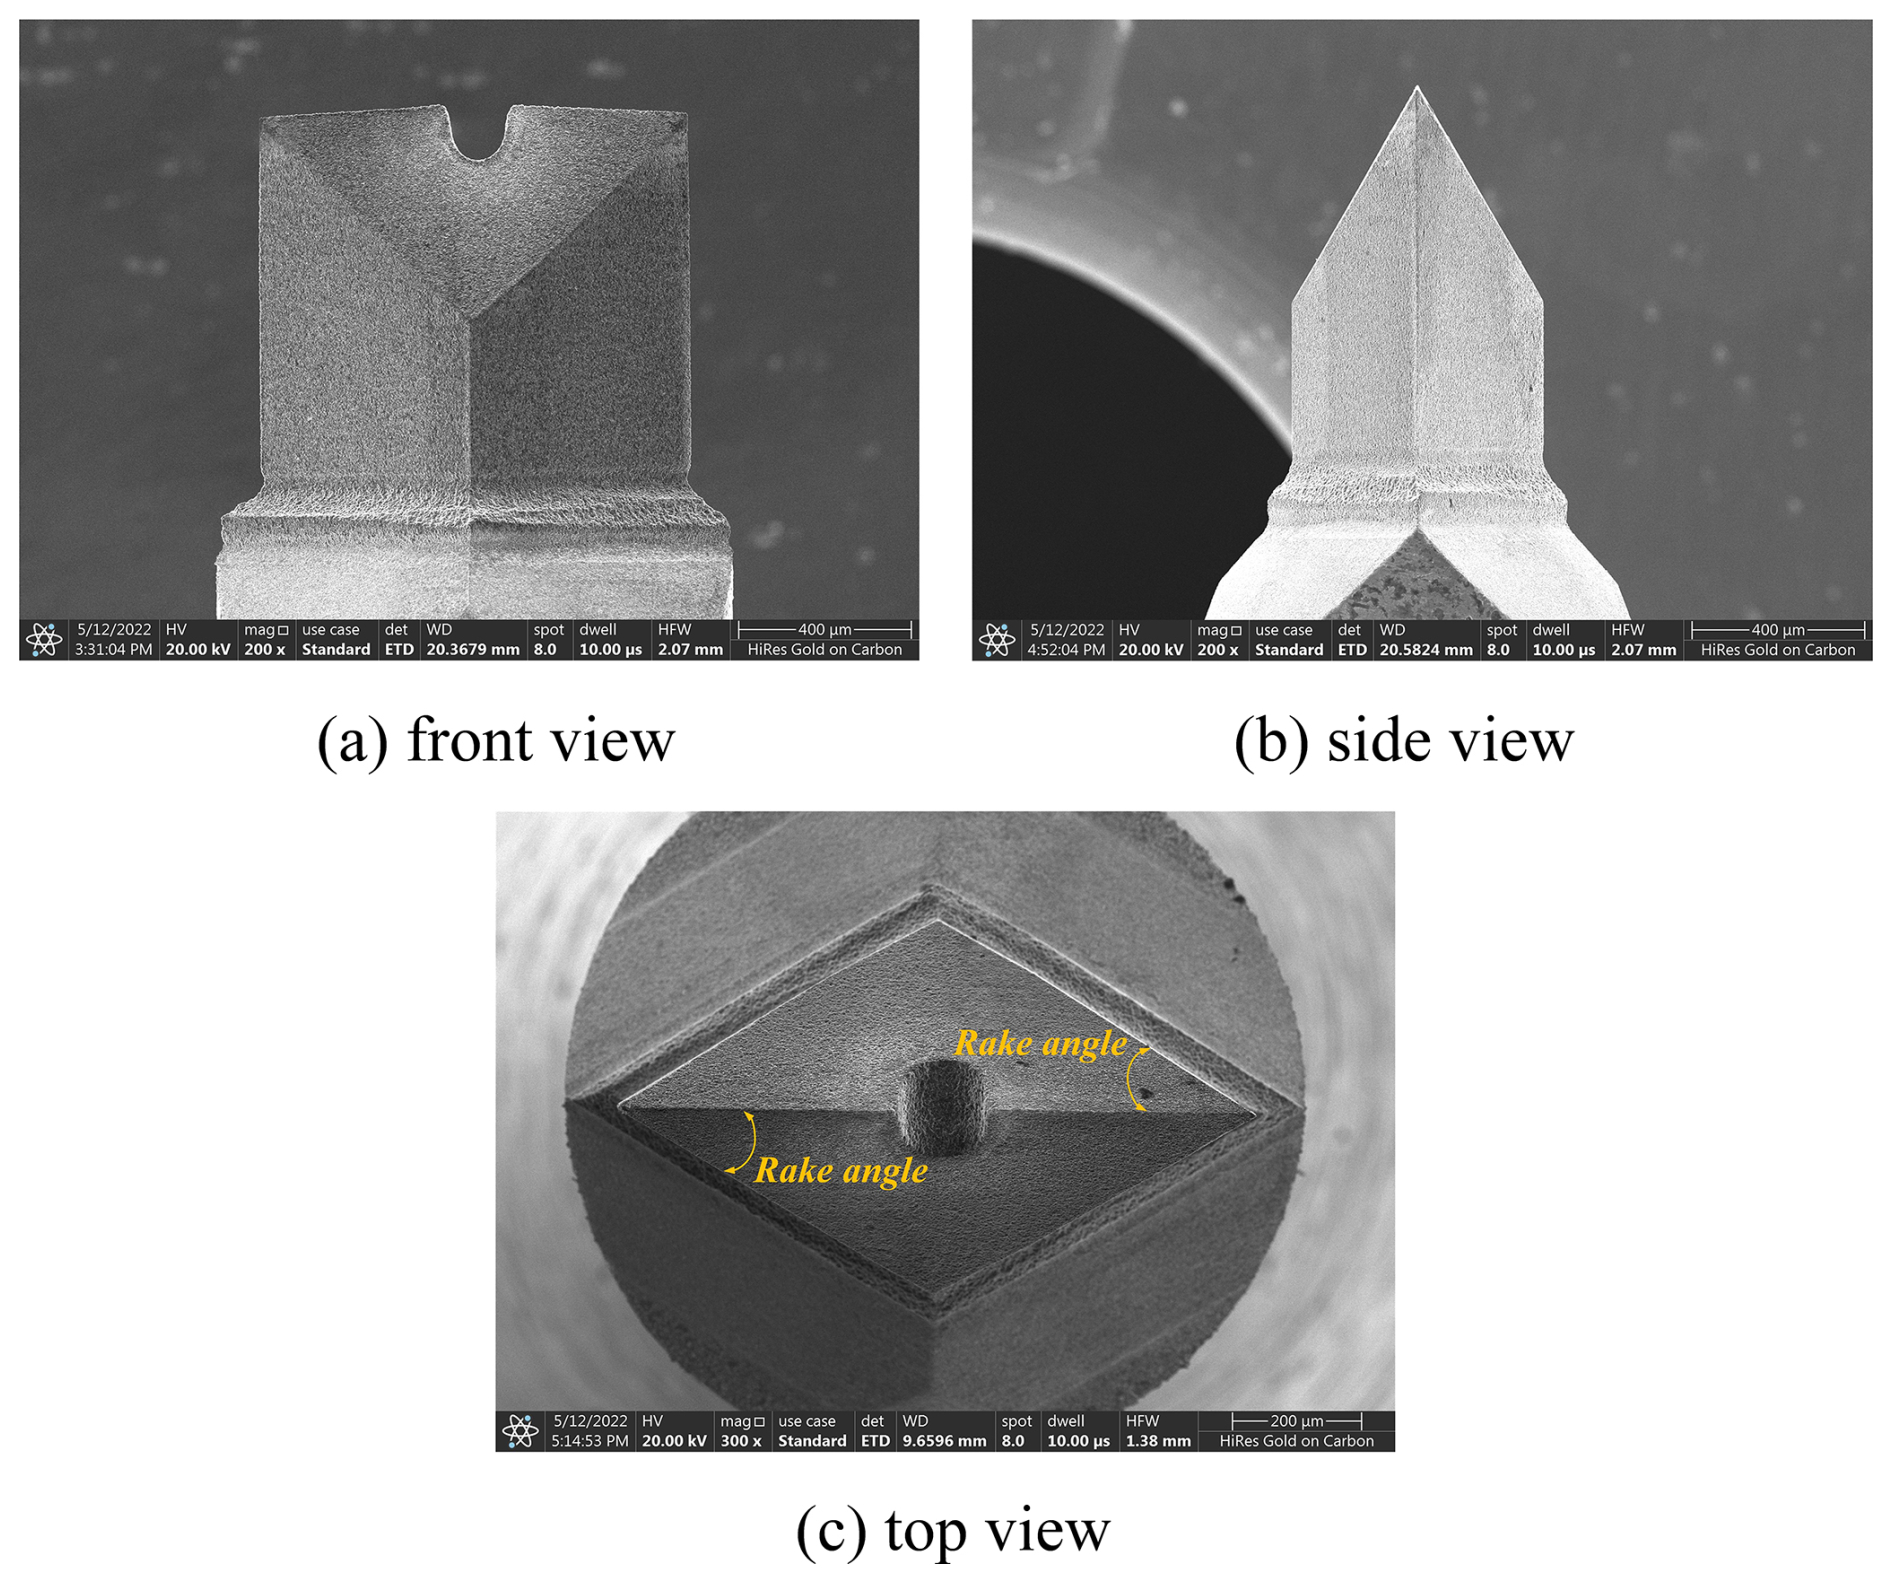
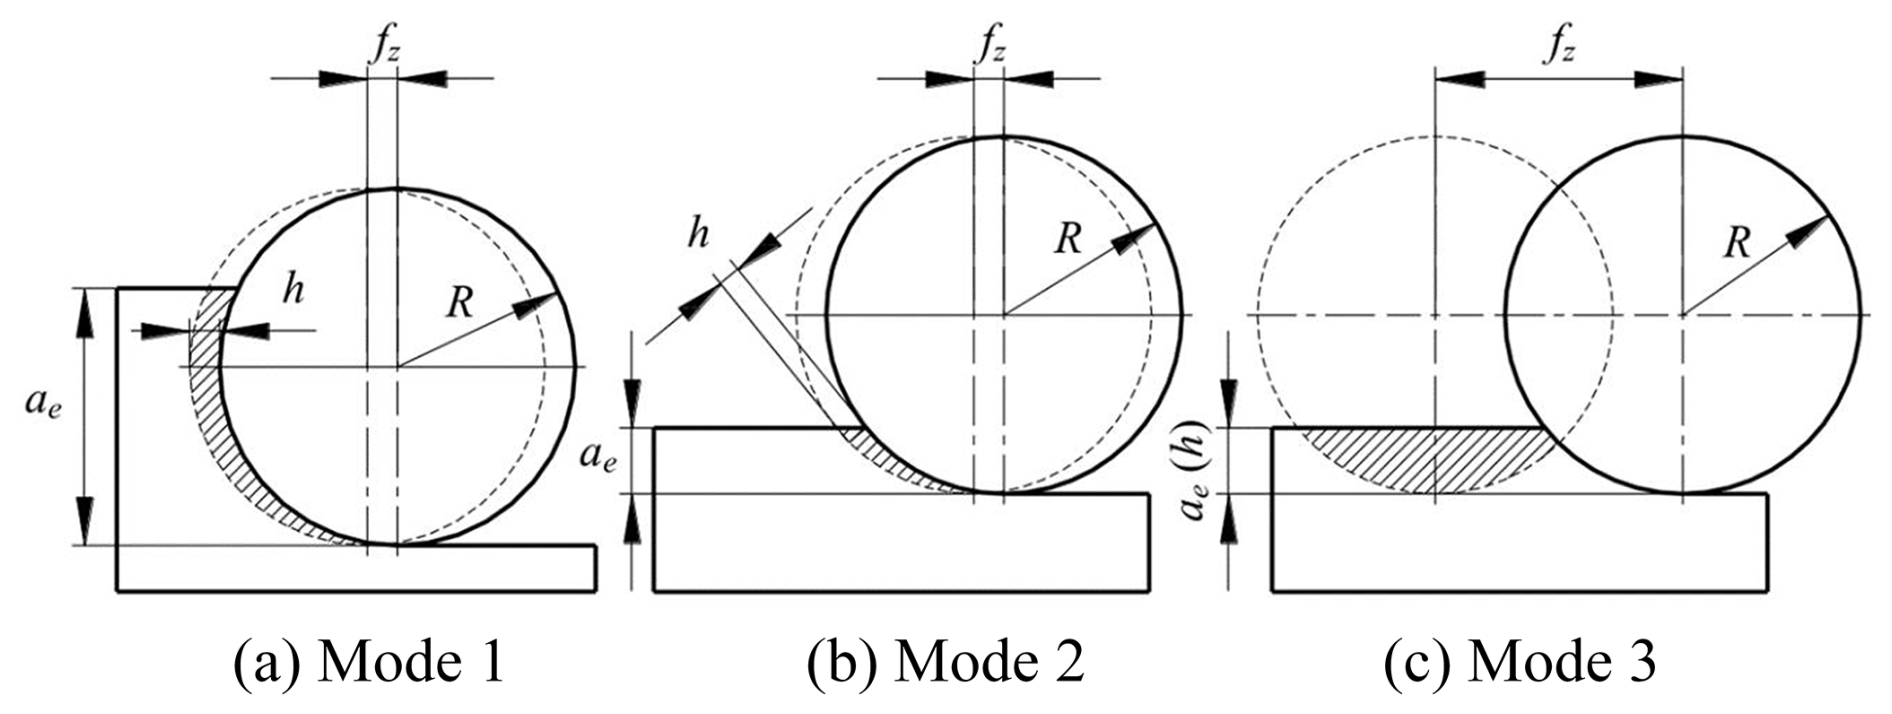
Figure 2Various modes of micromilling determined by feed rates and depth of cut (Cheng et al., 2014).
A series of studies on Ti-6Al-4V titanium alloy cutting was carried out previously. Wu et al. (2022) conducted the investigation of CMQL (cryogenic minimum quantity lubrication) in the machining of titanium thin wall components via comparative experiments in different cutting environments, including flood cooling, MQL (minimum quantity lubrication), and CMQL machining. Experimental results showed that CMQL machining could significantly lower the cutting loads and deformation of thin wall parts, owing to its superior lubrication and cooling functions, especially at high spindle speeds. In order to predict the deformation of a Ti-6Al-4V thin wall part in milling, Gang (2009) established three-dimensional finite-element models of a helical tool and a thin wall part with a cantilever. The comparison of cutting-induced deformations between the simulation and experiment showed that the established finite-element models were accurate and could be used to predict the cutting-induced deformation. Yi et al. (2019) conducted three-dimensional deformation simulation of a micro thin wall using different milling parameters by considering the material elasto-plastic constitutive model, the stiffness, and the geometric structure of micro milling tools in the finite-element method. The micro deformation mechanism in milling of the thin wall was revealed, which provided a theoretical basis and technical support for controlling the milling-induced deformation of micro thin wall parts. Zhuang et al. (2022) investigated the effect of the cutting edge radius on surface roughness in orthogonal cutting of Ti-6Al-4V based on numerical simulation. A finite-element model was established to estimate the machining-induced surface roughness using the coupled Eulerian–Lagrangian (CEL) method, which can be used to simulate the elastic recovery on a machined surface. The fine mesh had better performance in force and surface roughness prediction, and a larger edge radius could result in a larger feed force and a rougher machined surface. Kaltenbrunner et al. (2022) studied the up-milling and down-milling processes for Ti-6Al-4V titanium alloy with respect to the thermomechanical loading and the tool wear. The wear analysis after the cutting experiments suggested the same mechanism for both modes of operation but with a higher rate of wear in up-milling, and the wear was driven by the growth of fatigue cracks and thus indicated a mechanical reason for the tool wear. The simulation result indicated that the specific interaction between thermal and mechanical loading in up-milling was the reason for accelerated tool wear in up-milling compared to down-milling. The higher rate of wear in up-milling was attributed to its specific thermomechanical loading. Maeng et al. (2020) proposed a model to describe the micro grinding of the difficult-to-cut material and predicted the grinding force. The model for calculating the grinding force was established considering the contact area, grit size and distribution, tool shape, cutting depth, and cutting speed.
PCD tools have been widely used for machining difficult-to-cut materials. Micro grinding with a PCD tool was one promising approach for fabricating a micro mold on difficult-to-cut materials (Maeng et al., 2020). Araujo et al. (2020) conducted milling experiments of Ti-6Al-4V using PCD tools and found that the PCD tool with a straight edge had a longer tool life, but in contrast to the carbide tool, the local wear behavior on the cutting edge was not constant when the depth of the cut increased, which was distinctly different from the features of carbide tools. The cutting force magnitude and its dynamic change affect the life of PCD tools in milling drastically and limit the increase in the material removal rate. Zhang et al. (2020) studied the cutting responses of an additive manufactured Ti-6Al-4V alloy using a solid ceramic tool in dry high-speed milling processes. The results indicated that the feed rate had greater impacts on the magnitudes of cutting forces and temperature fields compared to the cutting speed. The solid ceramic tool produced favorable machined surfaces under high-speed machining conditions apart from the occurrence of tool marks. The mechanisms responsible for tool wear were determined to be micro chipping and chip adhesion owing to the mechanical and thermal loading. Chen et al. (2020) designed a micro end mill to simulate the micromilling of GH4169 with a three-dimensional finite-element method in order to determine the optimal tool geometric parameters since this had a significant effect on the milling process. A micro end mill of PCD was manufactured through the precision grinding method, assisted by laser-induced graphitization. Cutting experiments demonstrated that the PCD micro end mill had better cutting performance than a commercial cemented carbide one (Chen et al., 2020).
From the literature review, it is clear that, although there have been extensive studies on the machining characteristics of Ti-6Al-4V and the application of PCD tools to the machining of hard to difficult materials, there is a lack of investigations into fabricating titanium alloy high-aspect-ratio (HAR) thin walls by micromilling processes using PCD end mills. Considering that titanium alloy is a kind of difficult-to-machine material and that PCD tools have good thermal conductivity and extremely high hardness, using PCD end mills for titanium alloy thin wall fabrication is highly promising. In this study, customized straight edge PCD tools with different rake angles are fabricated and used to carry out micromilling experiments on HAR thin walls on the Ti-6Al-4V titanium alloy. The fundamental milling characteristics are explored in detail. A thin wall deformation model is established, based on which micromilling of high-accuracy HAR thin walls with large aspect ratios has been investigated.
2.1 PCD micro end mill
Based on previous studies (Cheng et al., 2018, 2008, 2011), micro end mills with straight peripheral and end cutting edges are fabricated as shown in Fig. 1. The PCD micro end mill is composed of two parts, which are the handle of the carbide material and the cutting edge of the PCD material, and the cutting edge is welded together with the handle by brazing. The cutting edge is processed according to a certain geometric angle by using the four-axis wire-cut electrical discharge machine, and PCD micro end mills of different angles and shapes can be obtained. The tool diameter is 1 mm. In order to analyze the influence of the tool geometries on the machining effects, cutting edges with three different rake angles (−30, −45, and −60°) are fabricated.
2.2 Micromilling setup
Cutting edge radii vary with the rake angles of the fabricated PCD end mills. It is very important to accurately identify the cutting edge radius and determine the feed engagement corresponding to the minimum undeformed cutting thickness (MUCT) in the microcutting process. Then, appropriate micromilling process parameters can be defined.
According to the literature (Cheng et al., 2018, 2014; Li et al., 2021a), there are three kinds of cutting modes for milling, as shown in Fig. 2, where fz is the feed engagement, ae is the radial depth of the cut, R is the radius of the tool, and h is the undeformed chip thickness. Mode 3 is hardly used due to the problem of surface roughening. At the same time, since the radial depth of the cut in the thin wall machining process is small and far less than the radius of the tool, Mode 1 is not applicable. Accordingly, Mode 2 is selected for this study.
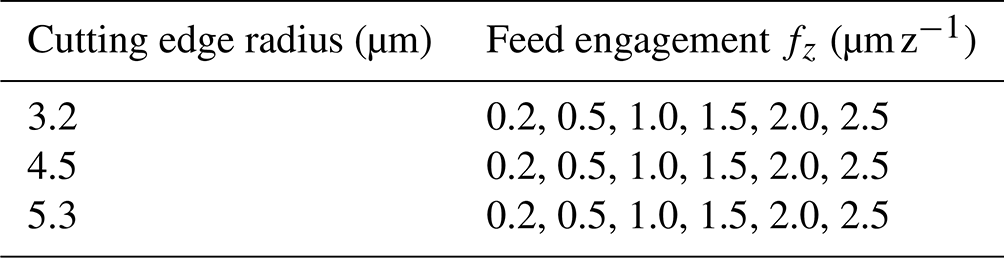
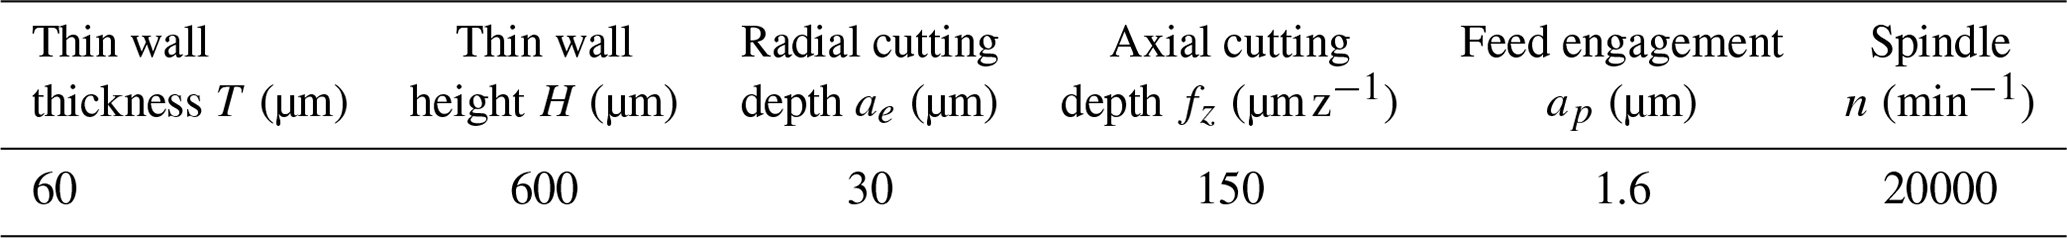
The radii of the cutting edges of the three different rake angle tools measured by a scanning electron microscope (SEM) are 3.2, 4.5, and 5.3 µm, respectively. Based on previous studies (Cheng et al., 2018, 2014), the specific micromilling parameters are selected for the peripheral cutting edge as shown in Table 1.
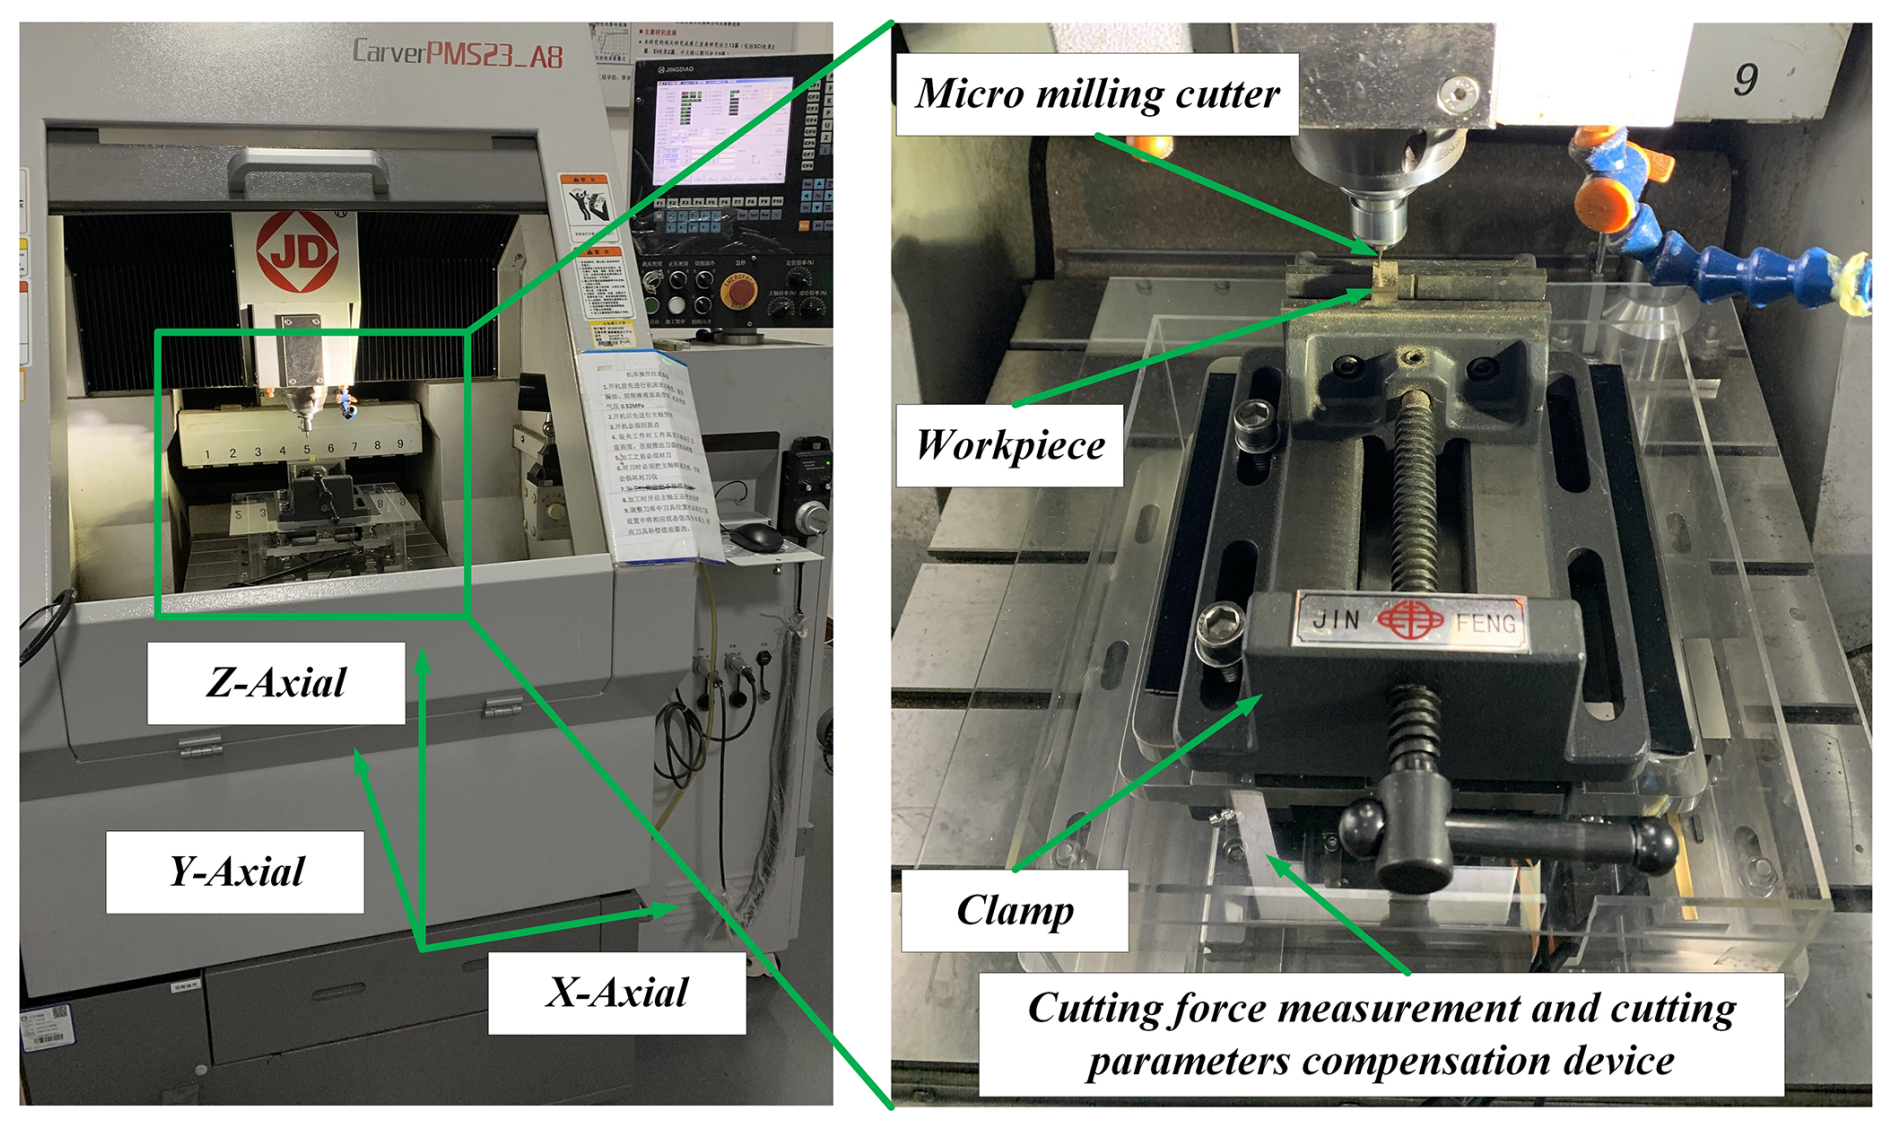
The computer numerical control (CNC) micromilling machine tool CarverPMS23_A8 is used to conduct the experiments, as shown in Fig. 3. The programming resolution for each linear axis is 0.1 µm. The maximum rotation speed of the spindle is 36 000 min−1. The surface roughness is measured by an Olympus DSX1000 ultra-depth microscope, each feature is measured three times (denoted as Ra1, Ra2, and Ra3), and the average value of the three measurements is calculated for the analysis. A thermal-imaging camera, FLIR-A615, is used to measure the temperature of the cutting region. The cutting force is measured by a Kilster-9257B dynamometer. The tool wear and EDS are measured by the Quanta-250 SEM.
2.3 Compensation device
Based on previous experimental research on dimensional error compensation of a brass material thin wall (Li et al., 2021b), the wall thickness compensation experiments are carried out using PCD tools. In order to measure the cutting force produced in the thin wall milling process and adjust the radial cutting parameter to compensate for the elastic deformation of thin walls, the online cutting force measurement and cutting parameter compensation device is applied (Li et al., 2022).
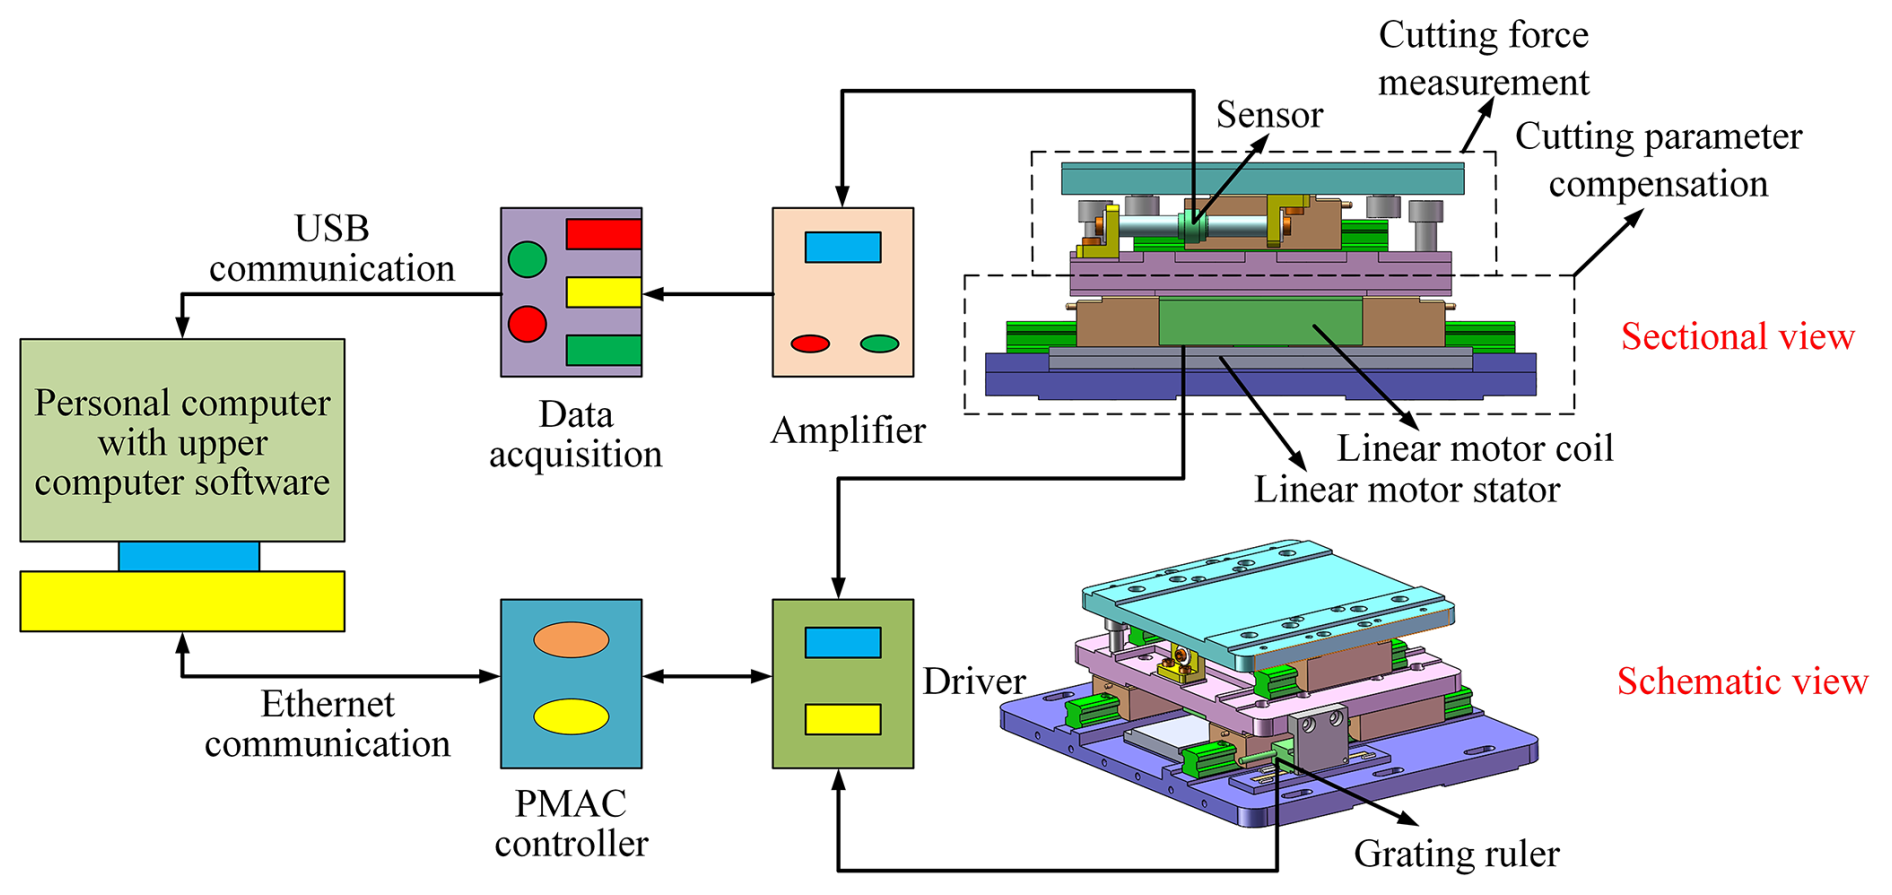
Figure 4 shows the three-dimensional structure and the control system diagram of the designed cutting force measurement and cutting parameter compensation device. It is mainly composed of two components, the cutting force measurement component and the cutting parameter compensation component. The cutting force measurement component is composed of a piezoelectric sensor and two guide rails and slides. The resolution of the piezoelectric sensor is 0.001 N, and the comprehensive accuracy is 0.005 N. The cutting parameter compensation component is composed of a linear motor, two guide rails and slides, and a grating ruler. The resolution of the motion system is 0.1 µm, and the positioning accuracy is within 0.5 µm. The force signal is amplified and transmitted to the computer after analogue–digital (A/D) conversion from the USB port and processed by the upper computer to get the final measured cutting force value. The upper computer sends the motion instruction to the programmable multi-axis controller (PMAC) through the Ethernet port. The linear motor is used to realize the desired compensation movement.
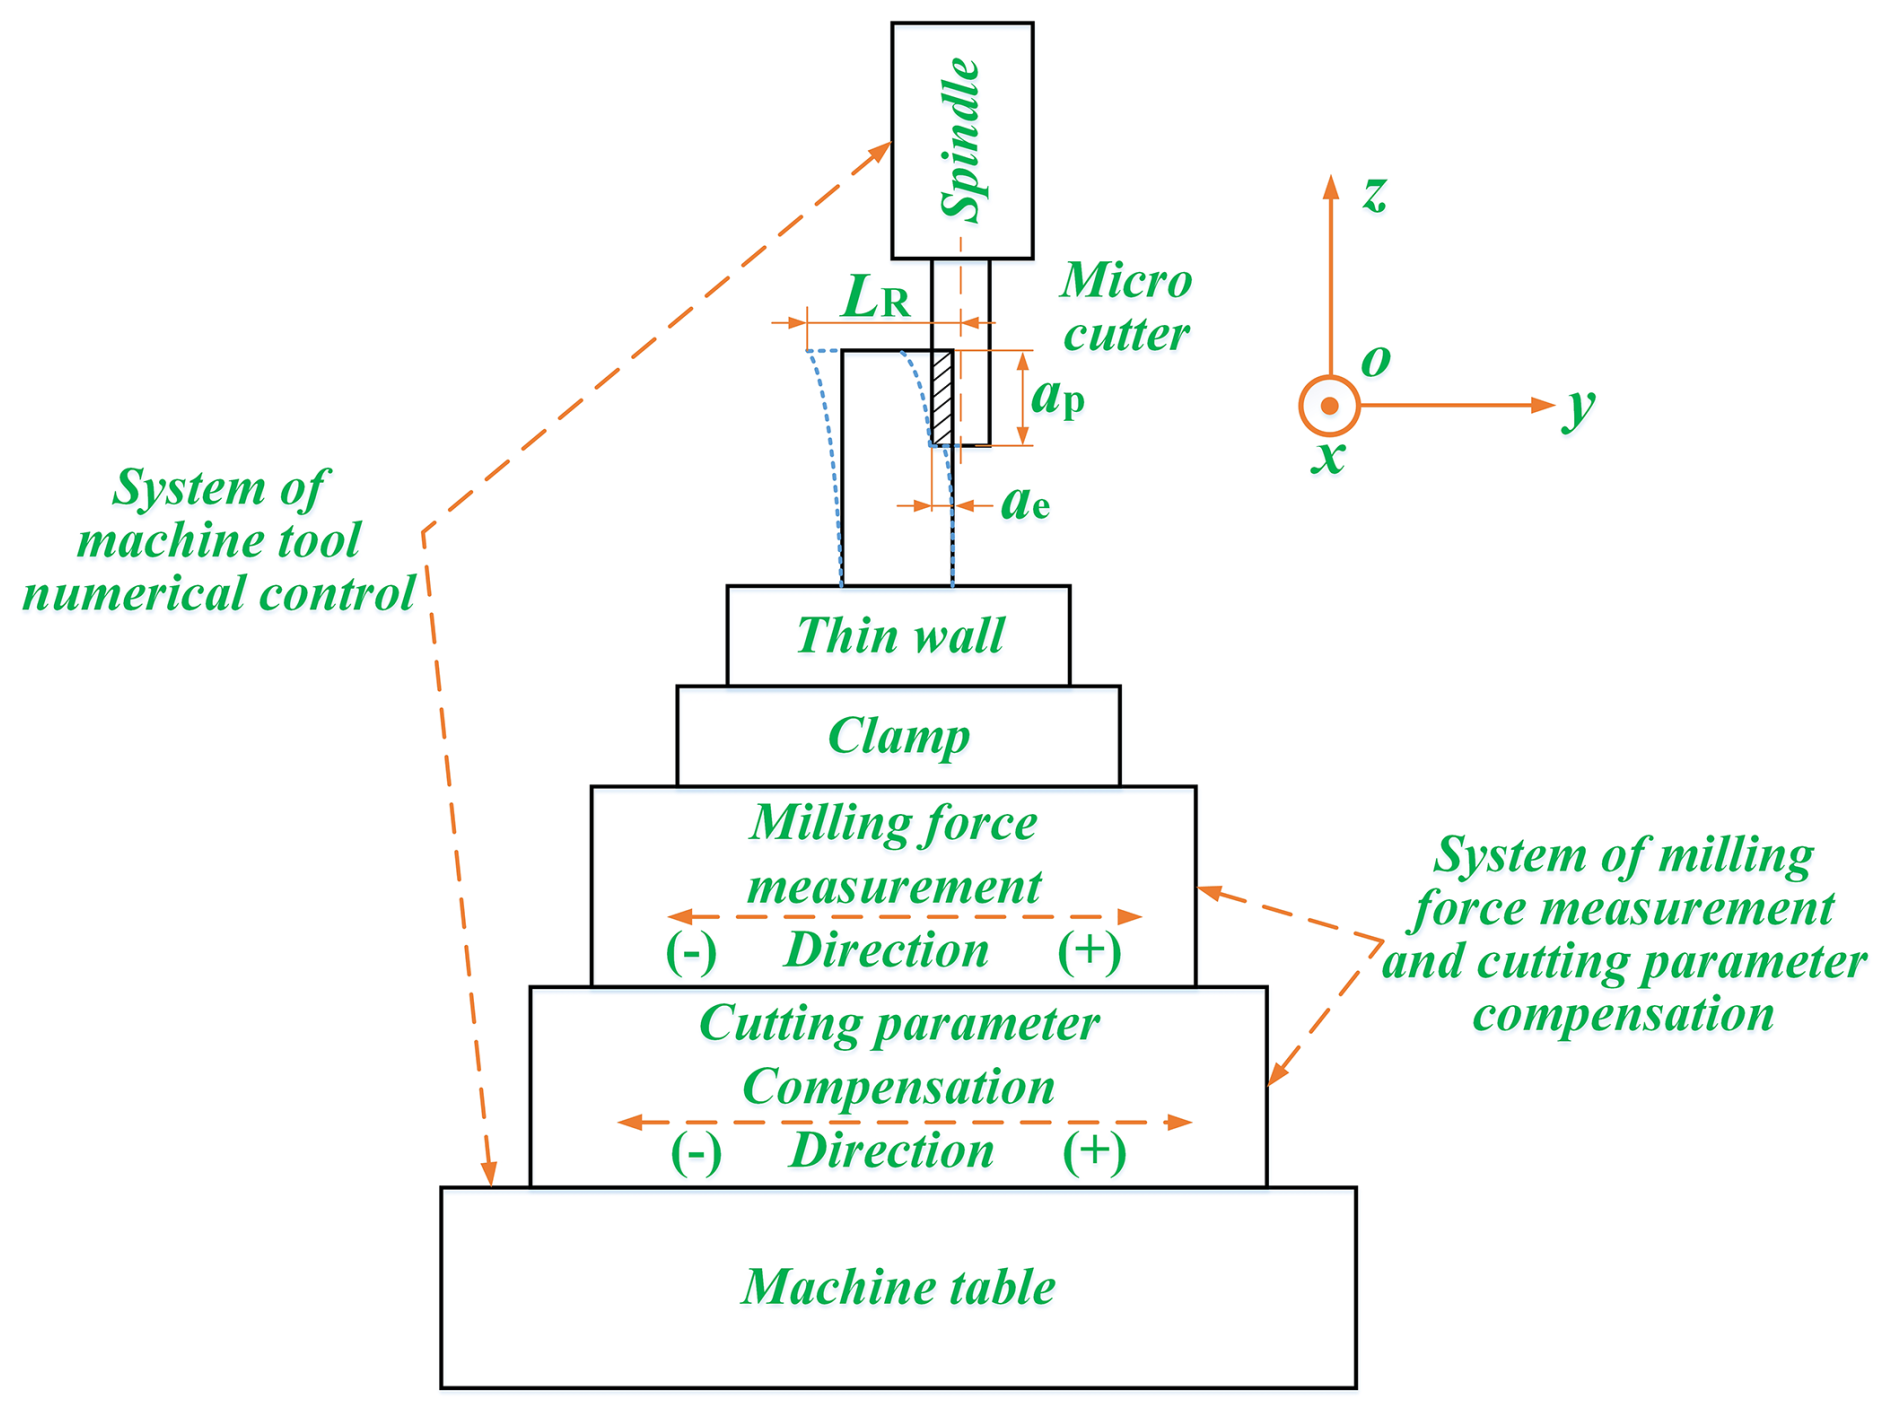
The working principle of the proposed device is shown in Fig. 5. The spindle is fed in the x direction, and the cutting force measurement system is used to measure the radial cutting force perpendicular to the micro straight thin wall. After reading and processing the cutting force, the upper computer outputs the command to the PMAC controller. The device can realize the linear motion perpendicular to the thin wall direction so as to realize the compensation of the radial cutting parameter. The cutting force measurement and cutting parameter compensation device is fixed on the worktable of the machine. The workpiece is fixed on the proposed device through the clamp.
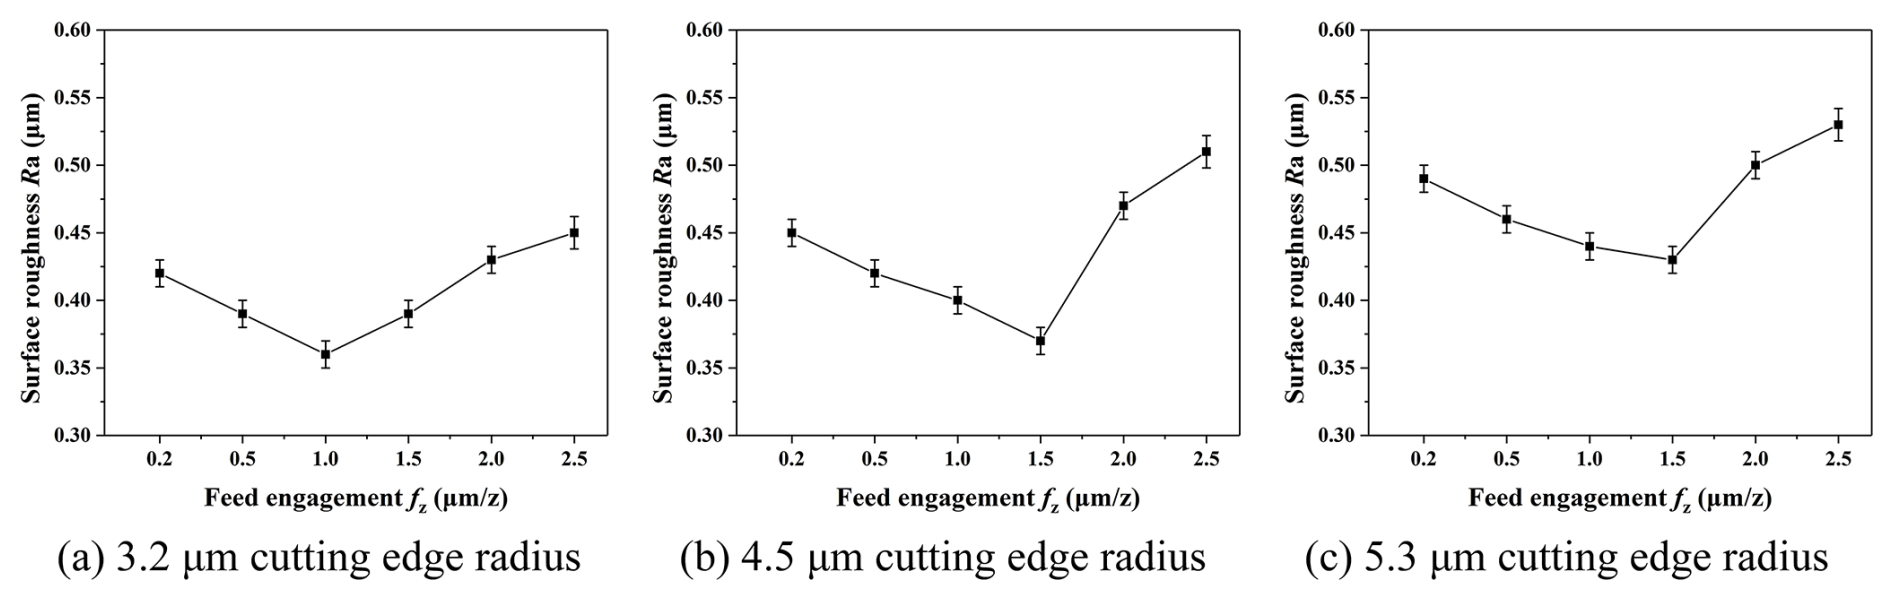
Table 2The cutting parameter selection for the Ti-6Al-4V thin wall.
In this study, the cutting force of any point of the thin wall is first measured by the online cutting force measurement and cutting parameter compensation device in the thin wall milling process. Then the deformation value at that point is calculated by the online compensation system based on the thin wall deformation model. The cutting parameter is finally compensated by the online cutting force measurement and cutting parameter compensation device according to the deformation value.
2.4 Filtering and processing of the cutting force signal
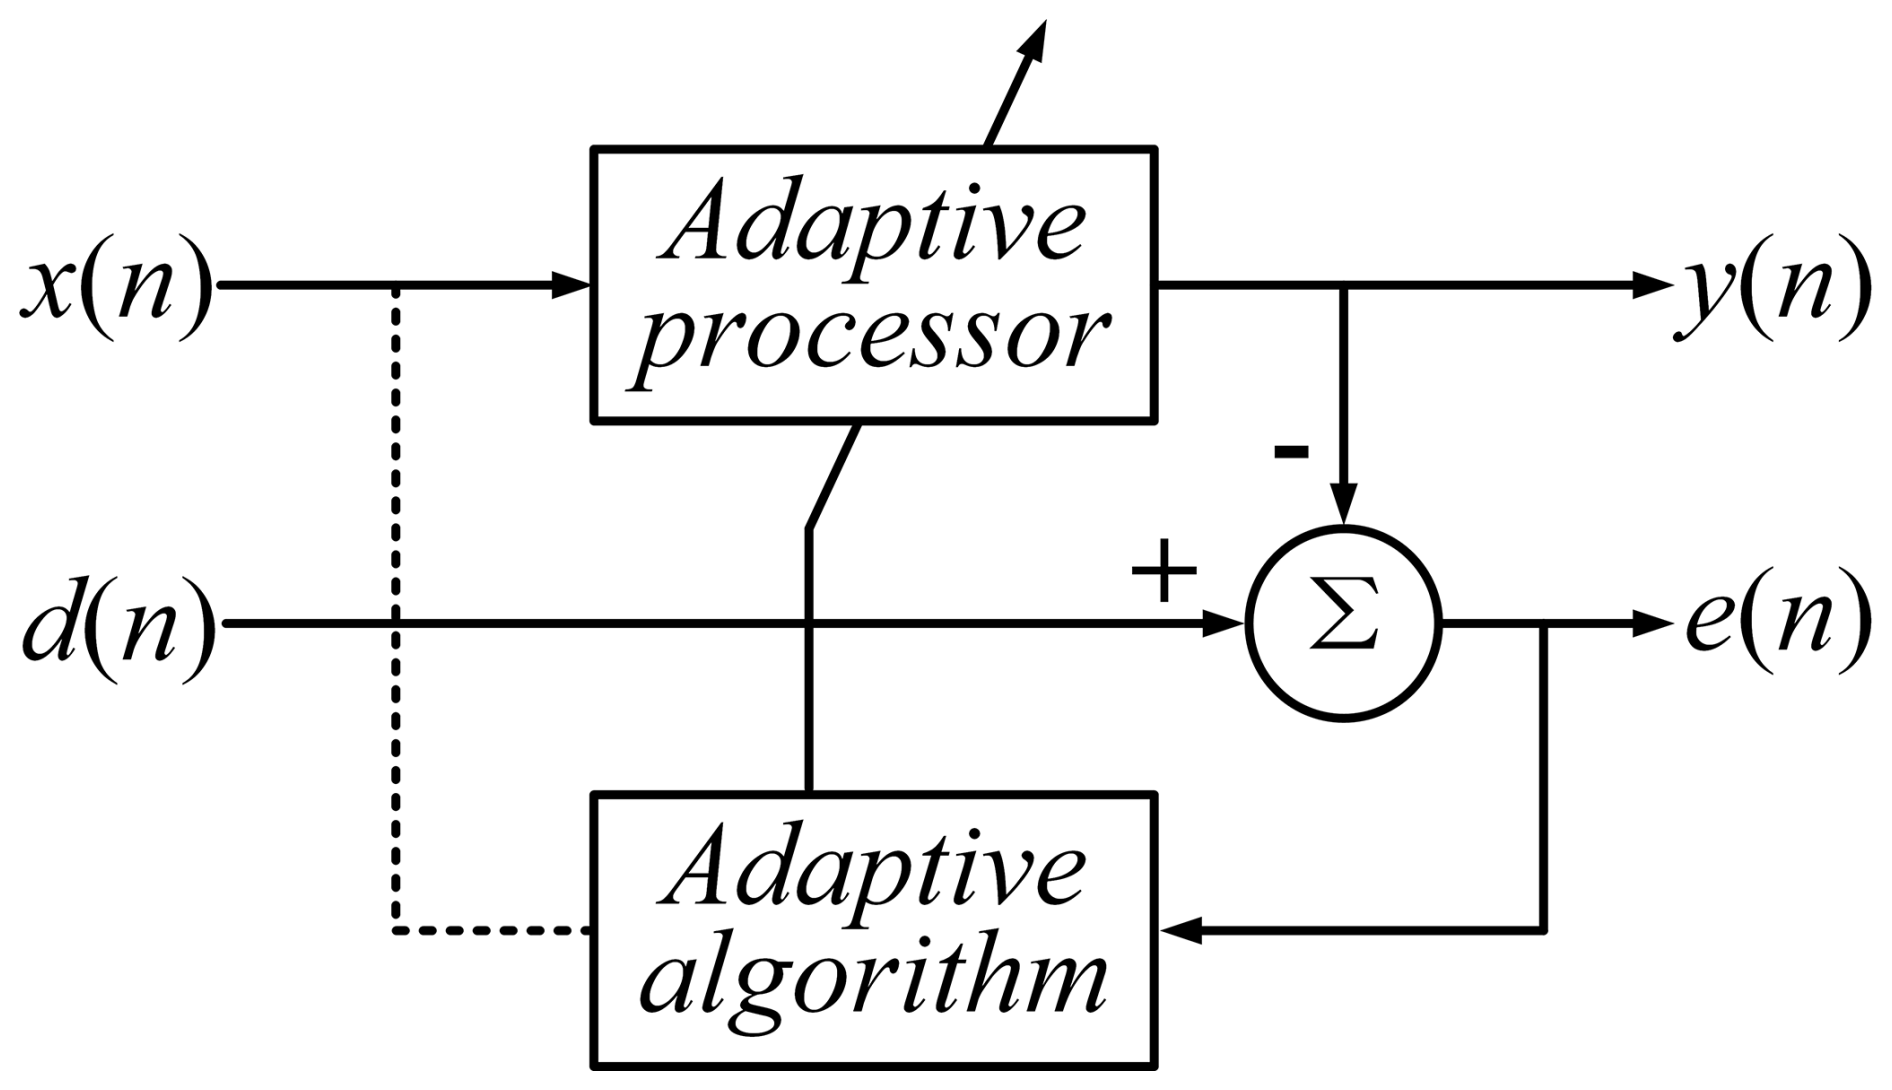
Since the amplitude of the measured cutting force in the micro machining process is at a single Newton level or even smaller, the change in the force signal (such as the vibration of the machine tool) will affect the measurement accuracy and consequent compensation effectiveness. Therefore, it is very important to filter the measured cutting force signal and remove the clutter signal. In this study, the adaptive filtering method is used to filter the measured cutting force signal. Adaptive filtering is an optimal filtering method developed on the basis of linear filtering such as Wiener filtering or Kalman filtering. Because of its stronger adaptability and better filtering performance, it has been widely used in engineering practices, especially in information processing technology. The principle of the adaptive filter is shown in Fig. 6.
The traditional adaptive filtering algorithm equation based on the least mean square (LMS) algorithm is shown in Eqs. (1) and (2).
X(n) = represents the input signal vector at time n, represents the weight coefficient of adaptive filtering at time n, L is the order of the filter, d(n) is the desired output value, e(n) is the error value, and u is the step factor controlling the stability and convergence rate.
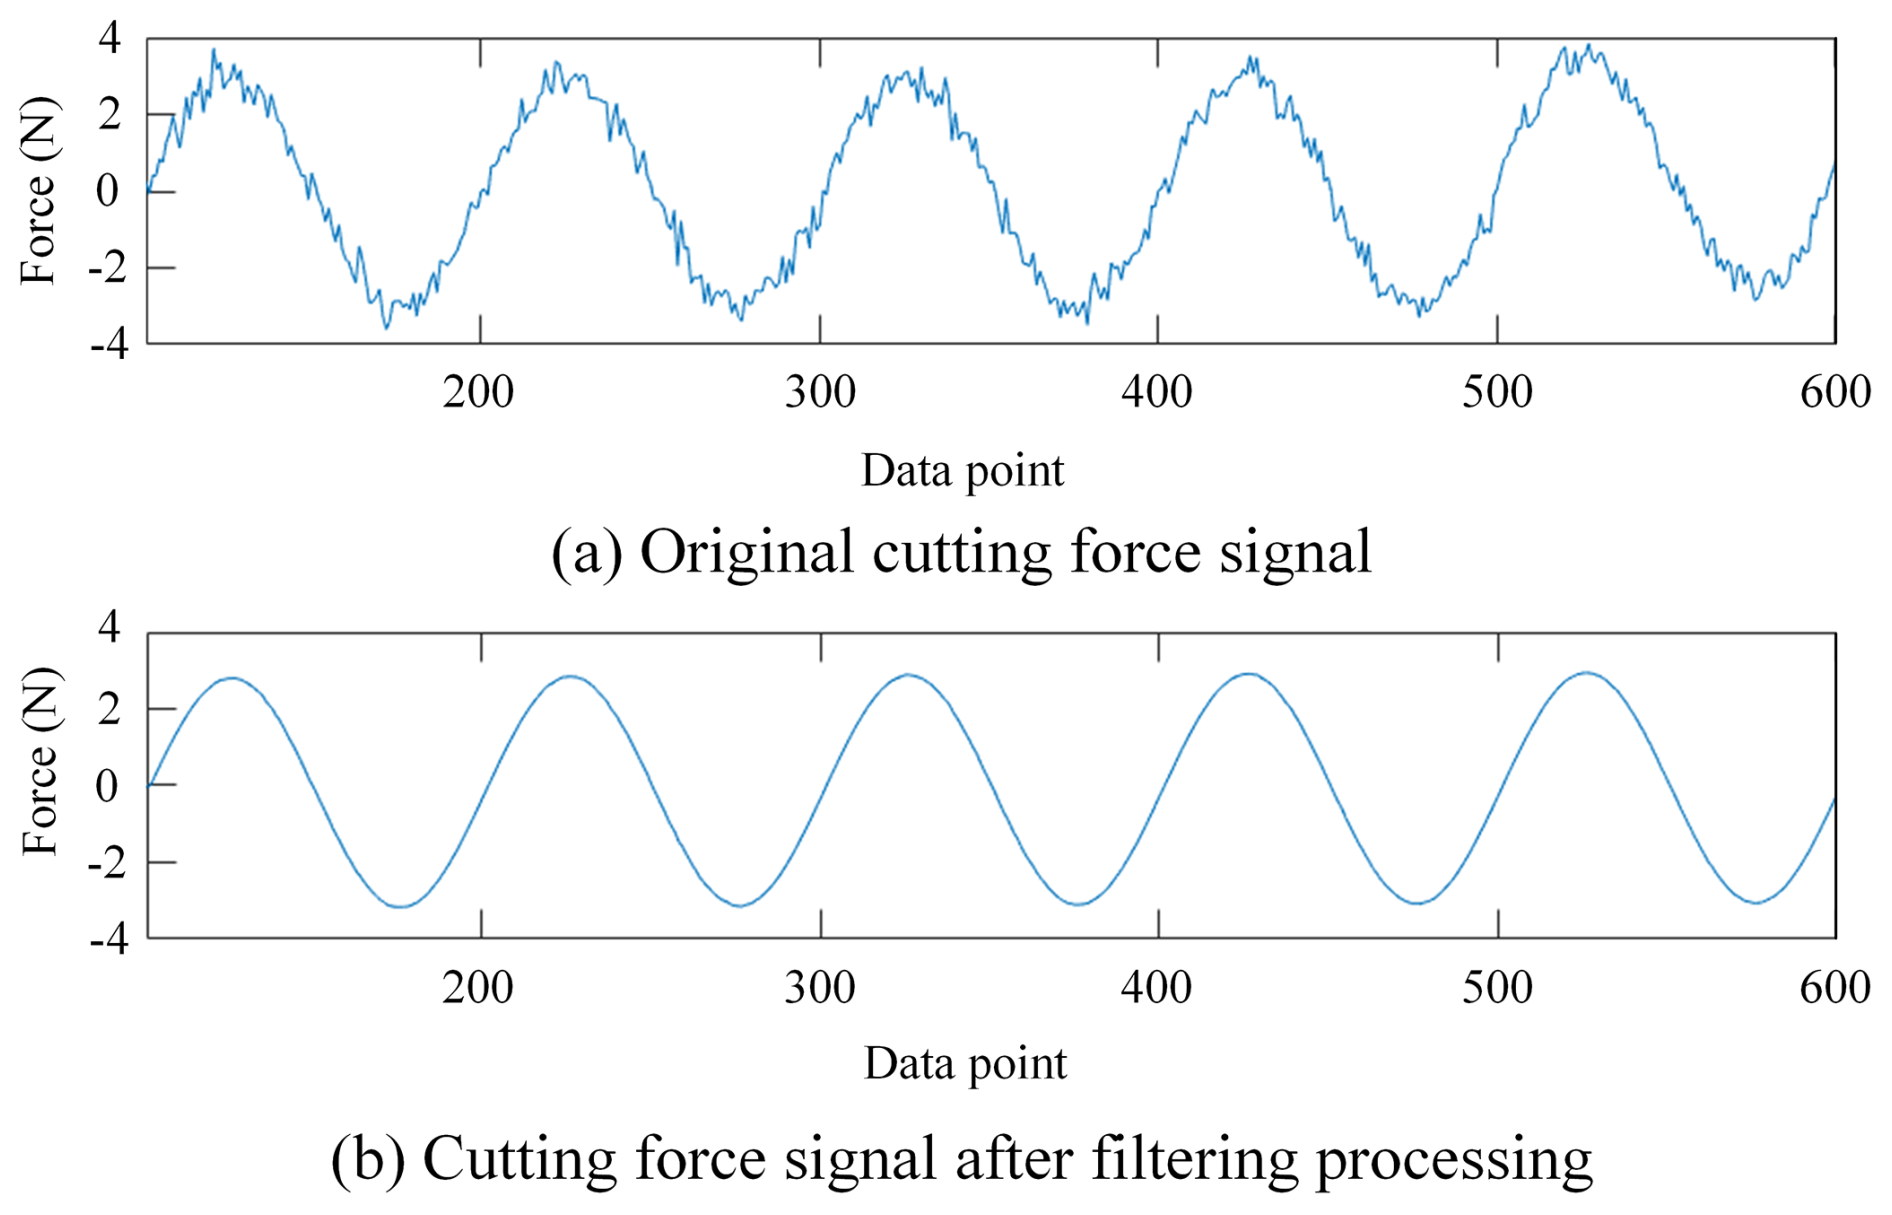
Figure 7a shows the collected original cutting force signal, where it fluctuates irregularly. Figure 7b shows the cutting force signal after adaptive filtering. Obviously, the processed cutting force signal becomes continuous and smooth.
Since titanium alloy is a kind of difficult-to-machine material, its elastic modulus is small and its strength is high compared with most metal materials. It causes the thin wall machining quality to be seriously affected by thermal–mechanical coupling and tool wear during the cutting process. The prediction model of thin wall deformation of brass material is based on mechanical theory when modeling, and only the influence of the force on deformation is considered. Therefore, it is necessary to establish a new model for titanium alloy material.
2.5 Thin wall deformation model for titanium alloy
In order to simplify the complexity of modeling and improve the computational accuracy of the model, the thin wall cutting experiment is first carried out. Then the relationship between the thin wall deformation and the thin wall size and deformation position is established by measuring the fabricated thin walls. The prediction model of the thin wall deformation is finally calibrated by solving the undetermined coefficients so as to realize the prediction of the thin wall deformation.
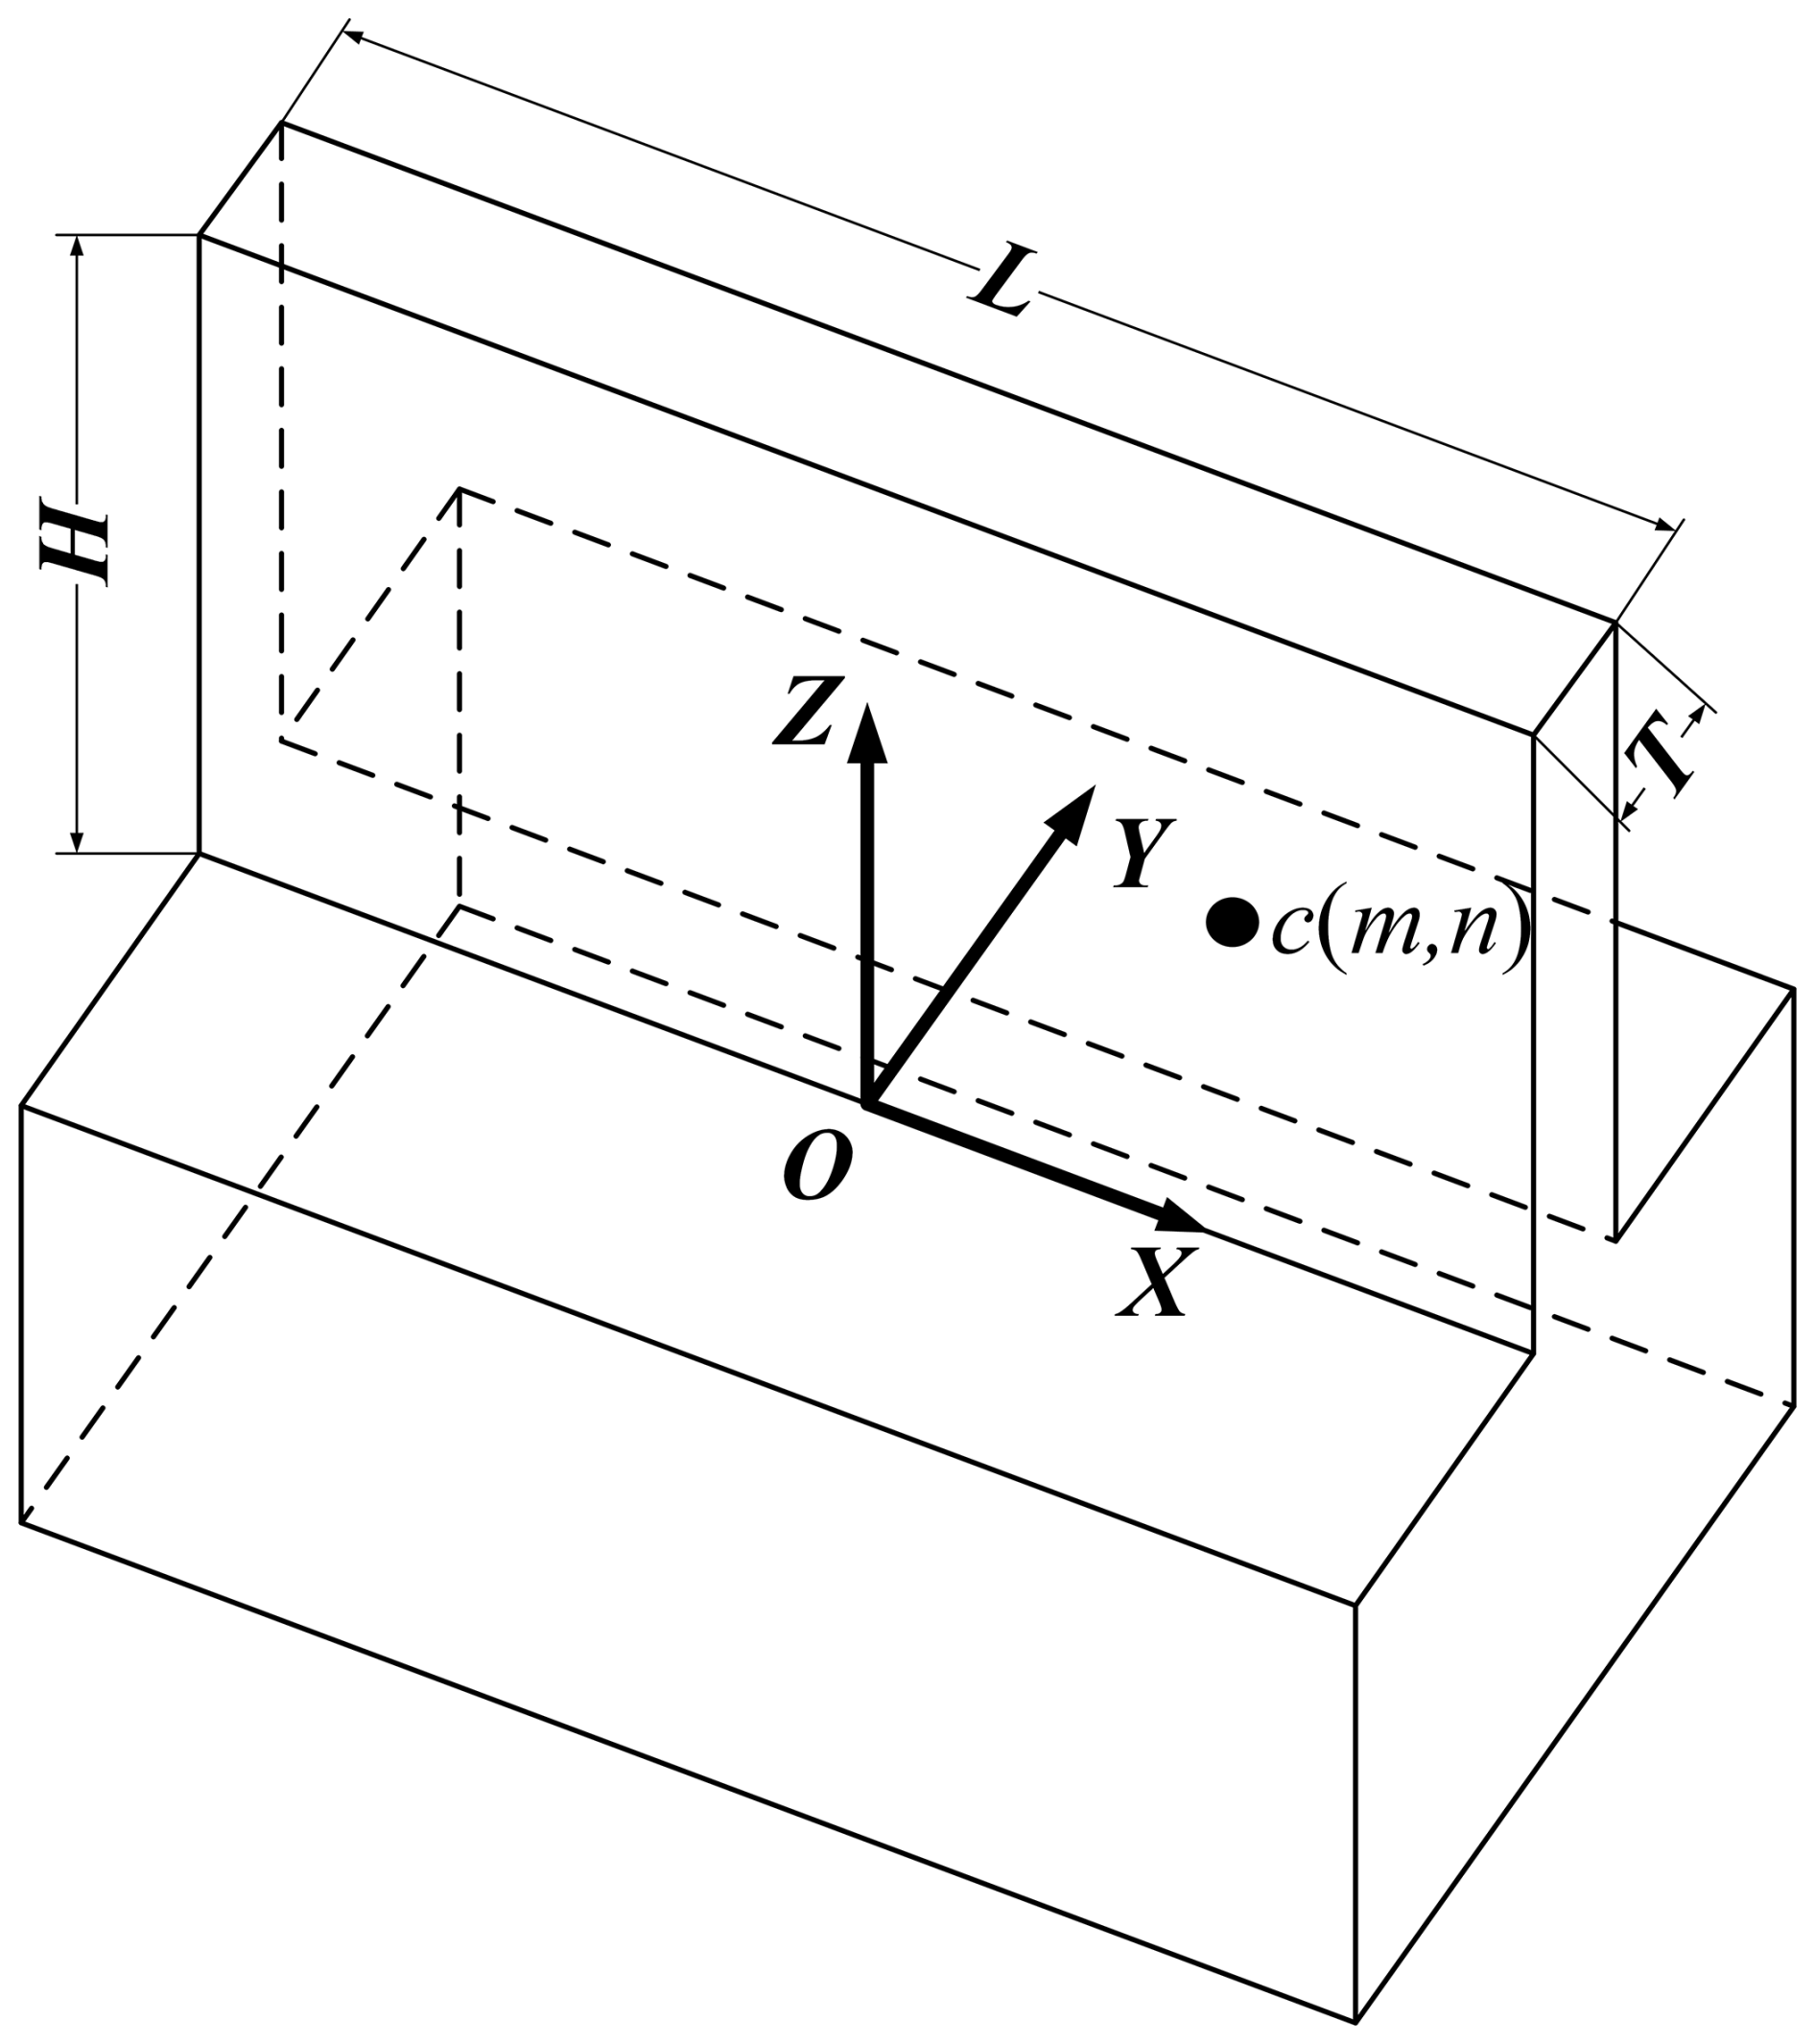
The diagram of the thin wall is shown in Fig. 8, where the deformation value of any point c(m, n) on the thin wall can be expressed by Eq. (3):
where l(m,n) is the deformation value of point c(m,n), F(m,n) is the cutting force of point c(m,n), and K(m,n) is the stiffness of point c(m,n).
The stiffness K can be expressed by Eq. (4):
where K is the stiffness of the thin wall, A is a constant coefficient, E is the elastic modulus of the thin wall material, L is the thin wall length, T is the thin wall thickness, H is the thin wall height, m is the distance between point c and the z axis, and n is the distance between point c and the x axis. a1, a2, a3, a4, and a5 are undetermined coefficients.
Since A and E are two constant values, Eq. (4) can be simplified to Eq. (5).
Equation (5) is a nonlinear equation for calculating the stiffness, and the logarithm is commonly used on both sides of Eq. (5) to transform it into the linear Eq. (6).
Let y=LnK, a0=LnB, x1=LnL, x2=LnT, x3=LnH, x4=Lnm, and x5=Lnn. Then its corresponding linear regression equation is expressed by Eq. (7):
where a0, a1, a2, a3, a4, and a5 are the six coefficients to be obtained. y, x1, x2, x3, x4, and x5 are obtained based on the experimental results.
The solving principle of the linear regression equation is to find the minimum sum of squares of deviations at each point. The deviation of each point is expressed by Eq. (8).
Then, the sum of squares of the deviation of each point is expressed by Eq. (9).
In order to solve Eq. (9), Eq. (10) is a necessary condition.
Then, Eq. (11) is obtained using Eq. (10).
Equation (11) can be processed further and expressed by a matrix form of Eq. (12):
where
,
, and
Obviously, matrix M is a symmetric matrix and can be expressed by Eq. (13).
The matrix N can be expressed by Eq. (14).
The matrix A can be solved by Eq. (15). Therefore, the deformation value of any point on the thin wall can be obtained online using Eq. (3).
The undetermined coefficients can be calibrated by substituting the experimental data into Eq. (15). The thin wall deformation prediction model can be obtained by substituting the solved coefficients into Eqs. (3) and (4).
3.1 Surface roughness
According to the literature (Ng et al., 2006), workpiece material will suffer from elastic–plastic deformation (plowing) without forming chips when the cutting thickness is smaller than the MUCT due to the size effect in microcutting. In other words, when the cutting thickness is greater than the MUCT, material will be removed primarily by shearing rather than plowing. As a result, the surface roughness acquired by shearing is better than that acquired by plowing. Therefore, the finished surface roughness is one of the measures for recognizing the MUCT.
The measurement results of surface roughness for the three kinds of cutting edge radii are shown in Fig. 9. The surface roughness values reach minimum values at fz=1.0, 1.5, and 1.5 µm z−1 in Fig. 9a, b, and c, respectively. Therefore, the size effect can be avoided for the three different micro end mills when the feed engagement is greater than or equal to 1.5 µm z−1. Micromilling parameters for thin walls made of Ti-6Al-4V are selected as shown in Table 2. Based on previous micromilling experiences (Li et al., 2021b, c), the layered cutting method, down-milling, and dry cutting processes are selected in this study.
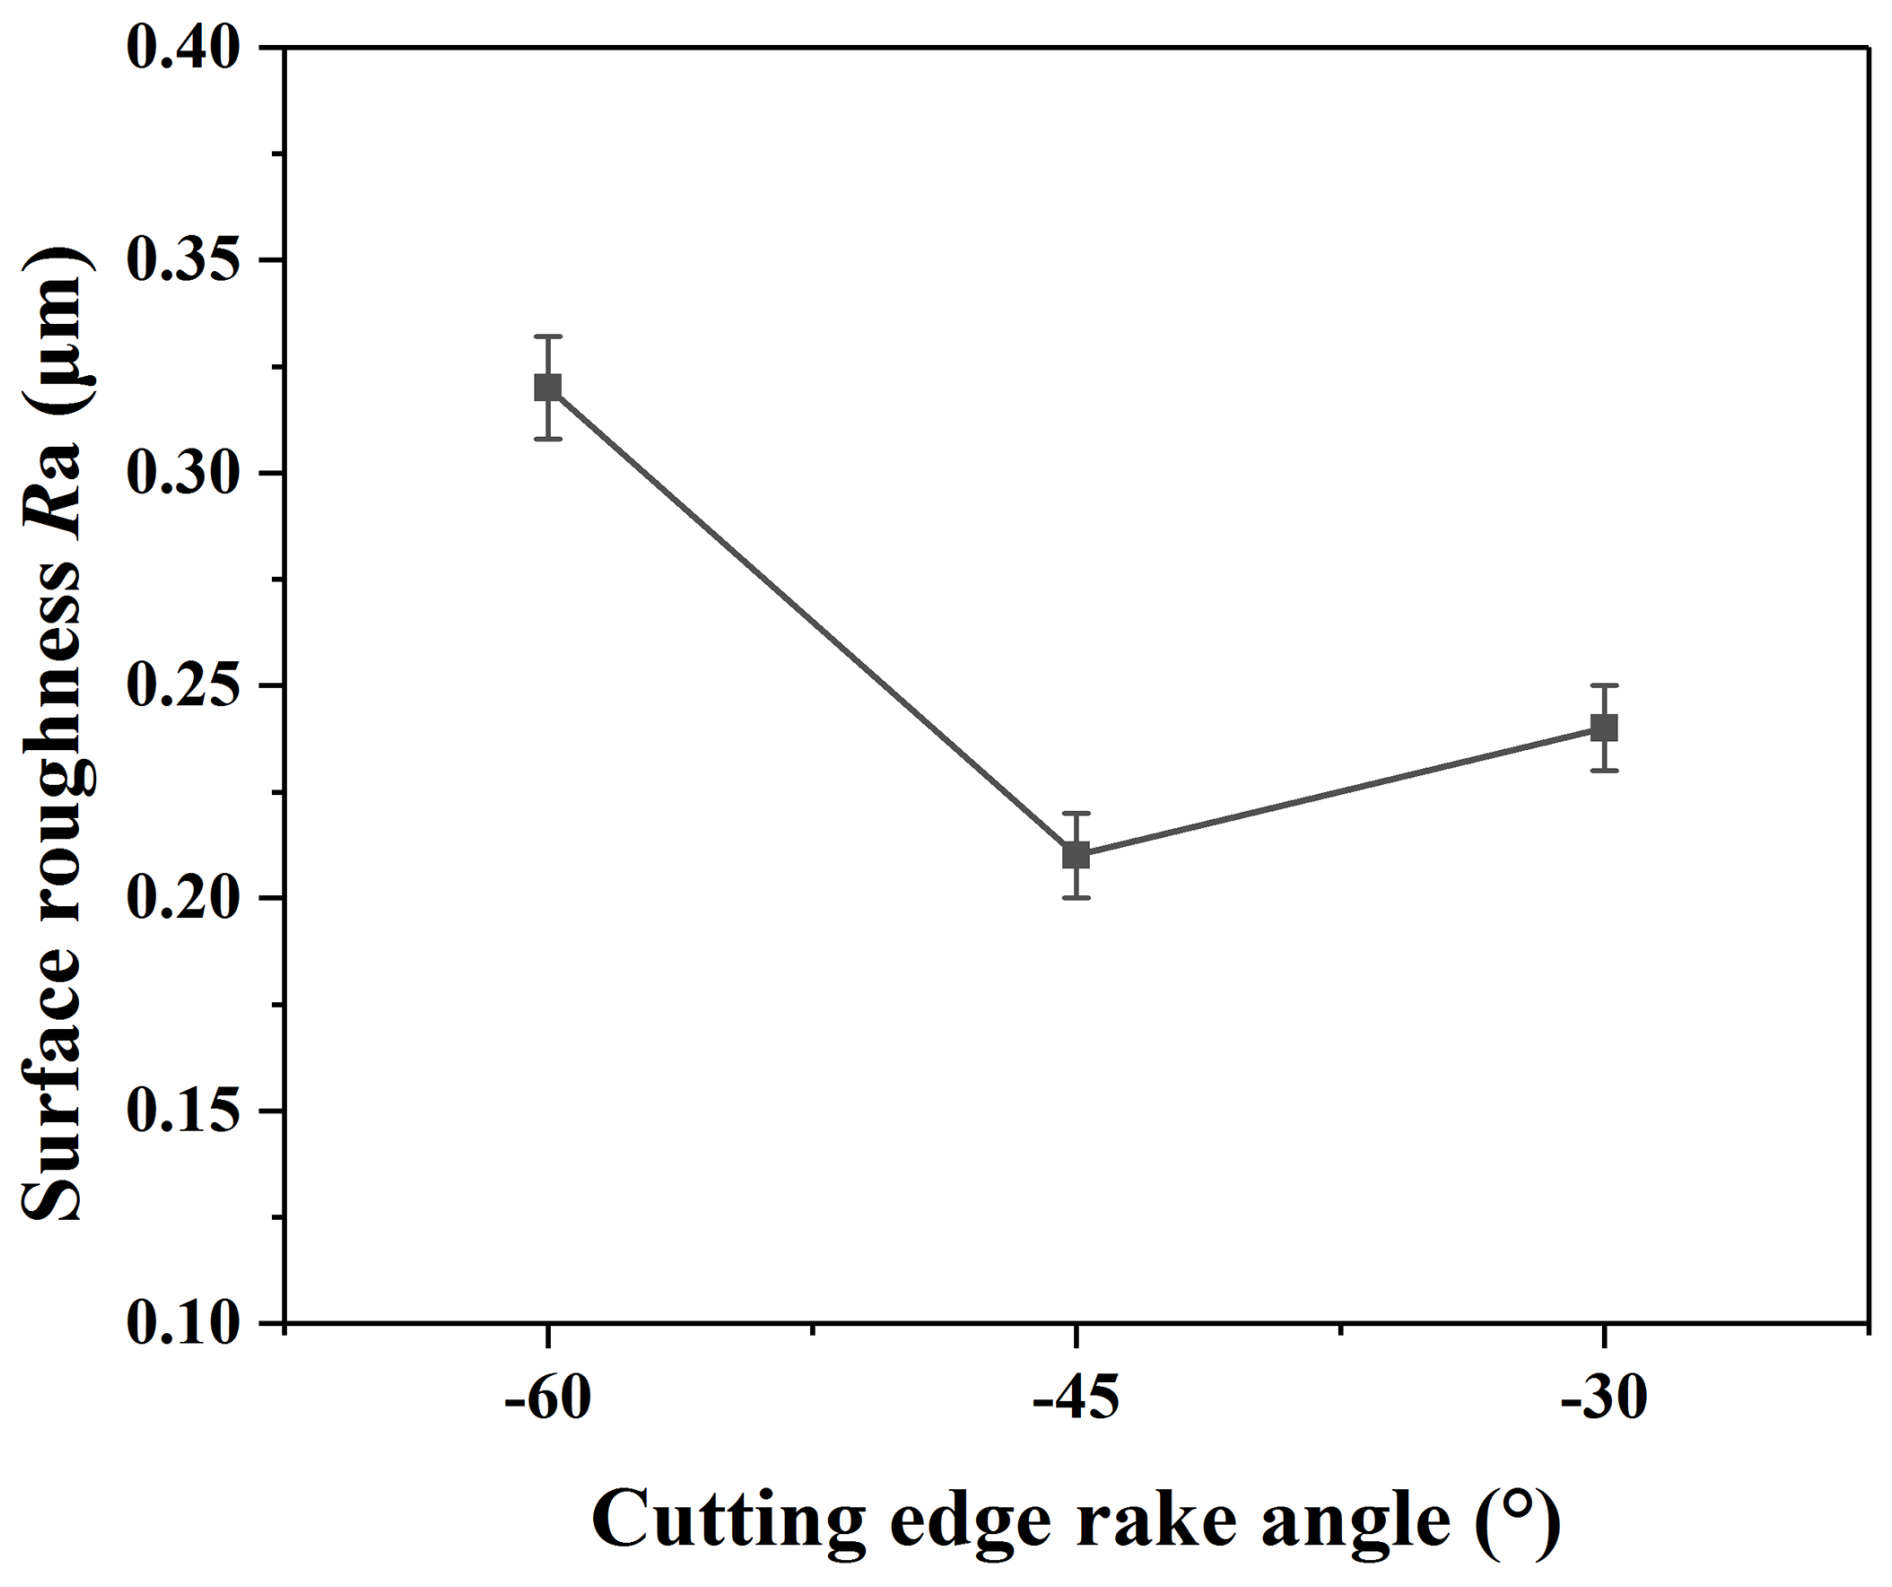
Figure 10 shows the measurement results of the surface roughness. The surface roughness created by the PCD end mill with a −45° rake angle reaches the smallest value, and that of the −60° rake angle has the largest value. The surface processing quality of the workpiece of a −60° rake angle is relatively poor, which may be affected by the serious tool wear.
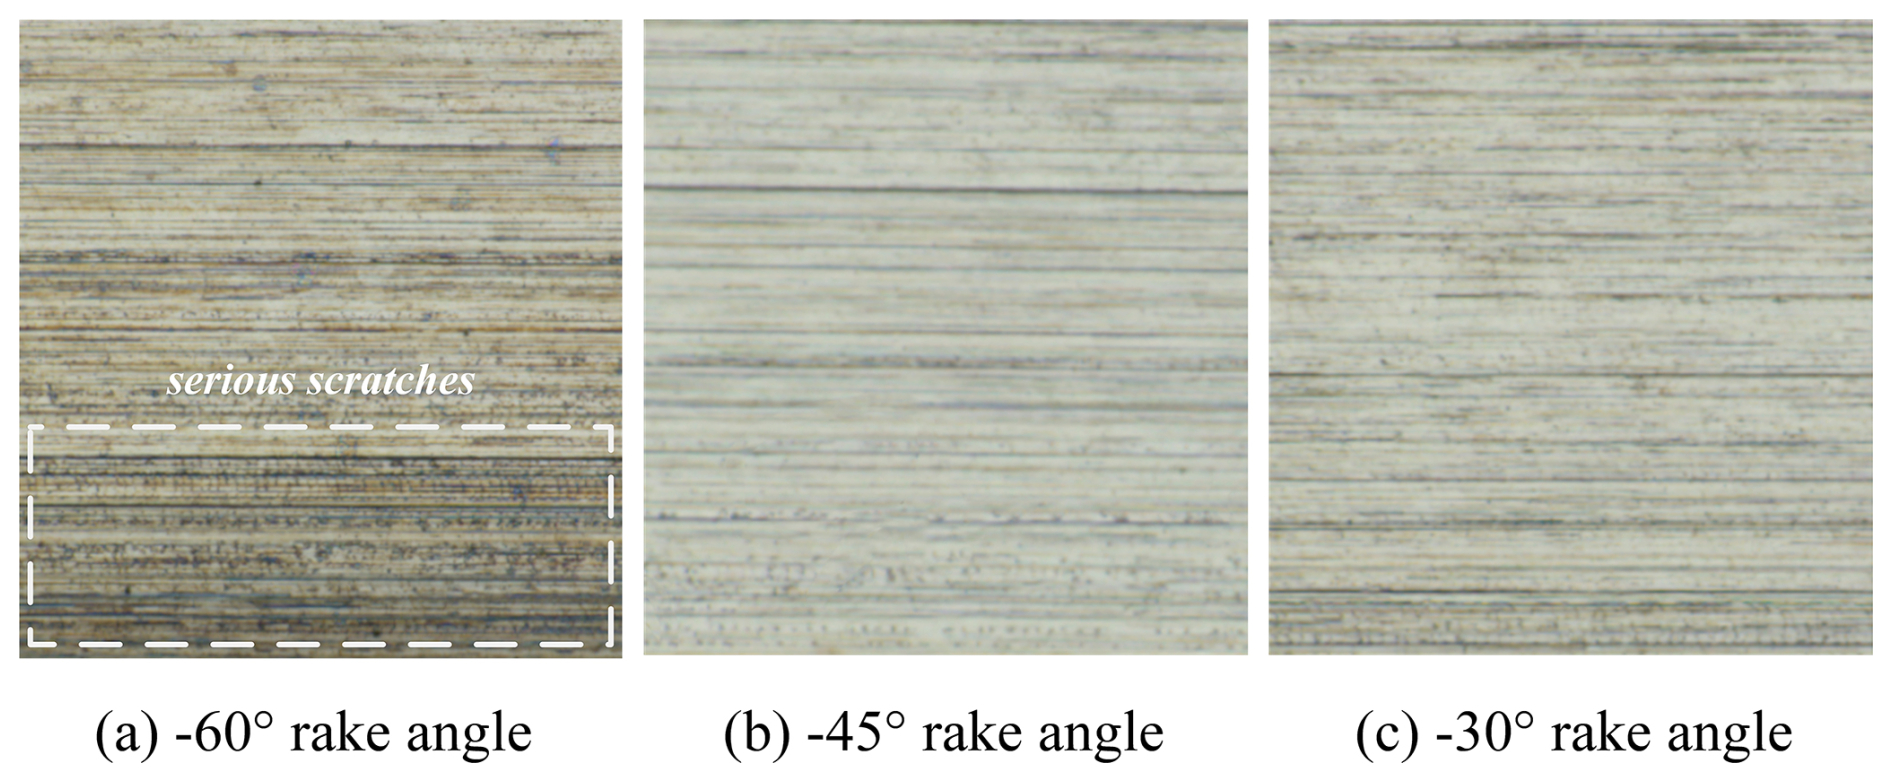
Figure 11 shows the surface topography measurement results. The surface topographies machined by the PCD end mills with −30 and −45° cutting edge rake angles are better than those with serious scratches from a −60° cutting edge rake angle. The reason is believed to be similar to that of the surface roughness.
3.2 Cutting force
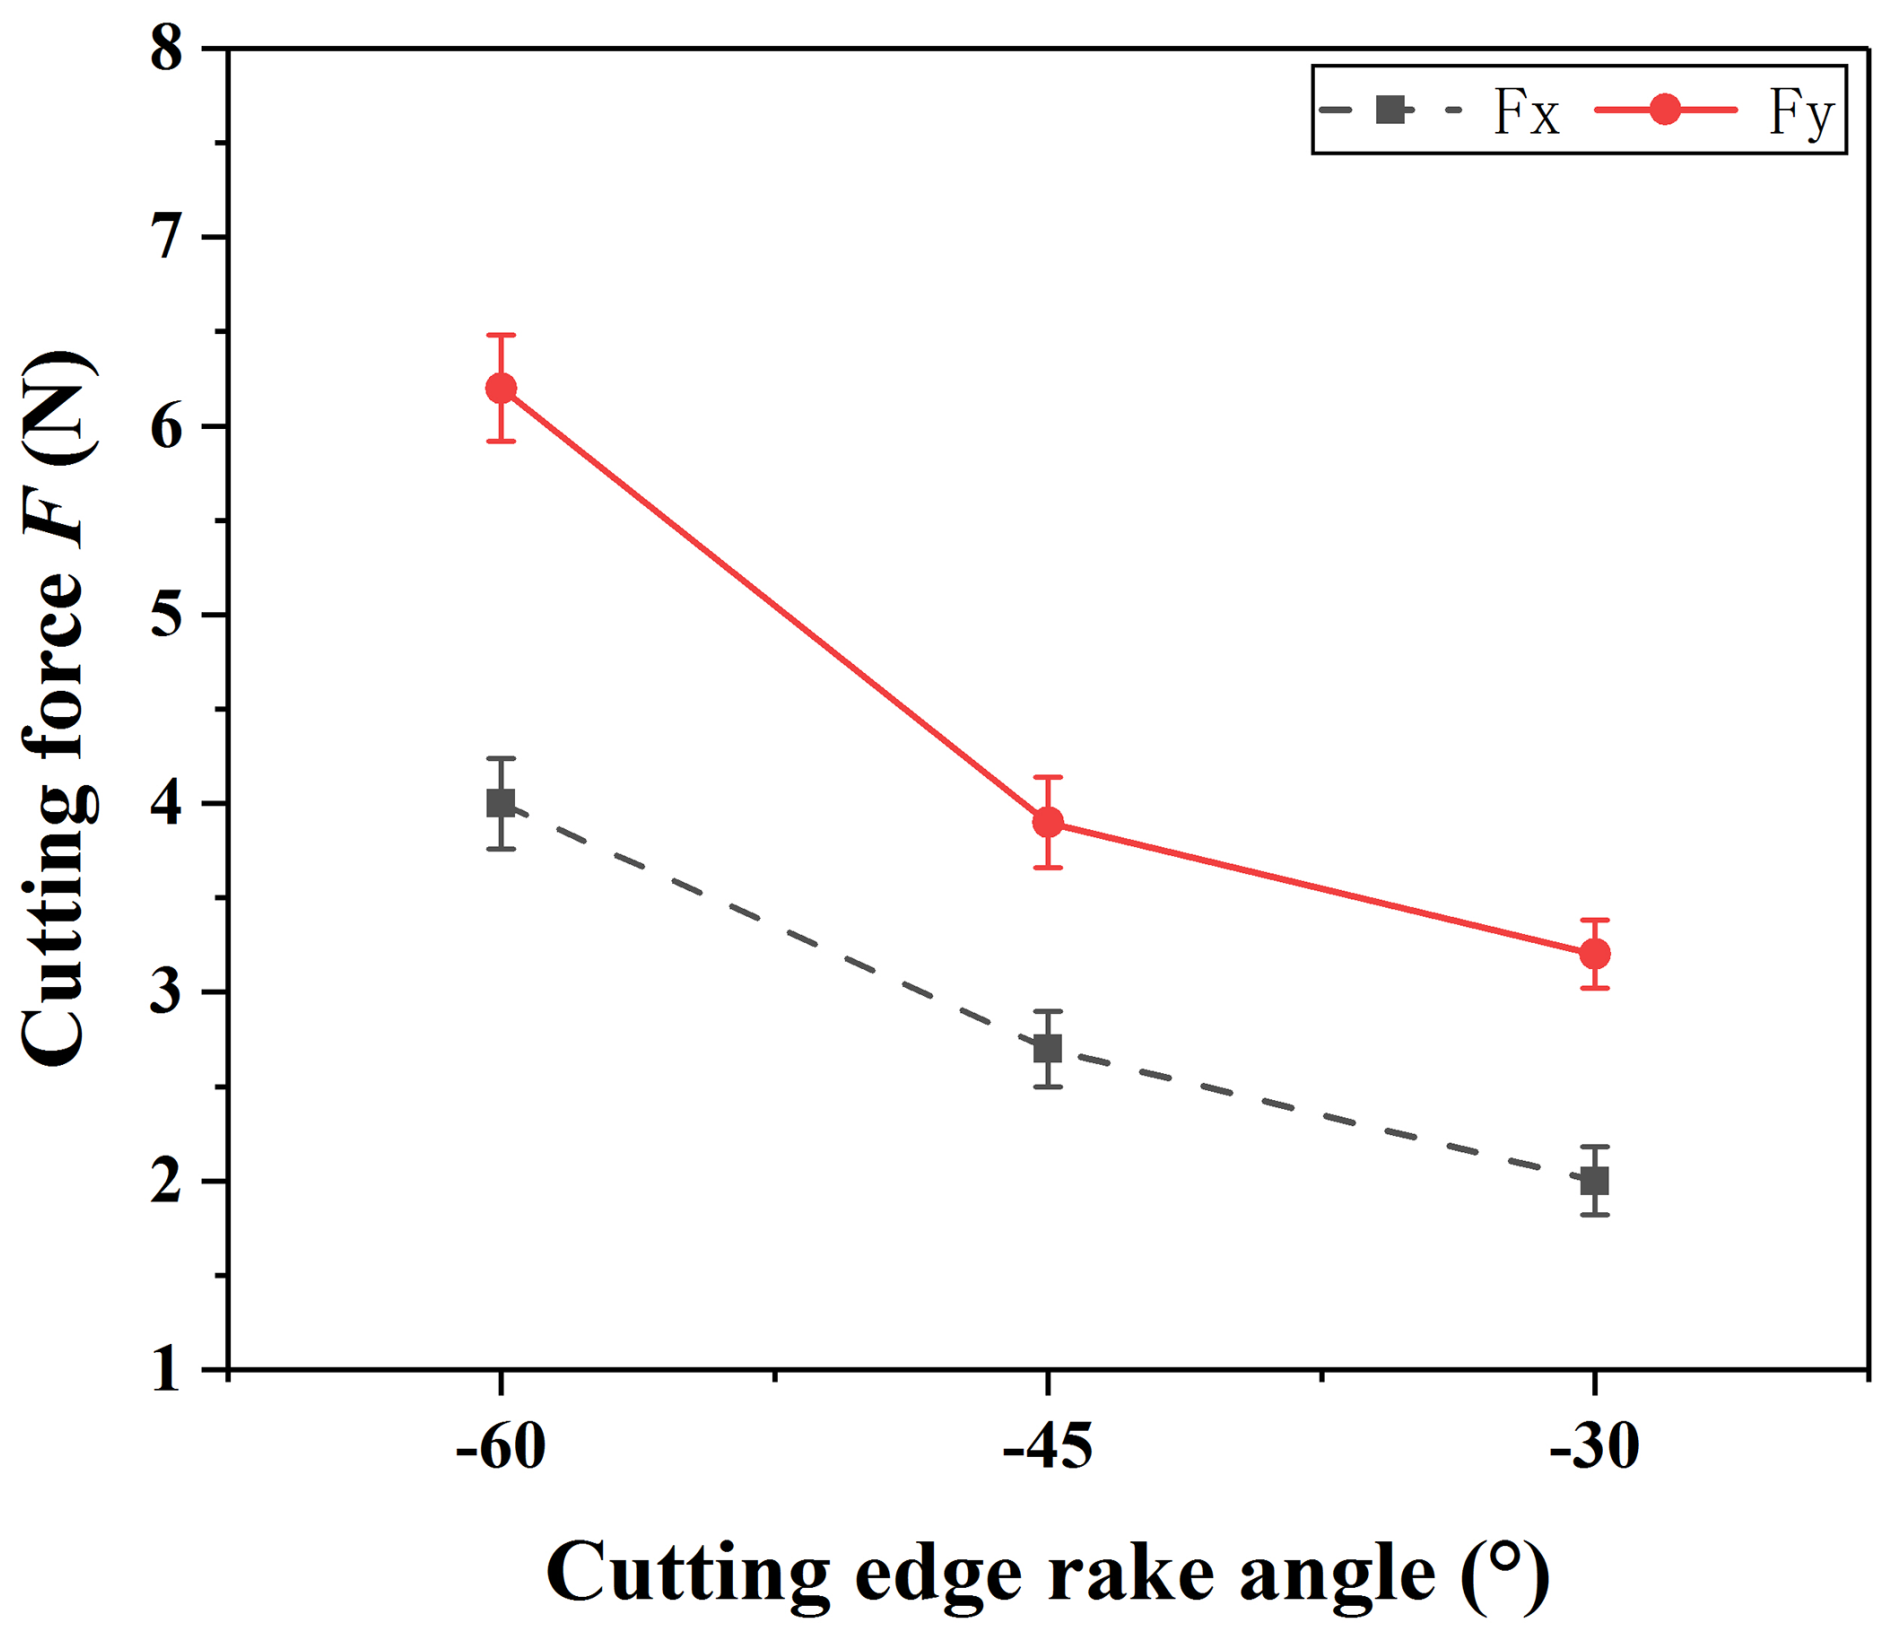
The cutting force measurement results are shown in Fig. 12. The cutting forces in the x and y directions show a decreasing trend with the increase in the cutting edge rake angle using the same cutting parameters and processes. For the straight edge PCD tool, increasing the rake angle can make the tool sharper so that the workpiece material is easier to remove and the cutting force is smaller. Therefore, choosing a tool with a larger rake angle is beneficial for reducing the cutting force generated in the cutting process. Consequently, the thin wall deformation caused by the cutting force will be reduced.
3.3 Cutting temperature
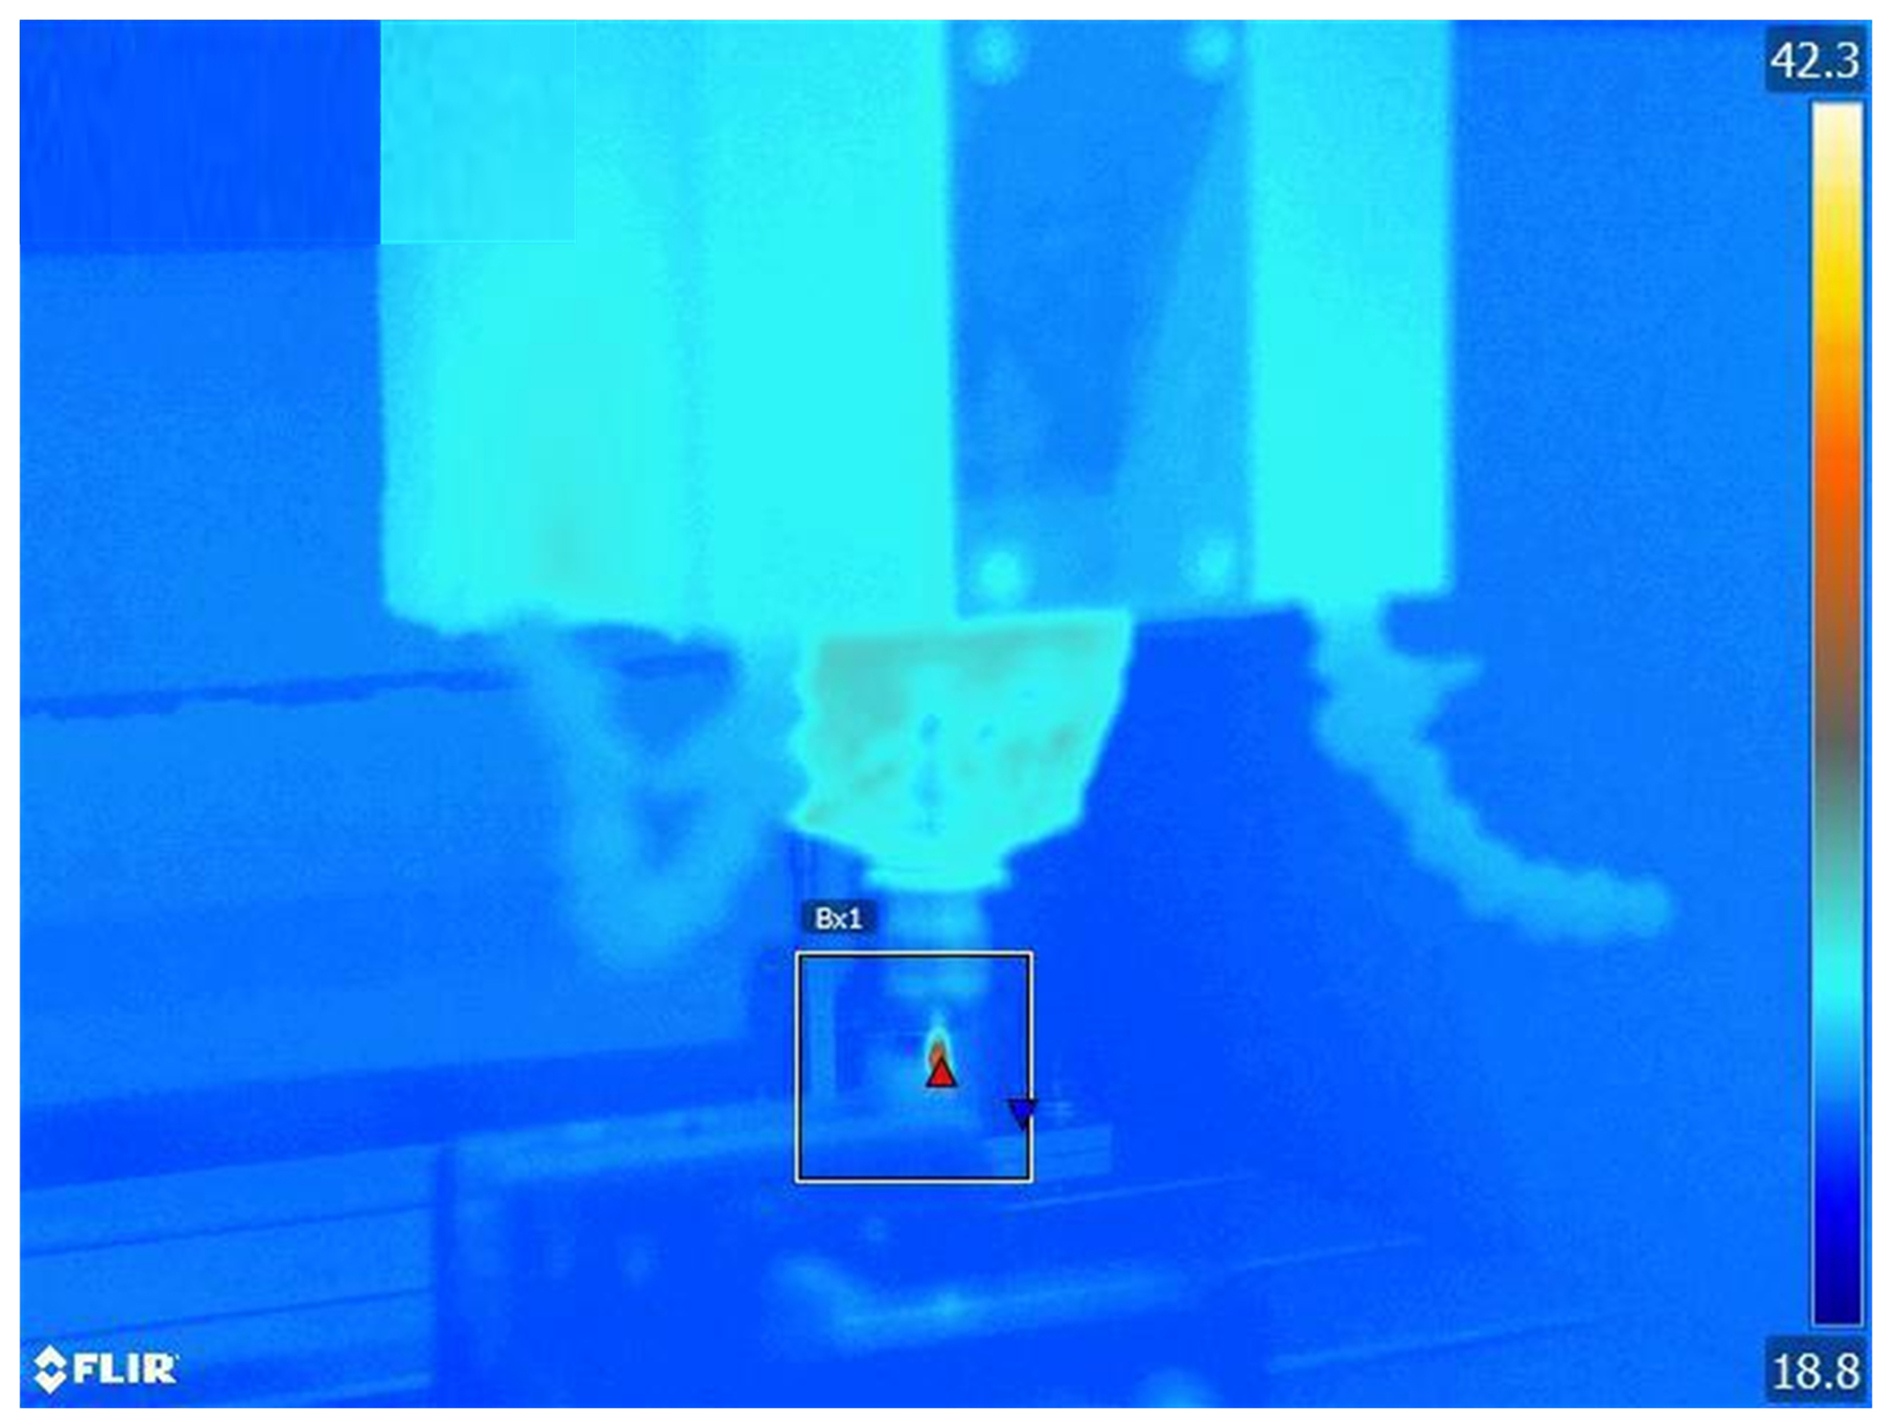
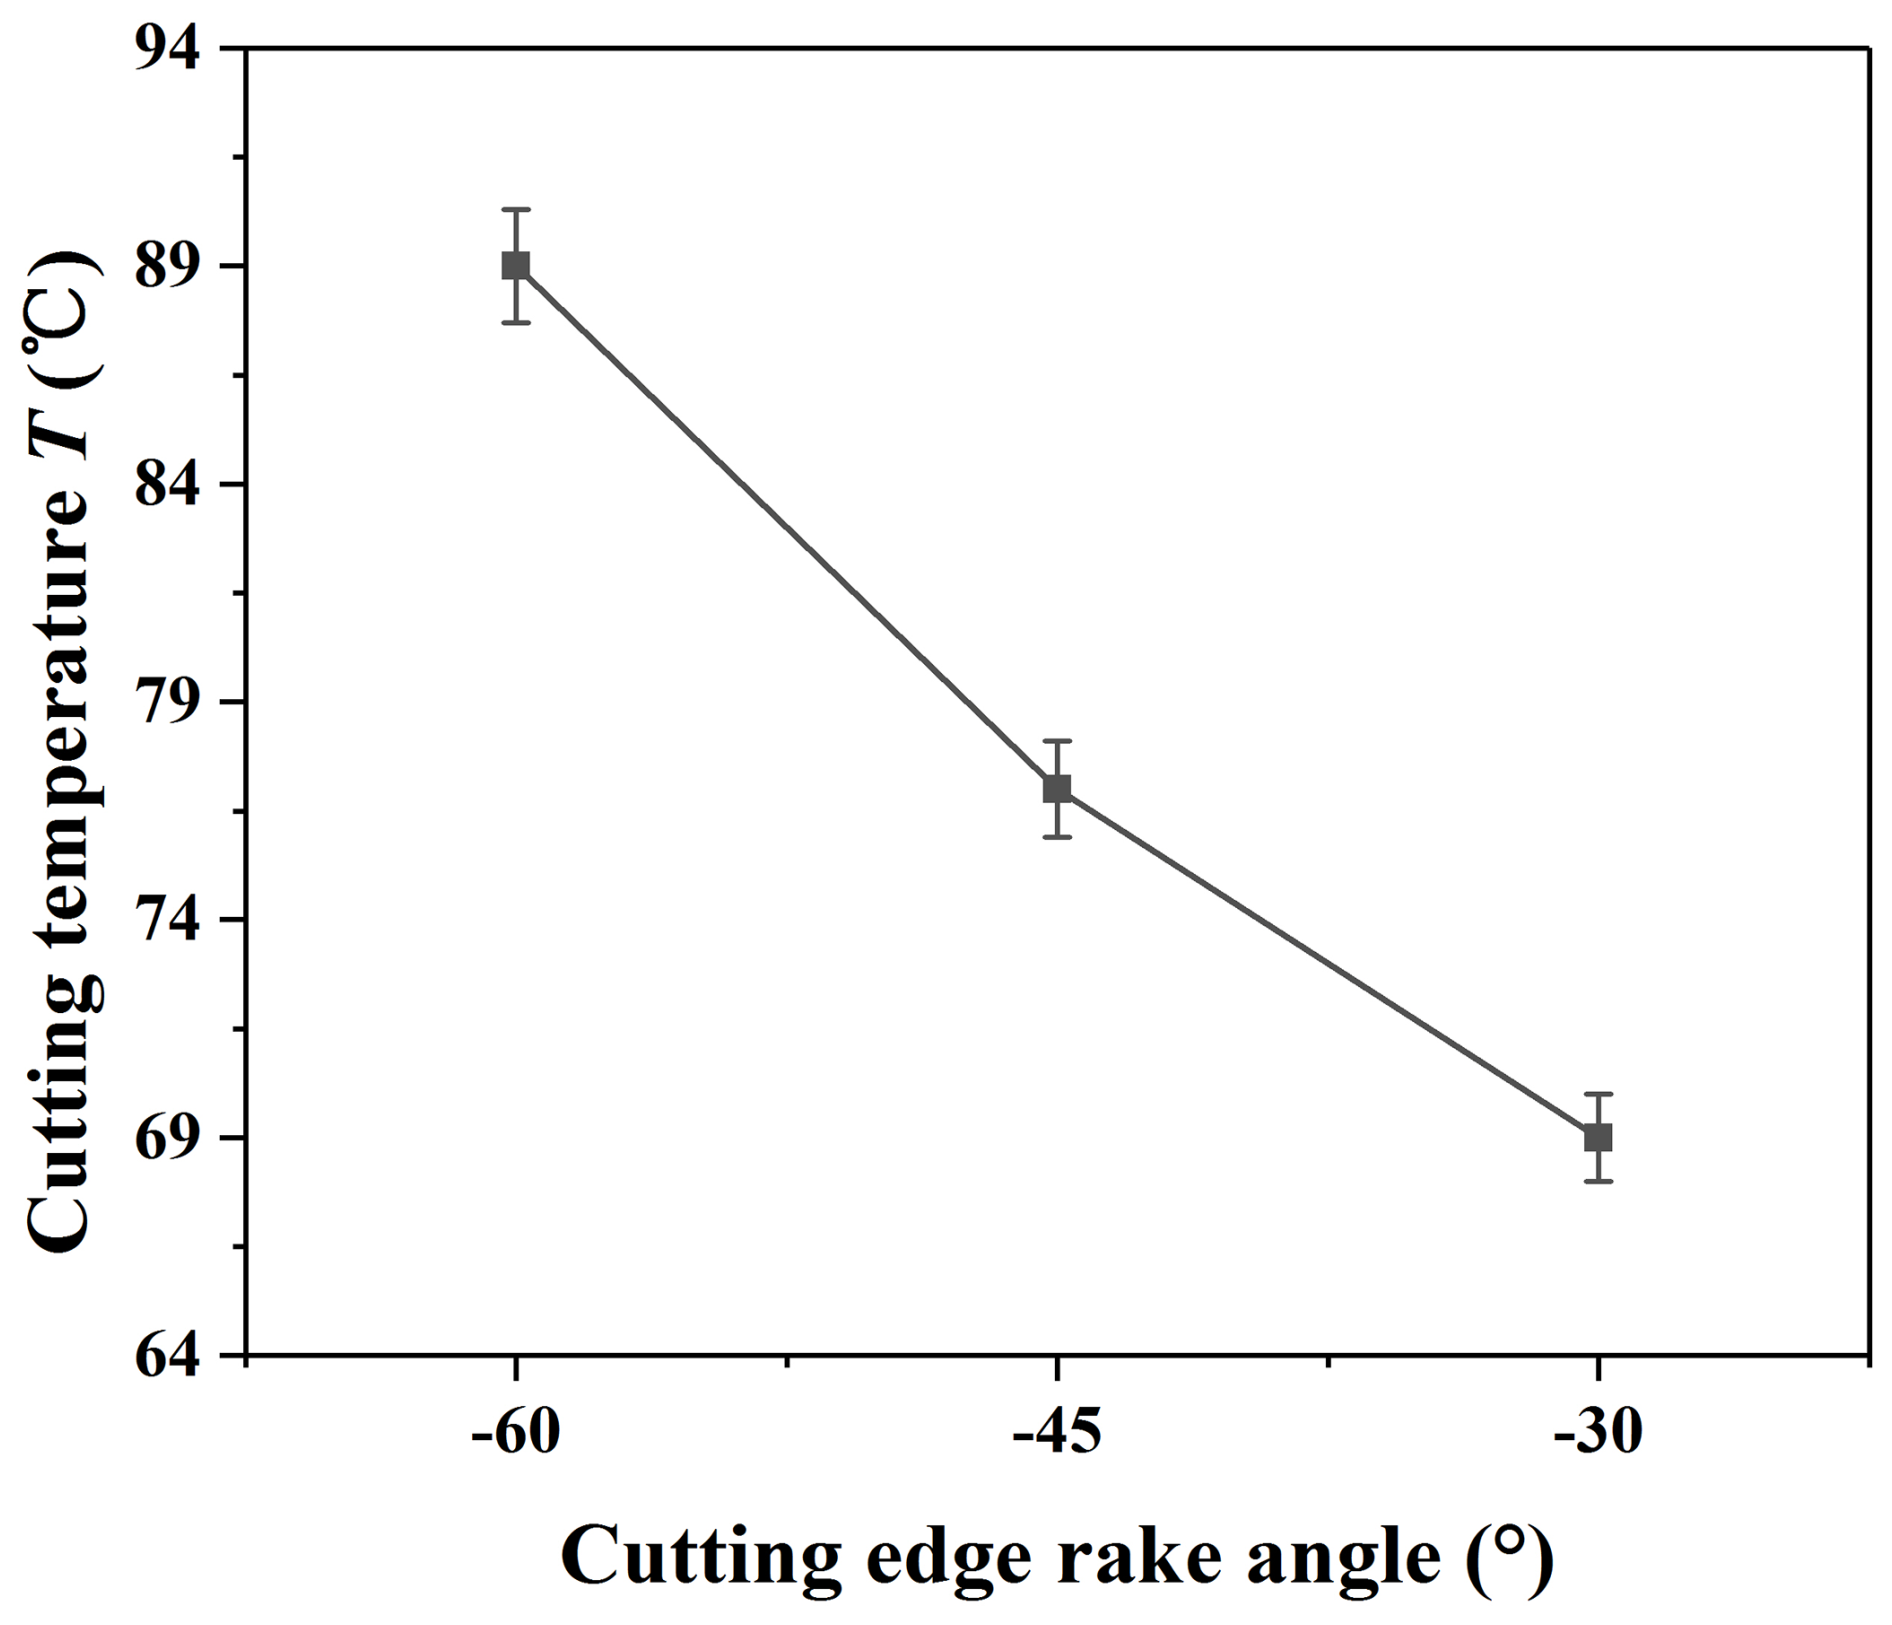
A thermal image obtained during cutting temperature measurement is shown in Fig. 13. The cutting temperature measurement results are shown in Fig. 14.
Figure 13 shows that the highest cutting temperature is located in the contact area between the tool and the workpiece. The cutting temperature decreases with the increase in the cutting edge rake angle, which is consistent with the trend of the cutting forces. Due to the small cutting scale in the microcutting process, the amount of cutting heat generated is small. The cutting point is also very small, so that the actual cutting temperature in the cutting region is difficult to measure precisely. The results in Fig. 14 are obtained as average temperatures within the field of view of the thermal imager, and thus these are considerably lower than the actual cutting temperature. However, the general trend of cutting temperature versus tool rake angle is believed to be reliable.
3.4 Tool wear
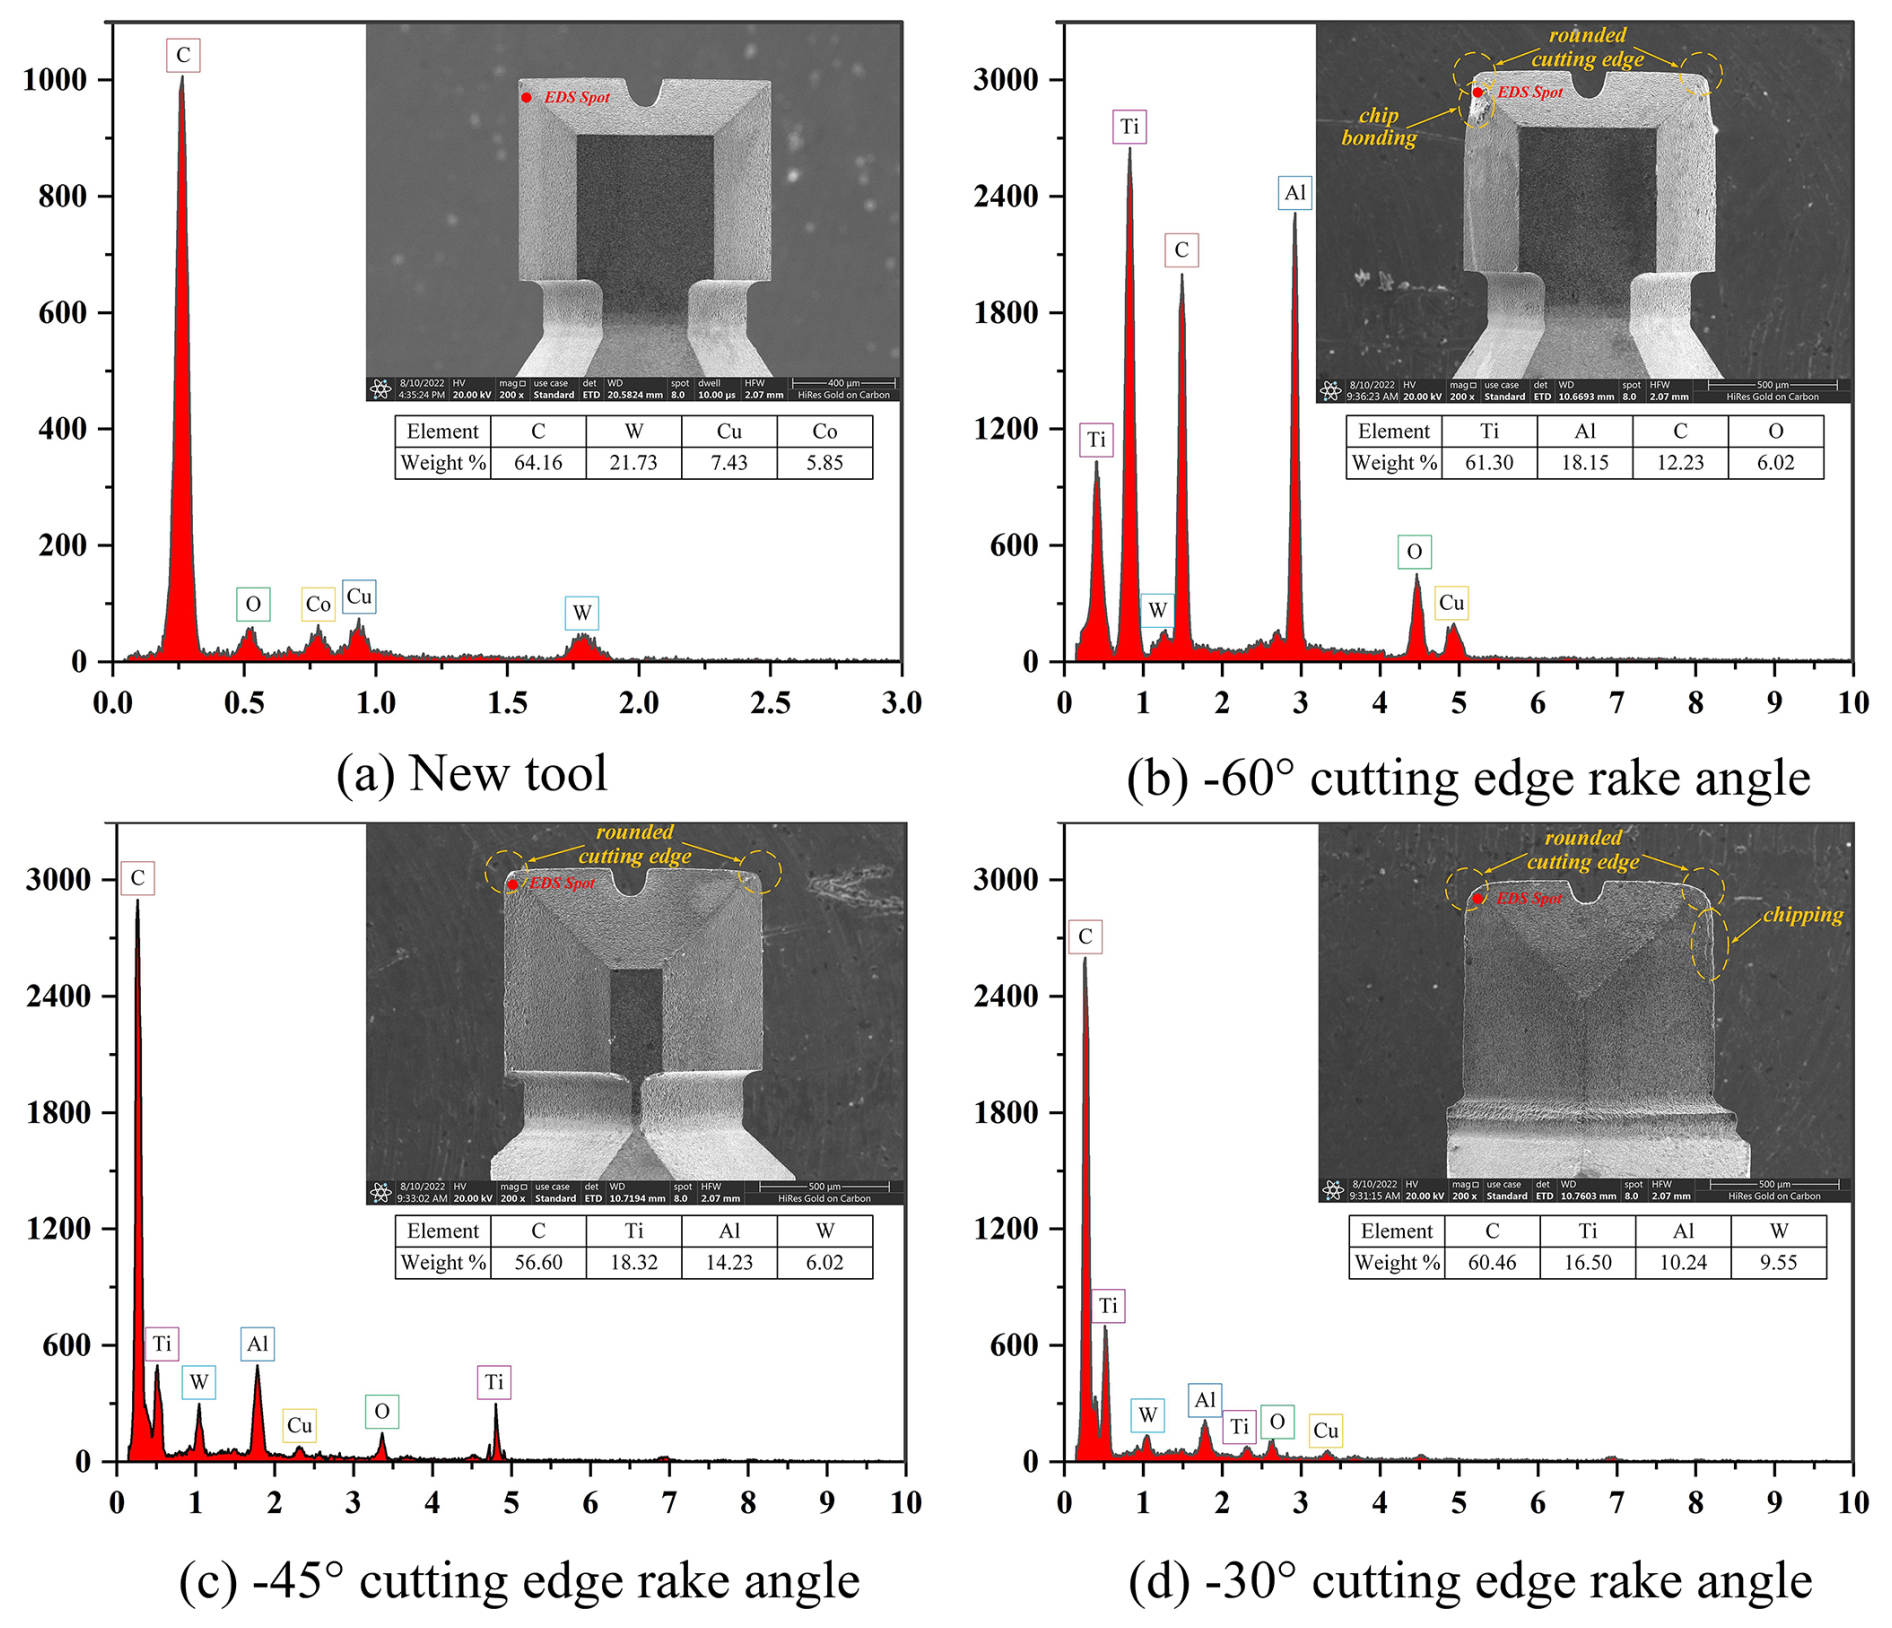
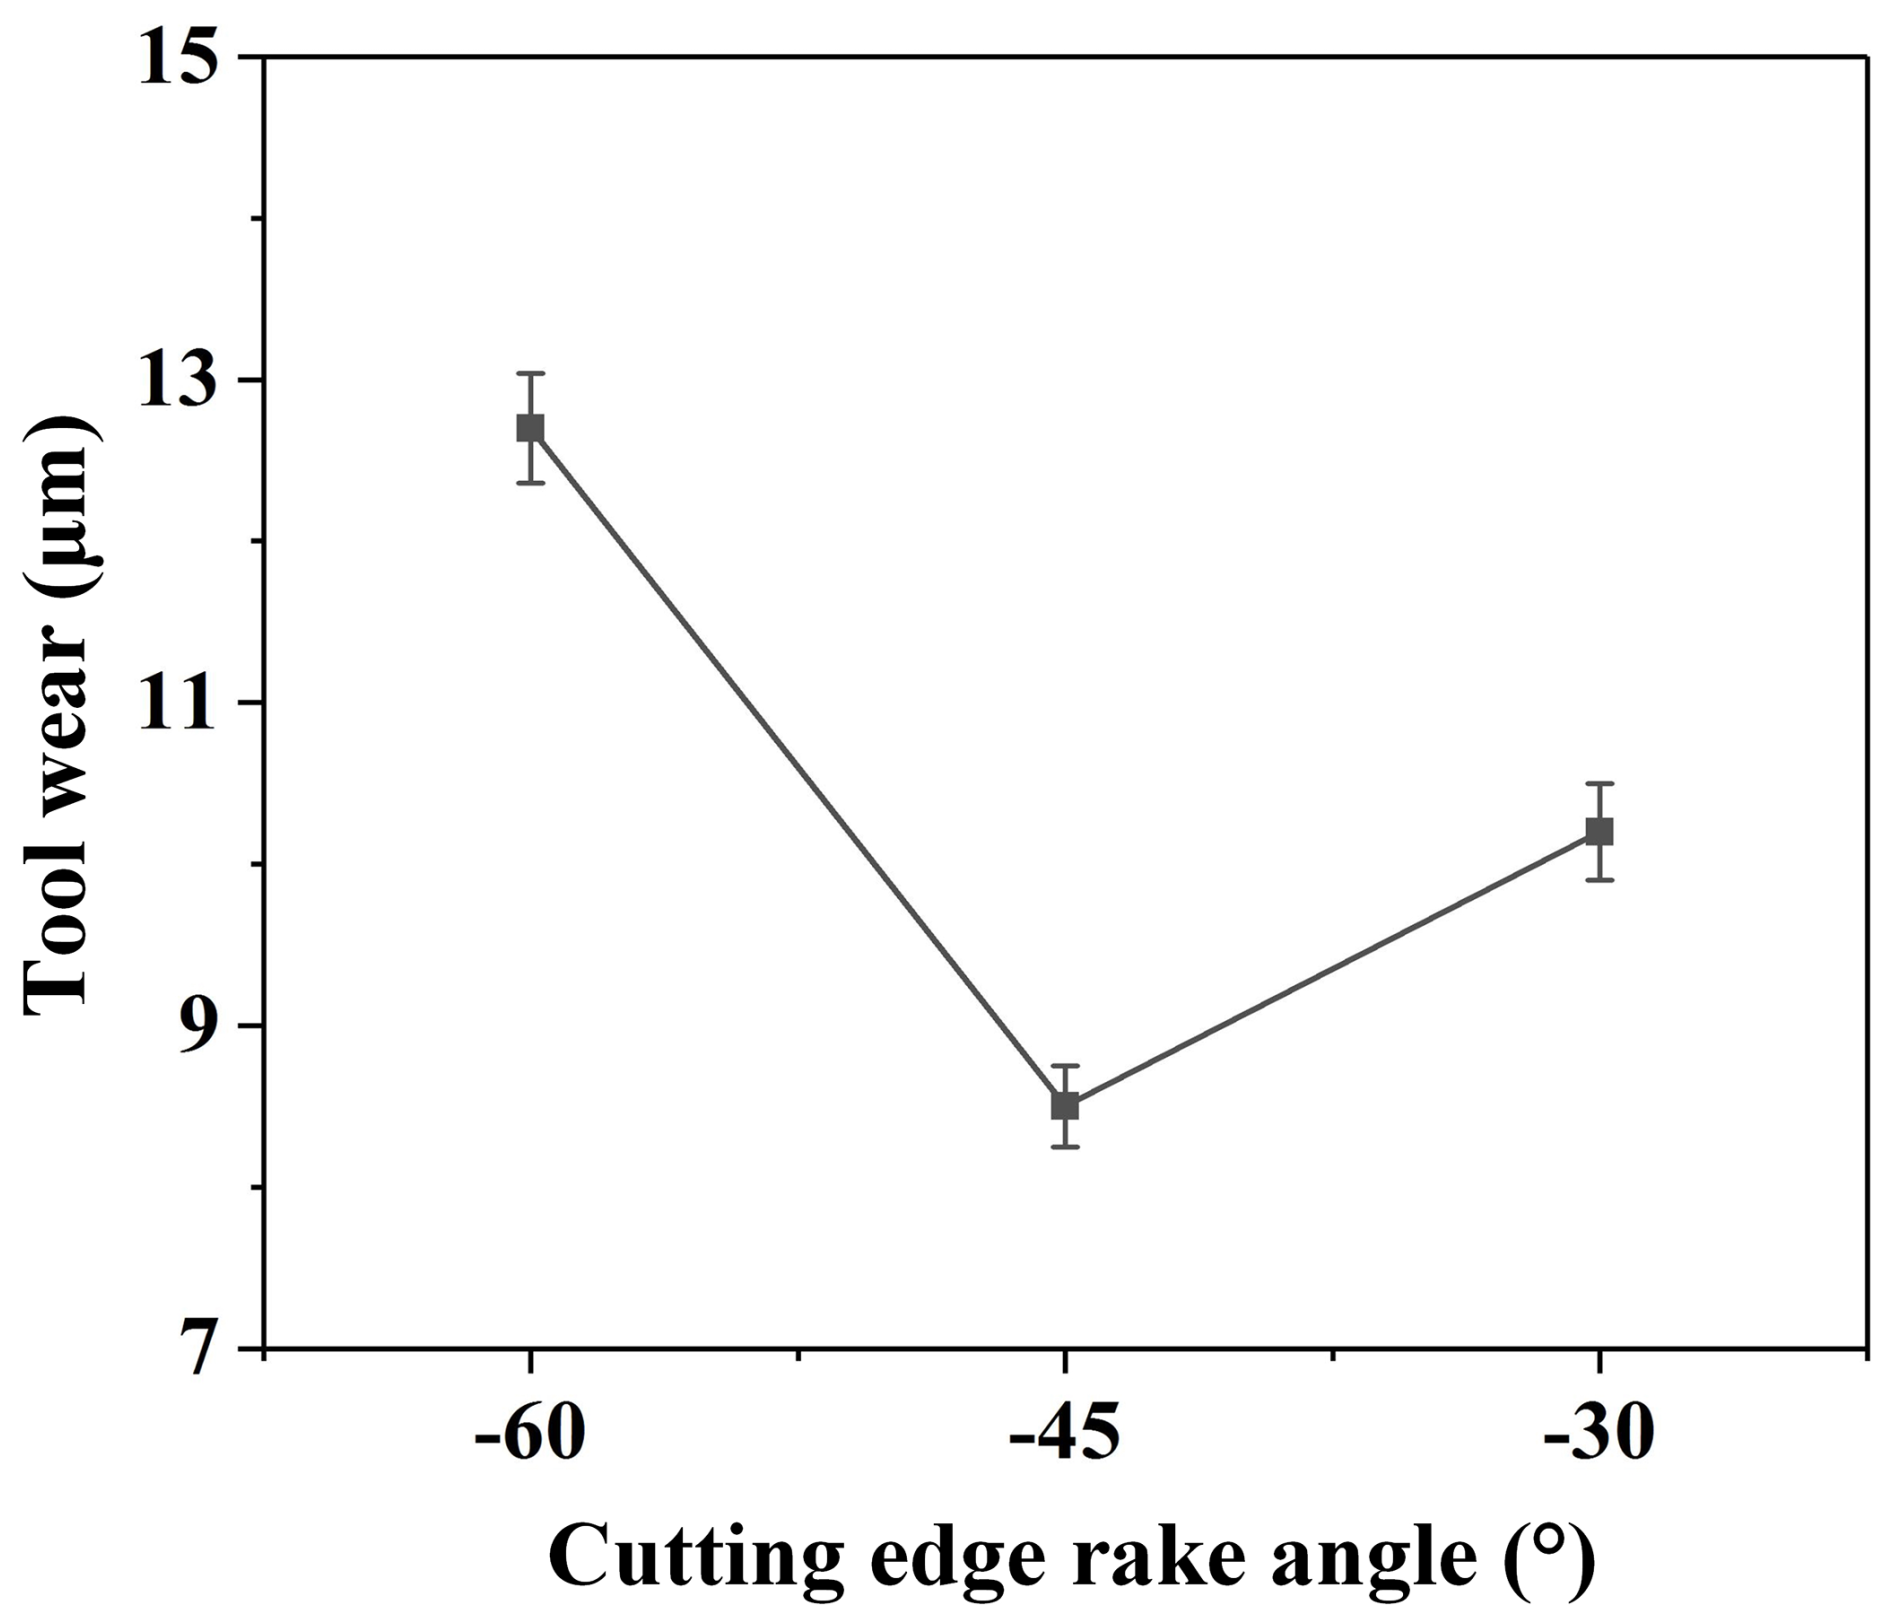
Figure 15a shows the EDS measurement results of the new PCD end mill with a rake angle of −60°. The contents of the C and W elements are the highest; these are the main components of the PCD material. Figure 15b shows the worn PCD end mill with a rake angle of −60°. The main wear forms are a rounded cutting edge and chip bonding. The main contents are the Ti and Al elements, which are highest and have more content than the C element. The reason for this phenomenon may be that many titanium alloy chips stick to the tool surface. The smaller the rake angle of the tool is, the less easy the chips are to discharge, thus adhering to the rake face of the tool and resulting in the chip bonding. Figure 15c shows the worn PCD end mill with a rake angle of −45°. The main wear form is a rounded cutting edge. The EDS analysis is similar to that of the −30° rake angle tool. Figure 15d shows the worn PCD end mill with a rake angle of −30°. The main wear forms are a rounded cutting edge and chipping. In addition to the highest contents, the C, Ti, and Al elements appear on the tool and are the main components of the titanium alloy material. In the process of cutting, when the tool removes the material, it will produce shearing and friction with the workpiece, so the chip will produce some residue on the tool surface. However, the chips are effectively discharged as the tool rake angle increases. Figure 16 shows the quantitative measurements of the tool wear after cutting a length of 120 m.
All of the three above tools have similar tool wear forms of rounded cutting edges. The mainly reason is that the tool tip is the main cutting area. Its frequent participation in the interrupted cutting process leads to impact loads and faster tool wear, which is a normal wear phenomenon. The degree of rounded cutting edge of the three tools is inconsistent, the degree of rounded cutting edge of the −60° rake angle tool is bigger, and the degree of rounded cutting edge of the −45° rake angle tool is smaller, indicating that the geometric structure of the tool has an important influence on tool wear.
3.5 Dimensional errors of walls
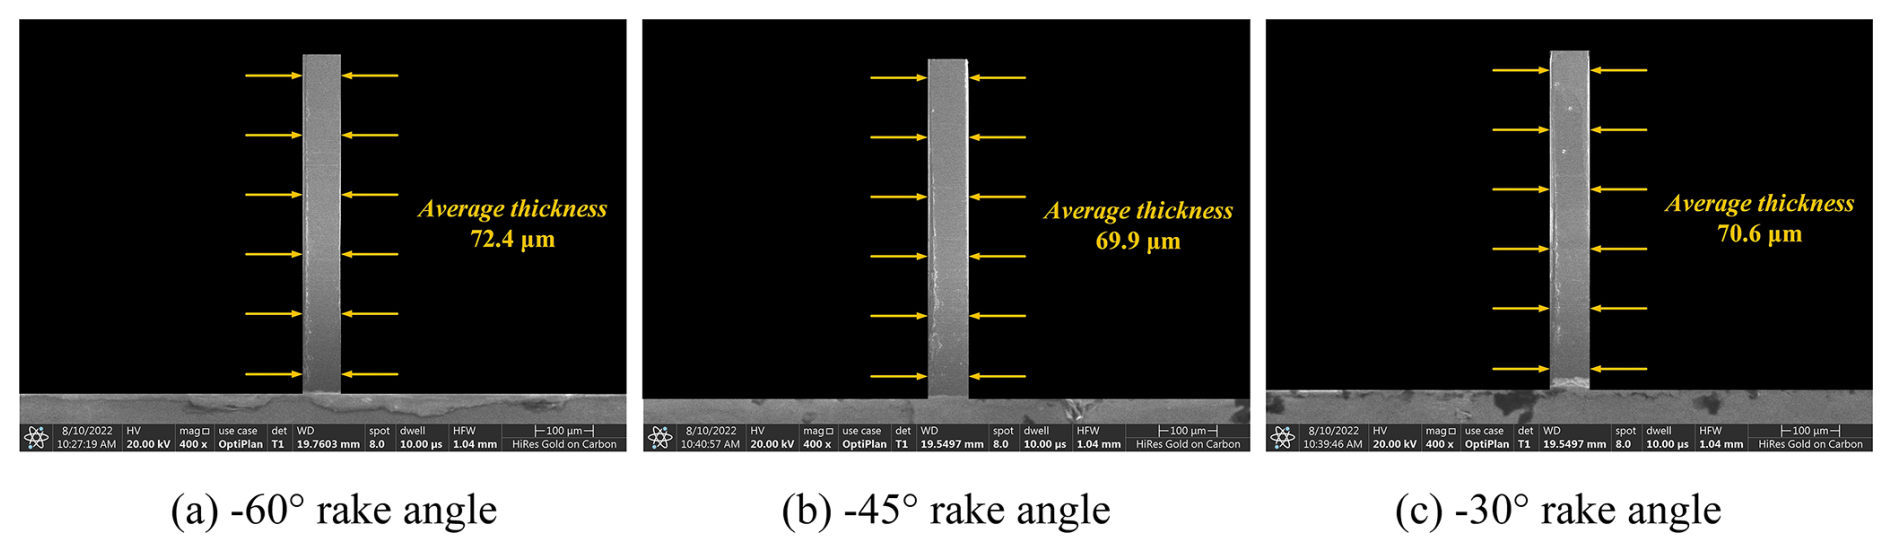
As the machined walls are too thin to be measured using conventional mechanical instruments, the thickness of the machined thin wall is estimated from the SEM images. The thickness of the thin wall is measured by selecting six positions at equal distances along the height direction of the thin wall. Then the average value is calculated as the thickness of the thin wall.
Figure 17 shows the measurement results of thin walls fabricated by three kinds of PCD end mills. The overall thickness of the thin wall is uniform without obvious bending deformations. However, a dimensional error exists between the actual measured thickness and the designed value, likely due to elastic deformation of the workpiece and tool during micromilling.
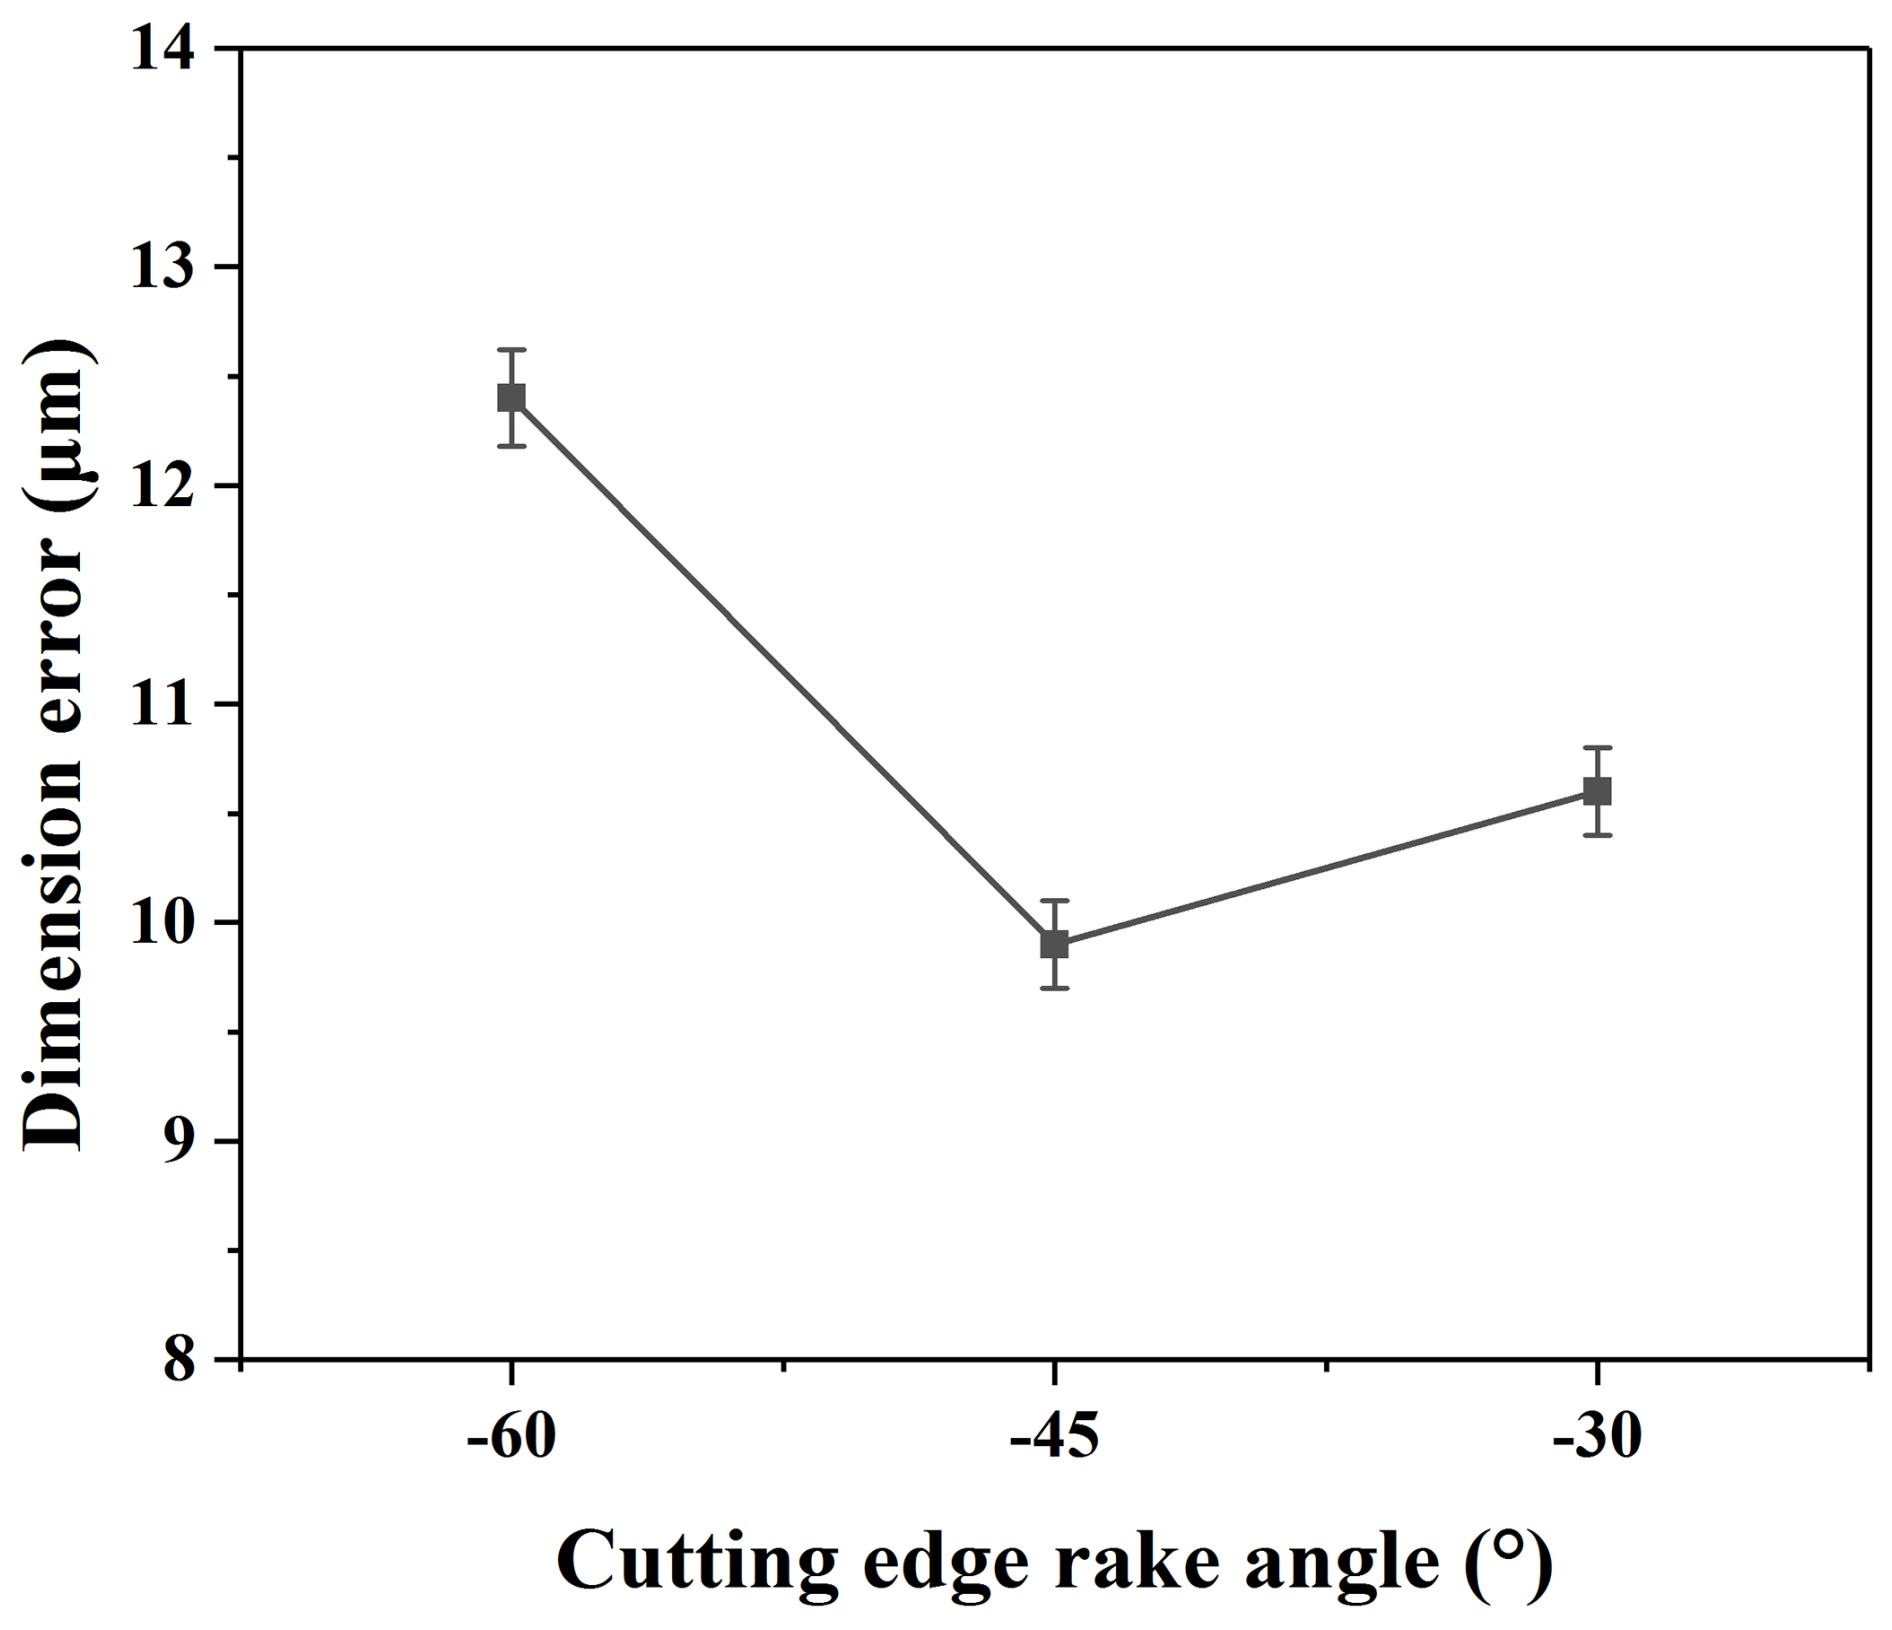
Figure 18 shows the change in the dimensional error of the thin wall with different tool rake angles. The dimensional error of the thin wall machined by the PCD tool with a −45° rake angle is the smallest one. However, the thin wall corresponding to the minimum cutting force is not the one with the smallest dimensional error, which is inconsistent with the previous research conclusion for other ductile material (Li et al., 2022). One possible reason for this difference is that PCD tools have different degrees of tool wear, which leads to the reduction in their effective tool diameter, thus reducing the actual radial cutting depth and increasing the residual amount of thin wall thickness.
Based on the above experimental results and analysis, the cutting force and cutting temperature produced by the tool with a −30° rake angle are smallest. However, the wear of the tool with a −30° rake angle is higher than that of the tool with a −45° rake angle. Therefore, the surface roughness value produced by the tool with a −30° rake angle is larger, and the dimension error of the thin wall is also larger than that of a −45° rake angle. Since the cutting edge of the tool with a −60° rake angle wears seriously, the cutting force and cutting temperature generated in the cutting process are larger than tools with other rake angles. This accelerates the wear of the tool and furthermore leads to the deterioration of the surface quality and the large error of the thin wall size. Therefore, the PCD micro end mill with a −45° rake angle is more suitable for cutting high-quality thin walls made of the Ti-6Al-4V titanium alloy.
3.6 Error compensation results
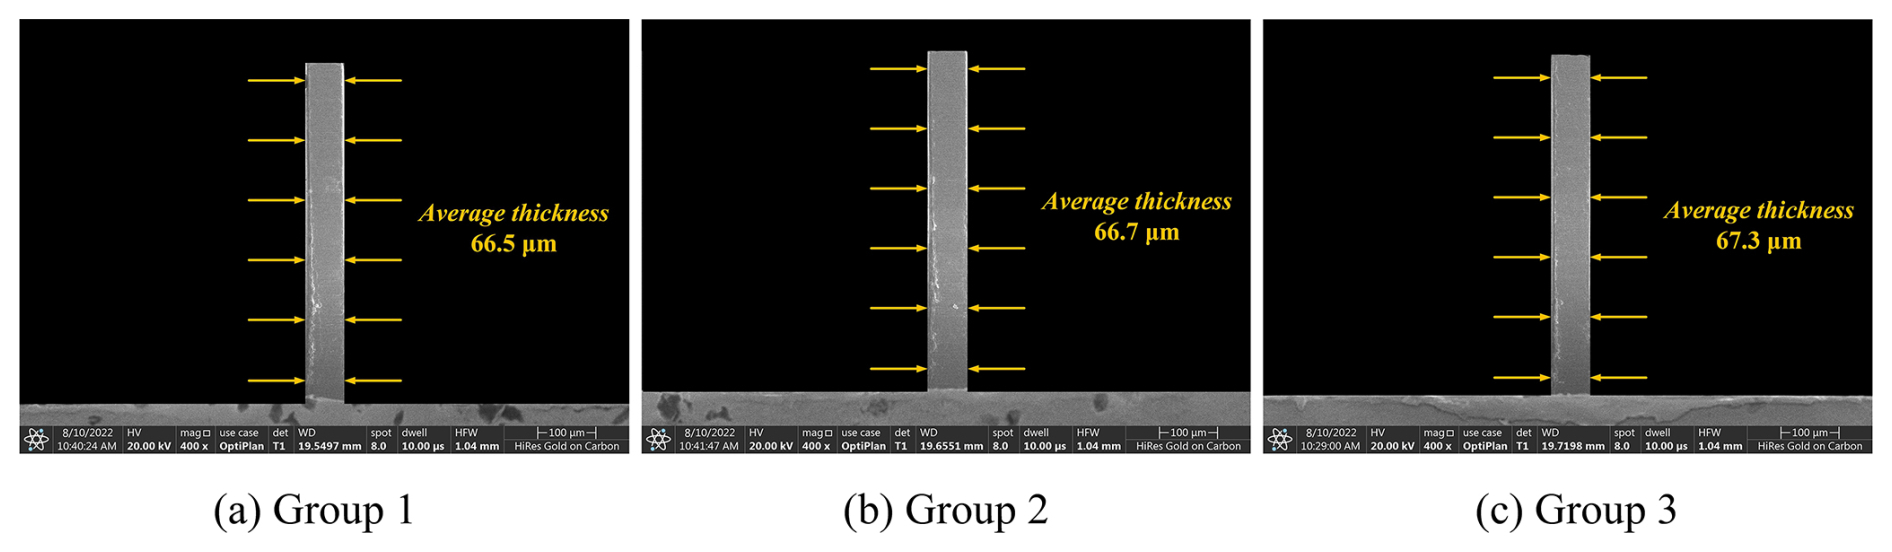
Thin wall compensation experiments were carried out by the previously introduced method and model for a brass material thin wall base using cantilever beam theory (Li et al., 2021b). The experiment results are shown in Fig. 19. Although the fabricated thin wall retains good shape accuracy, the dimensional error is still large, which indicates that this deformation model is not suitable for titanium alloy material.
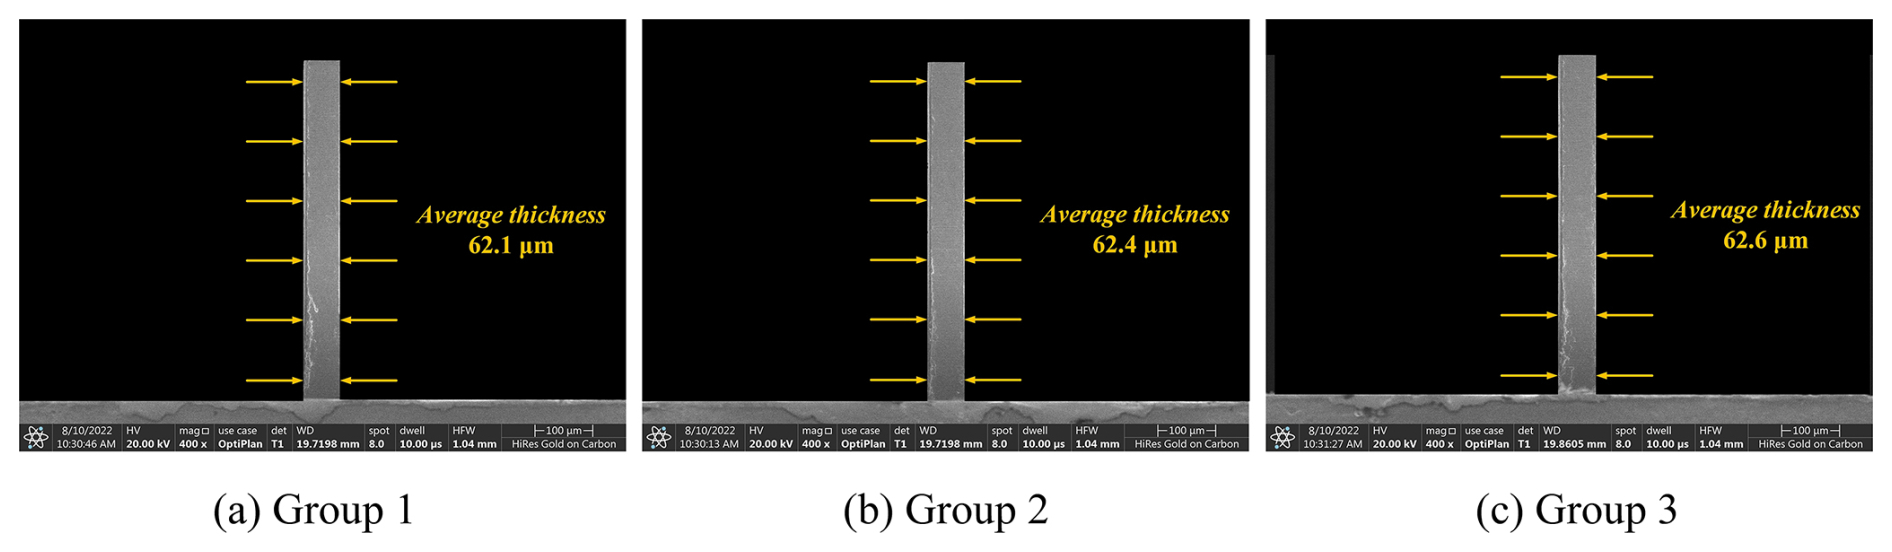
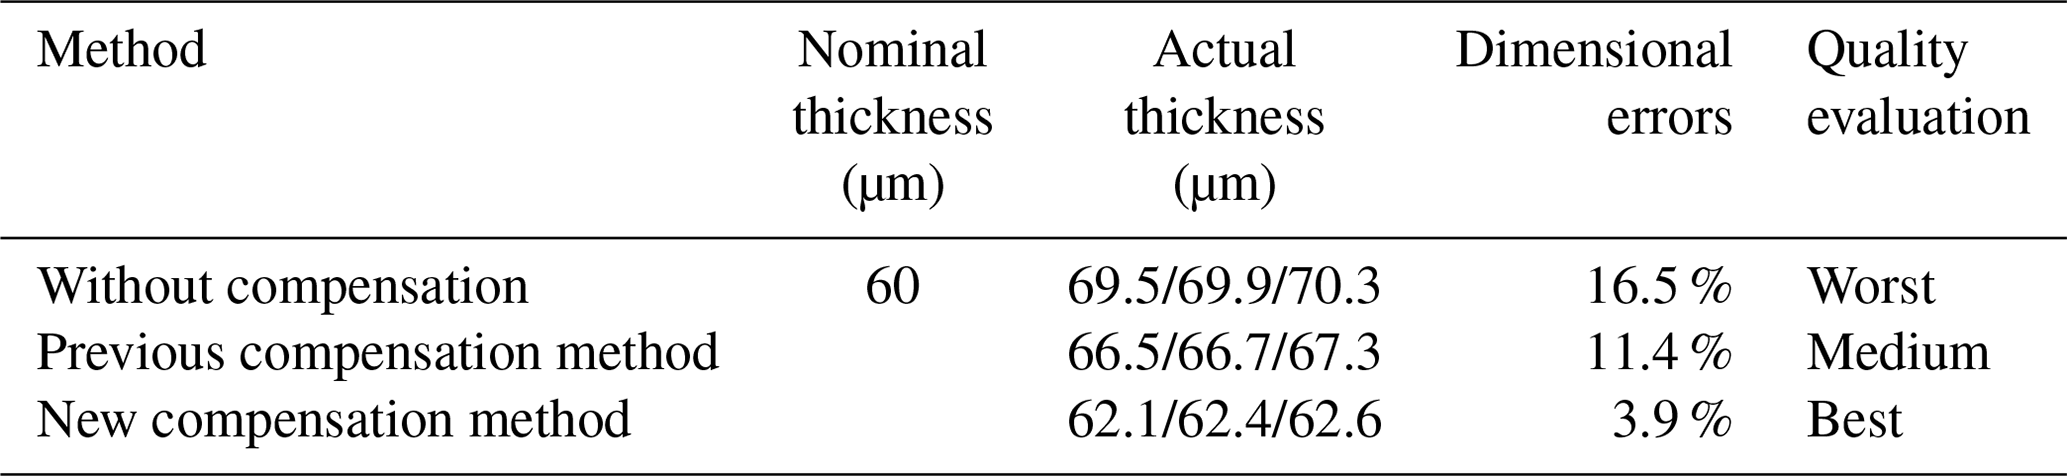
Figure 20 shows the thin wall thickness measurement result after applying the introduced new model. The dimensional errors of the thin wall have been reduced further. The relative errors have been reduced from 16.5 % to 3.9 %, as shown in Table 3. The machining quality has a relatively obvious improvement in dimensional accuracy after the compensation. It demonstrates that the deformation modeling and parameter compensation method are effective and can be used to compensate for the dimensional error of titanium alloy thin walls fabricated by the micromilling process.
In this study, micromilling of the difficult-to-machine material Ti-6Al-4V alloy for HAR thin walls was studied. Micromilling experiments were carried out by using customized PCD straight edge micro end mills with different cutting edge rake angles. This shows that the micro end mill with a −45° rake angle has better cutting performances with smaller thin wall dimensional errors, lower tool wear, and a lower surface roughness value. The previously introduced thin wall deformation estimation model for brass material has limitations for titanium alloy material. Therefore, a special deformation prediction model for titanium alloy in thin wall machining was established and calibrated by micromilling experiments. The model has been successfully evaluated by micromilling experiments. It shows that the dimensional errors of the thin wall made of Ti-6Al-4V are significantly reduced after the online radial cutting depth compensations. The relative errors have been reduced from 16.5 % to 3.9 %.
The study results show that the online compensation method is effective. The online cutting force measurement and cutting parameter compensation device can first measure the cutting force in the thin wall cutting process, then calculate the thin wall deformation value according to the cutting force and thin wall deformation model, and then finally compensate for the cutting parameter according to the thin wall deformation value. The novel contributions of this study are that the online cutting force measurement and cutting parameter compensation device is applied and the thin wall deformation model is established, which can significantly reduce the dimensional errors of the Ti-6Al-4V thin wall. The control system of the online compensation device used in this study is independent of the control system of the machine tool. It can indirectly adjust the processing parameters through the movement of the compensation device without adjusting the processing parameters of the machine tool and achieve online compensation of thin wall dimensional errors. The compensation method can achieve online compensation and has high efficiency. Meanwhile, it also provides a method for guiding the thin wall machining of other difficult-to-machine materials.
All data are given in the paper. No further datasets were used.
XC and YL proposed the research methods, and YL conducted the experiments and analyzed the experimental results. YL wrote the manuscript.
The contact author has declared that neither of the authors has any competing interests.
Publisher’s note: Copernicus Publications remains neutral with regard to jurisdictional claims made in the text, published maps, institutional affiliations, or any other geographical representation in this paper. While Copernicus Publications makes every effort to include appropriate place names, the final responsibility lies with the authors.
The work was supported by the Natural Science Foundation of Shandong Province (grant no. ZR2020ME157) and Shandong Provincial Key Laboratory of Precision Manufacturing and Non-traditional Machining.
This paper was edited by Jeong Hoon Ko and reviewed by Mohammad Naeim Moradi and two anonymous referees.
Amin, A. N., Ismail, A. F., and Khairusshima, M. N.: Effectiveness of uncoated WC-Co and PCD inserts in end milling of titanium alloy-Ti-6Al-4V, J. Mater. Process. Tech., 192–193, 147–158, 2007.
Araujo, A. C., Fromentin, G., and Blandenet, P.: Investigation on PCD cutting edge geometry for Ti-6Al-4V high-feed milling, Int. J. Adv. Manuf. Tech., 111, 1785–1796, 2020.
Chen, N., Yuan, Y., and Guo, C.: Design, optimization and manufacturing of polycrystalline diamond micro-end-mill for micro-milling of GH4169, Diam. Relat. Mater., 108, 107915, https://doi.org/10.1016/j.diamond.2020.107915, 2020.
Cheng, X., Nakamoto, K., and Sugai, M.: Development of ultra-precision machining system with unique wire EDM tool fabrication system for micro/nano-machining, CIRP Ann.-Manuf. Techn., 57, 415–420, 2008.
Cheng, X., Wang, Z. G., and Nakamoto, K.: A study on the micro tooling for micro/nano milling, Int. J. Adv. Manuf. Tech., 53, 523–533, 2011.
Cheng, X., Wei, X. T., and Yang, X. H.: Unified criterion for brittle-ductile transition in mechanical microcutting of brittle materials, J. Manuf. Sci. E.-T. Asme., 136, 051013–051011, 2014.
Cheng, X., Liu, J. C., and Zheng, G. M.: Study of microcutting fundamentals for peripheral and end cutting edges in micro-end-milling, J. Micromech. Microeng., 28, 015011, https://doi.org/10.1088/1361-6439/aa9a73, 2018.
Gang, L.: Study on deformation of titanium thin-walled part in milling process, J. Mater. Process. Tech., 209, 2788–2793, 2009.
Kaltenbrunner, T., Krückl, H. P., and Schnalzger, G.: Differences in evolution of temperature, plastic deformation and wear in milling tools when up-milling and down-milling Ti-6Al-4V, J. Manuf. Process., 77, 75–86, 2022.
Li, Y., Cheng, X., and Ling, S. Y.: Study on micro cutting fundamentals considering the cutting edge radius and the workpiece material in micro end milling, P. I. Mech. Eng. E-J. Pro., 235, 93–102, 2021a.
Li, Y., Cheng, X., and Ling, S. Y.: Study on deformation and compensation for micromilled thin walls with high aspect ratios, Int. J. Adv. Manuf. Tech., 117, 1797–1806, 2021b.
Li, Y., Cheng, X., and Ling, S. Y.: On-line compensation for micromilling of high-aspect-ratio straight thin walls, Micromachines, 12, 603, https://doi.org/10.3390/mi12060603, 2021c.
Li, Y., Cheng, X., and Zheng, G. M.: Dynamic modeling and in-process parametric compensation for fabricating micro straight thin walls by micromilling, J. Mater. Res. Technol., 18, 2480–2493, 2022.
Liu, S. Y. and Shin, Y. C.: Additive manufacturing of Ti-6Al-4V alloy: A review, Mater. Design., 164, 107552, https://doi.org/10.1016/j.matdes.2018.107552, 2019.
Machai, C., Iqbal, A., and Biermann, D.: On the effects of cutting speed and cooling methodologies in grooving operation of various tempers of β-titanium alloy, J. Mater. Process. Tech., 213, 1027–1037, 2013.
Maeng, S. J., Lee, P. A., and Kim, B. H.: An Analytical Model for Grinding Force Prediction in Ultra-Precision Machining of WC with PCD Micro Grinding Tool, Int. J. Pr. Eng. Man.-Gt., 7, 1031–1045, 2020.
Ng, C. K., Melkote, S. N., and Rahman, M.: Experimental study of micro- and nano-scale cutting of aluminum 7075-T6, Int. J. Mach. Tool. Manu., 46, 929–936, 2006.
Parmar, V., Kumar, A., and Prakash, G. V.: Investigation, modelling and validation of material separation mechanism during fiber laser machining of medical grade titanium alloy Ti-6Al-4V and stainless steel SS316l, Mech. Mater., 137, 103125, https://doi.org/10.1016/j.mechmat.2019.103125, 2019.
Wu, G., Li, G. X., and Pan, W. C.: Experimental investigation of eco-friendly cryogenic minimum quantity lubrication (CMQL) strategy in machining of Ti-6Al-4V thin-wall part, J. Clean. Prod., 357, 131993, https://doi.org/10.1016/j.jclepro.2022.131993, 2022.
Yan, J., Zhang, Z., and Kuriyagawa, T.: Fabricating micro-structured surface by using single-crystalline diamond endmill, Int. J. Adv. Manuf. Tech., 51, 957–964, 2010.
Yi, J., Wang, X. B., and Jiao, L.: Research on deformation law and mechanism for milling micro thin wall with mixed boundaries of titanium alloy in mesoscale, Thin. Wall. Struct., 144, 106329, https://doi.org/10.1016/j.tws.2019.106329, 2019.
Zhang, H., Dang, J. Q., and Ming, W. W.: Cutting responses of additive manufactured Ti-6Al-4V with solid ceramic tool under dry high-speed milling processes, Ceram. Int., 46, 14536–14547, 2020.
Zhuang, K. J., Gao, J. Q, and Ye, T.: Effect of cutting edge radius on cutting force and surface roughness in machining of Ti-6Al-4V, Proc. CIRP, 108, 571–576, 2022.
Zong, W. J., Li, Z. Q., and Sun, T.: The basic issues in design and fabrication of diamond-cutting tools for ultra-precision and nanometric machining, Int. J. Mach. Tool. Manu., 50, 411–419, 2010.