the Creative Commons Attribution 4.0 License.
the Creative Commons Attribution 4.0 License.
 | 25 Mar 2025
Research on online monitoring of chatter based on continuous wavelet transform and convolutional neural network–vision transformer (CNN-ViT)
Changfu Liu
Daohai Wang
Yuru Lin
In order to solve the problem of chatter identification in the machining process of thin-walled parts, this paper proposes an online chatter-monitoring method based on continuous wavelet transform and convolutional neural network–vision transformer (CNN-ViT). Firstly, the continuous wavelet transform is used to convert the one-dimensional time domain force signal into a two-dimensional time–frequency image. Secondly, by using the CNN model's capabilities of adaptive feature learning and hierarchical feature extraction, the local features in the input image are learned and captured through a series of convolutional layers, pooling layers, and other structures, which effectively reduces the complexity of feature extraction. Finally, the self-attention mechanism of the ViT model is used to integrate and model the global feature map of the input feature map, the global contextual information of the captured image is calculated by calculating the global contextual information of the captured image, and then the classification result is outputted according to the integrated global feature. In this paper, by combining the CNN model with the ViT model, the chatter characteristics are comprehensively captured from multiple angles and levels, which improves the robustness of the model, thereby improving the accuracy and efficiency of online monitoring and providing an innovative and effective technical means for online monitoring of chatter.
- Article
(2544 KB) - Full-text XML
- BibTeX
- EndNote


In today's machining field, thin-walled parts have been widely used in aerospace, electronic equipment, automobiles, and other fields due to the advantages of their small size, light weight, and compact structure. However, the fly in the ointment is that thin-walled parts have the properties of low stiffness and difficult machining, which makes them prone to chatter during machining. During machining, chatter can cause sudden fluctuations in cutting forces, which can adversely affect the quality of the machined surface and the life of the tool. In addition, chatter can also cause a series of hazards such as part breakage and production accidents. Therefore, it is of great significance to monitor the chatter online and to adopt reasonable control methods in the process of metal cutting.
Identifying chatter is essential for more accurate chatter monitoring. Huang et al. (2012) analyzed the milling force and acceleration signals to identify the frequency characteristics of chatter. Dun et al. (2021) clustered the signals using auto-encoded compression based on the hybrid clustering method and found a chatter identification method that was less affected by the measurement error. Shi et al. (2020) collected different types of sensor signals through a large number of experiments and extracted their features, finding an effective method for the identification of chatter in high-speed milling. Li et al. (2021) established a model, based on the real-time variance in the milling force signal in the time domain and the wavelet-to-energy ratio of the acceleration signal decomposed by wavelet packets in the frequency domain, that can effectively detect the occurrence of chatter. Lee et al. (2020) used the acoustic signal generated by the microphone to record the milling status to detect the occurrence of chatter. At present, sensor technology is developing rapidly, and multi-sensor fusion can be used to improve the accuracy and real-time performance of chatter monitoring by integrating data from different sensors.
However, multi-sensor systems face the challenge of solving the problem of data synchronization and signal intrinsic linkage (Quan et al. 2023, 2024). For signal processing, two key steps are often implemented: noise removal and feature extraction, in which de-noising is achieved by filtering irrelevant signals and improving data quality. Common methods for feature extraction include time domain, frequency domain, and time–frequency domain analysis and adaptive intelligent feature extraction.
The time domain analysis method extracts information from the data sensor that can reflect the amplitude change during machining and determines the cutting state through calculation statistics. Ji et al. (2024) used the time domain CFD/CSD (computational fluid dynamics and computational structural dynamics) method to calculate the static equilibrium state of the model, and, based on this state, the equation was solved in the time domain, and the chatter phenomenon was well evaluated and predicted. Ye et al. (2018) obtained the root mean square value of real-time acceleration by calculating the root mean square value of acceleration in the time domain and used the ratio of its standard deviation to the mean value (coefficient of variation) as the index for identifying chatter, which provides a new method for the identification of chatter. Among them, the time domain features are divided into two categories, namely dimensioned and dimensionless, and their usage over the past 10 years is shown in the Figs. 1 and 2.
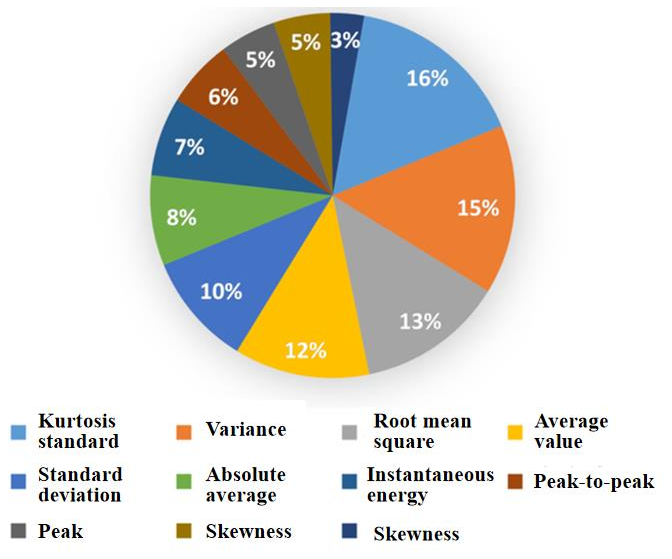
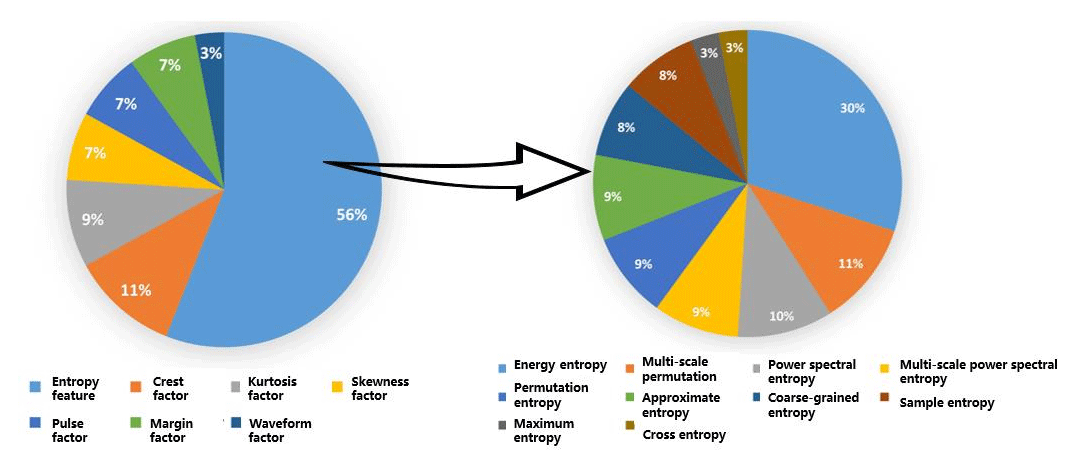
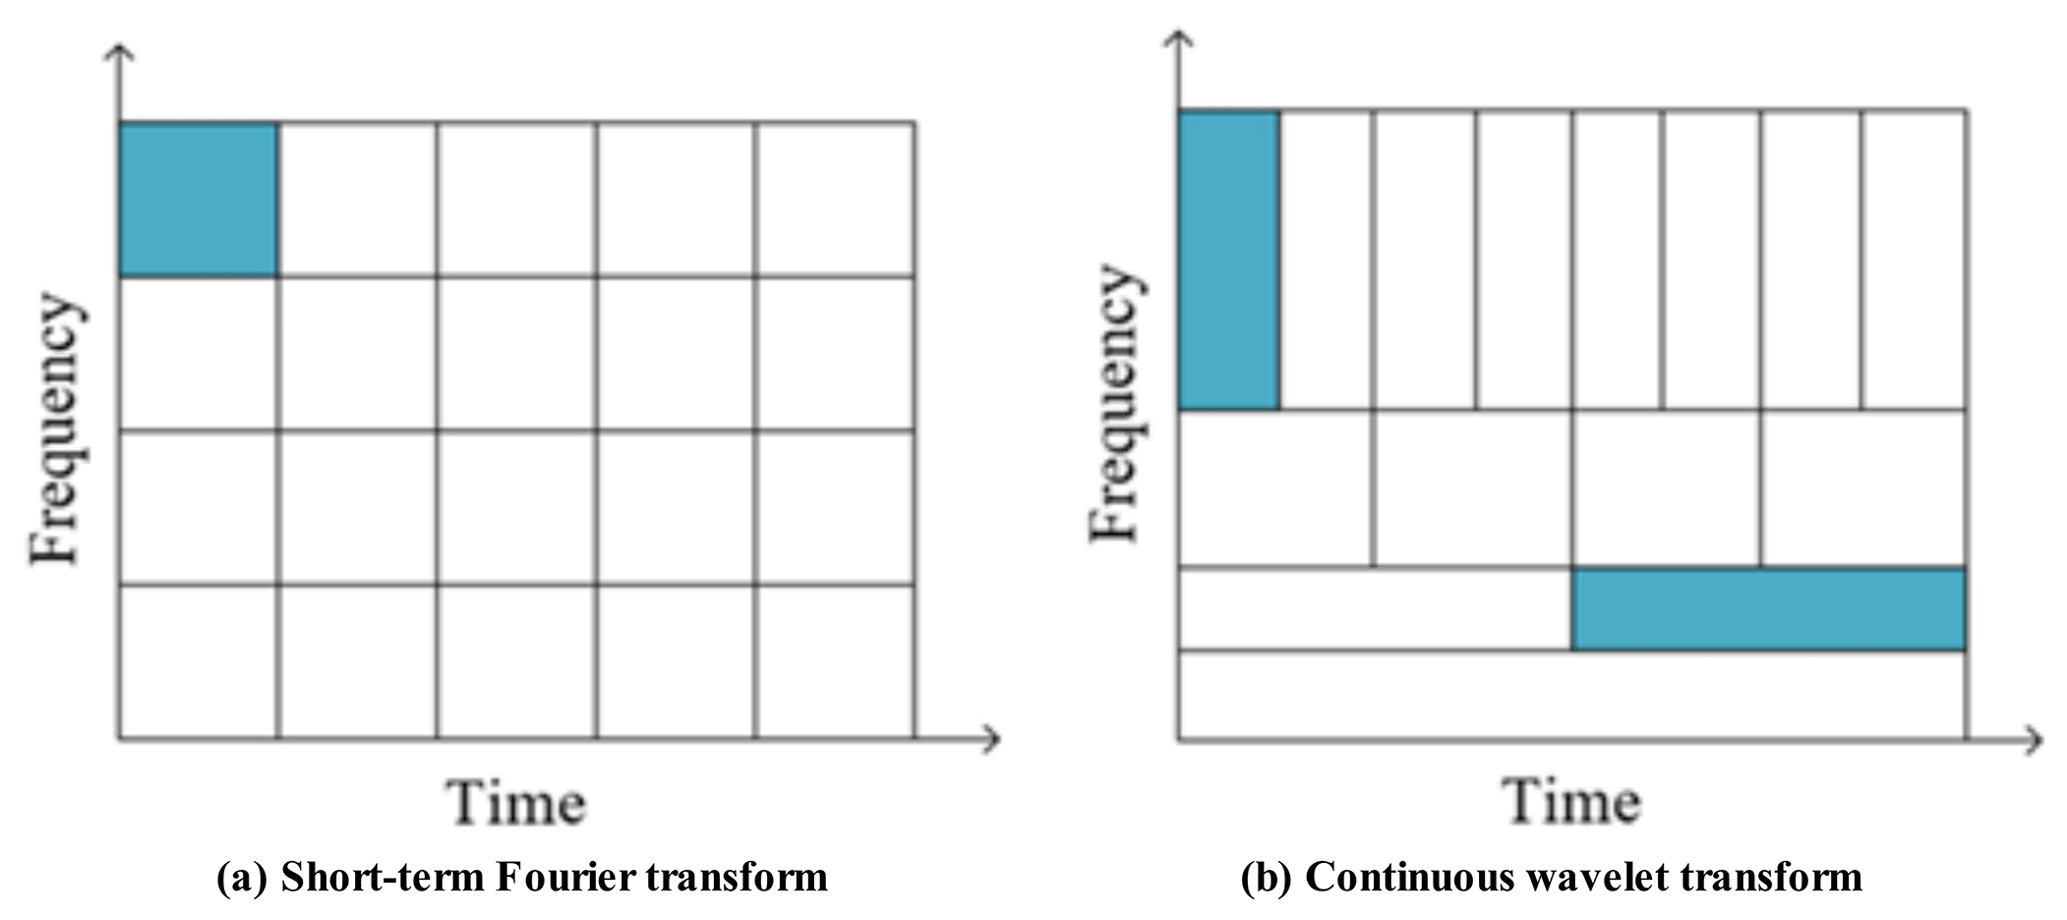
Figure 3Time–frequency resolution plot. (a) Short-term Fourier transform. (b) Continuous wavelet transform.
Although time domain analysis has been applied to chatter monitoring, it still has certain limitations. The time domain analysis method is susceptible to external interference, and, due to the dynamic nature of the tool and the workpiece, nonlinear and unstable signals are generated; it is difficult to continuously monitor the machining status through time domain parameters alone, which may lead to incorrect judgment of the machining status. In addition, time domain analysis can only provide time series information, not frequency information, and chatter is closely related to frequency and energy distribution density. Therefore, when changing machining conditions such as spindle speed and cutting depth, the time domain analysis method cannot accurately identify the onset of chatter, which affects the surface quality of the workpiece.
A key technique in frequency domain analysis is the Fourier transform, which converts the frequency characteristics of a signal into analyzable values (Qin et al., 2022). Among them, the fast Fourier transform (FFT) is the most popular method; it can quickly reveal the contents of the spectrum and is widely used in milling to identify the occurrence of chatter. Lee et al. (2023) used FFT to analyze the frequency component of cutting torque to monitor the machining process parameters to achieve the purpose of real-time monitoring of the cutting process. Yesilli et al. (2022) collected the characteristic signals in turning and milling experiments under different configurations and analyzed them by using methods such as fast Fourier variation (FFT) to study the classification accuracy of chatter. Lu et al. (2018) used FFT to analyze the acceleration signal during the turning process and studied the influence of machining position and machining direction on chatter.
However, the Fourier transform also has certain limitations. Thaler et al. (2014) compared the ability of feed force signals, acceleration signals, and sound signals to detect chatter during band saw cutting. It is found that, although the Fourier transform can reveal the relationship between signal amplitude and frequency, it cannot provide time information. In other words, the Fourier transform only tells you which frequencies exist, but you do not know when they appeared. In addition, the Fourier transform is only suitable for stationary signal analysis (Qin et al., 2019) and may not be ideal for non-stationary signals (signals that are unstable in the machining process).
Time–frequency analysis is a very effective way to monitor chatter because it converts a single-dimensional signal into a planar image of the time–frequency and shows the change in frequency over time. At present, the common time–frequency analysis methods mainly include short-time Fourier transform (STFT), wavelet transform (WT), wavelet packet transform (WPT), empirical mode decomposition (EMD), Hilbert–Huang transform (HHT), variational mode decomposition (VMD), and their corresponding improved methods.
Li et al. (2020a) used short-time Fourier transform (STFT) to study the force signals during the cutting process and found that STFT can handle stationary and non-stationary signals well. Tinati and Mozaffary (2005) processed speech signals based on short-time Fourier transform (STFT) and wavelet transform (WT) and found that wavelet transform enhanced the orthogonality and sparsity of the signal and was superior to STFT in terms of the decomposition of signals. However, it is difficult for WT to determine the appropriate wavelet basis function and decomposition level, which has a great impact on the analysis results. Zhang et al. (2018) used the energy entropy decomposed by wavelet packets to decompose the vibration signal, and the chatter state could be well identified according to the different energy distributions. Susanto et al. (2020) used the Hilbert–Huang transform (HHT) to process the vibration signals obtained from the turning experiments; they compared the spectra of HHT and STFT and found that HHT provided high time and high frequency resolutions for monitoring chatter, concluding that HHT was superior to STFT in chatter recognition. EMD has great advantages in dealing with nonlinear and non-stationary signals, but it also has certain limitations, with the main disadvantage being modal mixing, which can lead to severe aliasing of time–frequency distributions. In order to solve this problem, the EMD was improved, and an integrated empirical mode decomposition (EEMD) method was proposed to suppress modal mixing. Ji et al. (2018) used the EEMD method to decompose the acceleration signal and extracted two indicators, namely power spectral entropy and fractal dimension, to detect chatter characteristics. It has been verified that, although EEMD can effectively suppress the mixed mode, it is time-consuming and not suitable for real-time signal processing and has the disadvantage of the number of modal functions being difficult to determine.
In order to solve the above two problems, scholars have proposed a variational mode decomposition (VMD) method, which has more powerful functions in the preprocessing of chatter detection signals. VMD mainly solves modal-mixing problems by constructing and solving variational problems, which can adaptively estimate and update the number of modal decompositions, the frequency of the signal, and the band limit, which effectively improves the accuracy of decomposition. Liu et al. (2021) used variable decomposition modes (VMDs) and energy entropy for real-time chatter monitoring. Li et al. (2020b) used the VMD method to decompose the original signal and analyze the signal frequency to identify chatter in combination with the energy ratio method. The severe shortcoming of the VMD method lies in the optimal selection of the number of modes K and the quadratic penalty a. The maximum kurtosis calculation, which is based on signal reconstruction, is often highly time-consuming (Wang et al., 2022).
Compared with the traditional technique of manual selection of chatter features, the intelligent extraction method based on feature adaptation has great advantages (Fu et al., 2015). This method needs to be combined with deep learning, convolutional neural networks, and other methods to conduct in-depth research on the feature expression and extraction algorithms of chatter. If the wavelet transform is combined with the convolutional neural network, the accuracy of chatter monitoring can be significantly improved. Fu et al. (2017) used wavelet transform to convert the signal into the input of the deep convolutional neural network (DCNN) and found that DCNN could obtain higher accuracy by comparing the monitoring of the processing status of convolutional neural network (CNN) and support vector machine (SVM) models. Tran et al. (2020) used wavelet transform to convert the signal into the input of the deep convolutional neural network (DCNN), took the image features of the processed surface as the feature signal, and used the signal after continuous wavelet transform as the input of the CNN model, thereby successfully realizing the accurate monitoring of the chatter state. Sener et al. (2021) proposed a method to monitor chatter using DCNN and experimentally demonstrated that the average accuracy of the cutting parameters could reach 99.88 % when the cutting parameters were used as the inputs of the DCNN model. Tao et al. (2019) proposed a method for early flutter recognition of robotic drilling processes based on synchronous extraction. This method can identify the time of flutter much earlier. From the above research results, it can be seen that the identification methods of various chatter features have certain shortcomings. Although the convolution operation of the CNN model has advantages in terms of image recognition, the local features that can be learned and captured are concentrated in the image, and there are still limitations for global features; thus, this paper will use the self-attention mechanism of the vision transformer (ViT) model to identify global features.
In this paper, the force signal data collected in the milling experiment will be preprocessed. Firstly, the continuous wavelet transform is used to transform the one-dimensional digital signal into a two-dimensional time–frequency image, and then the obtained image is input into the convolutional neural network for feature extraction. Subsequently, the extracted feature images were input into the visual model (ViT) of the transformer structure for recognition. The image is segmented into a series of patches through ViT, and each image block is converted into a vector representation (patch embeddings). After linear projection and position encoding, the vector is input into the transformer encoder again; one vector representation input in it is self-attention calculated with other vectors, and the output of the last transformer encoder is averaged and pooled by the output layer of the ViT model through layers of screening, and it is input into a linear layer for classification prediction. Finally, the classification is normalized by the softmax function to obtain the probability distribution of the classification so as to achieve more accurate classification of the image.
2.1 Theoretical model of continuous wavelet transform
Continuous wavelet transform (CWT) is a method for scaling analysis of a signal which can convert a one-dimensional signal in the time domain into a two-dimensional signal in the time–frequency domain and has the characteristics of scale tunability, time–frequency locality, continuity, computational complexity, and reversibility. In addition, CWT effectively avoids the resolution issues inherent in STFT when dealing with non-stationary signals. CWT can provide a variable resolution in the time–frequency plane with a variable time window, as shown in Fig. 3.
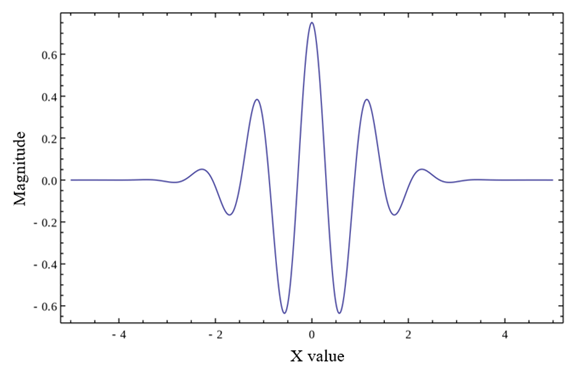
Continuous wavelet transforms include the wavelet families such as Daubechies, Symlets, Coiflets, Haar, Morlet, and Como (complex Morlet). Morlet wavelets have the characteristics of good locality in the time domain and smooth monetization in the frequency domain, making these wavelets more suitable for time domain analysis of wide-spectrum signals. The CMOR (complex Morlet) wavelet adds a modulation factor to the basis of the Morlet wavelet, which has good local characteristics in both the time and frequency domains and can better analyze the non-stationary signal. Its expression is as follows:
where w0 is the center frequency of the CMOR wavelet, and b is the modulation factor, which determines the shape of the complex part. Furthermore, t represents the time variable. CMOR wavelets have good local properties in both the time and frequency domains, which can better describe non-stationary signals and are often used for signal compression, feature extraction, etc.
In this paper, the CMOR wavelet is used to process the non-stationary and nonlinear cutting force signal, as shown in Fig. 4, and the scale parameters can be converted by the relationship between frequency and time during the transformation process.
2.2 Convolutional neural networks
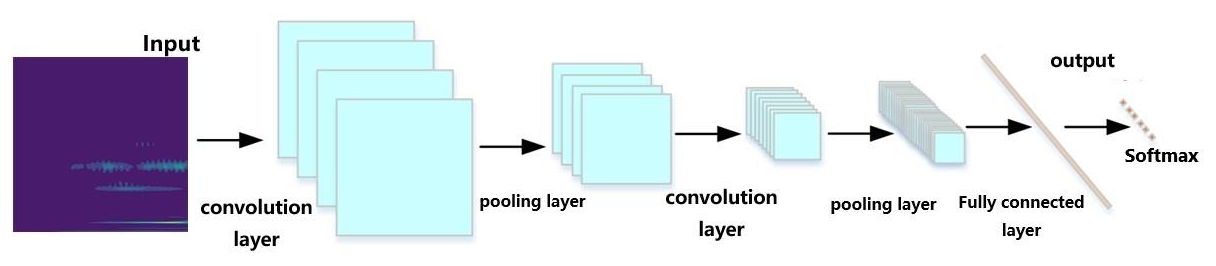
A convolutional neural network (CNN) has an excellent ability to recognize images and process features, and it assigns different weights and biases to each feature of the input data to achieve efficient recognition and classification of key information. A typical CNN architecture is shown in Fig. 5.
The convolutional layer is a key part of feature extraction. The main step is convolution, which describes the process by which one function slides on top of another and calculates the area of the overlapping part of the two. In CNNs, convolution operations are used to capture local patterns and structures in input data. In this way, the convolutional layer is able to extract useful features from the input data, and, in the extraction stage, the convolution kernel is used to perform convolution operations based on the output image produced by the previous layer or the input image of the current layer to form a feature map.
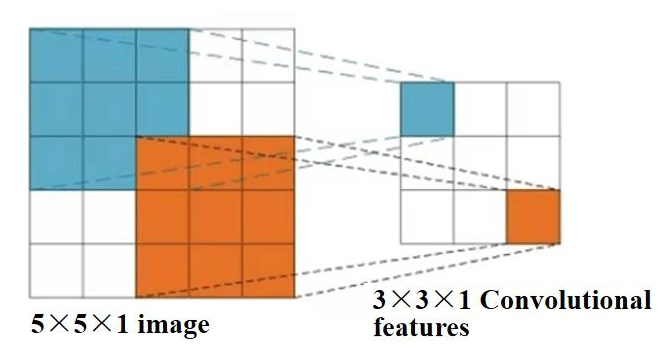
The number of nodes in the CNN input layer is limited by the image resolution or pixel value. Given this limitation, grayscale images can be thought of as matrices with single channels and pixel dimensions, while color images can be seen as matrices with three channels (RGB), each with a specific pixel dimension. For example, Fig. 6 shows a 5 × 5 × 1 grayscale image matrix using a 3 × 3 × 1 convolutional kernel. In a convolutional layer, the sliding window (convolutional kernel) adjusts its number based on the input image to achieve a wide coverage of the image data, ensuring that different features of the image can be captured, resulting in a diverse feature map.
After a certain amount and degree of convolutional-kernel sliding processing, a fixed-size input image can generate a feature map with a specific dimension. The matrix dimension of the output feature map can be calculated according to Eq. (2):
where MW and MH represent the width and height of the input image, Dk represents the size of the sliding window (convolution kernel), S is the step size of the sliding-window movement, P is the number used for image filling, and and represent the integer function; together, these parameters determine the size of the output feature map after the convolution operation.
The pooling layer in CNNs is located between the convolutional layers. The feature map can be downsampled, and the values are mainly taken from the covered feature map area through filters, with the main parameters including the size and step length of the filter. The pooling layer has two value methods: maximum pooling and average pooling. Maximum pooling highlights the most significant features by finding the largest pixel value in the selected area of the feature map, which helps to capture more significant information. For inputs with multiple channels, maximum pooling is performed independently for each channel. Average pooling is used to extract overall features by averaging the pixel values within a region, which also needs to be done on a per-channel basis. Although average pooling helps smooth the data, it can also cause image distortion. Therefore, in practice, maximum pooling is more widely used.
The role of the fully connected layer is to flatten and integrate the information after feature extraction into a one-dimensional vector so that it can be mapped to the label space required for the classification task. However, due to the existence of a large number of floating-point operations, its computational efficiency is low. As a result, more and more studies tend to replace fully connected layers with less computationally intensive layers, such as convolutional layers and global-average pooling layers (GAP).
The function of the classifier is to analyze the image features processed by the multi-layer network and to assign the input image data to the corresponding categories to achieve the final classification of the image. In image classification, commonly used classifiers include support vector machines (SVMs) and the softmax function.
SVM conducts classification by maximizing the information distance in the mapping space, which is mainly suitable for linearly separable binary classification problems. In CNNs, SVM can classify feature data by minimizing classification errors or maximizing geometric spacing to achieve effective image recognition. The softmax function was originally developed based on a logistic regression classifier to perform multi-class classification by processing log-likelihood functions. It limits the output to the [0,1] interval so that the result can be directly interpreted as the probability.
2.3 ViT neural network
ViT is a deep learning model whose main idea is to divide an image into patches and convert those blocks into vector sequences. These vectors are then fed into a transformer, and features are extracted using a self-attention mechanism and a multi-layer perceptron. This model reduces the explicit assumptions about the local spatial structure in the traditional convolutional neural network and establishes the interaction and integration of spatial information through the global self-attention mechanism so as to overcome the problems of spatial invariance, parallel computing, and high requirements for computing resources of convolutional neural networks.
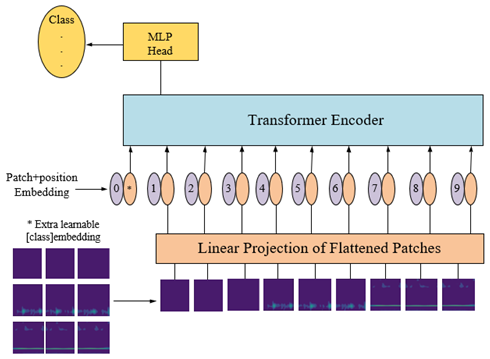
ViT is a visual domain model of transformer architecture that can be used for image classification tasks. The model has four important parts, including the patch-embedding layer in which the image is divided into several small pieces, the pos-encoding layer for position encoding, the transformer encoder layer, and the MLP (multilayer perceptron) head layer.
The patch-embedding layer is used to divide the input image into multiple small pieces and convert the information from each patch into a vector representation. The position-encoded pos-encoding layer is used to add positional information to the vector of each patch, ensuring that the transformer can capture the positional information of each patch in the sequence. The encoder layer of the transformer is used to extract and encode the patch vector sequence with position coding to obtain a set of high-dimensional abstract feature representations. Finally, the high-dimensional feature coding is mapped to the target category space through the MLP head layer to generate prediction results. This is shown in Fig. 7.
3.1 Chatter recognition workflow for continuous wavelet transform and CNN-ViT
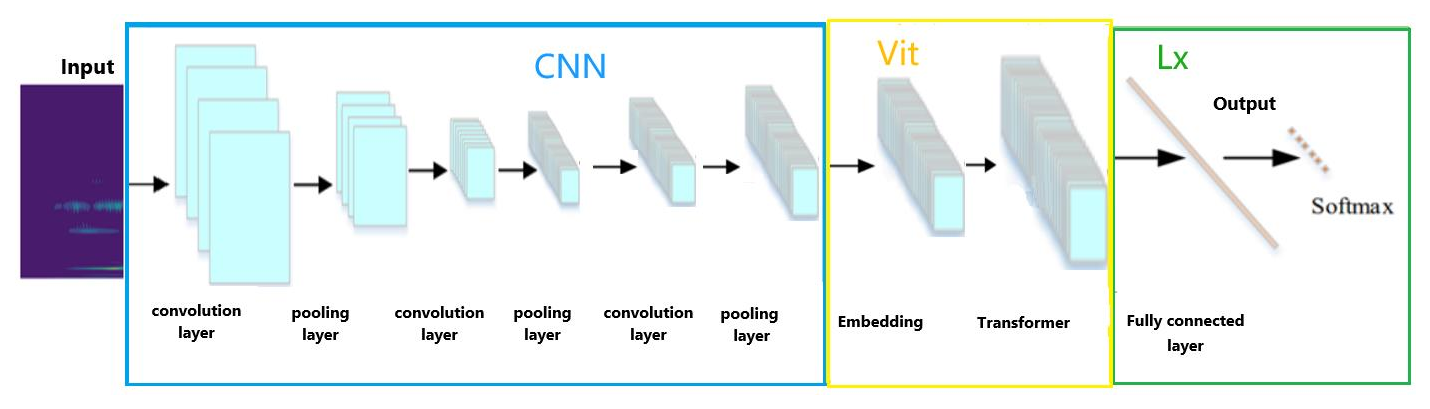
First, chatter recognition should obtain the force signal of the processing process and then analyze it in the frequency domain, use the continuous wavelet transform to transform the image, use the converted image as the input of the convolution operation, and extract the relevant features through convolution and pooling. Secondly, the ViT model and encoder are used to process and calculate the obtained features, and so the output results are obtained. Finally, the data are imported into the trained CNN-ViT monitoring model, and the faults can be directly classified.
The chatter recognition process for the entire CNN-ViT is shown in Fig. 8.
3.2 A chatter identification method based on frequency domain analysis
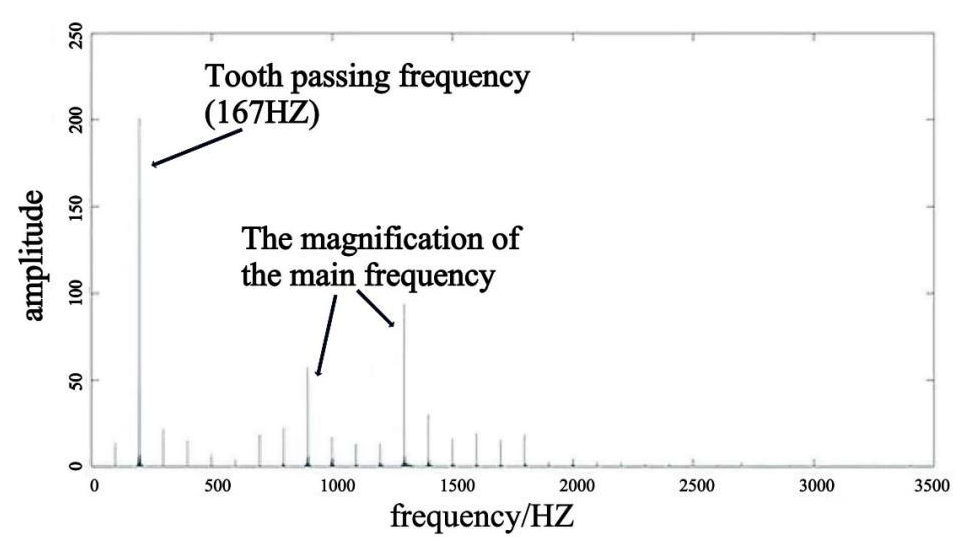
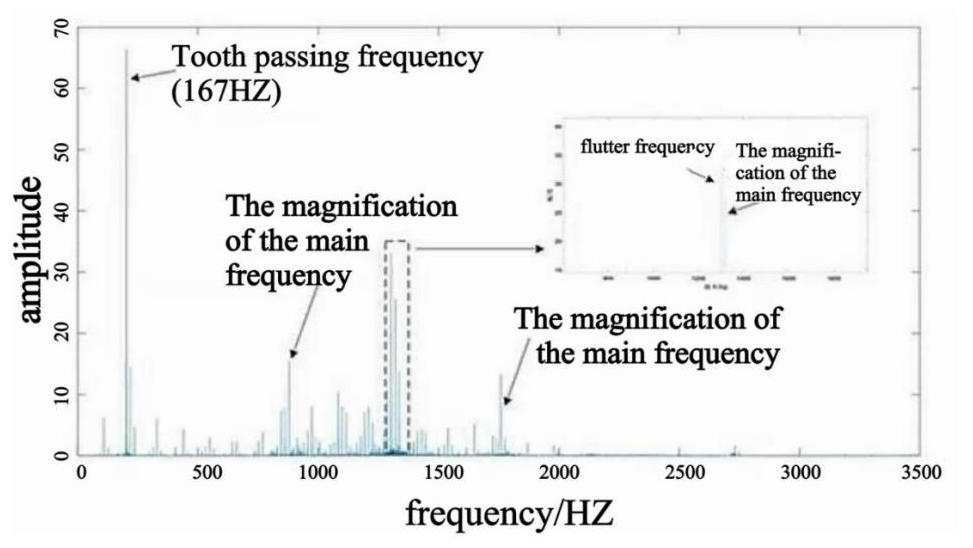
In order to identify chatter from the milling force signal, a fast Fourier transform (FFT) is first performed to convert the signal into the frequency domain, separating the individual frequency components. Next, in order to determine whether there is chatter phenomenon in each section of the signal and to label the signal as chatter or stability accordingly, the signal needs to be analyzed by means of the following steps: select any frequency in the FFT diagram and compare it with the natural frequency of the tool and the workpiece, the cutting frequency of the cutter tooth, or the spindle rotation frequency and its integer multiples; if the two match, the possibility of being used as the chatter frequency is excluded; if the two do not match and the amplitude of the selected frequency exceeds the amplitude of the main frequency and its multiplier or exhibits a high amplitude near the natural frequency then the frequency can be considered to be a chatter frequency. The expression of the main frequency calculation formula is given by Eq. (3):
where w represents the main frequency, n represents the spindle speed, and Z represents the number of teeth of the tool.
By continuously checking the other frequencies in the fast Fourier transform diagram and repeating the above process, it is possible to determine whether the milling signal contains chatter. If the chatter frequency is found in the FFT plot, it indicates that chatter has occurred during processing; if none of the frequencies correspond to chatter, it can be judged that the process is stable and that no chatter occurs. A schematic diagram of this process is shown in Figs. 9 and 10.
Through the frequency domain analysis of the measured force signal with fast Fourier transform, the measured force signal is identified as a stable processing state and chatter processing state, and the force signal is labeled.
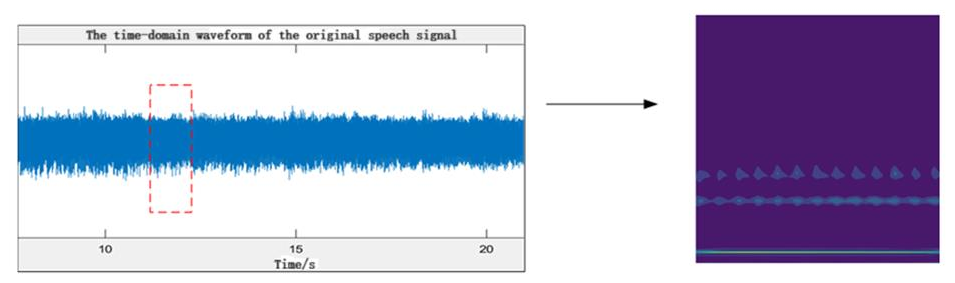
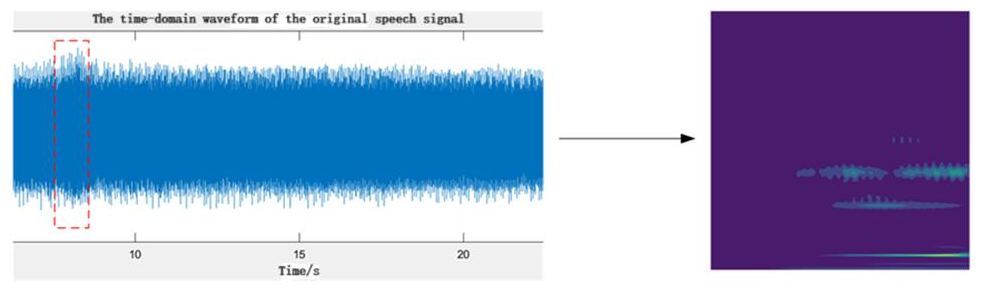
3.3 A chatter recognition method based on continuous wavelet transform
The cutting force signal in the y direction is used for chatter detection. Using a window size of 1028 samples to slide along each signal, it is designed to generate huge training and test datasets. CWT using the CMOR function has a scale of 1028, which provides a good visualization of the signal characteristics and is capable of presenting high temporal and frequency resolutions at the same time; this is then applied to each signal to convert the force signal into a time–frequency graph image. This is shown in Figs. 11 and 12.
3.4 CNN model feature extraction
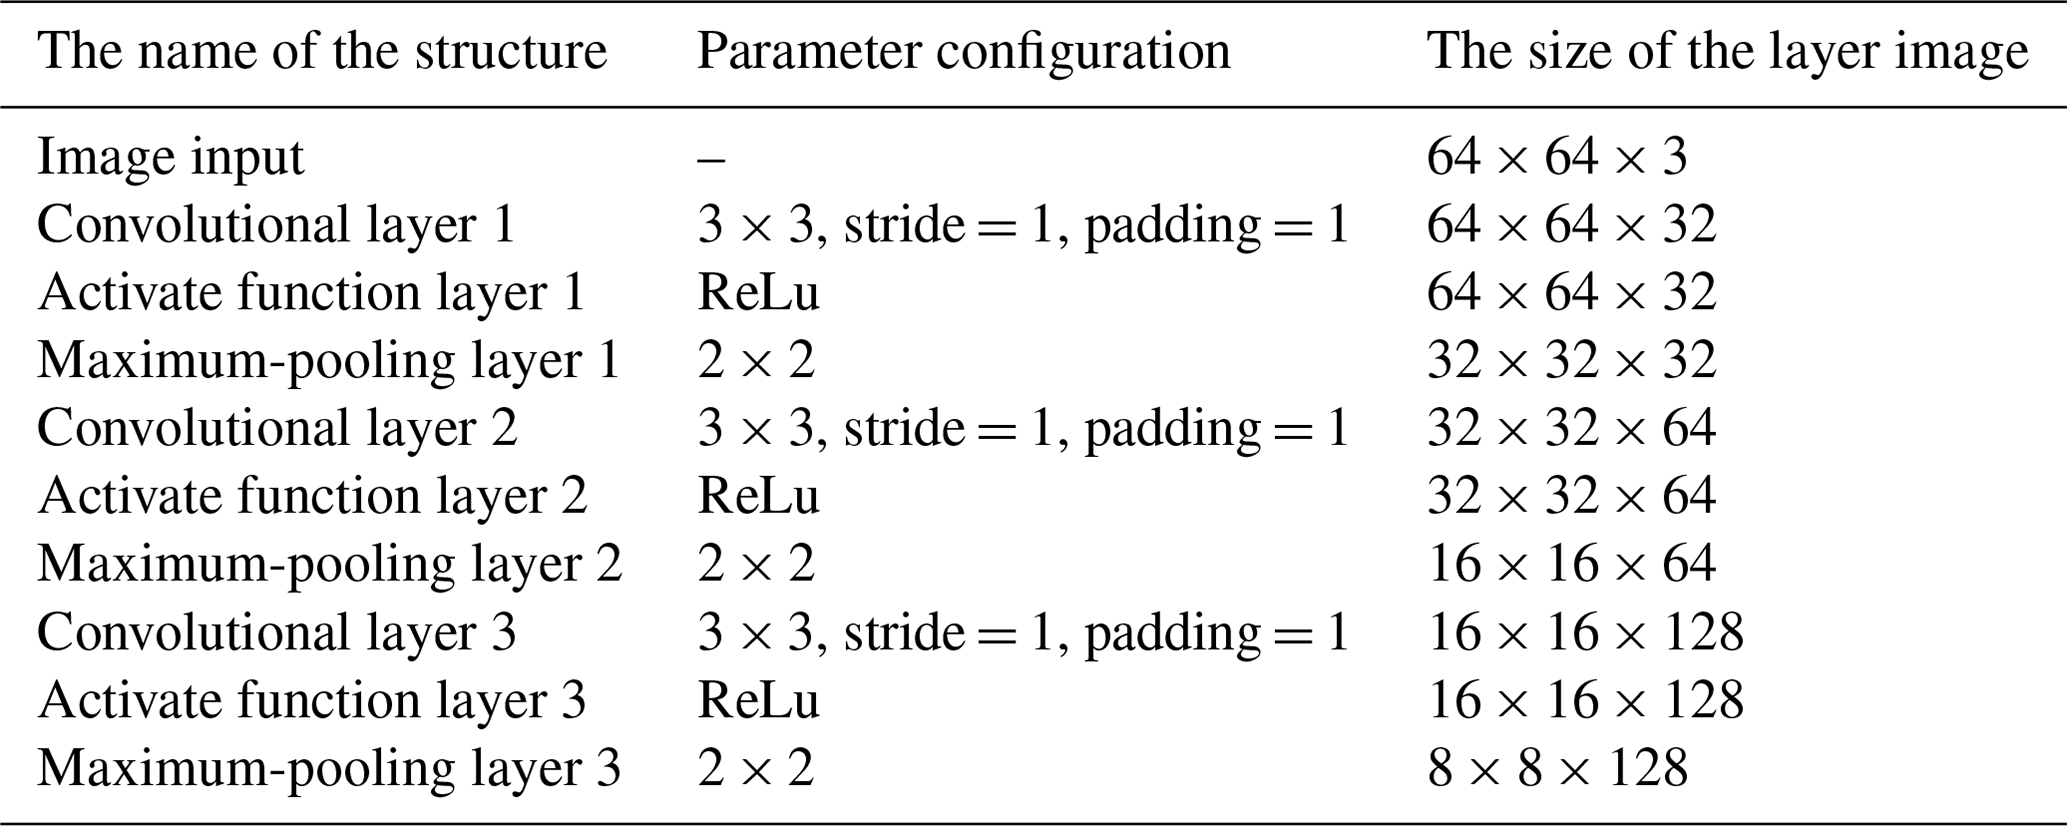
By using the continuous wavelet transform, the one-dimensional time series signal is converted into a two-dimensional time–frequency graph, and a time–frequency graph of 64 × 64 is generated for each group of sample data. This method not only effectively maintains the two-dimensional characteristics of one-dimensional force signal data but also reduces the need for preprocessing parameters and reduces the dependence on technical personnel. In this process, the image data are downsampled by the CNN convolutional neural network, and the parameter settings of the convolutional network are deeply optimized, as detailed in Table 1. In addition, in order to solve the problem of dataset division, this paper divides the dataset into the training set and the test set according to the ratio of 6:4 and divides the test set and the verification set according to the ratio of 1:1 in the training set to improve the accuracy of the training results as much as possible. The downsampling step of CNN can effectively filter out the noise and interference in the original one-dimensional force signal and extract richer feature information from the two-dimensional time–frequency map.
Table 8Comparison of preprocessing effects of different wavelet basis functions.

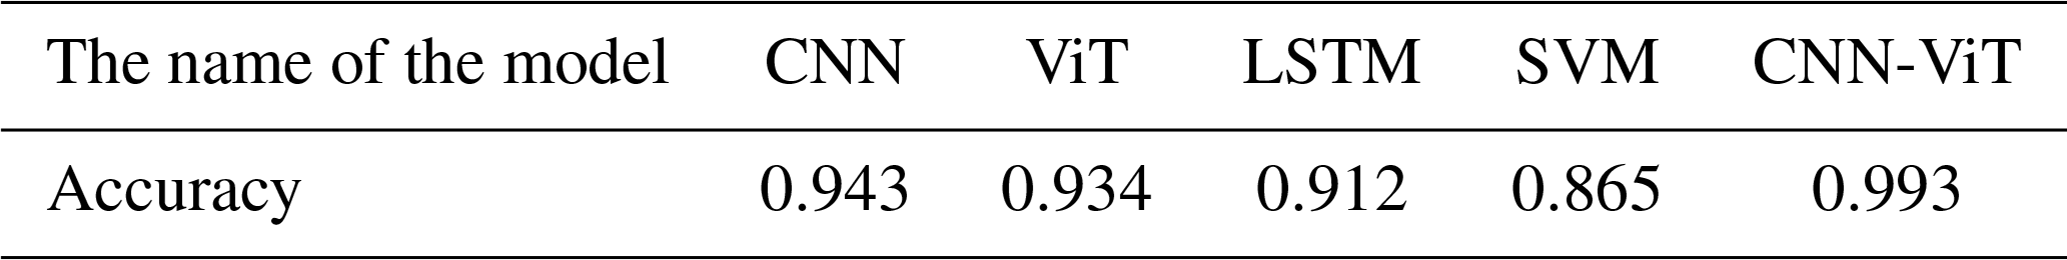
Table 9Comparison of the recognition effects of different methods.
3.5 ViT model fault identification
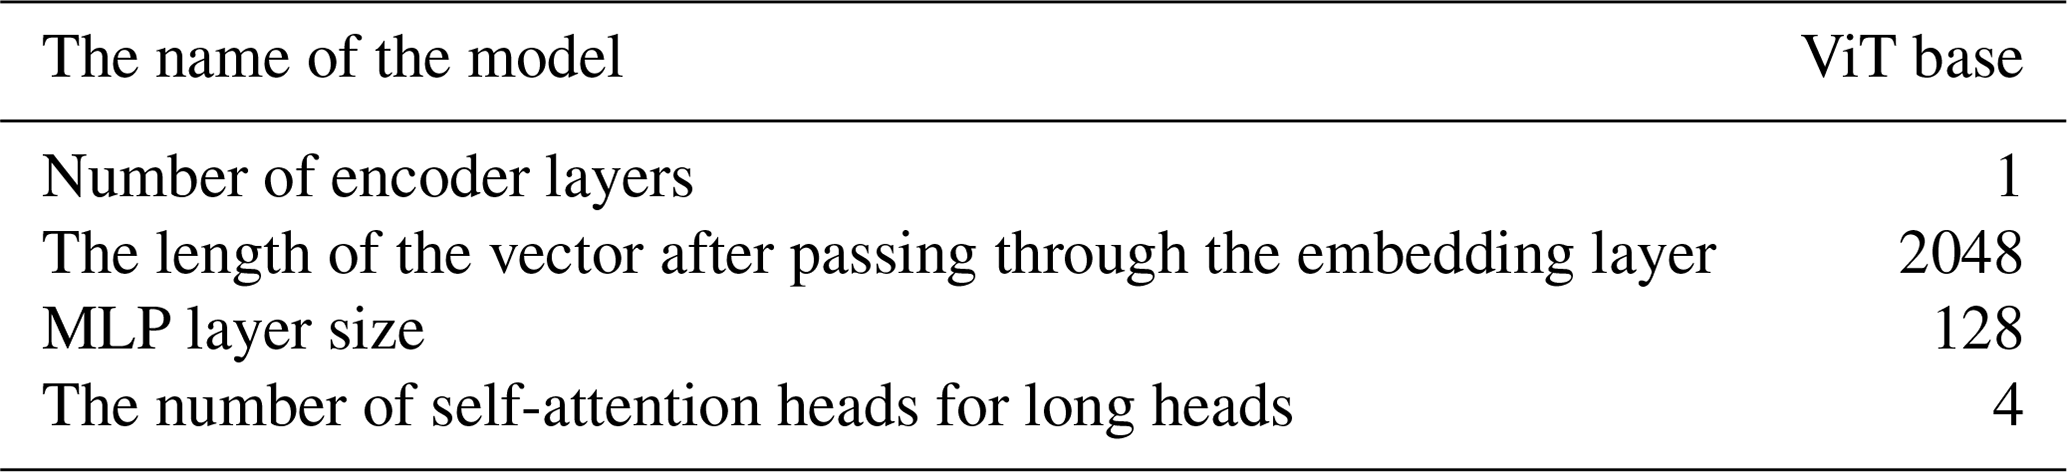
The time–frequency images processed by the CNN model are identified by using the ViT model. Table 2 lists the parameters of the ViT model.
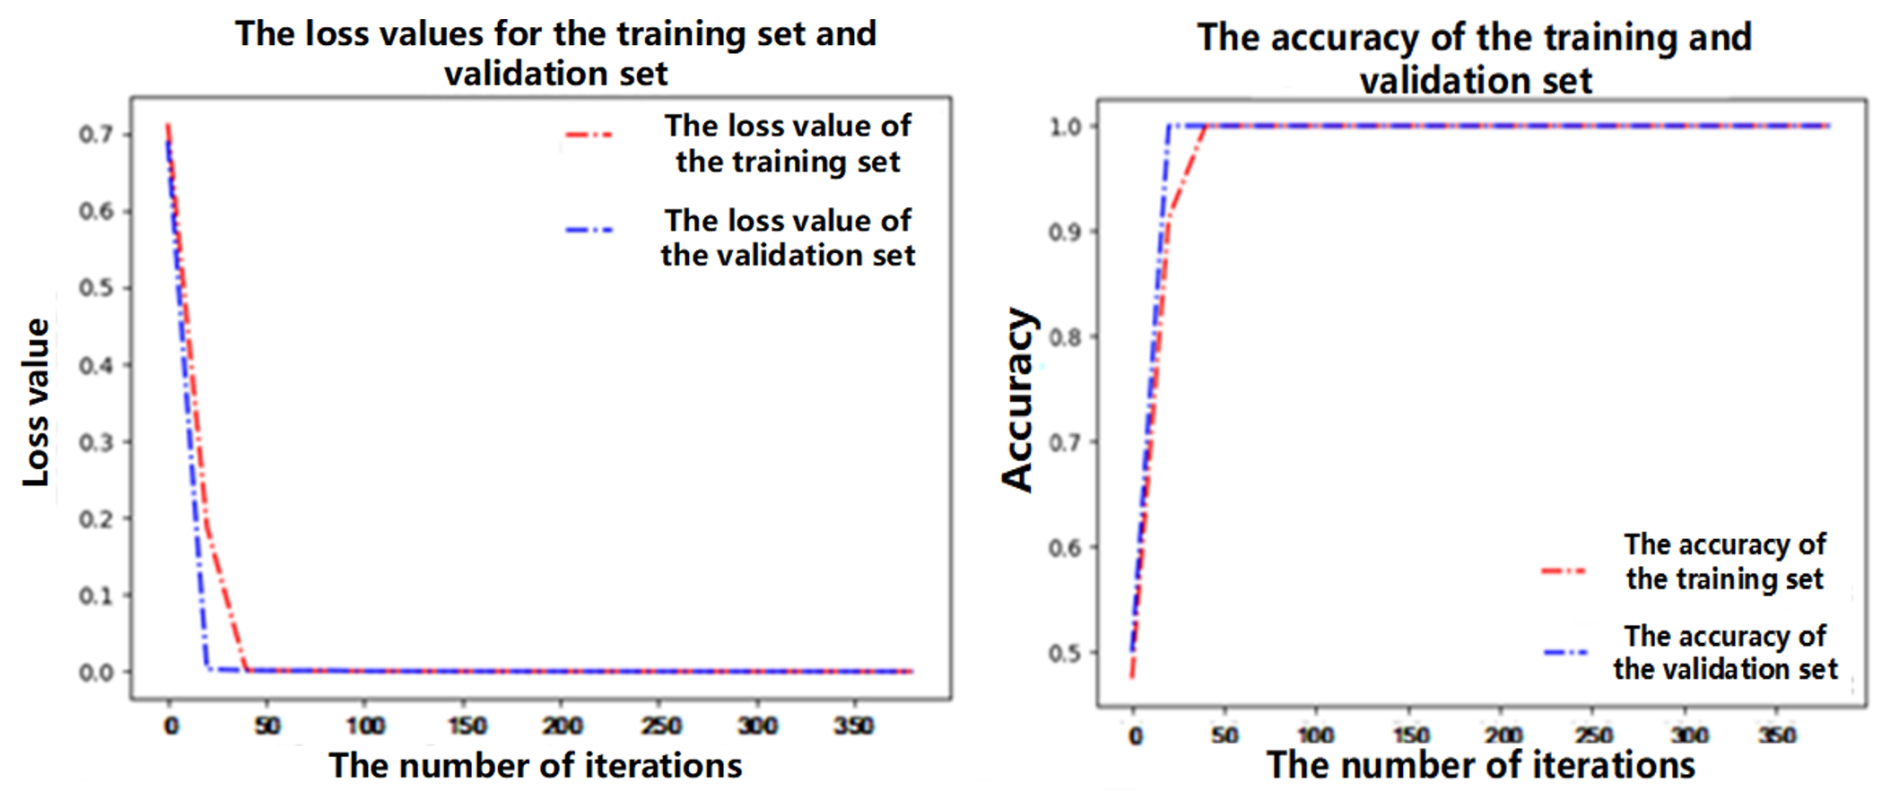
During the training process, a total of 400 rounds of training were carried out, and the stochastic gradient descent method was used for the gradient update. The learning rate is set to 0.001, and, after training, the effect is as shown in Fig. 13.
As can be seen from Table 13, the accuracy of the model reached 99.3 % after multiple rounds of training. This shows that the model has a good resolution in terms of chatter faults.
Table 10Comparison of the recognition effects of different methods.
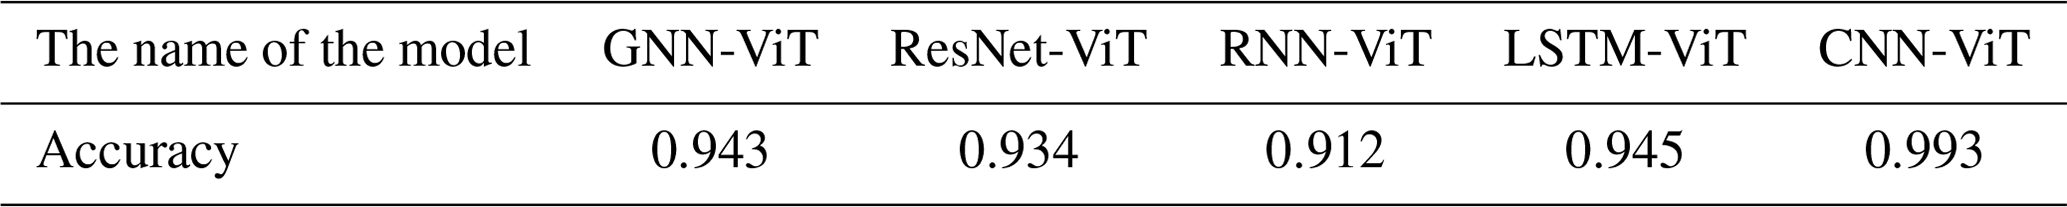
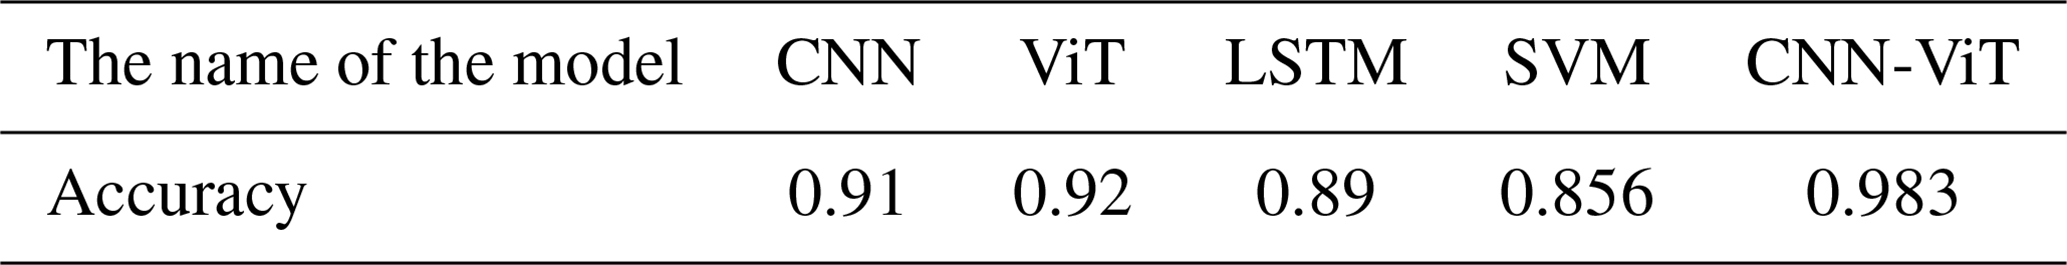
Table 11Comparison of the recognition effects of different methods.
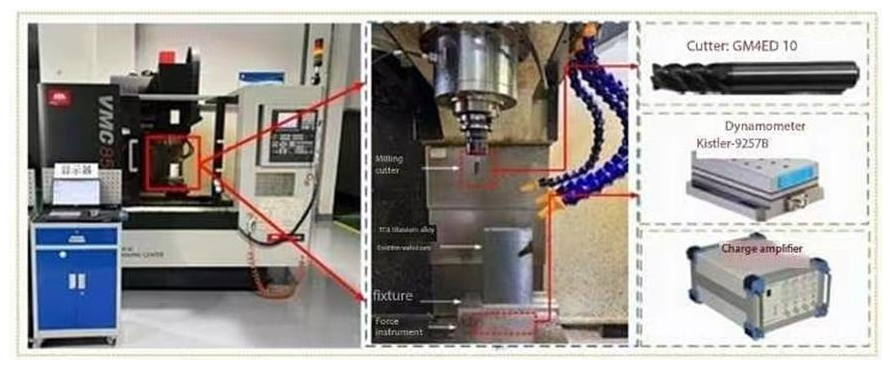
In this experiment, milling experiments under different dry-cutting conditions were carried out on the VMC850 vertical machining center. The machining center adopts the Siemens operating system. The experimental setup is shown in Fig. 14.
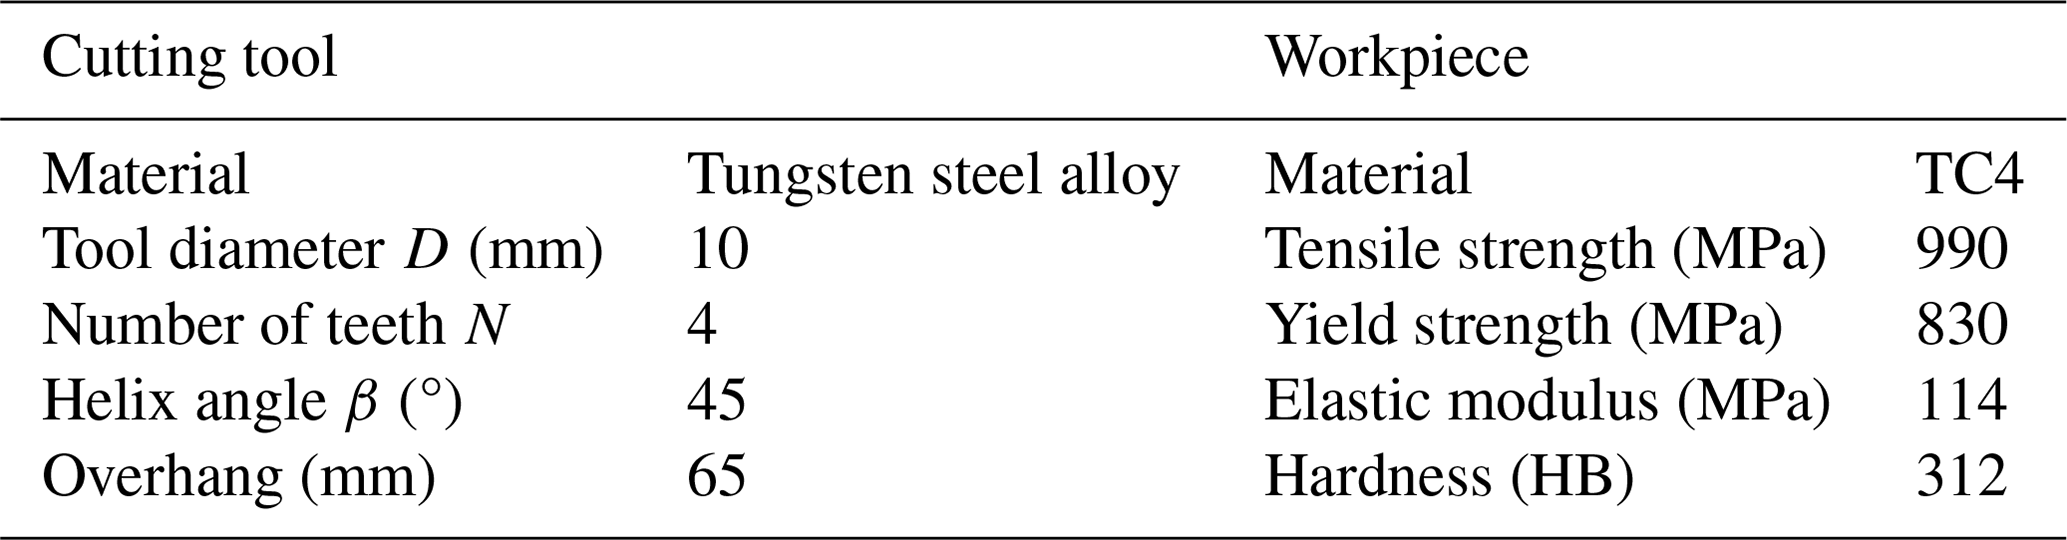
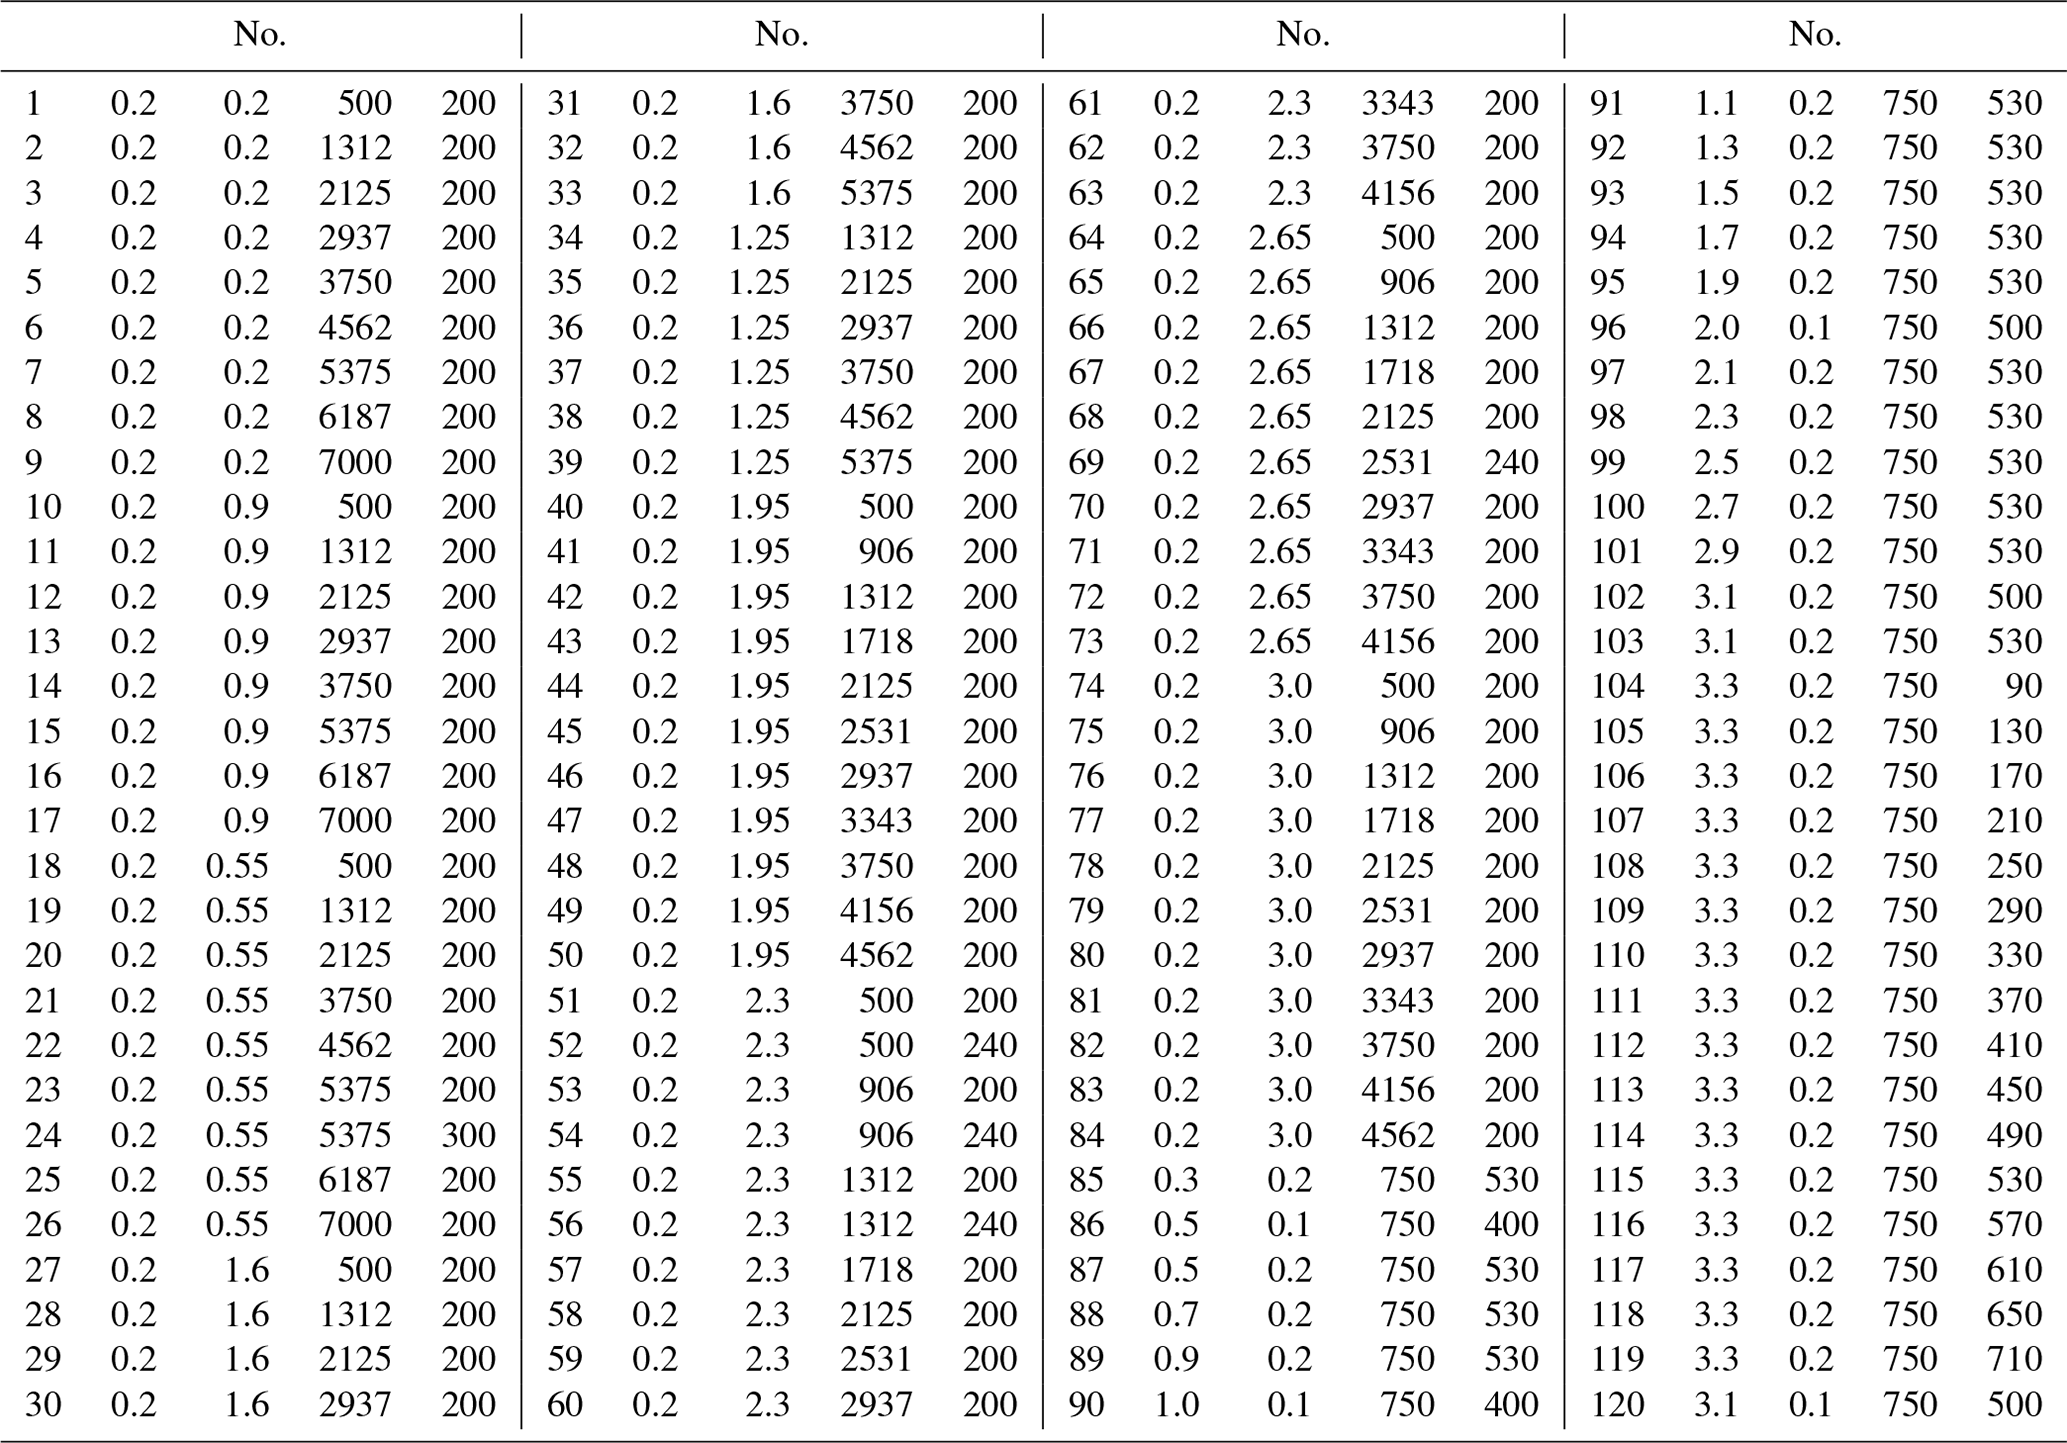
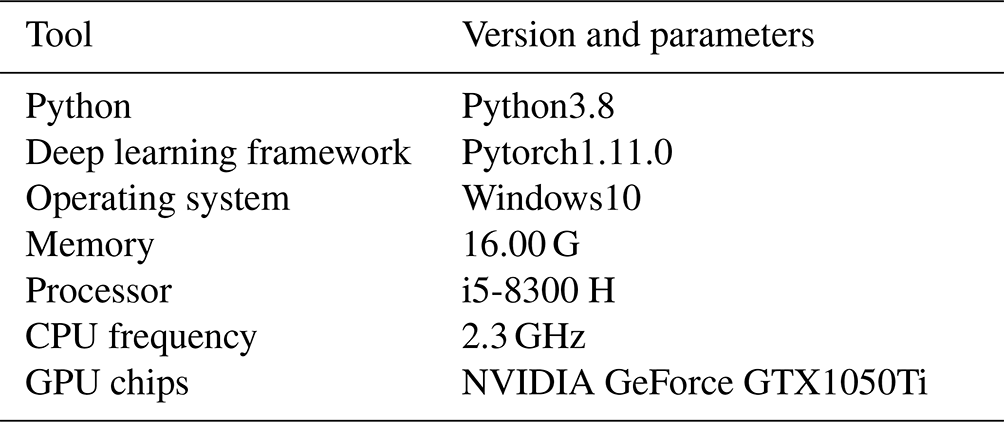
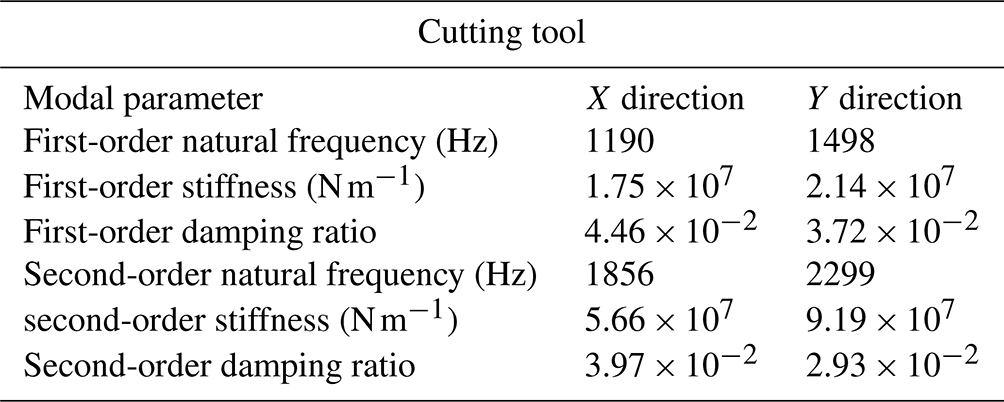
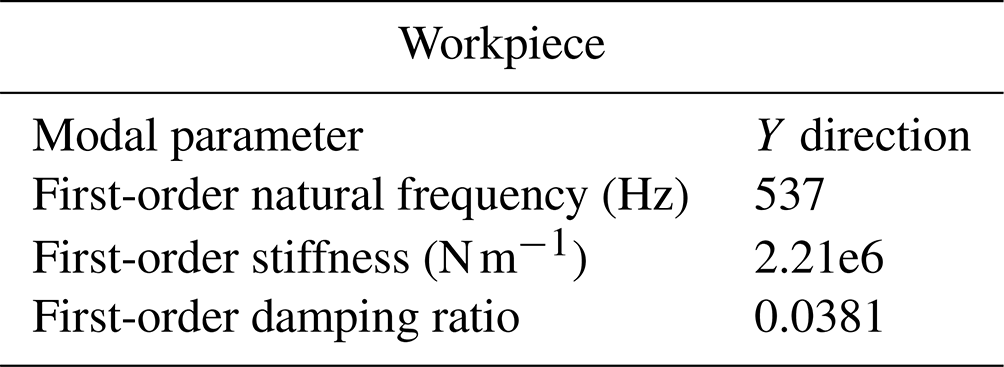
The cutter is GM-4E-D10, which is a four-tooth plane end mill. The experimental workpiece is titanium alloy TC4, with dimensions of 100 mm × 100 mm × 50 mm. The detailed geometric parameters are shown in Table 3. During the milling process, the milling force signal is obtained by means of the Kistler 9257B force sensor. The entire machining process is in a dry milling state. The force transducer is fixed on the table, and the workpiece is clamped with a vise, as shown in the figure. The sampling frequency is set to 7000 Hz. By changing the machining parameters, 120 milling tests were carried out. The processing parameters are shown in Table 4, and the software and hardware platform data for experimental analysis are shown in Table 5. The modal parameters of the tool and workpiece are shown in Tables 6 and 7.
In order to improve the accuracy of the model, different wavelet basis functions are used to compare the effects of data preprocessing. The results are shown in Table 8. It can be seen that, in flutter detection, the CMOR wavelet can provide high time and frequency resolutions while processing small changes in the signal. Therefore, it often performs best in terms of detection accuracy and reliability.
In addition, in order to prove the effectiveness of the proposed method of appeal, a comparative experiment is carried out. Four models were selected for performance comparison: CNN, ViT, long short-term memory (LSTM), and SVM. The inputs to all models are time–frequency plots generated by continuous wavelet transforms. The CNN model performs feature extraction based on the structure described in Table 1 and, additionally, adds two maximum-pooling layers and four fully connected layers. The parameter settings of the ViT model follow the configuration in Table 5. The LSTM model consists of two layers of LSTM, each with 128 neurons. The results of the comparative experiments are documented in Table 9.
In order to verify the accuracy of the combination of the CNN and ViT models compared with other models, the following Table 10 is combined, and it is found that the combination of the CNN and ViT models has the highest accuracy.
Table 10 shows the comparison of the proposed method with other deep learning models. The results show that the accuracy of this method is the highest, reaching 99.3 %, which is 4.8 %, 5 %, 5.9 %, and 8.1 % higher than that of the LSTM-ViT model (94.5 %), the GNN-ViT ViT(Graph Neural Network-Vision Transformer) model (94.3 %), the ViT model (95.4 %), and the RNN-ViT (Recurrent Neural Network-Vision Transformer) model (91.2 %), respectively. This confirms the significant advantages of this method in terms of accuracy. The LSTM model is advantageous for time series recognition, but this paper studies image recognition, and so the final effect is not as good as with the CNN-ViT model.
The results show that the convolution operation of the CNN model is advantageous for image recognition, and the ViT model can also recognize images, although it does not have convolution operation and belongs to the pure attention mechanism. Although the above methods can achieve good recognition results, when using the CNN-ViT hybrid network model for image recognition, the accuracy of recognition is higher than that of the single network model.
In order to verify the generalization ability of the model, the model is applied to the flutter monitoring of different materials. Taking aluminum alloy as an example, the processing conditions are similar to those of titanium alloy. The accuracy of the model obtained is shown in the following Table 11, and the accuracy of other models in aluminum alloy processing is compared.
Table 11 shows the results of the comparison between the method proposed in this study and other deep learning models in relation to aluminum alloys. It is shown, that compared with other models, the accuracy of this method is the highest, reaching 98.3 %, which confirms that this method also has significant advantages in terms of the accuracy of other processing materials, proving that the model is still very accurate under different material and processing parameters and that the model has good generalization performance.
Although the model proposed in this study is superior to other models in terms of accuracy, it does come with large computational requirements. However, in real-world deployments and usage, this computational burden has a relatively small impact on overall performance and can often be ignored.
In order to solve the problems of chatter identification in the process of thin-walled parts, an online chatter-monitoring method based on continuous wavelet transform and CNN-ViT is proposed. Firstly, the continuous wavelet transform is used to convert the one-dimensional time domain force signal into a two-dimensional time–frequency image, and the time–frequency characteristics of the signal are captured. Secondly, the CNN model is used to sample and process the time–frequency images to provide the salient features related to stable chatter. Due to the structure of the convolutional layer, the CNN model can effectively capture the local features and texture information in the image, which is conducive to identifying the approximate range and morphology of chatter. Finally, the obtained features are input into the ViT model, and the global feature integration and modeling are carried out to accurately identify different processing states. Through its self-attention mechanism, the ViT model is able to process the global information in the image and capture the long-distance dependencies between different image regions.
Through the combination of the two models, the global and local features are used for chatter monitoring at the same time, and the complementary performance significantly enhances the performance of the model in chatter monitoring. At the same time, the experimental results also show that the chatter recognition model proposed in this paper achieves a high accuracy rate of 99.3 %, which proves the effectiveness of the method in chatter recognition and its potential in practical industrial applications. With this method, chatter during processing can be effectively monitored and prevented, and production efficiency and product quality can be improved.
The raw and processed data required to reproduce these findings cannot be shared at this time as the data also form part of an ongoing study.
In this article, CL wrote the first draft and revised the paper, DW and YL consulted the literature and provided experimental data, and SS reviewed the paper and provided project funding.
The contact author has declared that none of the authors has any competing interests.
Publisher's note: Copernicus Publications remains neutral with regard to jurisdictional claims made in the text, published maps, institutional affiliations, or any other geographical representation in this paper. While Copernicus Publications makes every effort to include appropriate place names, the final responsibility lies with the authors.
The authors are grateful to the anonymous reviewers and the editor for their comments on and suggestions for improving our paper.
This research has been supported by the Talent Scientific Research Fund of Liaoning Petrochemical University (grant no. 2021XJJL-005), the Liaoning Provincial Natural Science Foundation program (grant no. 2022-BS-293), the Basic Scientific Research Project of the Liaoning Provincial Department of Education (grant no. LJKMZ20220718), the Fushun Revitalization Talents Program (grant no. FSYC202207005), and the science and technology research project of the Liaoning Provincial Department of Education (LJKZ0387).
This paper was edited by Jeong Hoon Ko and reviewed by Chengjin Qin and two anonymous referees.
Dun, Y. C., Zhu, L. D., Yan, B. L., and Wang, S. H.: A chatter detection method in milling of thin-walled TC4 alloy workpiece based on auto-encoding and hybrid clustering, Mech. Syst. Signal Pr., 158, https://doi.org/10.1016/j.ymssp.2021.107755, 2021.
Fu, Y., Zhang, Y., Qiao, H., Li, D., Zhou, H., and Leopold, J.: Analysis of Feature Extracting Ability for Cutting State Monitoring Using Deep Belief Networks, Proc. CIRP, 31, 29–34, https://doi.org/10.1016/j.procir.2015.03.016, 2015.
Fu, Y., Zhang, Y., Gao, Y., Gao, H., Mao, T., Zhou, H. M., and Li, D. Q.: Machining vibration states monitoring based on image representation using convolutional neural networks, Eng. Appl. Artif. Intel., 65, 240–251, https://doi.org/10.1016/j.engappai.2017.07.024, 2017.
Huang, P. L., Li, J. F., Sun, J., and Ge, M. J.: Milling force vibration analysis in high-speed-milling titanium alloy using variable pitch angle mill, Int. J. Adv. Manuf. Tech., 58, 153–160, https://doi.org/10.1007/s00170-011-3380-9, 2012.
Ji, Y. J., Wang, X. B., Liu, Z. B., Wang, H. J., Jiao, L., Wang, D. Q., and Leng, S. Y.: Early milling chatter identification by improved empirical mode decomposition and multi-indicator synthetic evaluation, J. Sound Vib., 433, 138–159, https://doi.org/10.1016/j.jsv.2018.07.019, 2018.
Ji, Z. H., Guo, T. Q., Zhou, D., Lu, Z. L., and Liu, B. B.: Time-Domain Analysis of Body Freedom Chatter Based on 6DOF Equation, CMES-Comp. Model. Eng., 138, 489–508, https://doi.org/10.32604/cmes.2023.029088, 2024.
Lee, K., Hayasaka, T., and Shamoto, E.: Novel real-time monitoring method of depths of cut and runout for milling process utilizing FFT analysis of cutting torque, Precis. Eng., 81, 36–49, https://doi.org/10.1016/j.precisioneng.2023.01.010, 2023.
Lee, R. M., Yu, Y. H., Wang, C. C., Chen, T. C., and Nilaphruek, P.: Acoustic Signal Analysis by Teager-Huang Transform for Milling Chatter Recognition, Sensor. Mater., 32, 873–884, https://doi.org/10.18494/sam.2020.2671, 2020.
Li, D. D., Zhang, W. M., Li, Y. S., Xue, F., and Fleischer, J.: Chatter identification of thin-walled parts for intelligent manufacturing based on multi-signal processing, Advances in Manufacturing, 9, 22–33, https://doi.org/10.1007/s40436-020-00299-x, 2021.
Li, K., He, S. P., Li, B., Liu, H. Q., Mao, X. Y., and Shi, C. M.: A novel online chatter detection method in milling process based on multiscale entropy and gradient tree boosting, Mech. Syst. Signal Pr., 135, 106385, https://doi.org/10.1016/j.ymssp.2019.106385, 2020a.
Li, X. H., Wan, S. K., Huang, X. W., and Hong, J.: Milling chatter detection based on VMD and difference of power spectral entropy, Int. J. Adv. Manuf. Tech., 111, 2051–2063, https://doi.org/10.1007/s00170-020-06265-y, 2020b.
Liu, X. L., Wang, Z. X., Li, M. Y., Yue, C. X., Liang, S. Y., and Wang, L. H.: Feature extraction of milling chatter based on optimized variational mode decomposition and multi-scale permutation entropy, Int. J. Adv. Manuf. Tech., 114, 2849–2862, https://doi.org/10.1007/s00170-021-07027-0, 2021.
Lu, K. B., Lian, Z. S., Gu, F. S., and Liu, H. J.: Model-based chatter stability prediction and detection for the turning of a flexible workpiece, Mech. Syst. Signal Pr., 100, 814–826, https://doi.org/10.1016/j.ymssp.2017.08.022, 2018.
Qin, C., Tao, J., and Liu, C.: A novel stability prediction method for milling operations using the holistic-interpolation scheme, P. I. Mech. Eng. C-J. Mec., 233, 4463–4475, https://doi.org/10.1177/0954406218815716, 2019.
Qin, C. J., Xiao, D. Y., Tao, J. F., Yu, H. G., Jin, Y. R., Sun, Y. X., and Liu, C. L.: Concentrated velocity synchronous linear chirplet transform with application to robotic drilling chatter monitoring, Measurement, 194, 111090, https://doi.org/10.1016/j.measurement.2022.111090, 2022.
Quan, Y., Liu, C. F., Yuan, Z., and Zhou, Y.: An Intelligent Multiscale Spatiotemporal Fusion Network Model for TCM, IEEE Sens. J., 23, 6628–6637, https://doi.org/10.1109/jsen.2023.3244587, 2023.
Quan, Y., Liu, C. F., Yuan, Z., and Yan, B. L.: Hybrid Data Augmentation Combining Screening-Based MCGAN and Manual Transformation for Few-Shot Tool Wear State Recognition, IEEE Sens. J., 24, 12186–12196, https://doi.org/10.1109/jsen.2024.3372438, 2024.
Sener, B., Gudelek, M. U., Ozbayoglu, A. M., and Unver, H. O.: A novel chatter detection method for milling using deep convolution neural networks, Measurement, 182, 109689, https://doi.org/10.1016/j.measurement.2021.109689, 2021.
Shi, F., Cao, H. R., Zhang, X. W., and Chen, X. F.: A Reinforced k-Nearest Neighbors Method With Application to Chatter Identification in High-Speed Milling, IEEE T. Ind. Electron., 67, 10844–10855, https://doi.org/10.1109/tie.2019.2962465, 2020.
Susanto, A., Yamada, K., Tanaka, R., Handoko, Y. A., and Subhan, M. F.: Chatter identification in turning process based on vibration analysis using Hilbert–Huang transform, J. Mech. Eng. Sci., 14, 6856–6868, 2020.
Tao, J. F., Qin, C. J., and Liu, C. L.: A synchroextracting-based method for early chatter identification of robotic drilling process, Int. J. Adv. Manuf. Tech., 100, 273–285, https://doi.org/10.1007/s00170-018-2739-6, 2019.
Thaler, T., Potocnik, P., Bric, I., and Govekar, E.: Chatter detection in band sawing based on discriminant analysis of sound features, Appl. Acoust., 77, 114–121, https://doi.org/10.1016/j.apacoust.2012.12.004, 2014.
Tinati, M. A. and Mozaffary, B.: Comparison of the wavelet and short time Fourier transforms for spectral analysis of speech signals[C], Proceedings of the 5th WSEAS International Conference on Wavelet Analysis and Multirate Systems, 31-35, 2005.
Tran, M. Q., Liu, M. K., and Tran, Q. V.: Milling chatter detection using scalogram and deep convolutional neural network, Int. J. Adv. Manuf. Tech., 107, 1505–1516, https://doi.org/10.1007/s00170-019-04807-7, 2020.
Wang, R. Q., Niu, J. B., and Sun, Y. W.: Chatter identification in thin-wall milling using an adaptive variational mode decomposition method combined with the decision tree model, P. I. Mech. Eng. B-J. Eng., 236, 51–63, https://doi.org/10.1177/0954405420933705, 2022.
Ye, J., Feng, P. F., Xu, C., Ma, Y., and Huang, S. G.: A novel approach for chatter online monitoring using coefficient of variation in machining process, Int. J. Adv. Manuf. Tech., 96, 287–297, https://doi.org/10.1007/s00170-017-1544-y, 2018.
Yesilli, M. C., Khasawneh, F. A., and Mann, B. P.: Transfer learning for autonomous chatter detection in machining, J. Manuf. Process., 80, 1–27, https://doi.org/10.1016/j.jmapro.2022.05.037, 2022.
Zhang, Z., Liu, C. Y., Liu, X. J., and Zhang, J.: Analysis of Milling Vibration State Based on the Energy Entropy of WPD, J. Mech. Eng., 54, 57–62, 2018.
- Abstract
- Introduction
- Mathematical models
- An online chatter-monitoring method based on continuous wavelet transform and CNN-ViT
- Experimental design and analysis
- Summary
- Code and data availability
- Author contributions
- Competing interests
- Disclaimer
- Acknowledgements
- Financial support
- Review statement
- References