the Creative Commons Attribution 4.0 License.
the Creative Commons Attribution 4.0 License.
 | 18 Jan 2024
Development of pedestrian collision avoidance strategy based on the fusion of Markov and social force models
Zhengyi Yang
Haobin Jiang
Zitian Hu
In urban traffic, accurate prediction of pedestrian trajectory and advanced collision avoidance strategy can effectively reduce the collision risk between intelligent vehicles and pedestrians. In order to improve the prediction accuracy of pedestrian trajectory and the safety of collision avoidance, a longitudinal and lateral intelligent collision avoidance strategy based on pedestrian trajectory prediction is proposed. Firstly, the process of a pedestrian crossing the road is considered as a combination of free motion described by first-order Markov model and the constrained motion presented by improved social force model. The predicted pedestrian trajectory is obtained by weighted fusion of the trajectories of the two models with a multiple linear regression algorithm. Secondly, according to the predicted pedestrian trajectory and time to collision (TTC) the longitudinal and lateral collision avoidance strategy is designed. The improved artificial potential field method is used to plan the lateral collision avoidance path in real time based on the predicted pedestrian position, and a fuzzy controller is constructed to obtain the desired deceleration of the vehicle. Finally, the pedestrian motion fusion model and the longitudinal and lateral collision avoidance strategy are verified by Prescan and Simulink co-simulation. The results show that the average displacement error (ADE) and final displacement error (FDE) of pedestrian trajectory based on pedestrian motion fusion model are smaller compared with a Markov model and improved social force model, and the proposed pedestrian collision avoidance strategy can effectively achieve longitudinal and lateral collision avoidance.
- Article
(5090 KB) - Full-text XML
- BibTeX
- EndNote


In urban road scenes, pedestrians crossing roads are likely to have traffic accidents involving vehicles and usually suffer serious injuries. Reports show that, in recent years, the casualty rate of pedestrians in traffic accidents with motor vehicles is more than 50 % (Wang et al., 2019; Saito and Raksincharoensak, 2016). Therefore it is necessary to develop a pedestrian collision avoidance control strategy considering pedestrian trajectory prediction. This provides a reliable basis for intelligent vehicles to distinguish the intention and interaction of pedestrians crossing the road, and make a prejudgment to avoid potential collisions, which is of great significance to improve the safety of pedestrian crossing the road and traffic efficiency.
Recent research on pedestrian collision avoidance has mainly focused on two aspects: pedestrian trajectory prediction and collision avoidance control strategy (Narváez et al., 2019; Sighencea et al., 2021). Due to pedestrian collision risk, the accuracy of pedestrian trajectory prediction has an important impact on the safety of vehicle collision avoidance. Domestic and foreign research on pedestrian trajectory prediction is mainly classified as data-driven method or the model-based method. The data-driven method is mainly based on the improvement of the recurrent neural network to generate related variants (Eiffert et al., 2020; Song et al., 2020). Some researchers have optimized the network structure and loss function in the model to improve operational efficiency and accuracy. Hassan et al. (2021) introduced social attention mechanism and physical attention mechanism into generative confrontation networks and considered scene context information and historical trajectory information to realize trajectory prediction under the interaction of multiple intelligent bodies. Zhou et al. (2021) constructed the trajectory prediction model of a graph convolutional network to describe the interaction mode between pedestrians, so that the predicted trajectory conforms to the habits and behaviors of pedestrians. The model-based methods often generate future trajectories based on historical time series data according to the designed mathematical model (Keller and Gavrila, 2014). Compared with the data-driven method, the model-based method is more explanatory and simpler, which can describe pedestrian movement behavior in detail. Aiming at the interaction between a pedestrian and a vehicle at an intersection with mixed traffic flow, Zhang et al. (2020) established a pedestrian decision-making model by using logic regression and proposed an improved social force model to predict the trajectories of pedestrian. Based on the characteristics of Markov, Vasquez et al. (2009) proposed a hidden Markov model to predict trajectories of a pedestrian and a vehicle in the current environment by combining machine learning and semantic information. Wang et al. (2018) established a fuzzy logic system to estimate the transition probability between the pedestrian state and the motion model, and used a Kalman filter to predict the trajectory of pedestrian in a short time. Most of the studies mentioned above focus on intersection scenarios with signal lights and crosswalks, as well as the improvement of the basic model. However, the existing pedestrian motion models are not comprehensive enough to analyze interactive information and cannot be directly applied, which requires detailed modeling in combination with actual scenes to improve prediction accuracy. In terms of pedestrian collision avoidance control strategy, there are two main ways of collision avoidance for intelligent vehicles: longitudinal collision avoidance and lateral collision avoidance (Zhang et al., 2022; Gao et al., 2021). When there is collision risk, the collision avoidance system actively sends warning signals to the driver and controls the vehicle to brake or steer according to the risk indicators to avoid pedestrian injury. More and more researchers are focusing on how to improve the effectiveness and rationality of collision avoidance strategies. Based on velocity obstacle theory, Wu et al. (2019) proposed a real-time dynamic path planning collision avoidance method for pedestrians crossing the road in the environment of cooperative vehicle–infrastructure system to reduce the pedestrian collision risk. Chen and Zhang (2022) proposed a data-driven fusion model of attention mechanism long short-term memory (LSTM) network and modified social force model for pedestrian path prediction. According to the pedestrian safety area, the front wheel angle was calculated in real time to plan the collision avoidance path and tracked it based on model predictive control (MPC) theory. Yang et al. (2019) presented a hierarchical autonomous emergency braking pedestrian system, which built the upper-layer controller of a fuzzy neural network by introducing a genetic algorithm, and designed the lower-layer controller based on proportional–integral–derivative (PID) theory. Considering that road users were affected by perceived location and prediction errors, Themann et al. (2015) put forward a collision avoidance system that optimized the longitudinal and lateral trajectory. Most of the current studies only consider single lateral or longitudinal collision avoidance and few studies refer to a comprehensive longitudinal and lateral collision avoidance strategy according to the pedestrian motion state, which makes the pedestrian collision avoidance strategies less applicable and reliable.
On the basis of the previous analysis, a pedestrian collision avoidance control strategy is proposed in this paper based on pedestrian trajectory prediction in the scene of a pedestrian crossing the road without signal lights or crosswalks. Firstly, the pedestrian motion model based on the fusion of a Markov model and improved social force model is constructed in which the Markov model is applied to simulate random walking of a pedestrian in a free state and the improved social force model is established to represent the interaction between a pedestrian and the surrounding environment. Secondly, the parameters of pedestrian motion fusion model are calibrated based on the maximum likelihood estimation method. The pedestrian trajectories predicted by the two models are fused by a multiple linear regression algorithm. Then the risk of pedestrian–vehicle collision is evaluated based on the predicted pedestrian trajectory. Considering predicted pedestrian location and time to collision (TTC) as well as the road scene, a longitudinal and lateral collision avoidance strategy is designed, which can actively conduct lateral avoidance or longitudinal braking. With respect to lateral collision avoidance, the improved artificial potential field method is used to plan the collision avoidance path for the intelligent vehicle. In the aspect of longitudinal collision avoidance, the desired deceleration of the vehicle is obtained by a fuzzy control method. Finally, the accuracy of the predicted pedestrian trajectory based on the pedestrian motion fusion model and the feasibility of collision avoidance control strategy are verified by Prescan and MATLAB co-simulation.
2.1 The first-order Markov model
Pedestrians usually tend to walk freely and attempt to identify a destination without disturbance from the external environment. During the procedure, the speed and direction of each step would vary with the state of the previous moment. Therefore, a first-order Markov chain is selected to describe the randomness of the pedestrian movement process (Yuan et al., 2023). According to the principle of Markov, the position and speed of the pedestrian in the following step can be determined by the current position and speed. The coordinate system in this paper is the global coordinate system, in which the x axis represents the longitudinal direction along the road, and the y axis represents the lateral direction crossing the road. The pedestrian movement is resolved into x and y axis components, and the pedestrian state is described as
where Stateped is the motion state of the pedestrian, vx−p(t) and vy−p(t)represent the speed of the pedestrian in the x and y axis directions, respectively, xm_p(t) and ym_p(t) are the position of the pedestrian in the x and y axis directions.
The speed and position of the pedestrian in the x axis direction are shown as below:
where indicates the speed of the pedestrian at the time of t+Δt in the x axis direction, Δvx−p is the speed increment at t in the x axis direction, kx represents the coefficient of speed increment in the x axis direction, indicates the average speed in the x axis direction, and εx expresses the random fluctuation in pedestrian speed in the x axis direction, which is subject to Gaussian distribution.
Similarly, the speed and position of the pedestrian in the y axis direction are represented by following expressions:
where indicates the speed of the pedestrian at t+Δt in the y axis direction, Δvy−p is the increment of speed at t in the y axis direction, ky represents the coefficient of speed increment in the y axis direction, indicates the average speed in the y axis direction, and εy expresses the random fluctuation in pedestrian speed in the y axis direction, which also follows Gaussian distribution.
Thus, the pedestrian position at t moment can be predicted by the Markov model:
2.2 Improved social force model
According to a social force model (Wu et al., 2022), the moving pedestrian is considered as a particle that confirms to the law of mechanics, and the relationship between the pedestrian and the surrounding traffic participants can be expressed by mechanics equations. The classical social force model includes three forces: pedestrian self-driving force, pedestrian interaction force, and interaction force with boundary or obstacle. Based on the basic theory, the social force model in this paper is improved for applications in urban scenes without crosswalks or signal lights. The resultant force of the pedestrian is shown in Fig. 1, and the improved social force model (I-SFM) is built as follows:
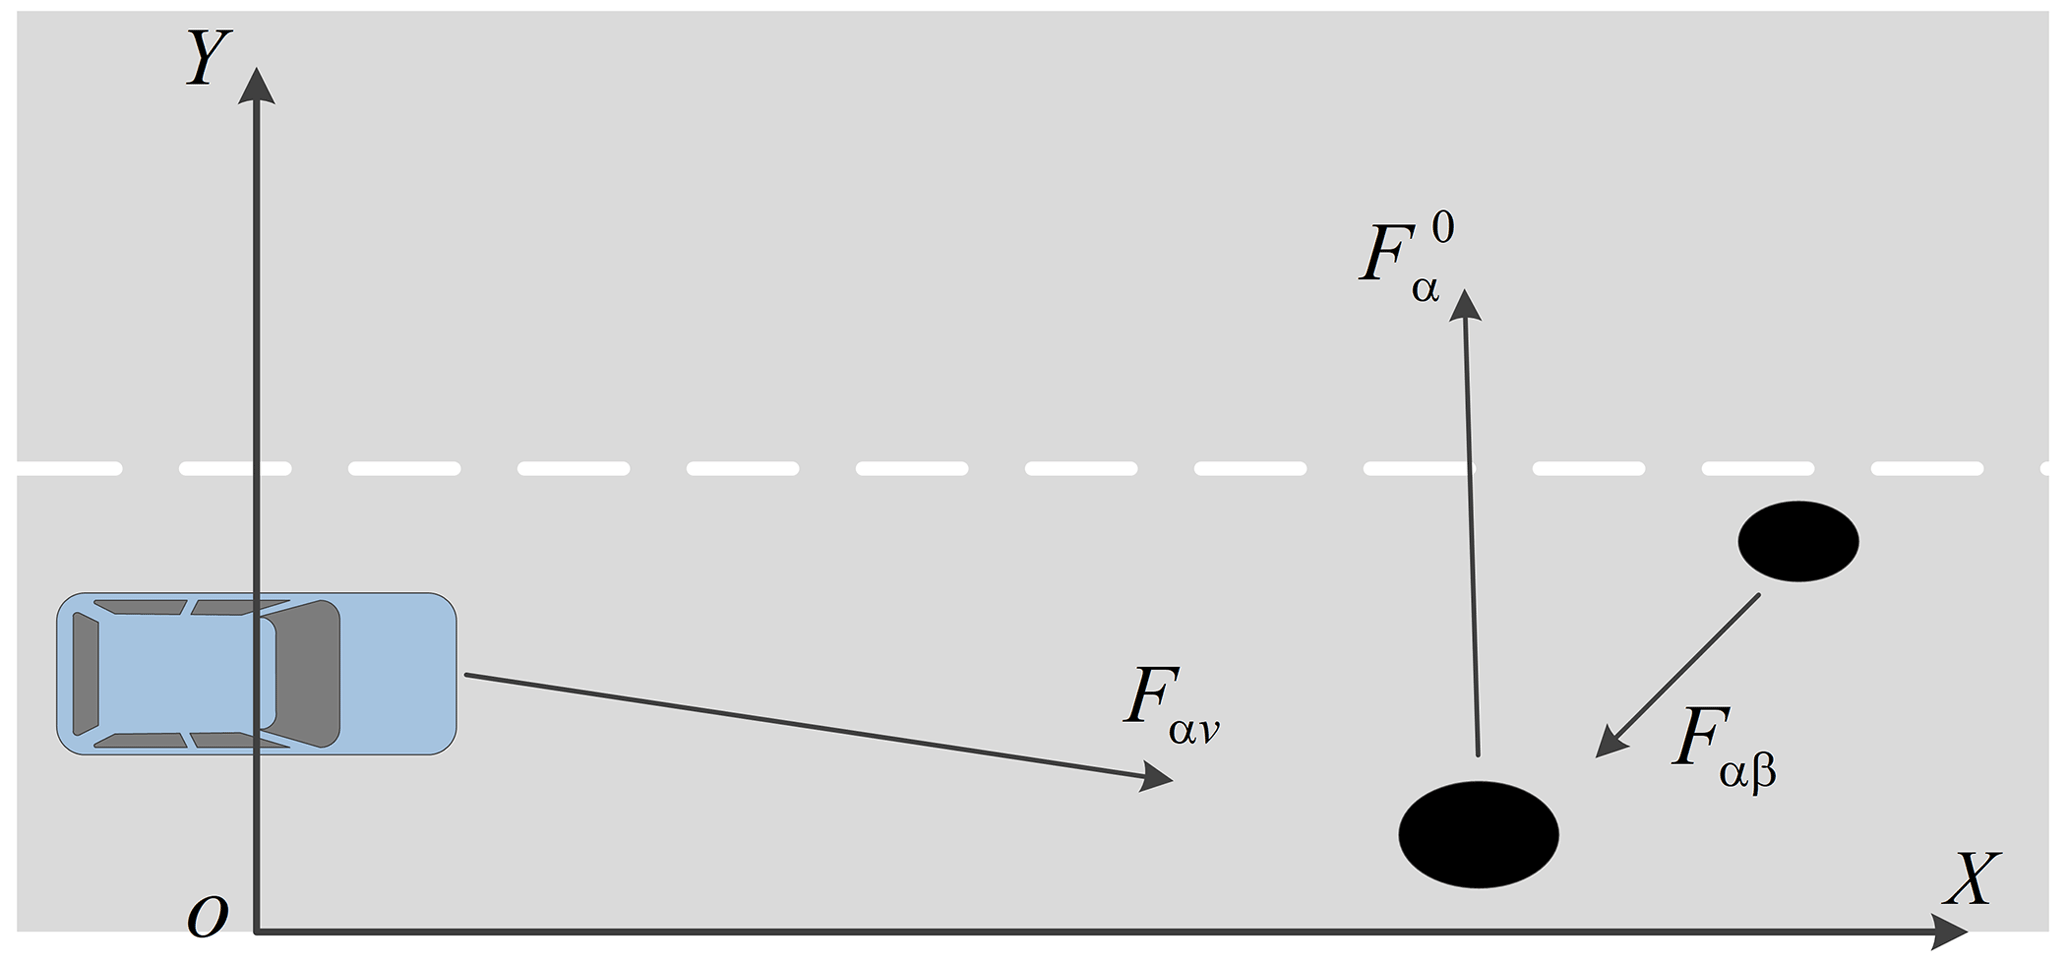
In Eqs. (9)–(12), Fα(t) is the resultant force on the pedestrian, is the self-driving force on the pedestrian toward the target point, Fαv is the interaction force of the vehicle on the pedestrian, Fαβ is the interaction force of the surrounding pedestrians, ps(t) is the predicted pedestrian position at t, ps(t+Δt) is the predicted pedestrian at t+Δt, v(t) is the velocity of the pedestrian at the moment of t, Δt is the time step, and m is the mass of the pedestrian.
A pedestrian crossing the road is attracted to their destination and will take the shortest path to reach it at the desired speed. When the surrounding environment interferes in the pedestrian crossing process, the deviation between the actual speed and the desired speed occurs and the pedestrian's walking direction varies, which causes the self-driving force to automatically adjust the current speed to the desired speed. The expression of self-driving force is presented as follows:
where is the desired speed at t (m s−1), is the desired speed direction, vα(t) is the actual speed (m s−1), τ indicates the relaxation time, and mα is the mass of pedestrian α (kg).
Usually the crossing behavior of pedestrian is influenced by surrounding pedestrians. When surrounding pedestrians are closer to the pedestrian, the pedestrian will avoid collision, stop, and so on. In order to meet their own motion space, the virtual repulsive force will act on the pedestrian to maintain a certain distance from surrounding pedestrians. According to the classical social force model, the repulsive force between pedestrian α and pedestrian β is expressed as follows:
where is the psychological repulsive force on pedestrian α affected by the surrounding pedestrian β, is the physical repulsive force on pedestrian α, Aα is the strength coefficient of repulsive force (N), Bα is the distance coefficient of repulsive force (m), rαβ is the sum of virtual radiuses of pedestrian α and pedestrian β (m), dαβ is the distance between pedestrian α and pedestrian β (m), nαβ is the direction in which pedestrian β points to pedestrian α, k is the elastic coefficient of the human body (kg s−2), which describes the energy transmission during the collision process between pedestrians, κ is the sliding friction coefficient of bodies (kg (m s)−1) which describes the resistance when pedestrians slide with each other, is the tangential relative velocity (m s−1), and tαβ is the tangent direction vector perpendicular to nαβ.
A pedestrian crossing the road will not only be disturbed by surrounding pedestrians but also by conflict with vehicles. The pedestrian usually tries their best to avoid collision with approaching vehicles. Since the speed of vehicles is much faster than that of the pedestrian, an elliptical potential field (Zeng et al., 2014) that describes the difference in speed is used to represent the repulsive force of the approaching vehicle on the pedestrian. The repulsive force is shown as follows:
with
where Av is the strength coefficient of the interaction force between the vehicle and the pedestrian (N), Bv is the distance coefficient of interaction force between the vehicle and the pedestrian (m), dαv is the distance vector between the pedestrian and the vehicle, vv is the speed of the vehicle (m s−1), vα is the speed of the pedestrian α (m s−1), nαv is unit vector of the vehicle pointing to the pedestrian, and Δt is the time step (s).
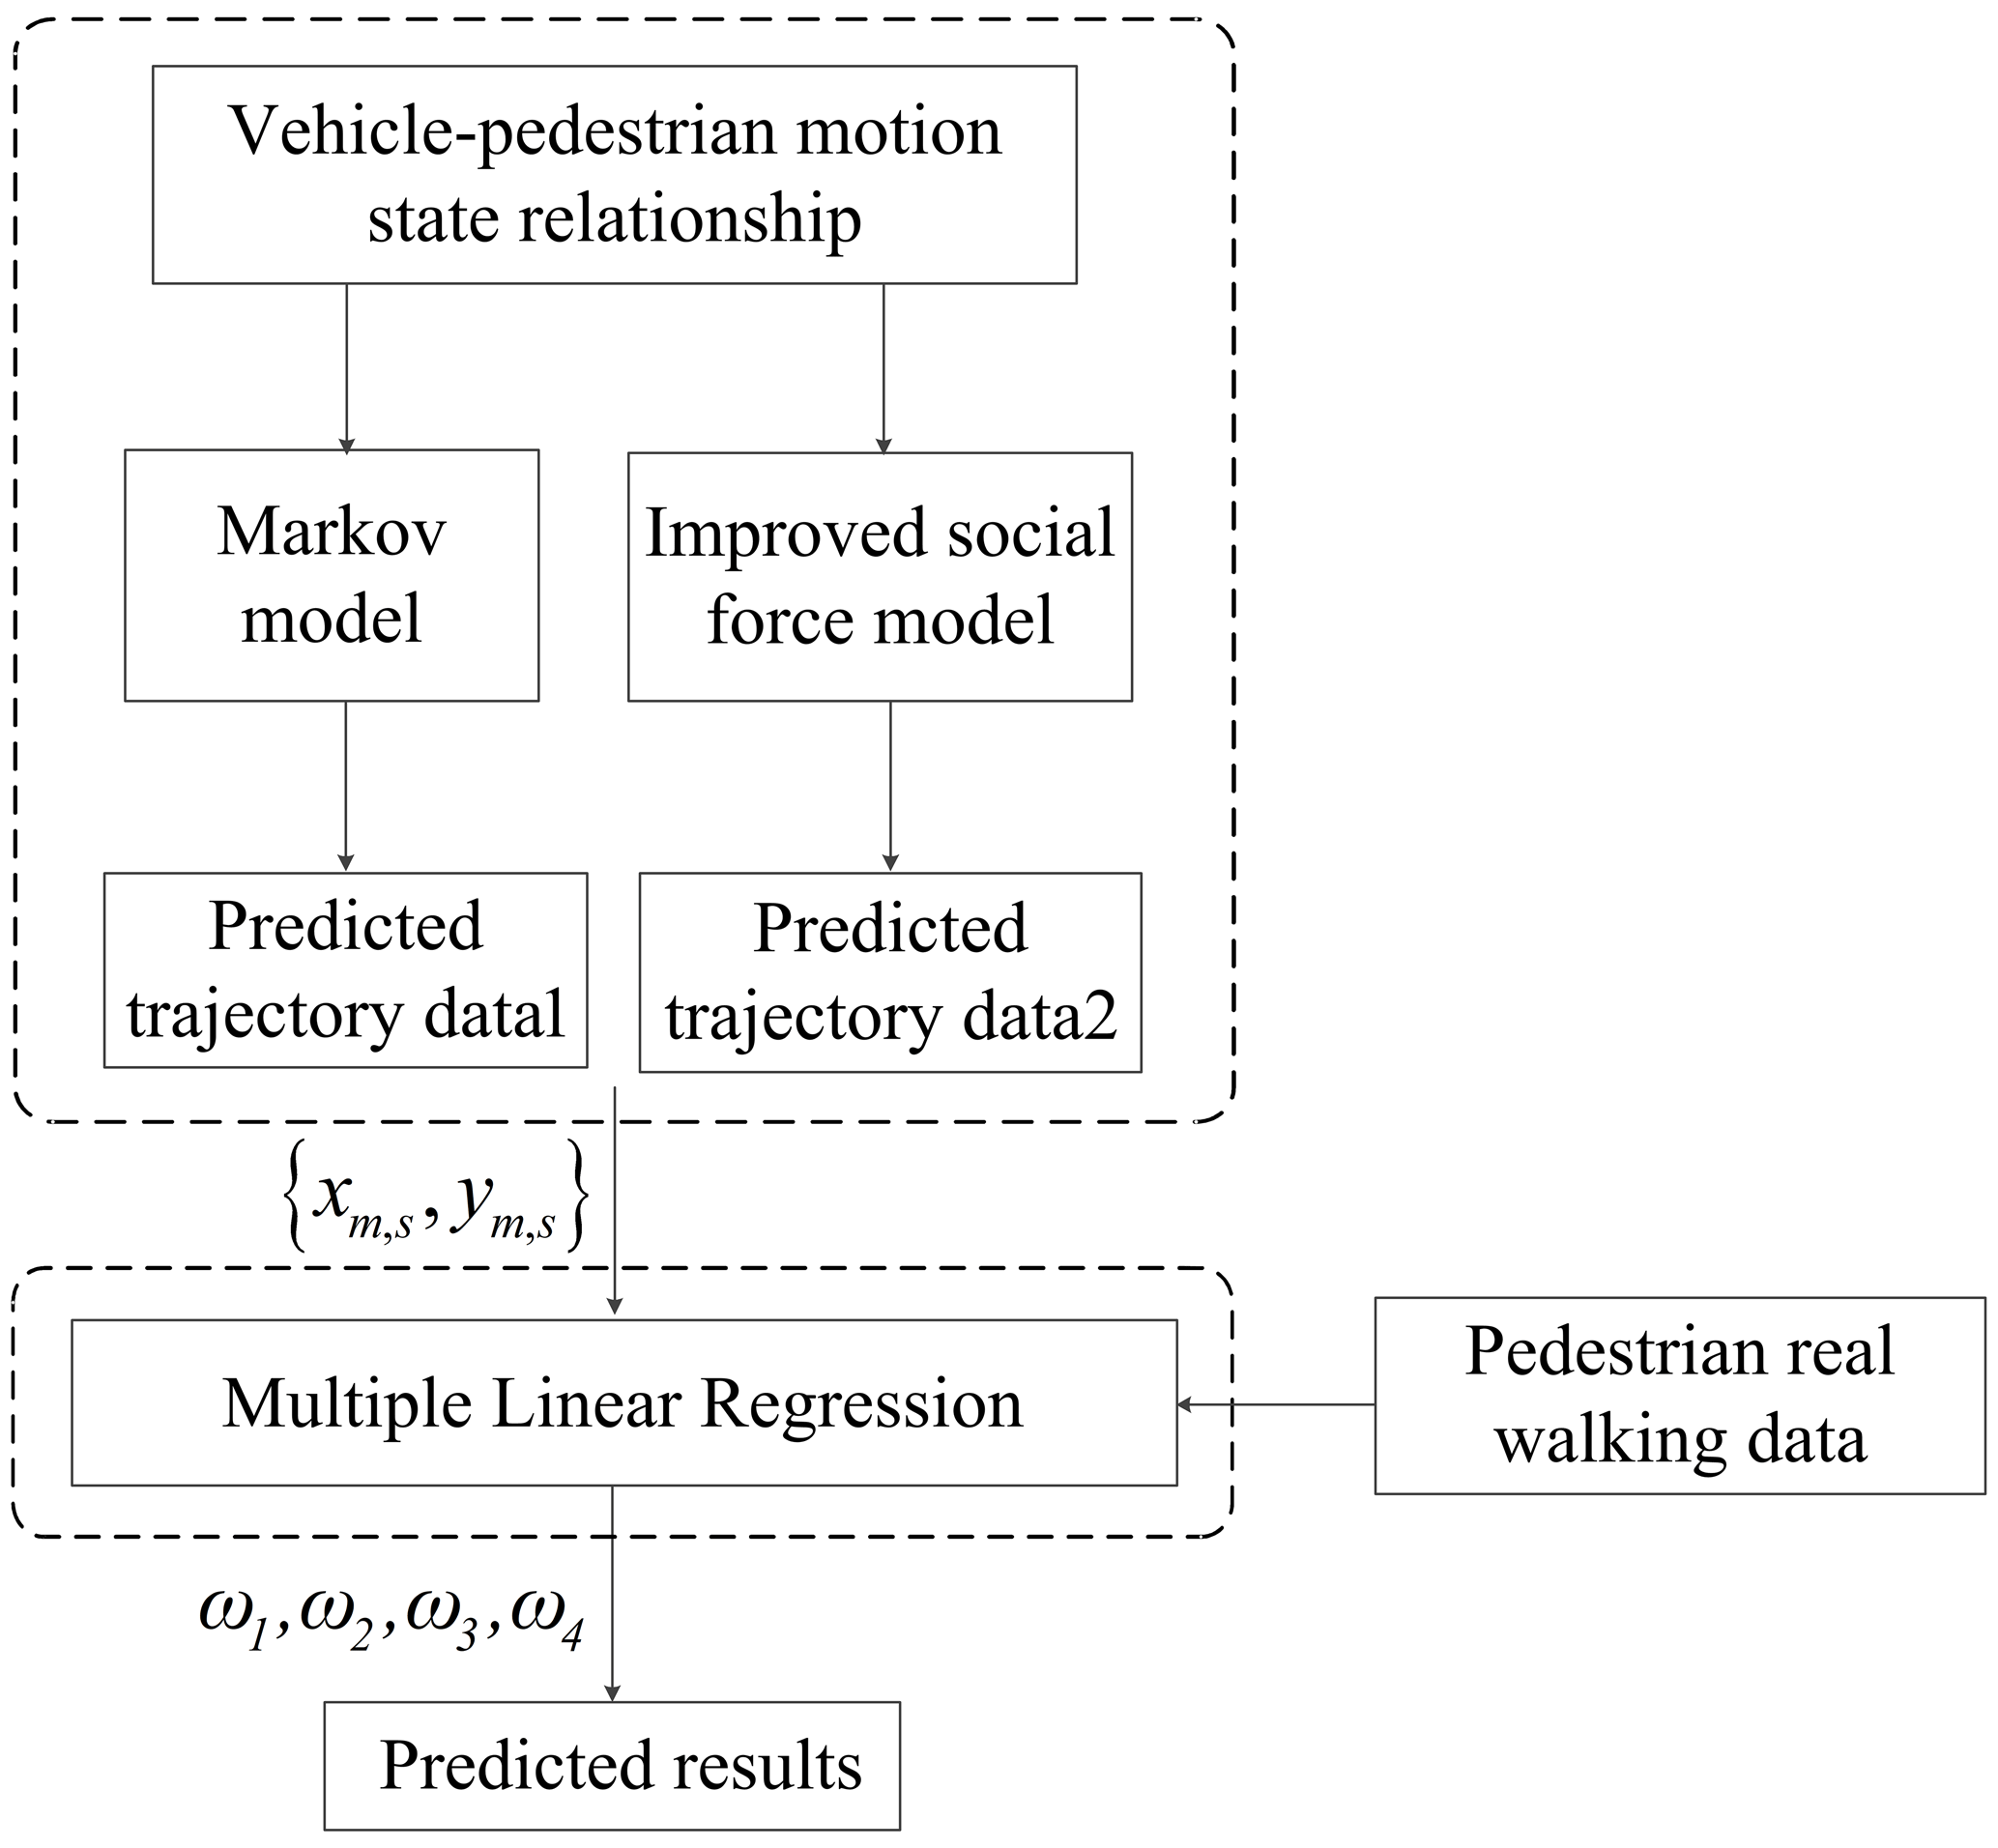
2.3 Pedestrian motion fusion model
When a pedestrian crosses the road, the uncertainty of the environment plays an important role in pedestrian motion. The Markov model can better predict the random and free movement of pedestrians without interference, while the social force model can better predict the interfered motion by the surrounding environment. To combine the advantages of the Markov model and social force model, a pedestrian motion fusion model is constructed to reflect the characteristics of pedestrian motion, as shown in Fig. 2.
- 1.
In the first layer, the Markov model and the improved social force model are used to calculate the speed and position of the pedestrian at each time step respectively according to the conditions of the initial moment and obtain the pedestrian trajectory in future time through iteration.
- 2.
The predicted pedestrian trajectory datasets are obtained by the Markov model and improved social force model and are recorded as , , which correspond to a group of coordinates of the predicted positions. The longitudinal and lateral coordinates of each group are extracted and recorded as xm,s and ym,s, and a new dataset is taken as the input of the second layer model. A multiple linear regression (Zhang et al., 2017; Gu et al., 2021) algorithm is used to fit the relationship between the predicted results and the real data. The multiple linear regression model is shown in Eqs. (20)–(22):
where Y is the dependent variable, X is the independent variable, is the regression coefficient, and ε is the random error.
with
where px and py represent the results of regression calculation for the longitudinal and lateral positions, xm−p and xs−p represent the longitudinal positions predicted by the Markov pedestrian model and improved social force model, respectively, ym−p and ys−p express the lateral positions predicted by the Markov pedestrian model and the improved social force model, respectively, ω1 and ω2 are the weight coefficients of the longitudinal position predicted by the Markov pedestrian model and the improved social force model, respectively, ω3 and ω4 are the weight coefficients of the lateral position, respectively, and bx and by represent random error.
- 3.
The optimization problem is established by defining the following loss function, which can be solved by the least squares method (Lenth, 2016) to obtain the weight coefficients ω1, ω2, ω3, and ω4.
where and represent the loss functions of the longitudinal and lateral position, respectively, pxi and pyi represent the real longitudinal and lateral positions, respectively, and represent the predicted longitudinal and lateral positions, respectively, , , , and represent the optimal solution of ω1,2, bx, ω3,4, by.
- 4.
Since the calculated weights are positively correlated with the performance of each model, the weighted fusion formula is obtained by multiplying the weights with the predictions of each model.
In Eq. (25), p is the pedestrian position at t time obtained by a fusion of the Markov model and improved social force model.
3.1 Pedestrian trajectory data collection
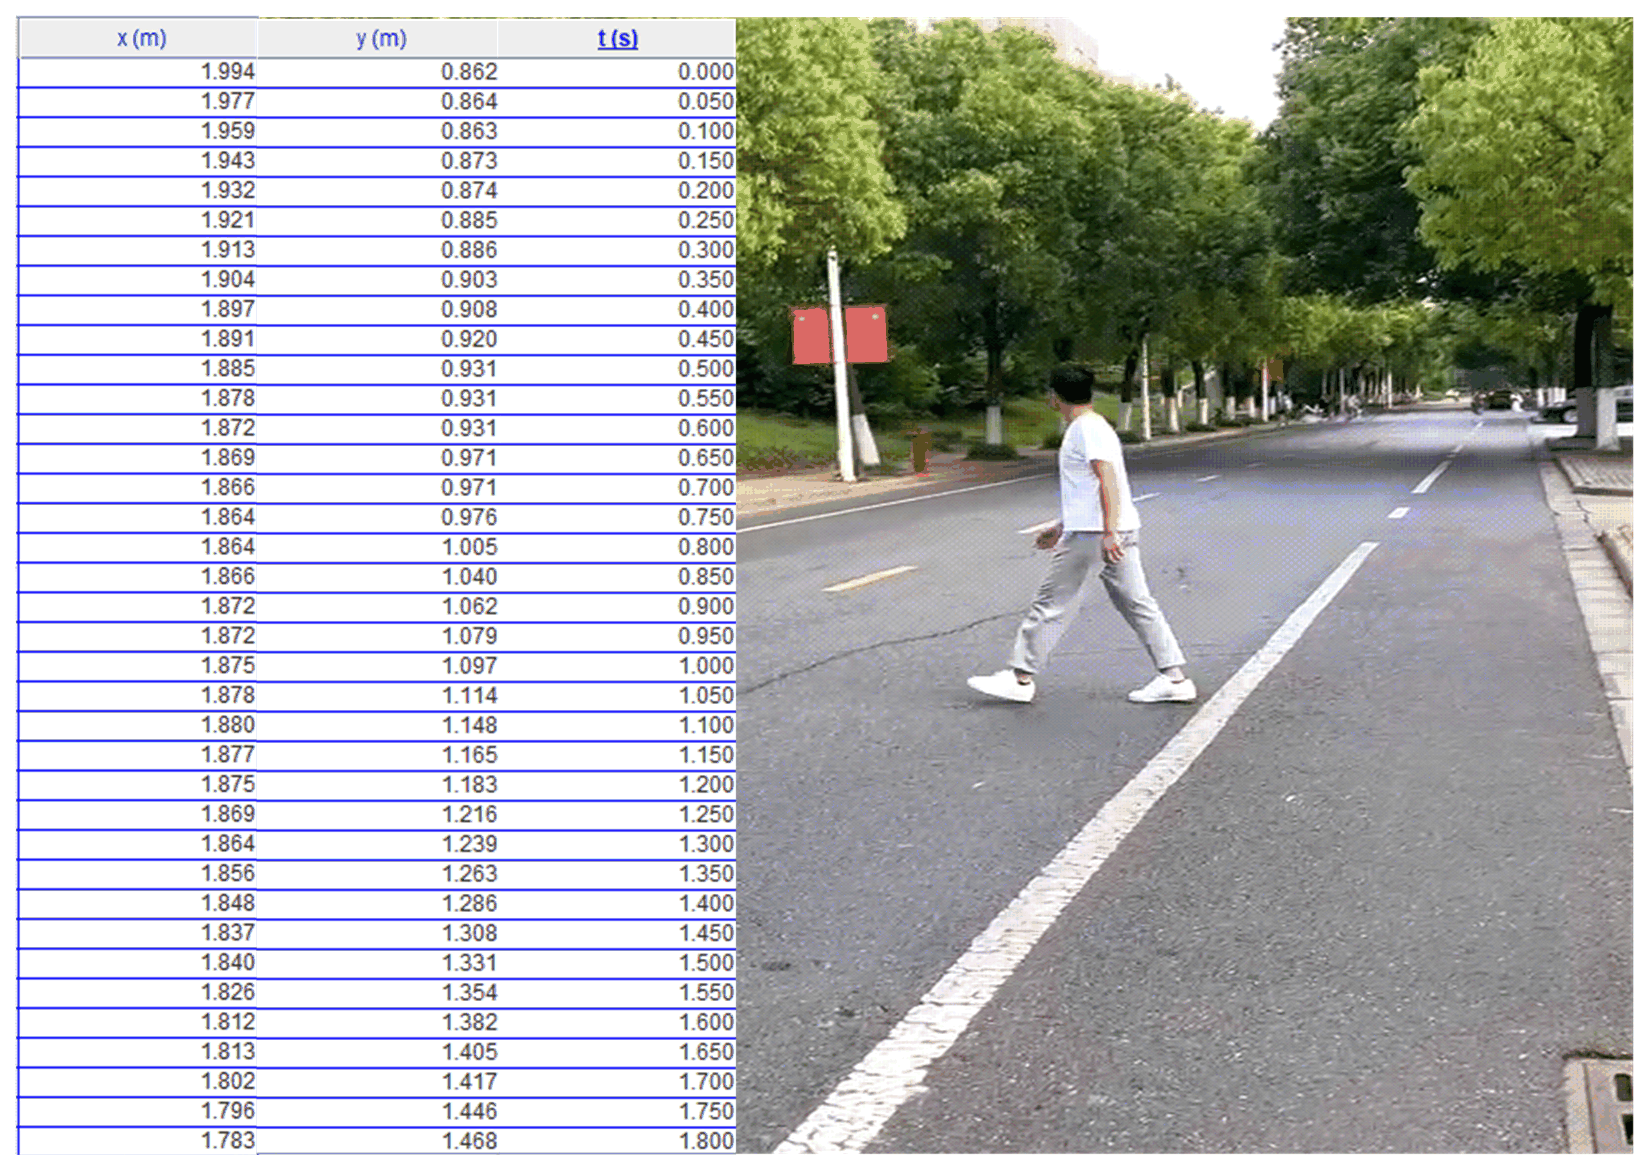
In order to calibrate parameters of the Markov model and improved social force model, and to verify the performance of the pedestrian motion fusion model established in this paper, real pedestrian walking data are collected. The data collection scene is a mixed pedestrian–vehicle road without signal lights or crosswalks. The test section is two-lane road with a width of 11 m. The test time is 08:30–10:30 and 14:30–16:30 LT (local time).
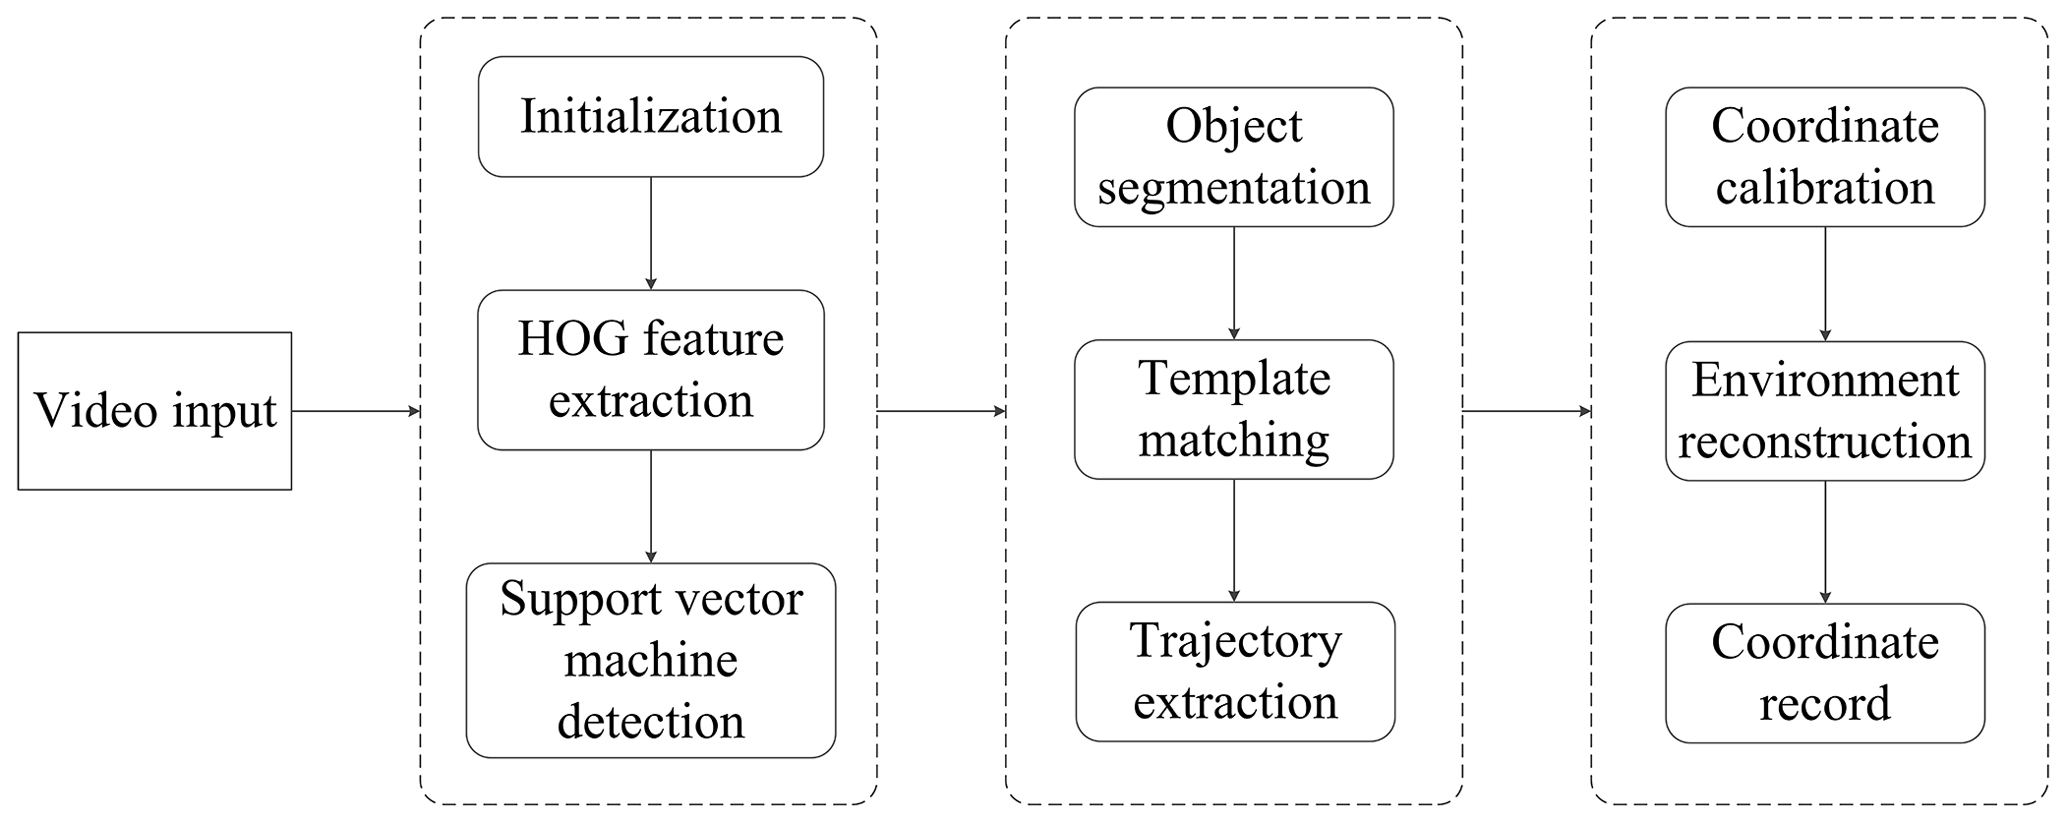
The main test device is an HD camera to collect the image data of the pedestrian crossing the road. The process of data collection and the results are shown in Figs. 3 and 4. The HD camera takes a video of the pedestrian crossing the road and then extract continuous frame images. The pedestrian in the frame image is detected by histogram of oriented gradients (HOG) and support vector machines (SVM), and the target position of each frame in the continuous image sequence is tracked by a Kalman filter. Finally, the coordinates of the position in the image coordinate system are converted into ground coordinates by a perspective transformation matrix method (Barone et al., 2020), so as to filter and analyze the real data.
3.2 Model parameters calibration
The parameter value in the model established in this paper determines the accuracy of the model. The measurable parameters can be obtained directly from real data, while the unmeasurable parameters need to be calculated by statistical methods. In this paper, the unmeasurable parameters are calibrated by the maximum likelihood estimation method (Ko et al., 2013; Mirabella et al., 2023). The measurable parameters include the following: pedestrian mass is (kg), the radius of pedestrian is (m), and the expected speed of the pedestrian is (m s−1).
Assuming that the parameter set to be calibrated in the model is , Δdα(tk|θ) is the distance vector from the pedestrian position Pα(tk) at the current moment to the pedestrian position Pα(tk+1) at the next moment, and it follows a normal distribution with a mean of μ and standard deviation of σ in the X and Y directions. The likelihood function L(θ) with respect to θ is as follows:
with
Taking the logarithm on both sides of Eq. (26), Eq. (30) can be obtained.
When maximum ln L(θ) is obtained by solving the maximum likelihood function, parameter set θ in L(θ) is taken as the parameter value of the pedestrian motion model.
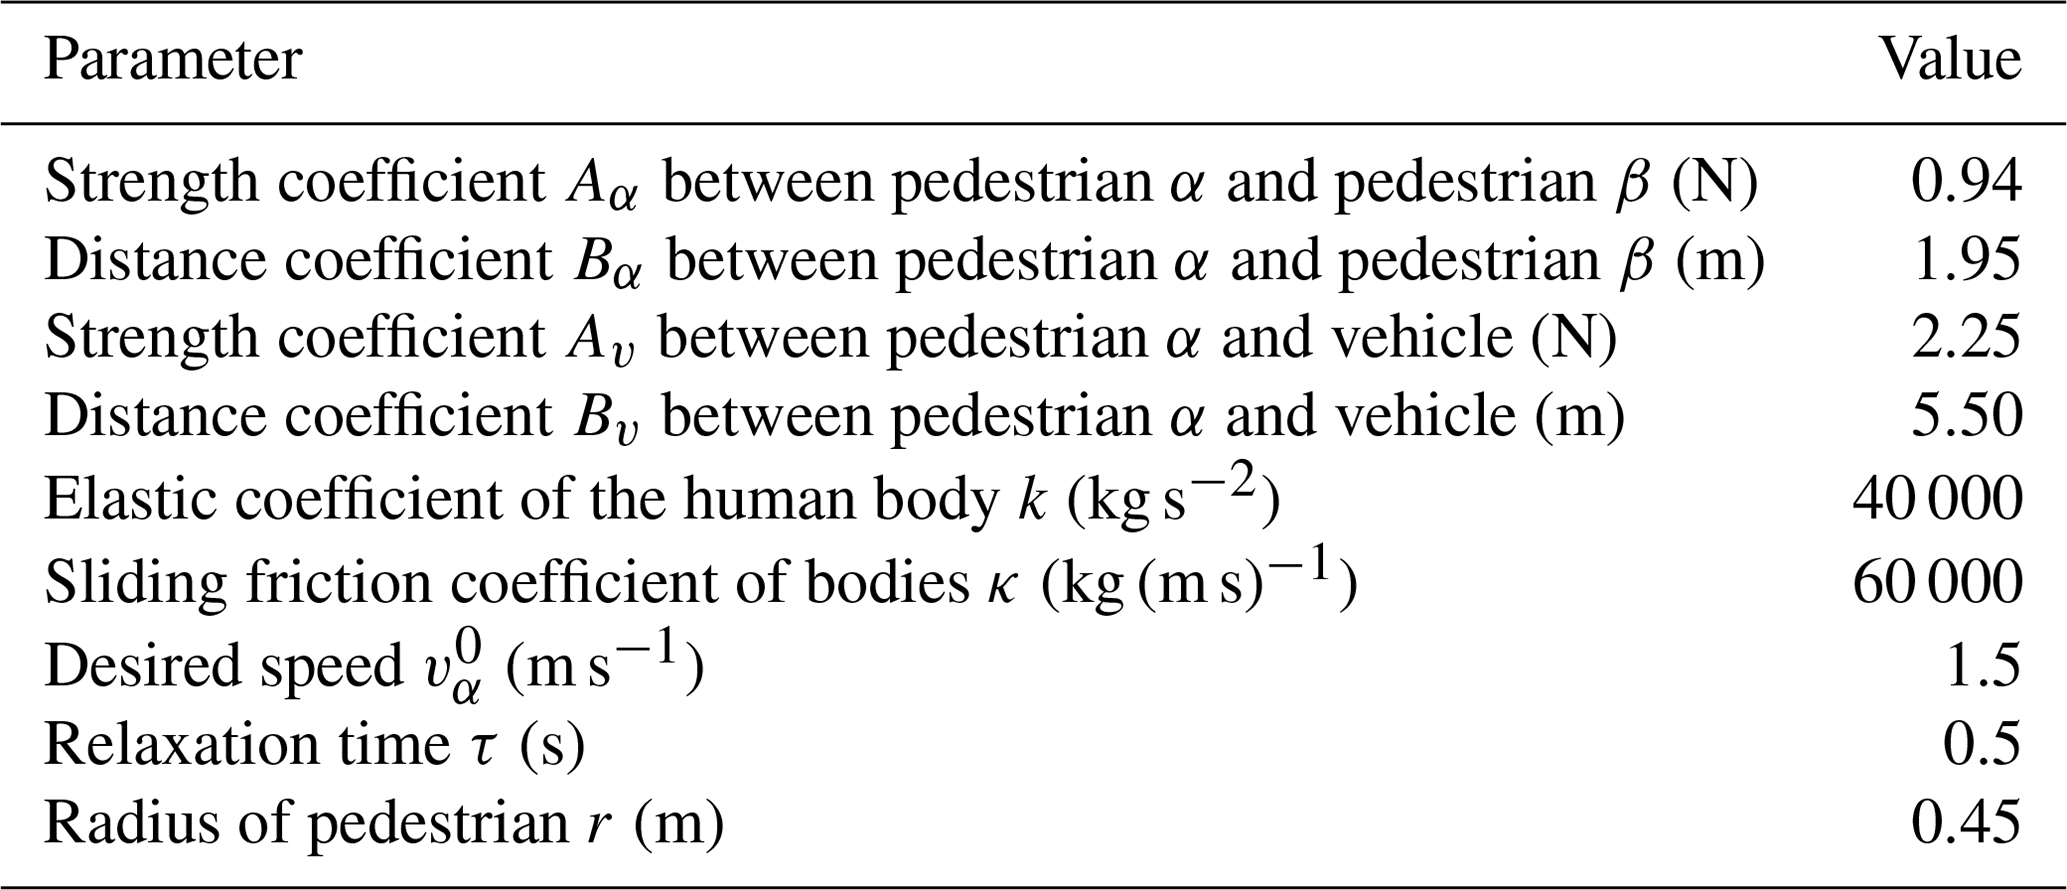
After estimation and analysis, the specific calibration results in pedestrian model are shown in Table 1.
4.1 Collision avoidance strategy
To ensure the comfort and safety of vehicle collision avoidance, a longitudinal and lateral pedestrian collision avoidance strategy is designed considering the predicted trajectory of a pedestrian crossing the road. The collision avoidance strategy is as shown in Fig. 5.
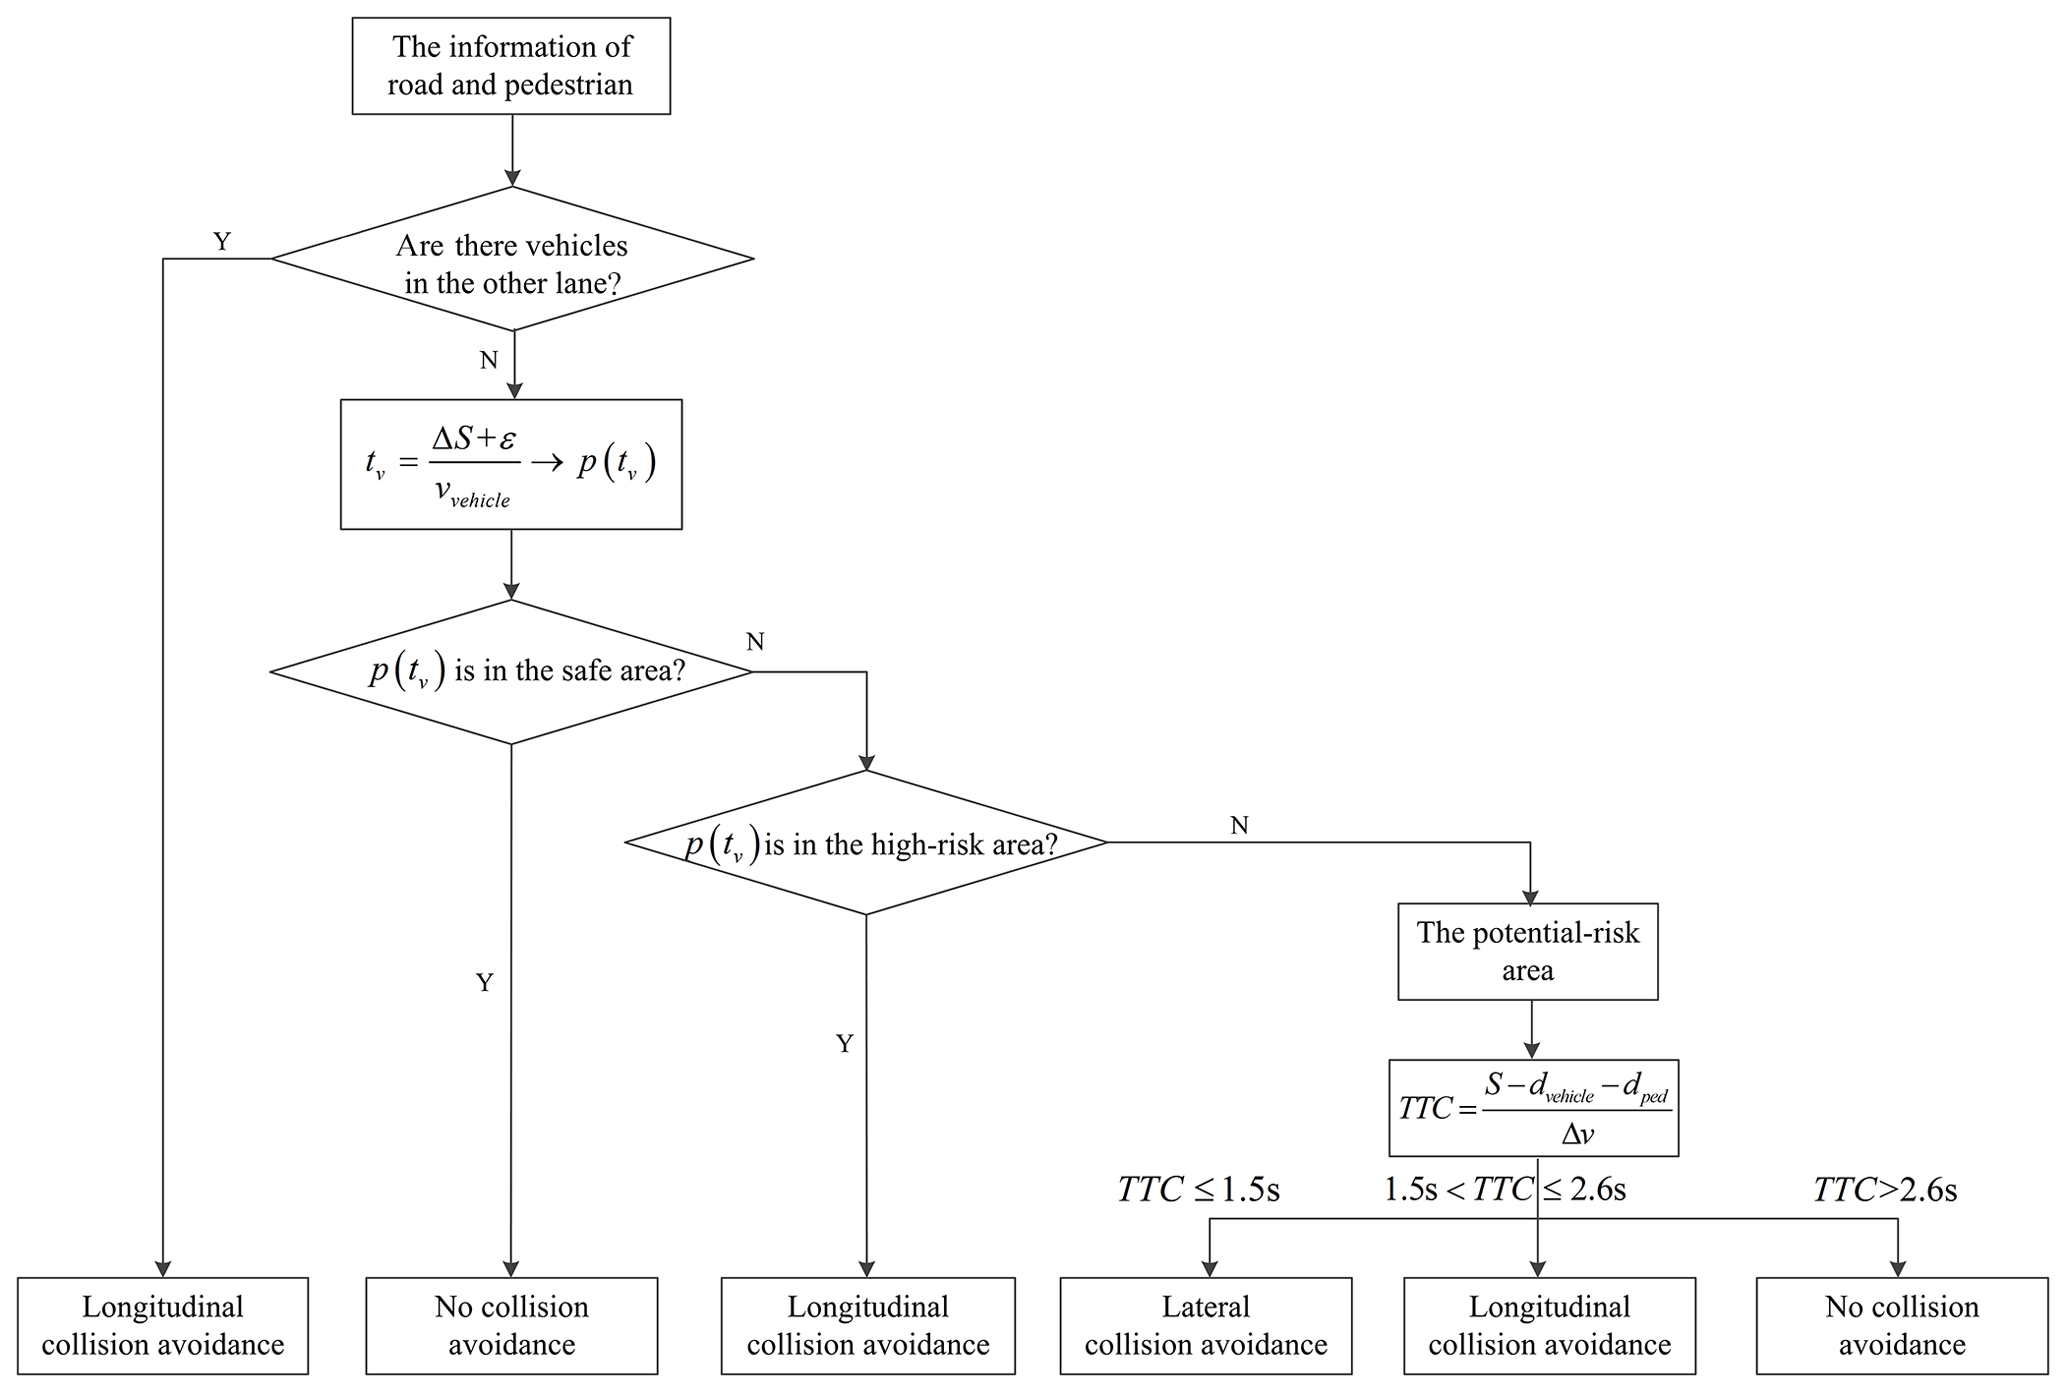
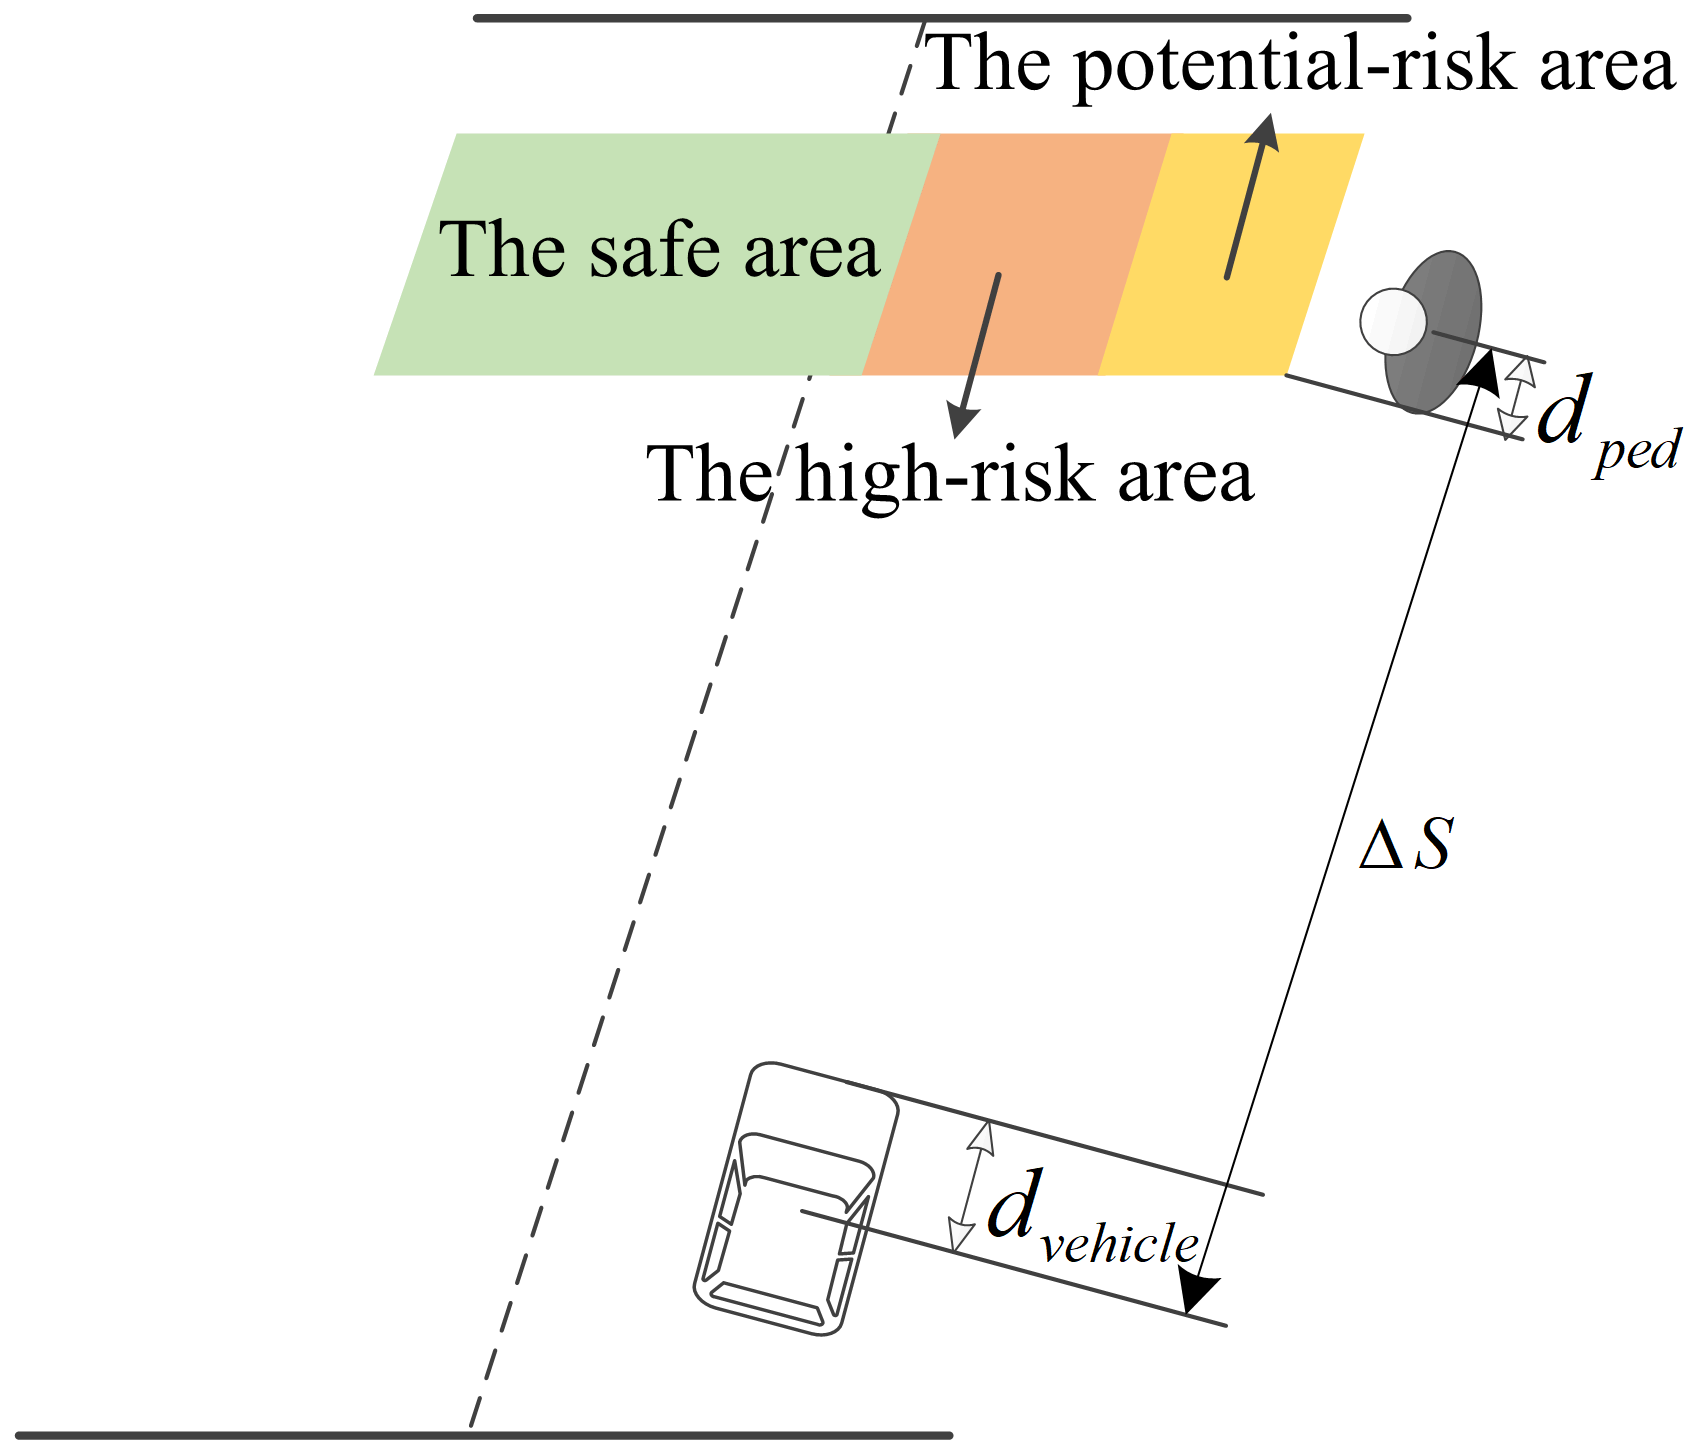
In Fig. 5, the road and traffic information is perceived by sensors of the vehicle. If there are vehicles in the other lane, the lateral collision avoidance will pose a threat to the traffic participant on the road, so the longitudinal collision avoidance is implemented to ensure enough safety of the pedestrian in this lane and vehicles in other lanes. It is known that the position of the pedestrian crossing the road influences vehicle collision avoidance decision-making. The pedestrian crossing area is divided into a high-risk area in front of the vehicle, a potential-risk area from the right edge of the vehicle to the road edge, and a safe area, as shown in Fig. 6. The way of collision avoidance is adopted according to the predicted pedestrian location in high-risk or potential-risk areas.
When the pedestrian is in front of the vehicle, there is a large collision risk. The risk level is determined by the longitudinal collision avoidance time of vehicle which is relative to the vehicle speed. The longitudinal collision avoidance time is defined as
where vvehicle is the speed of vehicle, ΔS is the longitudinal relative distance between the vehicle and the pedestrian, and ε is the longitudinal position fluctuation of the pedestrian.
According to the pedestrian motion fusion model described in Sect. 2, the predicted pedestrian trajectory can be obtained. Substituting Eq. (32) into Eq. (25), the predicted position of the pedestrian in the longitudinal collision avoidance time is calculated as shown in Eq. (33).
When the predicted pedestrian position is in the high-risk area, longitudinal collision avoidance is selected. When it is in the potential-risk area, longitudinal collision avoidance or lateral collision avoidance is adopted according to corresponding TTC thresholds. In this paper, 2.6 and 1.5 s are set as TTC thresholds for longitudinal collision avoidance and lateral collision avoidance (Hajiloo et al., 2020; Fildes et al., 2015). When TTC >2.6 s, the driving environment is safe and the vehicle drives normally. When 1.5 s < TTC ≤2.6 s, there is a collision risk between the vehicle and the pedestrian, so longitudinal collision avoidance strategy is adopted. When TTC ≤1.5 s, the longitudinal collision avoidance is unable to avoid risk and the lateral collision avoidance method is applied. The expression of TTC is shown as follows:
where ΔS is the distance from centroid of the vehicle to the pedestrian, dvehicle is the distance from centroid to front edge of the vehicle, dped is the pedestrian radius, and Δv is the relative longitudinal speed between the vehicle and the pedestrian.
4.2 Lateral collision avoidance path planning
The artificial potential field algorithm proposed by Khatib (1986) has been widely used in obstacle avoidance path planning. In this paper, considering that the longitudinal safety distance for intelligent vehicle is much longer than the lateral distance in the process of lateral obstacle avoidance as well as the structural parameters of the road, an improved artificial potential field is constructed for lateral collision avoidance path planning. The artificial potential field includes the gravitational potential field of the road centerline, the repulsive potential field of the road boundary, and the elliptical obstacle repulsion potential field. Combining the updated pedestrian position predicted by the pedestrian motion fusion model in the planning period, the position of the vehicle in the process of lateral obstacle avoidance can be obtained by solving the artificial potential field force balance equation to realize the dynamic path planning of the vehicle.
4.2.1 Gravitational potential field of road centerline
With respect to the traditional artificial potential field method, the point is usually taken as the gravitational target. The vehicle usually drives along the road centerline under conditions of normal driving. Therefore, the gravitational potential field of the road centerline is constructed with lane centerline as the gravitational target.
where Uatt(X) is the gravitational potential field of road centerline, Kalt is the gravitational potential field gain coefficient, y is the lateral coordinate of the vehicle, yroad,i is the lateral coordinate of ith lane centerline.
4.2.2 Repulsive potential field of road boundary
The repulsive force potential field of the road boundary is constructed to prevent the vehicle from leaving the road. The repulsion force of the road boundary on the vehicle is determined by the distance between the vehicle and the road boundary:
where Uroad is the repulsive potential field of road boundary, yboundary,i is the coordinate of ith road boundary, Kroad is the road boundary gain coefficient, and W is width of the vehicle.
4.2.3 Repulsive potential field of obstacle
Regarding the traditional artificial potential field method, the obstacle repulsive force field is usually a circular virtual field with the obstacle and the influence distance as the center and the radius, respectively. During lateral collision avoidance, the longitudinal speed of the vehicle is much greater than the lateral speed, and the planned collision avoidance path should satisfy the condition that the longitudinal distance is greater than the lateral distance (Ji et al., 2017). Therefore an elliptical repulsive potential field is established as follows rather than circular repulsive potential field.
where Uobs is the elliptical obstacle repulsion potential field, Kobs is the weight coefficient of obstacle repulsion potential field, (x,y) are the coordinates of the vehicle, (xobs,yobs) are the coordinates of the obstacle, σx and σy are the distance factors of the obstacle acting on the vehicle, σy is the sum of σx and the minimum longitudinal safe distance, and σx is the sum of the pedestrian radius, the half width of the vehicle, and the safety distance threshold.
4.3 Longitudinal collision avoidance deceleration planning
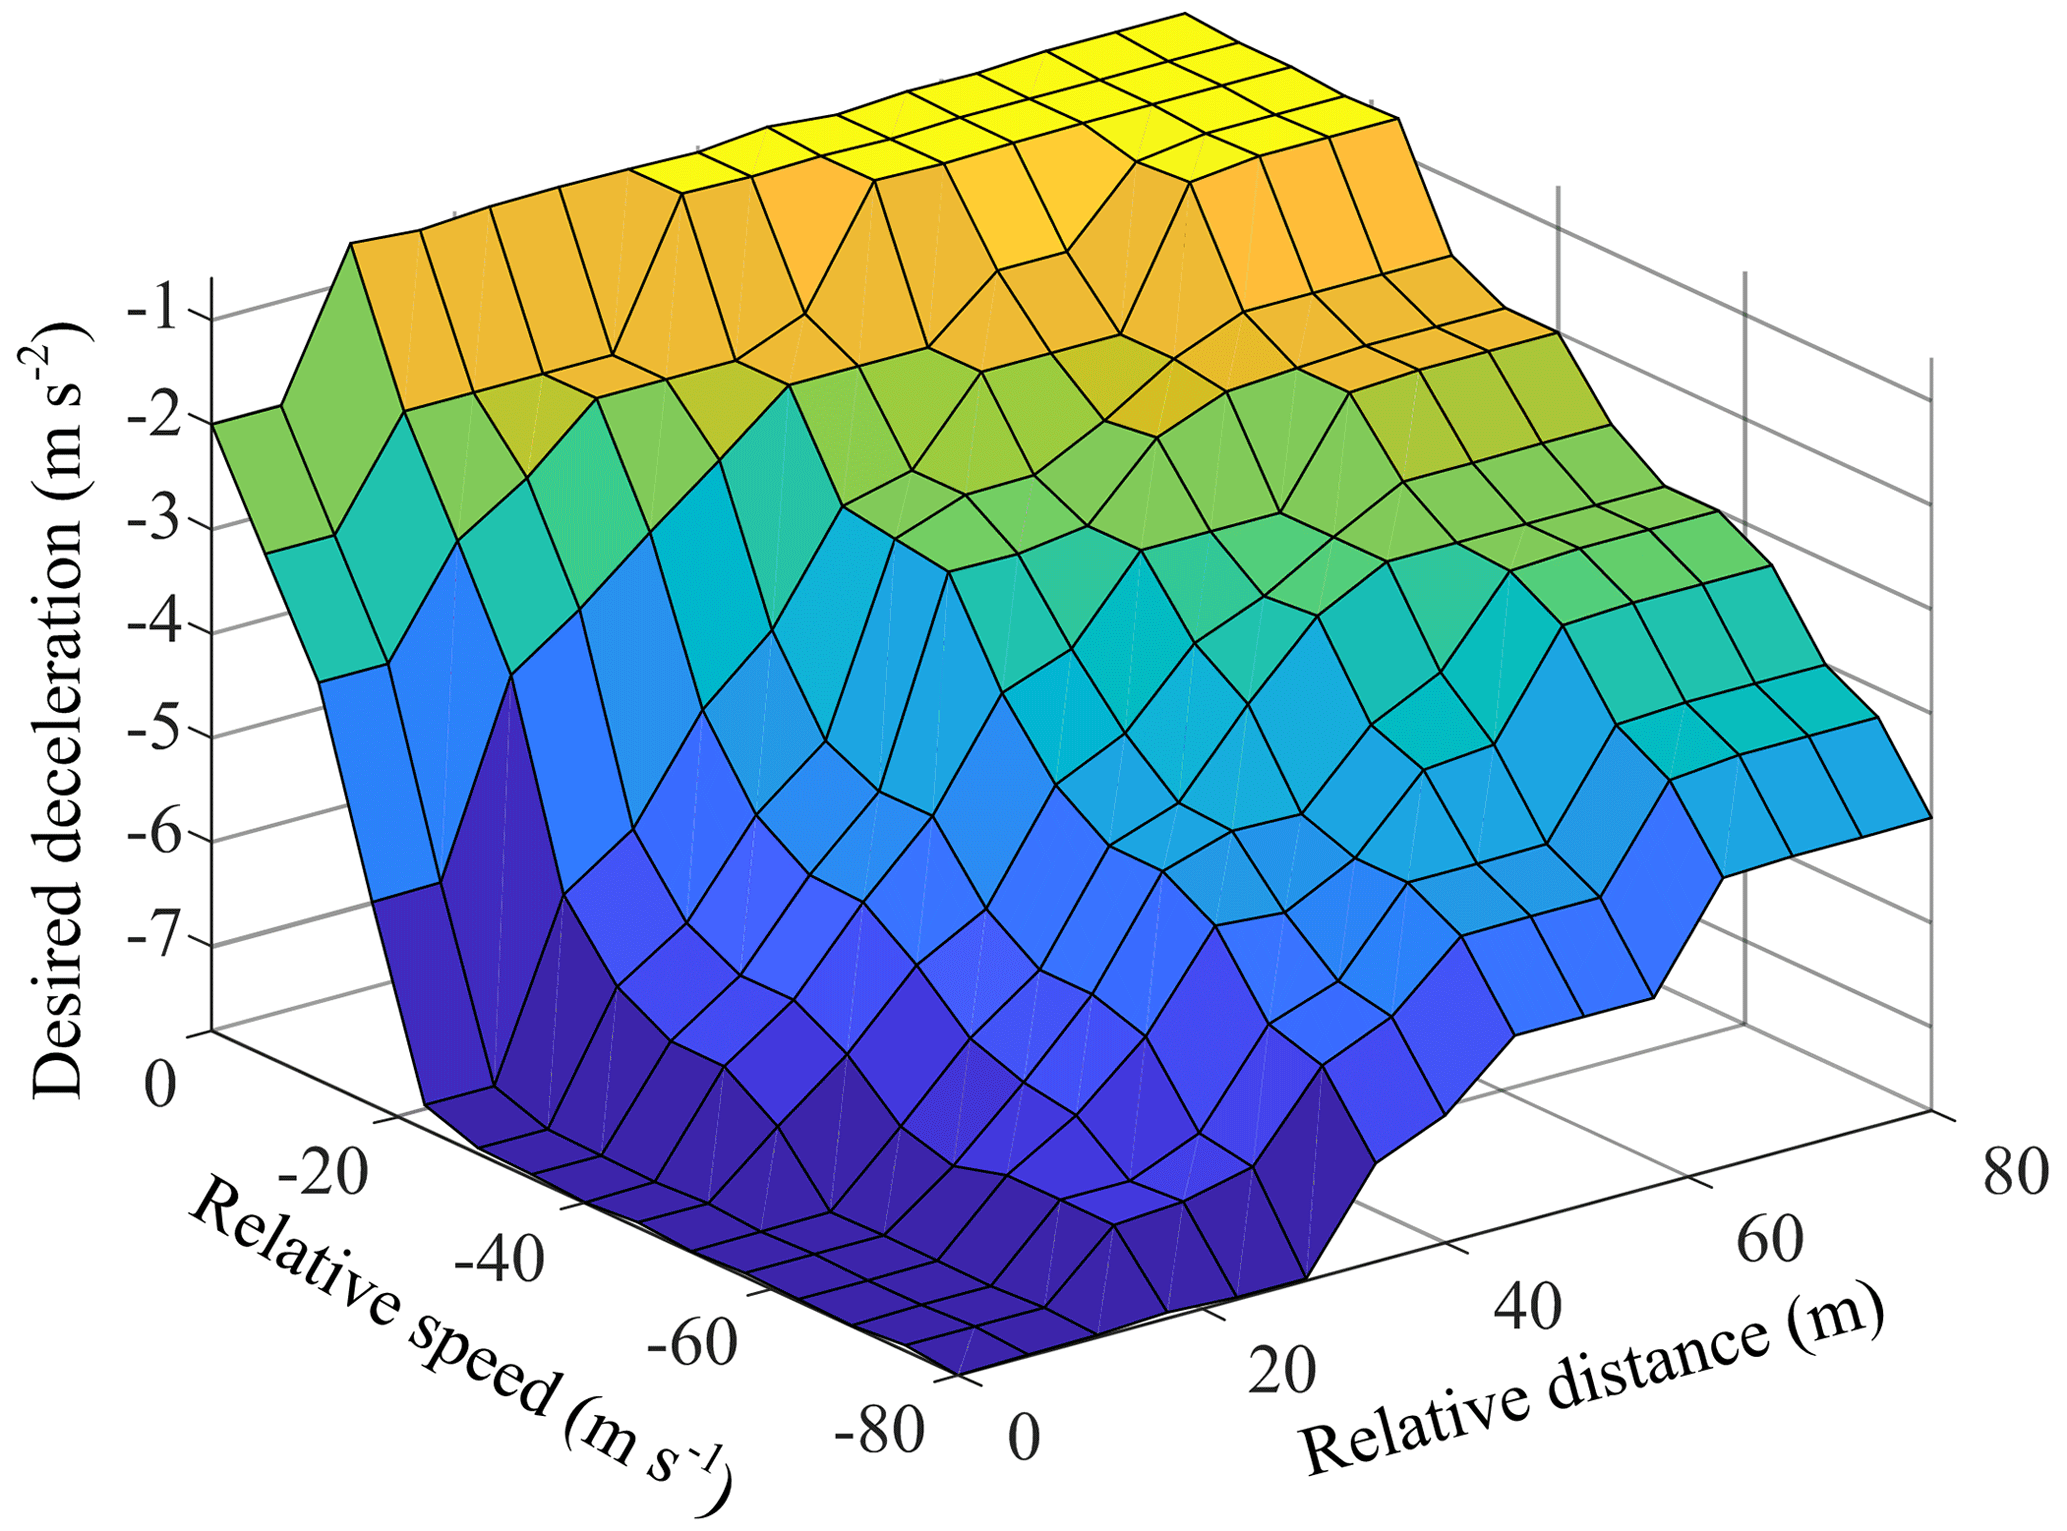
In this paper, a fuzzy controller is built based on fuzzy control theory (Wang et al., 2023) to realize longitudinal collision avoidance. The relative distance and relative speed between vehicle and pedestrian are taken as the inputs of the fuzzy controller, and the controller outputs the desired deceleration to ensure the safety of longitudinal collision avoidance. The universe of relative speed is defined as , which is described by 12 linguistic variables: N11, N10, N9, N8, N7, N6, N5, N4, N3, N2, N1, and Z0. The universe of relative distance is [0,80], which is described by eight linguistic variables: Z0, P1, P2, P3, P4, P5, P6, and P7. The universe of desired deceleration is , which is described by eight linguistic variables: N7, N6, N5, N4, N3, N2, N1, and Z0. The triangular membership function is selected to represent input and output of a fuzzy controller, as shown in Fig. 7. The developed fuzzy relationship between input and output is shown in Fig. 8.
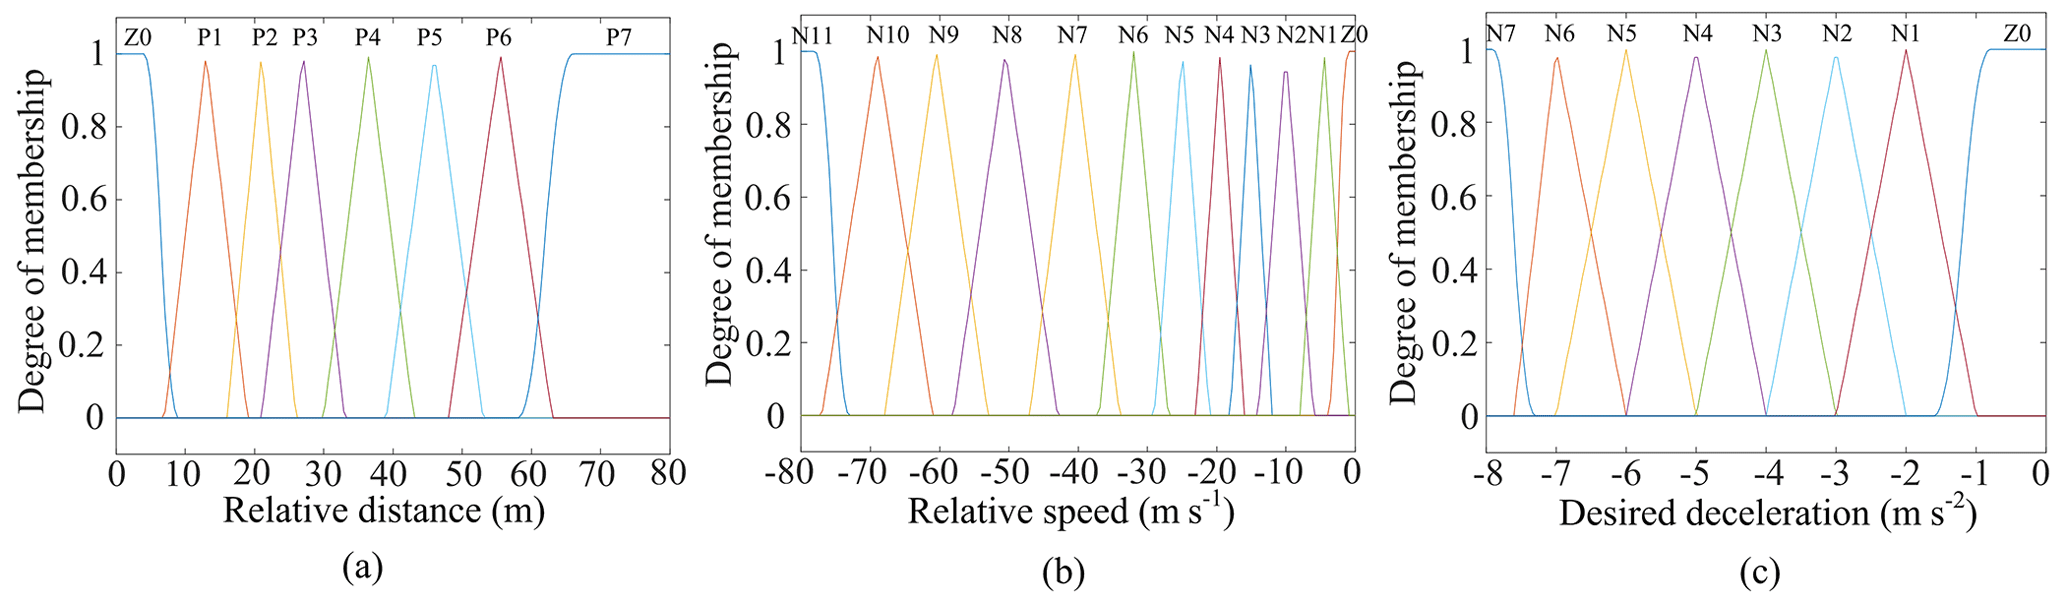
Figure 7(a) Membership function of relative distance; (b) membership function of relative speed; (c) membership function of desired deceleration.
In order to verify the feasibility of the pedestrian motion fusion model and the longitudinal and lateral pedestrian collision avoidance control strategy proposed in this paper, a simulation platform is built based on Prescan and MATLAB/Simulink. Prescan is used to build a virtual traffic scene and provide road and pedestrian information. The pedestrian trajectory prediction module and collision avoidance control module are built in MATLAB/Simulink. The simulations are carried out under different conditions.
5.1 Analysis of simulation results of trajectory prediction
In this study, a total of 258 groups of pedestrian trajectories are collected as the observation dataset, of which 116 groups are used for parameter calibration and 96 groups are used for model validation. The collected trajectory data can truly reflect pedestrian crossing behavior. The pedestrian crossing scene is set in two cases: slowing down for collision avoidance and keep crossing, as shown in Fig. 9. In the simulation, the pedestrian motion fusion model established on the MATLAB platform is used to generate the predicted trajectories, which are respectively compared with the real trajectories. The performance of the model is evaluated by the average displacement error (ADE) and the final displacement error (FDE), shown as follows:
where and are the predicted pedestrian positions in x and y directions at k time, and are the real positions in x and y directions, and N represents the total simulation steps.
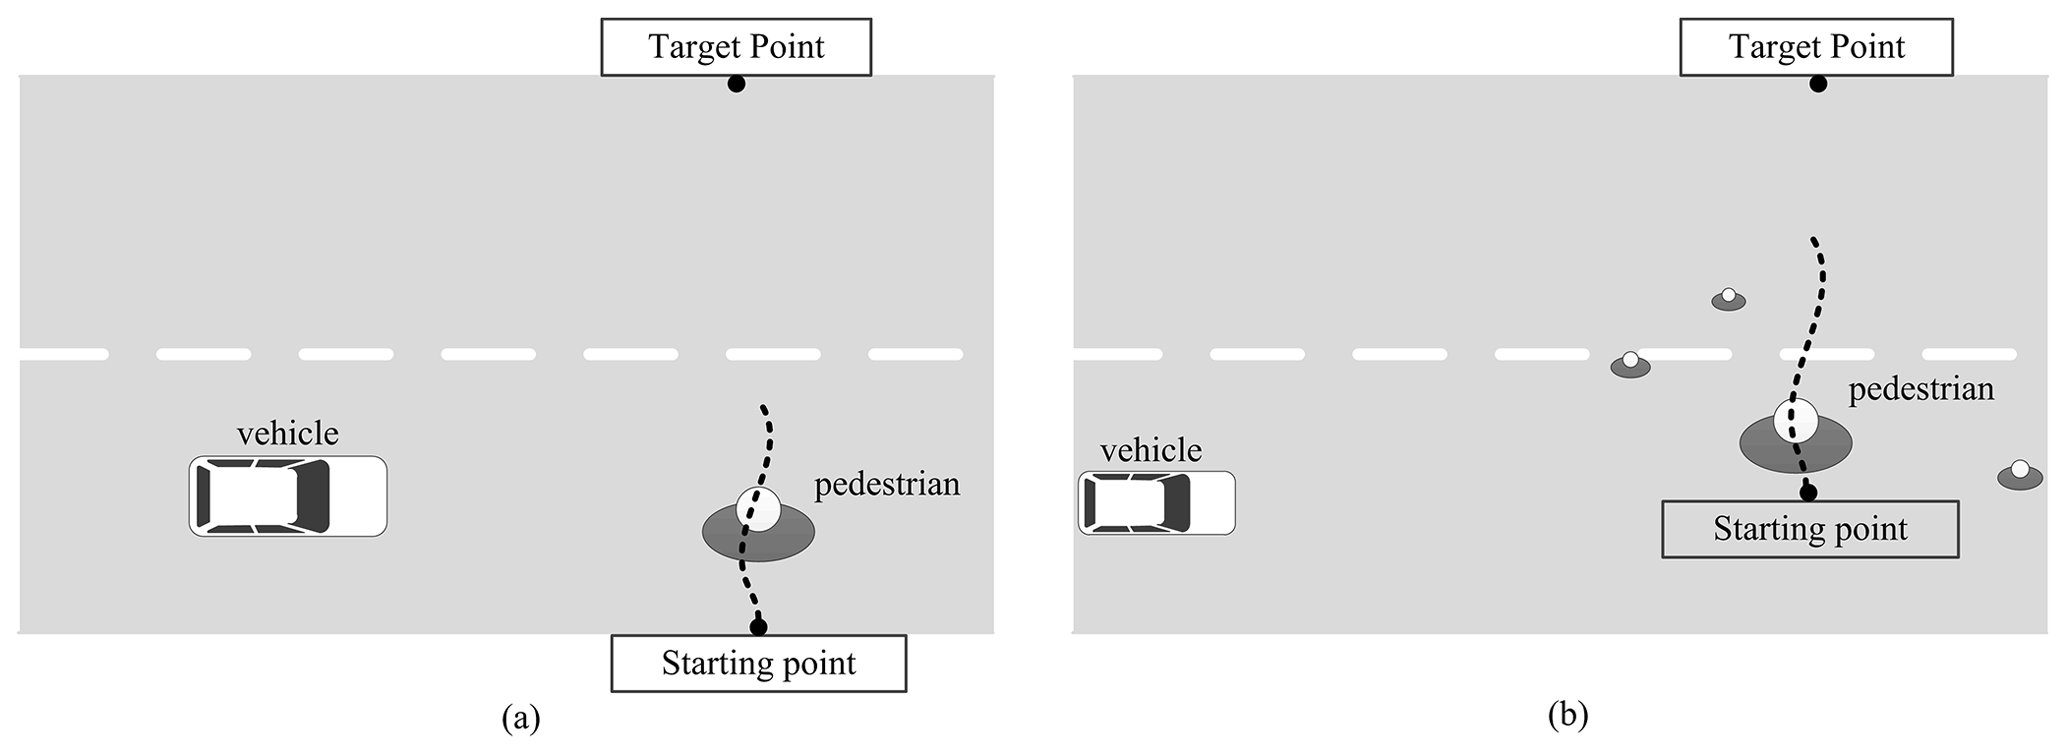
Figure 9Pedestrian crossing scene. (a) Case 1: slow down for collision avoidance; (b) case 2: keep crossing.
Case 1: the pedestrian crosses the road from the starting point at the edge of the road and slows down for collision avoidance with the approaching vehicle. The initial position of the vehicle is (0,2), and the pedestrian starting position is (30,0.4). The pedestrian motion fusion model proposed in this paper is compared with the Markov model and improved social force model, and the simulation results are shown in Fig. 10.
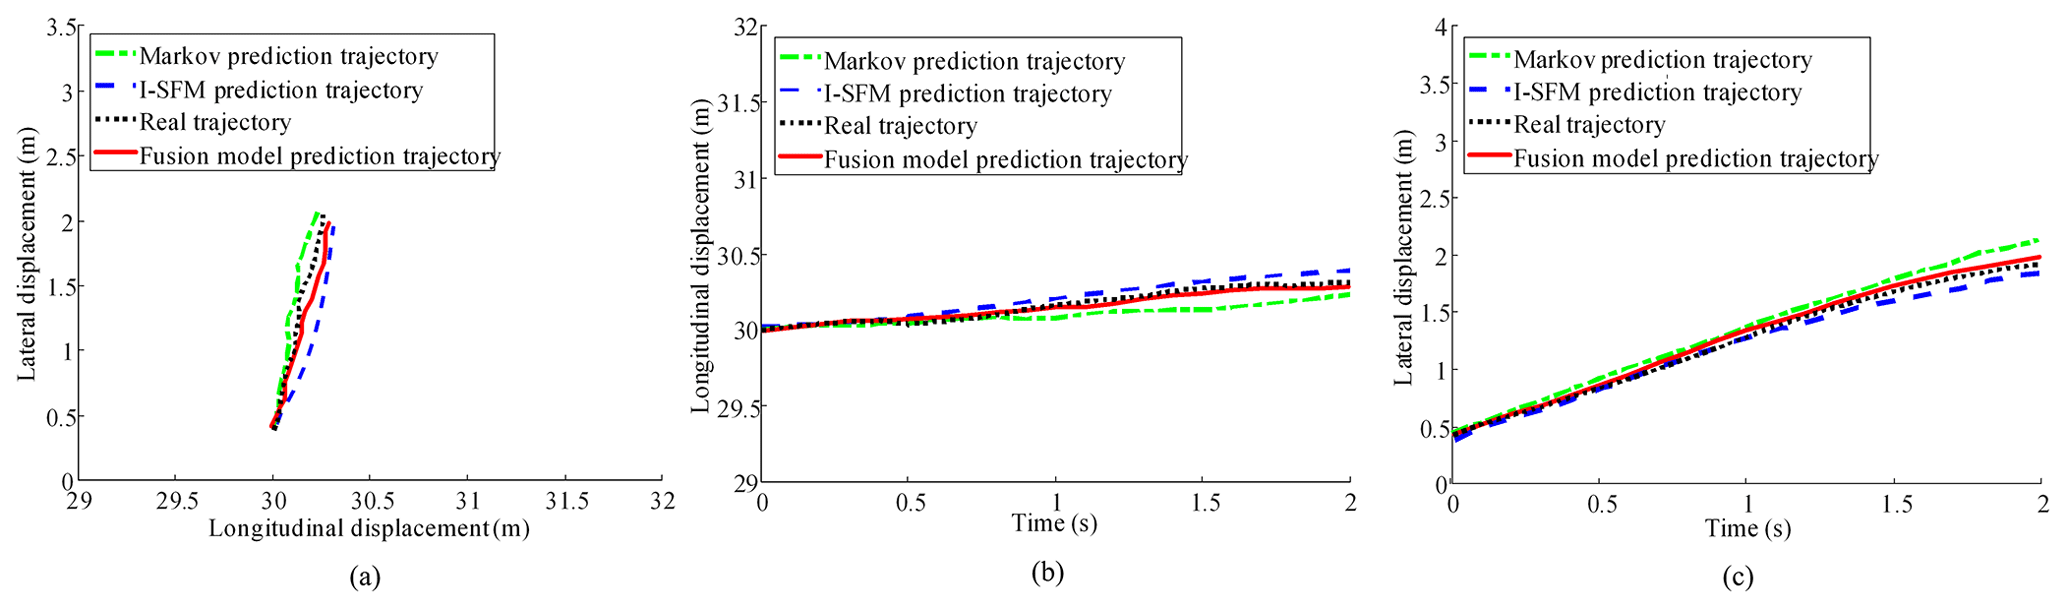
Figure 10Comparisons of trajectory prediction applying different models in case 1. (a) Predicted pedestrian trajectory and real trajectory; (b) relationship between longitudinal displacement and time; (c) relationship between lateral displacement and time.
It can be seen from Fig. 10 that the position and speed of the pedestrian predicted by the fusion model is the closest to the real pedestrian trajectory. In the crossing process, the pedestrian maintains a certain speed at the beginning and then gradually slows down when the vehicle approaches. The results predicted by the pedestrian motion fusion model designed in this paper not only consider random behavior fluctuations but also reflect the pedestrian's movement behavior affected by the surrounding environment. By calculation, the ADE and FDE of the Markov pedestrian model are 0.1697 and 0.174, respectively, the ADE and FDE of the improved social force model are 0.2373 and 0.1864, respectively, and the ADE and FDE of fusion model are 0.1103 and 0.1294, respectively. The results indicate that the pedestrian motion fusion model can truly reflect the behavior and predict pedestrian trajectory more accurately.
Case 2: the pedestrian walks from the starting point at the edge of road and towards the target point. The vehicle is far away from the pedestrian and the driving speed is slow. The initial position of the vehicle is (0,2), and the pedestrian starting position is (50,1). The simulation results are shown in Fig. 11.
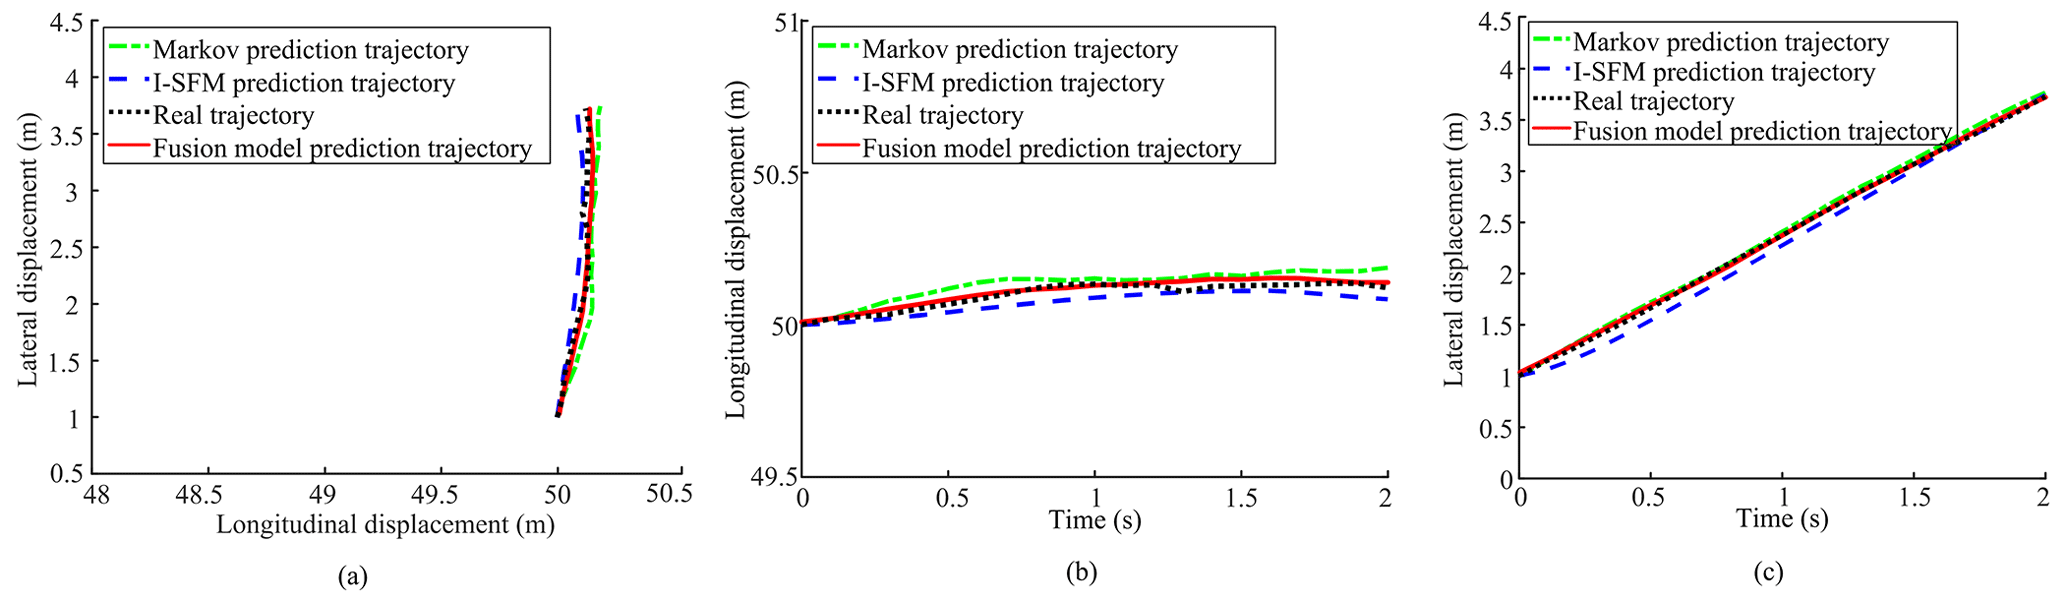
Figure 11Comparisons of trajectory prediction applying different models in case 2. (a) Predicted pedestrian trajectory and real trajectory; (b) relationship between longitudinal displacement and time; (c) relationship between lateral displacement and time.
Figure 11 shows the pedestrian trajectories predicted by different models and the relationship between the lateral/longitudinal displacement and time. In Fig. 11b and c, the longitudinal and lateral displacement under the proposed pedestrian motion fusion model is roughly consistent with the real displacement. Figure 11a shows that the predicted trajectory of the Markov model is quite different from the actual trajectory, and the predicted trajectory of the improved social force model is similar to the actual trajectory at the beginning; however, the longitudinal displacement error between the predicted position and the actual position increases gradually. The predicted trajectory of the pedestrian motion fusion model is basically consistent with the real trajectory. In order to compare performance of three models intuitively, the ADE and FDE of the predicted trajectory are calculated. The results show that the ADE and FDE of the Markov model are 0.1628 and 0.1872, respectively, the ADE and FDE of the improved social force model are 0.1685 and 0.1457, while the ADE and FDE of the pedestrian motion fusion model are 0.1158 and 0.1081, respectively. The comparison results indicate that the pedestrian motion fusion model is more accurate in pedestrian trajectory prediction than the Markov model and improved social force model, and the predicted pedestrian trajectory is closer to the actual trajectory.
5.2 Verification of lateral collision avoidance
To verify the effectiveness of the proposed path planning method for lateral collision avoidance, the simulation conditions are set as follows: the road includes two lanes, the width of every lane is 3.5 m, the coordinate of the vehicle's center of gravity is (0,2), and the pedestrian starting position coordinate is (30,0.4). The pedestrian collision avoidance paths are generated by the artificial potential field method at the speeds of 30, 45, and 60 km h−1, respectively. The results are shown in Fig. 12.
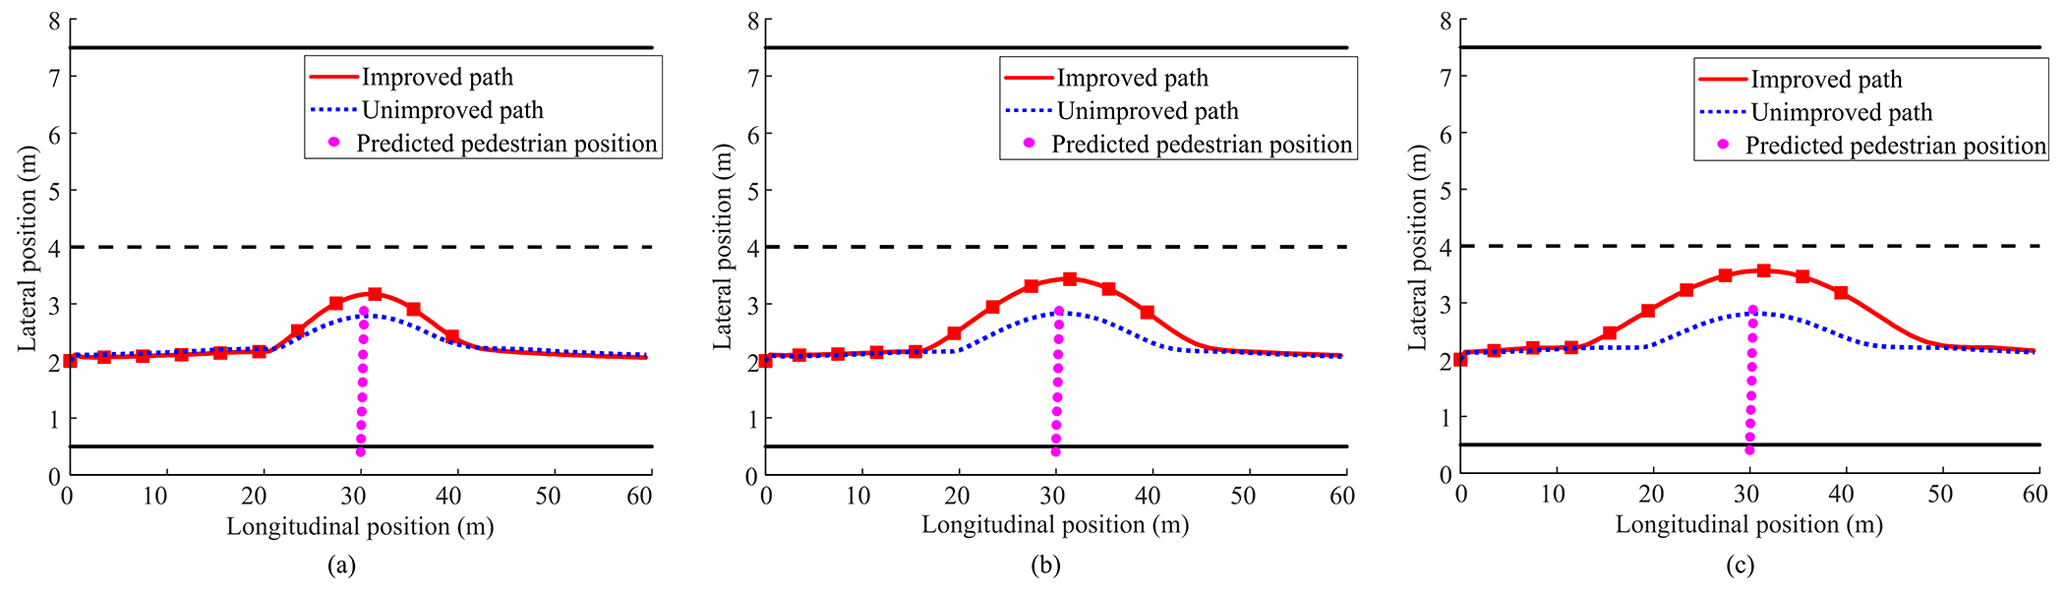
Figure 12Comparisons of lateral collision avoidance path at different speeds. (a) Lateral collision avoidance path at 30 km h−1; (b) lateral collision avoidance path at 45 km h−1; (c) lateral collision avoidance path at 60 km h−1.
In Fig. 12, the red solid line is the improved path considering pedestrian trajectory prediction based on improved artificial potential field algorithm and the blue dotted line is the unimproved path without taking the information of predicted pedestrian trajectory into account during the path planning process. It can be seen from Fig. 12 that the unimproved planned path has shorter lateral collision avoidance distance and is closer to the pedestrian, which results in potential collision risk. Based on the improved artificial potential field method, the safety distance from the vehicle to the pedestrian is adjusted in real time during the planning process. The lateral deviation of the planned path is longer than that of the unimproved artificial potential field method, and the steering collision avoidance operation can be taken earlier to ensure the safety of collision avoidance. As can be seen from Fig. 12, the vehicle can plan a smooth and continuous obstacle avoidance path at different speeds and always within the road boundary, which meets the requirement of lateral collision avoidance safety.
5.3 Verification of longitudinal collision avoidance
The simulation conditions for longitudinal collision avoidance are set as follows: the pedestrian crosses the road at a certain distance from the vehicle. The results of longitudinal collision avoidance of the vehicle at the speeds of 30, 45, and 60 km h−1 are as follows.
From Figs. 13a, 14a and 15a, it can be seen that the vehicle starts to brake when it receives the signal of longitudinal collision avoidance, and completes braking at the time of 5.2, 6, and 8.1 s, respectively, with small deceleration fluctuation, which demonstrates the designed fuzzy controller can meet the control demand of smooth deceleration. In Figs. 13c, 14c, and 15c, the vehicle starts braking at a distance of 25, 35, and 65 m from the pedestrian, and keeps a safe distance of about 5 m, which verifies that the designed longitudinal collision avoidance system can ensure collision avoidance safety. From the results in Figs. 13, 14 and 15, it can be found that the pedestrian collision avoidance system functions well at different speeds, and the minimum distance between the vehicle and the pedestrian when completing braking is in the range of 2–5 m, which can better meet the requirements of pedestrian protection.
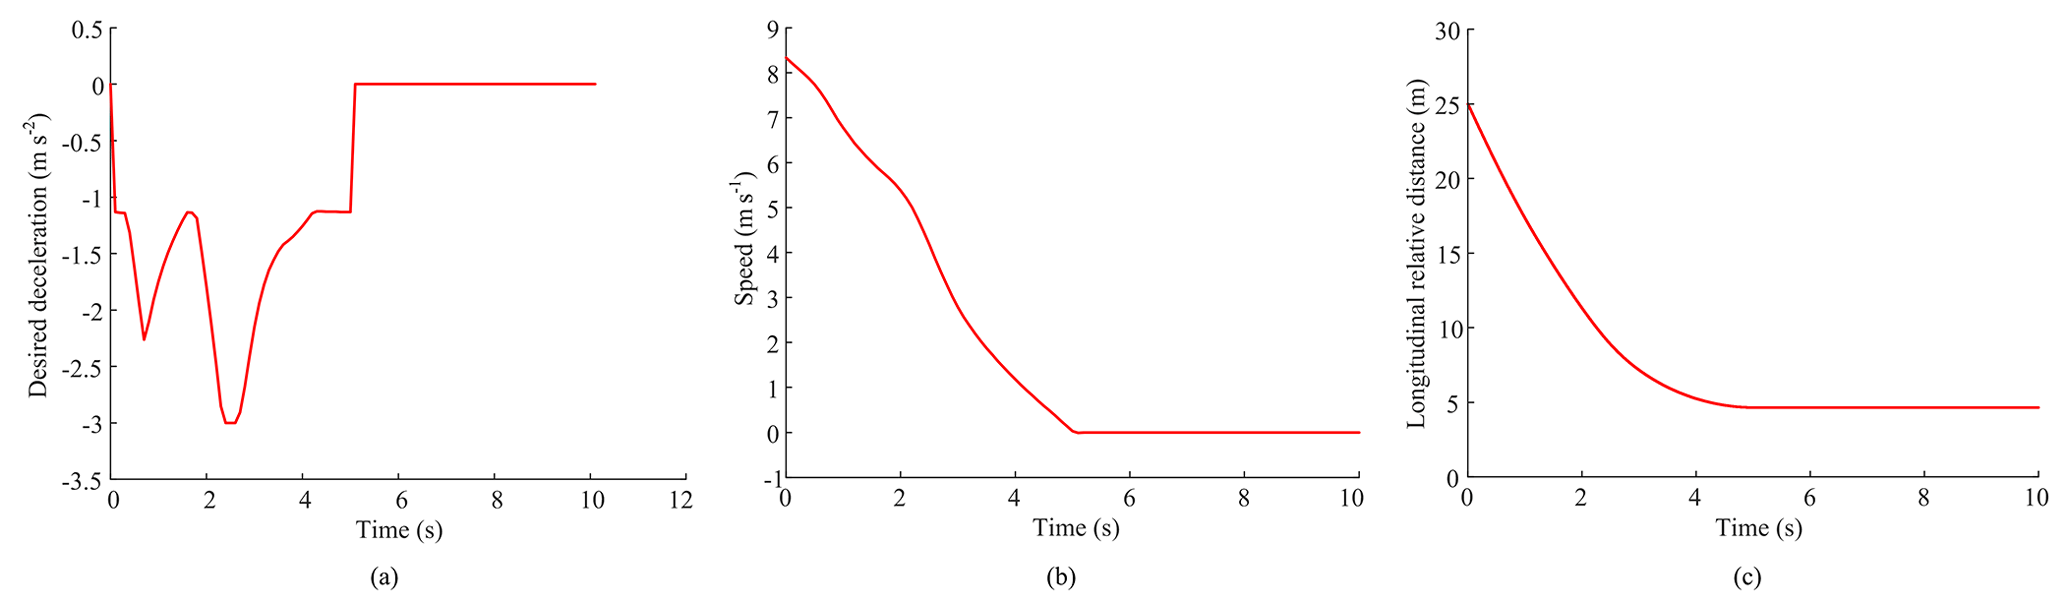
Figure 13Results of longitudinal collision avoidance at 30 km h−1. (a) Desired deceleration; (b) longitudinal speed; (c) longitudinal relative distance.
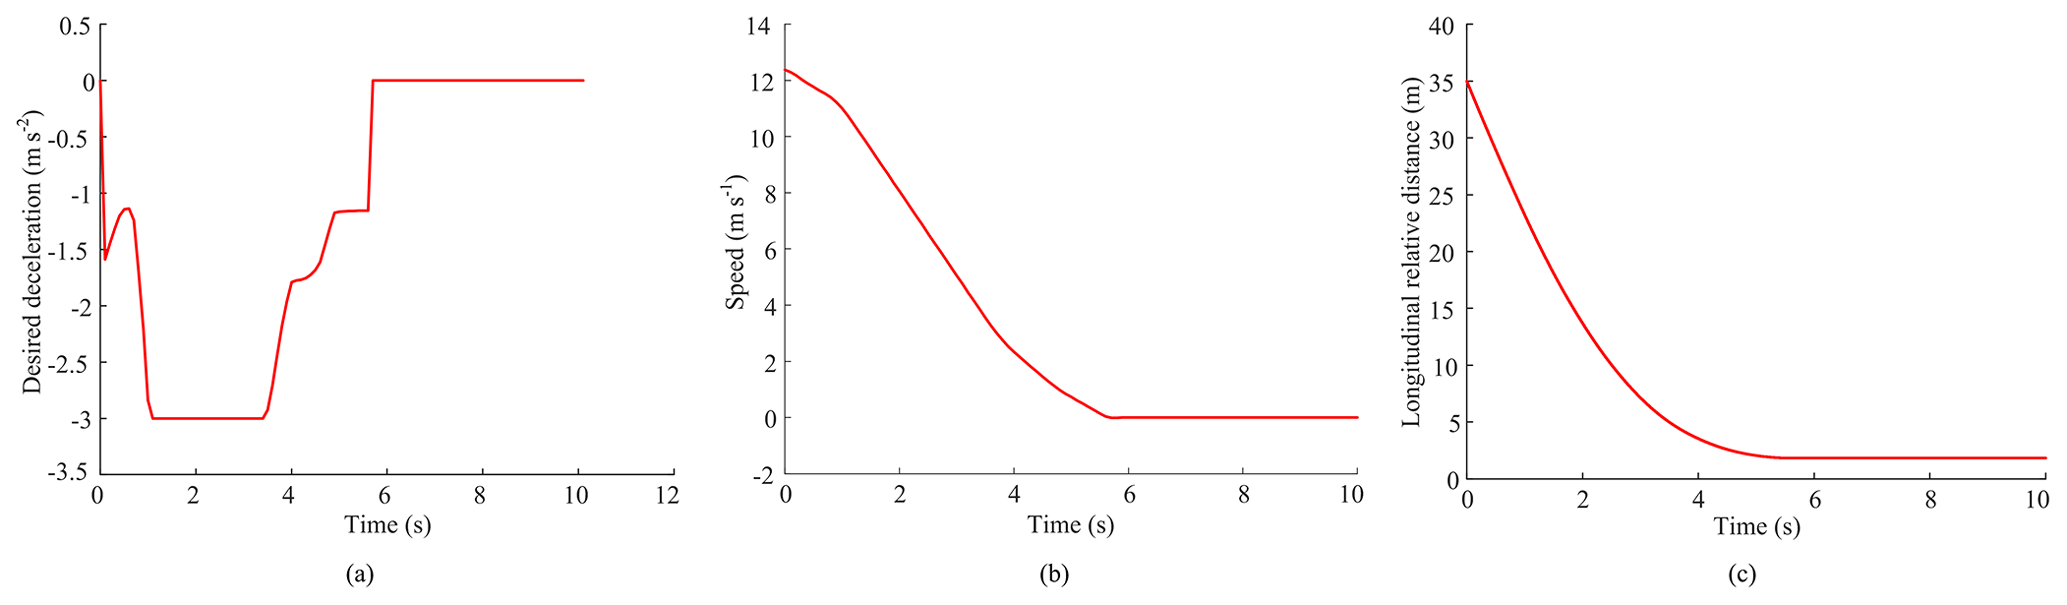
Figure 14Results of longitudinal collision avoidance at 45 km h−1. (a) Desired deceleration; (b) longitudinal speed; (c) longitudinal relative distance.
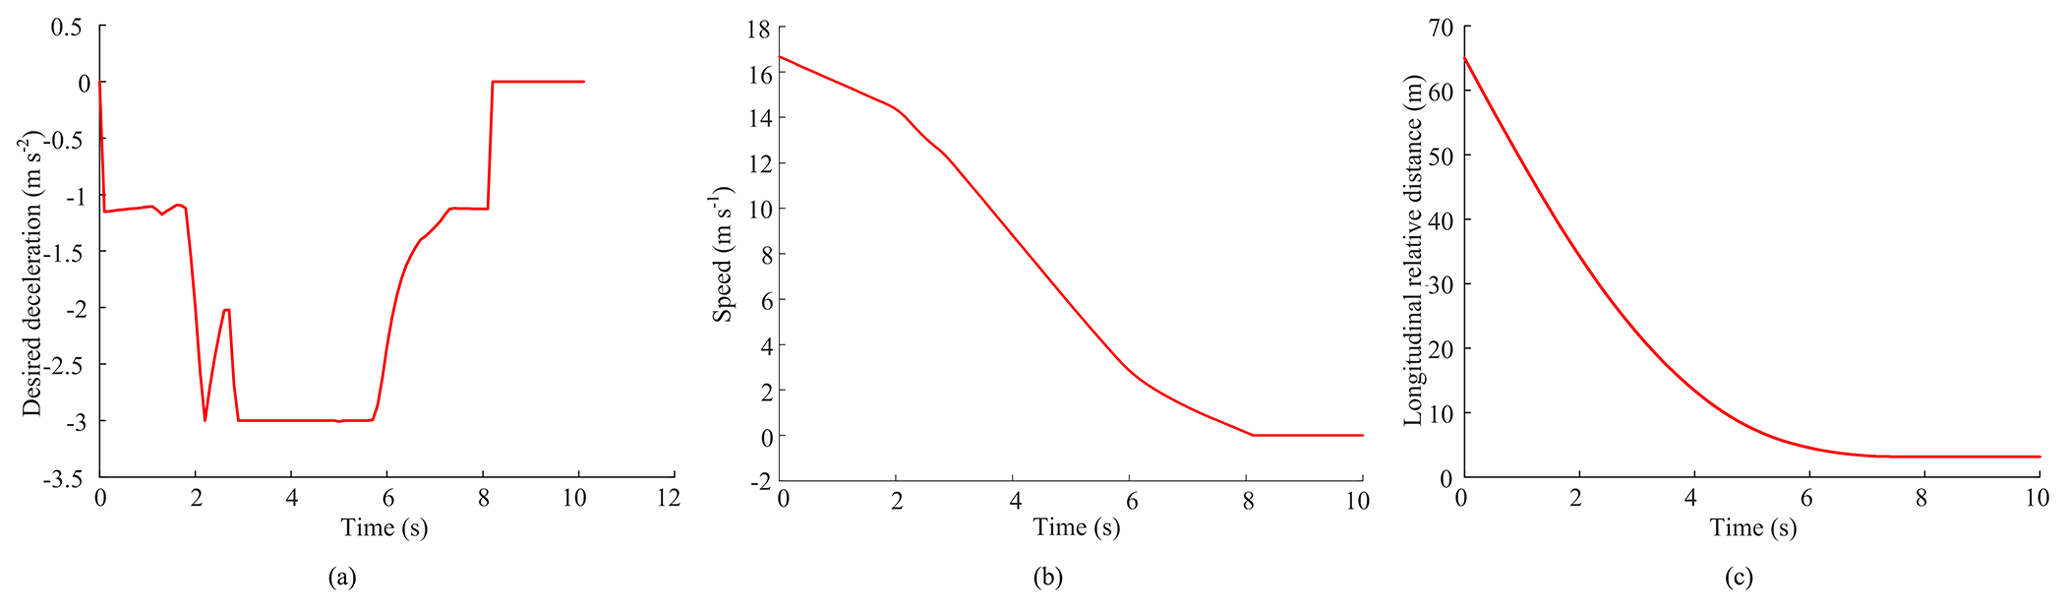
Figure 15Results of longitudinal collision avoidance at 60 km h−1. (a) Desired deceleration; (b) longitudinal speed; (c) longitudinal relative distance.
Aiming to solve the problems of insufficient prediction accuracy of pedestrian trajectory and the shortcomings of pedestrian collision avoidance control methods under conditions without signal lights or crosswalks, in this paper, a pedestrian motion fusion model is constructed to predict the pedestrian trajectory by the fusion of a Markov pedestrian model and improved social force model with regression algorithm. According to the predicted pedestrian trajectory, the longitudinal and lateral pedestrian collision avoidance control strategy is established. The main conclusions are as follows.
- 1.
Based on the analysis of the dynamic behavior of a pedestrian crossing the road, the behavior of the pedestrian is considered as the combination of free movement without external influences and interference movement influenced by the surrounding environment. The pedestrian motion fusion model combines the advantages of two models, which better reflects the overall distribution of pedestrian trajectory.
- 2.
Compared with the Markov model, the ADE and FDE of the pedestrian motion fusion model proposed in this paper are reduced by 35.00 % and 25.63 % in the collision avoidance scene, and the ADE and FDE are reduced by 28.86 % and 42.25 % in the keep crossing scene. Compared with the improved social force model, the ADE and FDE in the collision avoidance scene are reduced by 55.87 % and 30.58 %, and ADE and FDE in the keep crossing scene are reduced by 31.28 % and 25.81 %. The comparisons indicate the pedestrian motion fusion model is more accurate in pedestrian trajectory prediction.
- 3.
According to the analysis of vehicle-to-pedestrian collision risk, a longitudinal and lateral collision avoidance control strategy is developed. The simulation results show that intelligent vehicles can conduct collision avoidance in time based on the driving environment, vehicle states, and risk level under various conditions to avoid collision accidents and improve safety.
In order to further improve the applicability and performance of the algorithm, future studies can be conducted considering the following aspects.
- 1.
This study aims to explore the interaction between vehicles and pedestrians crossing the street. However, in real urban road traffic, there are often multiple motor vehicles, pedestrians, and non-motor vehicles. Therefore, it is necessary to further study the pedestrian model suitable for complex scenes.
- 2.
The research on lateral collision avoidance planning algorithms in this paper is relatively idealized, and the collision avoidance does not consider the speed planning of vehicle. Therefore, it is necessary to comprehensively plan the path and speed of intelligent vehicles to realize stable and safe driving in a complex environment.
The code and data included in this article can be made available by the corresponding author upon reasonable request. Please note that the data and codes are confidential and cannot be made publicly available with respect to future applications.
BT and ZY designed and performed the research, analyzed data, and wrote the paper. ZY and ZH collected and analyzed data. HJ supervised this paper.
The contact author has declared that none of the authors has any competing interests.
Publisher’s note: Copernicus Publications remains neutral with regard to jurisdictional claims made in the text, published maps, institutional affiliations, or any other geographical representation in this paper. While Copernicus Publications makes every effort to include appropriate place names, the final responsibility lies with the authors.
Bin Tang would like to express their heartfelt gratitude to everyone who helped throughout the process of preparing this paper, especially the editors, reviewers, and the academic leader.
This research has been supported by the National Natural Science Foundation of China (grant nos. 51605199, 52225212, U20A20333), the Six Talent Peaks Project in Jiangsu Province (grant no. 2019-GDZB-084), and the Key Science and Technology Support program in Taizhou (grant no. TG202307).
This paper was edited by Zi Bin and reviewed by four anonymous referees.
Barone, F., Marrazzo, M., and Oton, C. J.: Camera calibration with weighted direct linear transformation and anisotropic uncertainties of image control points, Sensors, 20, 1175, https://doi.org/10.3390/s20041175, 2020.
Chen, H. and Zhang, X.: Path planning for intelligent vehicle collision avoidance of dynamic pedestrian using Att-LSTM, MSFM, and MPC at unsignalized crosswalk, IEEE T. Ind. Electron., 69, 4285–4295, https://doi.org/10.1109/TIE.2021.3073301, 2021.
Eiffert, S., Li, K., Shan, M., Worrall, S., Sukkarieh, S., and Nebot, E.: Probabilistic Crowd GAN: Multimodal pedestrian trajectory prediction using a graph vehicle-pedestrian attention network, IEEE Robot. Autom. Let., 5, 5026–5033, https://doi.org/10.1109/LRA.2020.3004324, 2020.
Fildes, B., Keall, M., Bos, N., Lie, A., Page, Y., Pastor, C., Pennisi, L., Rizzih, M., Thomas, P., and Tingvall, C.: Effectiveness of low speed autonomous emergency braking in real-world rear-end crashes, Accident Anal. Prev., 81, 24–29, https://doi.org/10.1016/j.aap.2015.03.029, 2015.
Gao, H., Su, H., Cai, Y., Wu, R., Hao, Z., Xu, Y., Wu, W., Wang, J., Li, Z., and Kan, Z.: Trajectory prediction of cyclist based on dynamic Bayesian network and long short-term memory model at unsignalized intersections, Sci. China Inform. Sci., 64, 1–21, https://doi.org/10.1007/s11432-020-3071-8, 2021.
Gu, Y., Zhao, Y., Zhou, J., Li, H., and Wang, Y.: A fuzzy multiple linear regression model based on meteorological factors for air quality index forecast, J. Intell. Fuzzy Syst., 40, 10523–10547, https://doi.org/10.3233/JIFS-201222, 2021.
Hajiloo, R., Abroshan, M., Khajepour, A., Kasaiezadeh, A., and Chen, S. K.: Integrated steering and differential braking for emergency collision avoidance in autonomous vehicles, IEEE T. Intell. Transp., 22, 3167–3178, https://doi.org/10.1109/TITS.2020.2984210, 2020.
Hassan, M. A., Khan, M. U. G., Iqbal, R., Riaz, O., Bashir, A. K., and Tariq, U.: Predicting humans future motion trajectories in video streams using generative adversarial network, Multimed. Tools Appl., 81, 1–23, https://doi.org/10.1007/s11042-021-11457-z, 2021.
Ji, J., Khajepour, A., Melek, W. W., and Huang, Y.: Path planning and tracking for vehicle collision avoidance based on model predictive control with multiconstraints, IEEE T. Veh. Technol., 66, 952–964, https://doi.org/10.1109/TVT.2016.2555853, 2017.
Keller, C. G. and Gavrila, D. M.: Will the pedestrian cross? A study on pedestrian path prediction, IEEE T. Intell. Transp., 15, 494–506, https://doi.org/10.1109/TITS.2013.2280766, 2014.
Khatib, O.: Real-time obstacle avoidance for manipulators and mobile robots, Int. J. Robot. Res., 5, 90–98, https://doi.org/10.1177/027836498600500106, 1986.
Ko, M., Kim, T., and Sohn, K.: Calibrating a social-force-based pedestrian walking model based on maximum likelihood estimation, Transportation, 40, 91–107, https://doi.org/10.1007/s11116-012-9411-z, 2013.
Lenth, R.: Least-squares means: the r package lsmeans, J. Stat. Softw., 69, 1–33, https://doi.org/10.18637/jss.v069.i01, 2016.
Mirabella, M., Di V., Davoli, A., Vitetta, G.: An approximate maximum likelihood method for the joint estimation of range and doppler of multiple targets in OFDM-based radar systems, IEEE T. Commun., 71, 4862–4876, https://doi.org/10.1109/TCOMM.2023.3280562, 2023.
Narváez, Y. V., Parra Sierra, V., Peña Cárdenas, F., Ruíz Ramos, L., Zamorano González, B., Vargas Martínez, J. I., and Monreal Aranda, O.: Road risk behaviors: Pedestrian experiences, Traffic Inj. Prev., 20, 303–307, https://doi.org/10.1080/15389588.2019.1573318, 2019.
Saito, Y. and Raksincharoensak, P.: A shared control in risk predictive braking maneuver for preventing collisions with pedestrians, IEEE T. Intell. Veh., 1, 314–324, https://doi.org/10.1109/TIV.2017.2700210, 2016.
Sighencea, B. I., Stanciu, R. I., and Căleanu, C. D.: A review of deep learning-based methods for pedestrian trajectory prediction, Sensors, 21, 7543, https://doi.org/10.3390/s21227543, 2021.
Song, X., Chen, K., Li, X., Sun, J., Hou, B., Cui, Y., Zhang, B., Xiong G., and Wang, Z.: Pedestrian trajectory prediction based on deep convolutional LSTM network, IEEE T. Intell. Transp., 22, 3285–3302, https://doi.org/10.1109/TITS.2020.2981118, 2020.
Themann, P., Kotte, J., Raudszus, D., and Eckstein, L.: Impact of positioning uncertainty of vulnerable road users on risk minimization in collision avoidance systems, IEEE Int. Veh. Sym. (IV), 1201–1206, https://doi.org/10.1109/IVS.2015.7225846, 2015.
Vasquez, D., Fraichard, T., and Laugier, C.: Incremental learning of statistical motion patterns with growing hidden markov models, IEEE T. Intell. Transp., 10, 403–416, https://doi.org/10.1109/TITS.2009.2020208, 2009.
Wang, D., Liu, Q., Ma, L., Zhang, Y., and Cong, H.: Road traffic accident severity analysis: A census-based study in China, J. Safety Res., 70, 135–147, https://doi.org/10.1016/j.jsr.2019.06.002, 2019.
Wang, L., Liu, L., Yu, D., Xu, Q., and Wang, J.: Pedestrian trajectory prediction in crossing scenario using fuzzy logic and switching Kalman filter, J. China Univ. Post Telecom., 25, 31–43, https://doi.org/10.19682/j.cnki.1005-8885.2018.1025, 2018.
Wang, Z., Wang, X., Yang, G., Sun, Q., and Ma, Y.: Robust bounded control for fuzzy mechanical systems: fuzzy optimal design and inequality constraint reorganize, IEEE T. Fuzzy Syst., 31, 2605–2616, https://doi.org/10.1109/TFUZZ.2023.3234585, 2023.
Wu, W., Jia, H., Luo, Q., and Wang, Z.: Dynamic path planning for autonomous driving on branch streets with crossing pedestrian avoidance guidance, IEEE Access, 7, 144720–144731, https://doi.org/10.1109/ACCESS.2019.2938232, 2019.
Wu, W., Chen, M., Li, J., Liu, B., and Zheng, X.: An extended social force model via pedestrian heterogeneity affecting the self-driven force, IEEE T. Intell. Transp., 23, 7974–7986, https://doi.org/10.1109/TITS.2021.3074914, 2022.
Yang, W., Zhang, X., Lei, Q., and Cheng, X.: Research on longitudinal active collision avoidance of autonomous emergency braking pedestrian system (AEB-P), Sensors, 19, 4671, https://doi.org/10.3390/s19214671, 2019.
Yuan, C., Wang, J., Shen, J., Chen, L., Cai, Y., He, Y., Weng, S., Yuan, Y., and Gong, Y.: Vehicle path planning based on pedestrian collision avoidance action, IEEE Access, 11, 66713–66728, https://doi.org/10.1109/ACCESS.2023.3287937, 2023.
Zeng, W., Chen, P., Nakamura, H., and Iryo-Asano, M.: Application of social force model to pedestrian behavior analysis at signalized crosswalk, Transport. Res. C-Emer., 40, 143–159, https://doi.org/10.1016/j.trc.2014.01.007, 2014.
Zhang, H., Wu, P., Yin, A., Yang, X., Zhang, M., and Gao, C.: Prediction of soil organic carbon in an intensively managed reclamation zone of eastern China: A comparison of multiple linear regressions and the random forest model, Sci. Total Environ., 592, 704–713, https://doi.org/10.1016/j.scitotenv.2017.02.146, 2017.
Zhang, X., Chen, H., Yang, W., Jin, W., and Zhu, W.: Pedestrian path prediction for autonomous driving at un-signalized crosswalk using W/CDM and MSFM, IEEE T. Intell. Transp., 22, 3025–3037, https://doi.org/10.1109/TITS.2020.2979231, 2020.
Zhang, Z., Wang, C., Zhao, W., and Feng, J.: Longitudinal and lateral collision avoidance control strategy for intelligent vehicles, P. I. Mech. Eng. D-J. Aut., 236, 268–286, https://doi.org/10.1177/09544070211024048, 2022.
Zhou, H., Ren, D., Xia, H., Fan, M., Yang, X., and Huang, H.: An attention-based spatio-temporal graph neural network for interaction-aware pedestrian trajectory prediction, Neurocomputing, 445, 298–308, https://doi.org/10.1016/j.neucom.2021.03.024, 2021.
- Abstract
- Introduction
- Pedestrian motion model establishment
- Calibration of pedestrian motion model
- Design of collision avoidance strategy based on pedestrian trajectory prediction
- Simulation verification and results analysis
- Conclusions
- Code and data availability
- Author contributions
- Competing interests
- Disclaimer
- Acknowledgements
- Financial support
- Review statement
- References