the Creative Commons Attribution 4.0 License.
the Creative Commons Attribution 4.0 License.
 | 23 Feb 2023
Parameter optimization of a pure electric sweeper dust port by a backpropagation neural network combined with a whale algorithm
Jiabao Pan
Hejin Ai
Jiamei Wang
You Wan
Optimizing the structure of the suction port is the key to effectively improving the performance of the sweeping vehicle. The CFD (computational fluid dynamics) method and gas–solid two-phase flow model are used to analyse the influence rule of the structural parameters and the height above ground on the cleaning effect, which is verified by real vehicle tests. The data set was established by an orthogonal test method, and a BP (backpropagation) neural network was used to fit the structural parameters and evaluation indexes. The fitting errors were all within 5 %, indicating that the fitting results of this method were good. According to the fitting relation of the BP neural network output, the whale algorithm should be further used to solve the optimal structural parameters. The results show that the optimal parameter combination is β=63∘, d=168 mm and h=12 mm. The energy consumption of the optimized model is reduced, and the internal airflow loss is reduced. The particle residence time becomes shorter, and the particle can flow out from the outlet faster, thus improving the dust absorption effect. The research can provide a theoretical reference for performance optimization and parameter matching of sweepers.
- Article
(6565 KB) - Full-text XML
- BibTeX
- EndNote


Road dust and sediment are major sources of particulate pollution in cities, making it important to keep streets clean. In large cities, street cleaning requires a lot of workers and technology, which inevitably leads to high costs (Fayzullayevich et al., 2022). Fully automated dust and particle control is a means to protect the environment. As an efficient type of cleaning equipment, the road sweeper works synchronously with the sweep–suction, which can realize the integration of road rubbish cleaning and particle dust collection and is widely used in many contexts (Zeng et al., 2020). As an important part of the vacuuming system of the sweeper, the suction port takes the airflow as the carrier to pick up the dust particles. In order to make the working efficiency of the sweeper higher and for it to be able to work efficiently in the unmanned or less populated environment, higher requirements are necessary for the performance of the vacuum mouth of the sweeper. At the same time, the matching relationship between the operation parameters of the sweeper system should be more clear, so as to provide a decision-making basis for the unmanned operation of the sweeper.
The vacuuming port is the key to the vacuuming system of the sweeper. The innovative design and optimization of the vacuuming port structure can effectively improve the performance of the sweeper. Therefore, researchers have conducted extensive research on the operation effect of the sweeper. Qin et al. (2016) proposed adding an air intake channel behind the dust suction port to enhance the ability of airflow to carry particles and proved the feasibility of the improved model through tests. Yang et al. (2012) used CFD (computational fluid dynamics) technology to analyse the influence of structural parameters such as width and outlet diameter on the airflow velocity and pressure inside the suction port and improved the original structure. The research results showed that the improved suction port had better efficiency. Bofu et al. (2010) found that running speed and negative pressure and other operating parameters of the sweeper had a significant impact on vacuuming efficiency. Under the premise of balancing high dust removal rate and low energy consumption, the optimal operating parameters were obtained. Xi et al. (2016a, b) analysed the structural parameters of the backblown dust suction opening and the backblown air volume and found that increasing the diameter of the opening and the tilt angle could improve the dust suction efficiency, while the vehicle speed had a greater impact on the suction efficiency. Liu et al. (2020) proposed using the tornado's suction principle for vacuuming and used the flow field simulation method to analyse the new vacuuming device and finally obtained a set of optimal parameters to maximize the vacuuming efficiency. From the perspective of the suction port structure, the above literature studies the influence of the specific suction port structure on the suction effect. This method has limitations; it only shows that a specific structure can improve the effect of vacuuming. For dust collection research on the effects of structure parameters on the efficiency of dust collection, M. Zhang et al. (2020, 2019) used the multi-objective orthogonal test method of power matrix analysis to analyse the blowing and suction cleaning structure applied to the underground track interval and found that the width ratio and height ratio between the blowing nozzle and the suction nozzle directly affect the cleaning efficiency, while the best cleaning effect is achieved when the inclination angle between the blowing nozzle and suction nozzle is 20∘. Xi et al. (2020a, b) used a homogeneous design and multiple regression analysis to determine the order of influence of structural parameters to obtain optimal operating conditions, which were verified by tests. Although the above methods can accurately predict the vacuuming efficiency, it is only one evaluation standard, which is often not suitable for practical production. Nowadays, machine learning can provide efficient fitting and prediction for complex industrial design processes, and machine learning has become an important tool for analysing engineering problems. Lu et al. (2020) proposed an improved algorithm with feature selection and neural network classification to study the fault diagnosis of rotating machinery and verified the effectiveness of the proposed method through hardware experiments. Hu et al. (2018) proposed an algorithm connecting a convolutional neural network and a BP (backpropagation) neural network to predict yarn strength and proved the superiority of the new method compared with other methods. Z. Wang et al. (2022) used a new method employing a neural network combined with a genetic algorithm to predict the modulus of composite materials and compared it with other algorithms under the same conditions, and the results proved the feasibility of the new method. E. Wang et al. (2022) predicted the compressive strength model of ultra-low-temperature permafrost through the method of a whale optimization algorithm backpropagation (WOA-BP) neural network. The research results showed that the prediction model has high accuracy and can effectively solve the complex non-linear relationship between the compressive strength of ultra-low-temperature permafrost and its influencing factors. Zhao et al. (2022) studied the whale algorithm and its application in cobot excitation trajectory optimization. The results show that the excitation trajectory optimized by the whale algorithm is smooth and has a strong anti-noise ability, which is beneficial to improving the accuracy of robot parameter identification. The existing research shows that the BP neural network joint optimization algorithm is widely used in practical engineering problems, which can provide a good reference for the structural design and performance analysis of the vacuuming port of the sweeper.
Taking the self-developed Ruiqing S26 pure electric sweeper as the analysis object, the influence of structural parameters and height above ground on the characteristics of the flow field and the efficiency of vacuuming was analysed, and it was verified by real vehicle tests. The sample set was established by an orthogonal experiment, and the range analysis was used to determine the best scheme affecting a single-objective function. As there are multiple objective functions to judge the dust extraction efficiency, a new structural optimization design method using a BP neural network combined with a whale algorithm is used in this study. Taking the influencing factors such as front baffle angle, outlet diameter and ground height as the input and the air velocity on front intake surface, pressure at the inlet of the exhaust pipe and cleaning efficiency as the output, the BP neural network was used to perform machine learning on the input and output, and the fitting relationship was studied. By constructing the fitness function, the multi-objective problem is transformed into a single-objective maximum-value problem. Finally, the whale algorithm is used to solve the fitness function and find the best design scheme. This study can provide a reference for performance optimization and parameter matching of sweepers.
In practical engineering problems, the development of machine structures is influenced by many factors, and the cost of primitive methods to obtain the most stable and reliable structures through extensive physical testing is extremely high. Here, CFD techniques are used to simulate the original dust extraction port to analyse the influence of structural parameters on the flow field characteristics and dust extraction efficiency and to verify the numerical simulation results with the aid of real vehicle tests.
2.1 Physical model
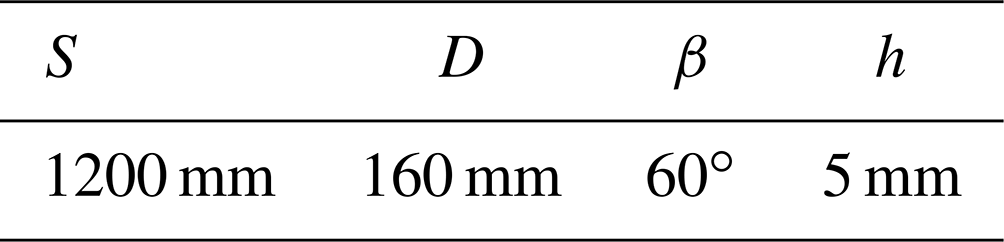
The physical model is given in Fig. 1a. This simulation uses pure suction vacuum, so only the front of the vacuum system is taken as the simulation model. The simulation model and structural parameters are given in Fig. 1b. According to Zhang et al. (2014), in order to realistically simulate the working environment of the dust suction port, an external air domain needs to be added outside the dust suction port, as shown in Fig. 1b, where D is the exhaust outlet diameter, S is the length of the dust suction port, β is the inclination of the front intake surface and h is the height above the ground. The specific dimensions are shown in Table 1.

2.2 Simulation calculation
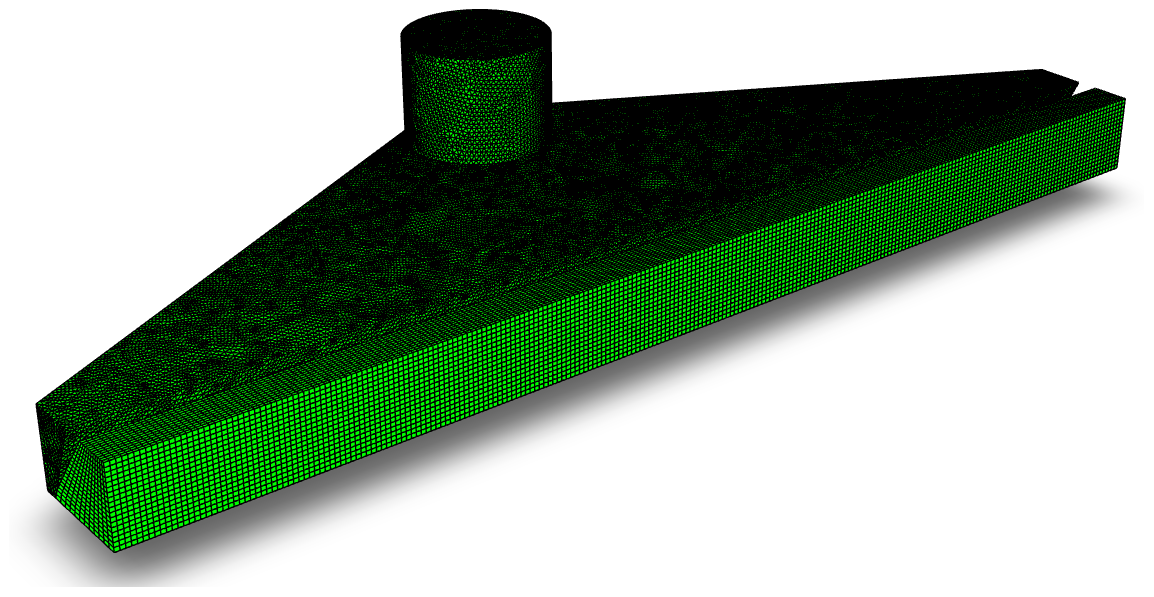
The mesh schematic of the simulation model is shown in Fig. 2, and an unstructured mesh is used for this simulation. The entire computational domain was divided into the external air domain and the internal flow field domain. A tetrahedral mesh was used for the internal flow field of the dust extraction port, and a hexahedral mesh was used for the external air domain with a mesh number of 638587.
The airflow is the vehicle for the dust particles to enter the suction port and can be modelled as a continuous phase and the dust particles as a discrete phase. The Navier–Stokes equation can therefore be used to solve for the continuous phase of the flow, while the discrete phase can be solved using the DPM (discrete phase model; Fu et al., 2021). Given the small effect of temperature on the gas–solid two-phase flow and the inner wall of the dust suction port, the effect of temperature is not considered. The airflow phase conforms to air mass conservation and momentum conservation, and the corresponding equations for air mass and momentum conservation in the dust suction port (Zhu et al., 2022) are
where ρ1 is the air density, t is time, v1 is the air velocity, p1 is the air pressure, g is the acceleration of gravity, τ1 is the air stress tensor and f1 is the average resistance of the air.
In the Lagrange coordinate system, the trajectory of the discrete phase can be solved by the differential equation of particle forces to simulate particle motion in turbulent flow (H. Zhang et al., 2020). The differential equation for the particle forces acting on the discrete phase is expressed as
where v2 is the particle velocity; Fd(v1–v2) is the viscous drag force; ρ2 is the particle density; μ is the aerodynamic viscosity; Cd is the traction coefficient; Re2 is the relative Reynolds number of the particle; d2 is the particle size; Fother is the other forces; and a1, a2 and a3 are constants.
A jet source is used at the suction inlet to release the grit particles: the boundary condition is set to escape, and the particles enter uniformly from the suction inlet into the interior of the suction inlet. The inner wall of the suction port is bounded by the boundary condition reflect, and the exit boundary is set to trap; i.e. the particles are trapped when they reach the exit of the exhaust pipe, and the tracking of the particles is stopped. The dust extraction efficiency is calculated by counting the number of particles collected at the outlet (trapped) and the total number of particles injected (tracked) (Zhang et al., 2017). The equation for the dust extraction efficiency is as follows:
2.3 Simulation results
For the original model, the forward air surface inclination angle β and the outlet diameter D directly affect the internal flow field, so here the effect on the flow field parameters such as the forward air surface velocity and the exhaust inlet pressure is studied by the control variable method, while the effect of changing β and D on the suction efficiency is calculated by Eq. (4).
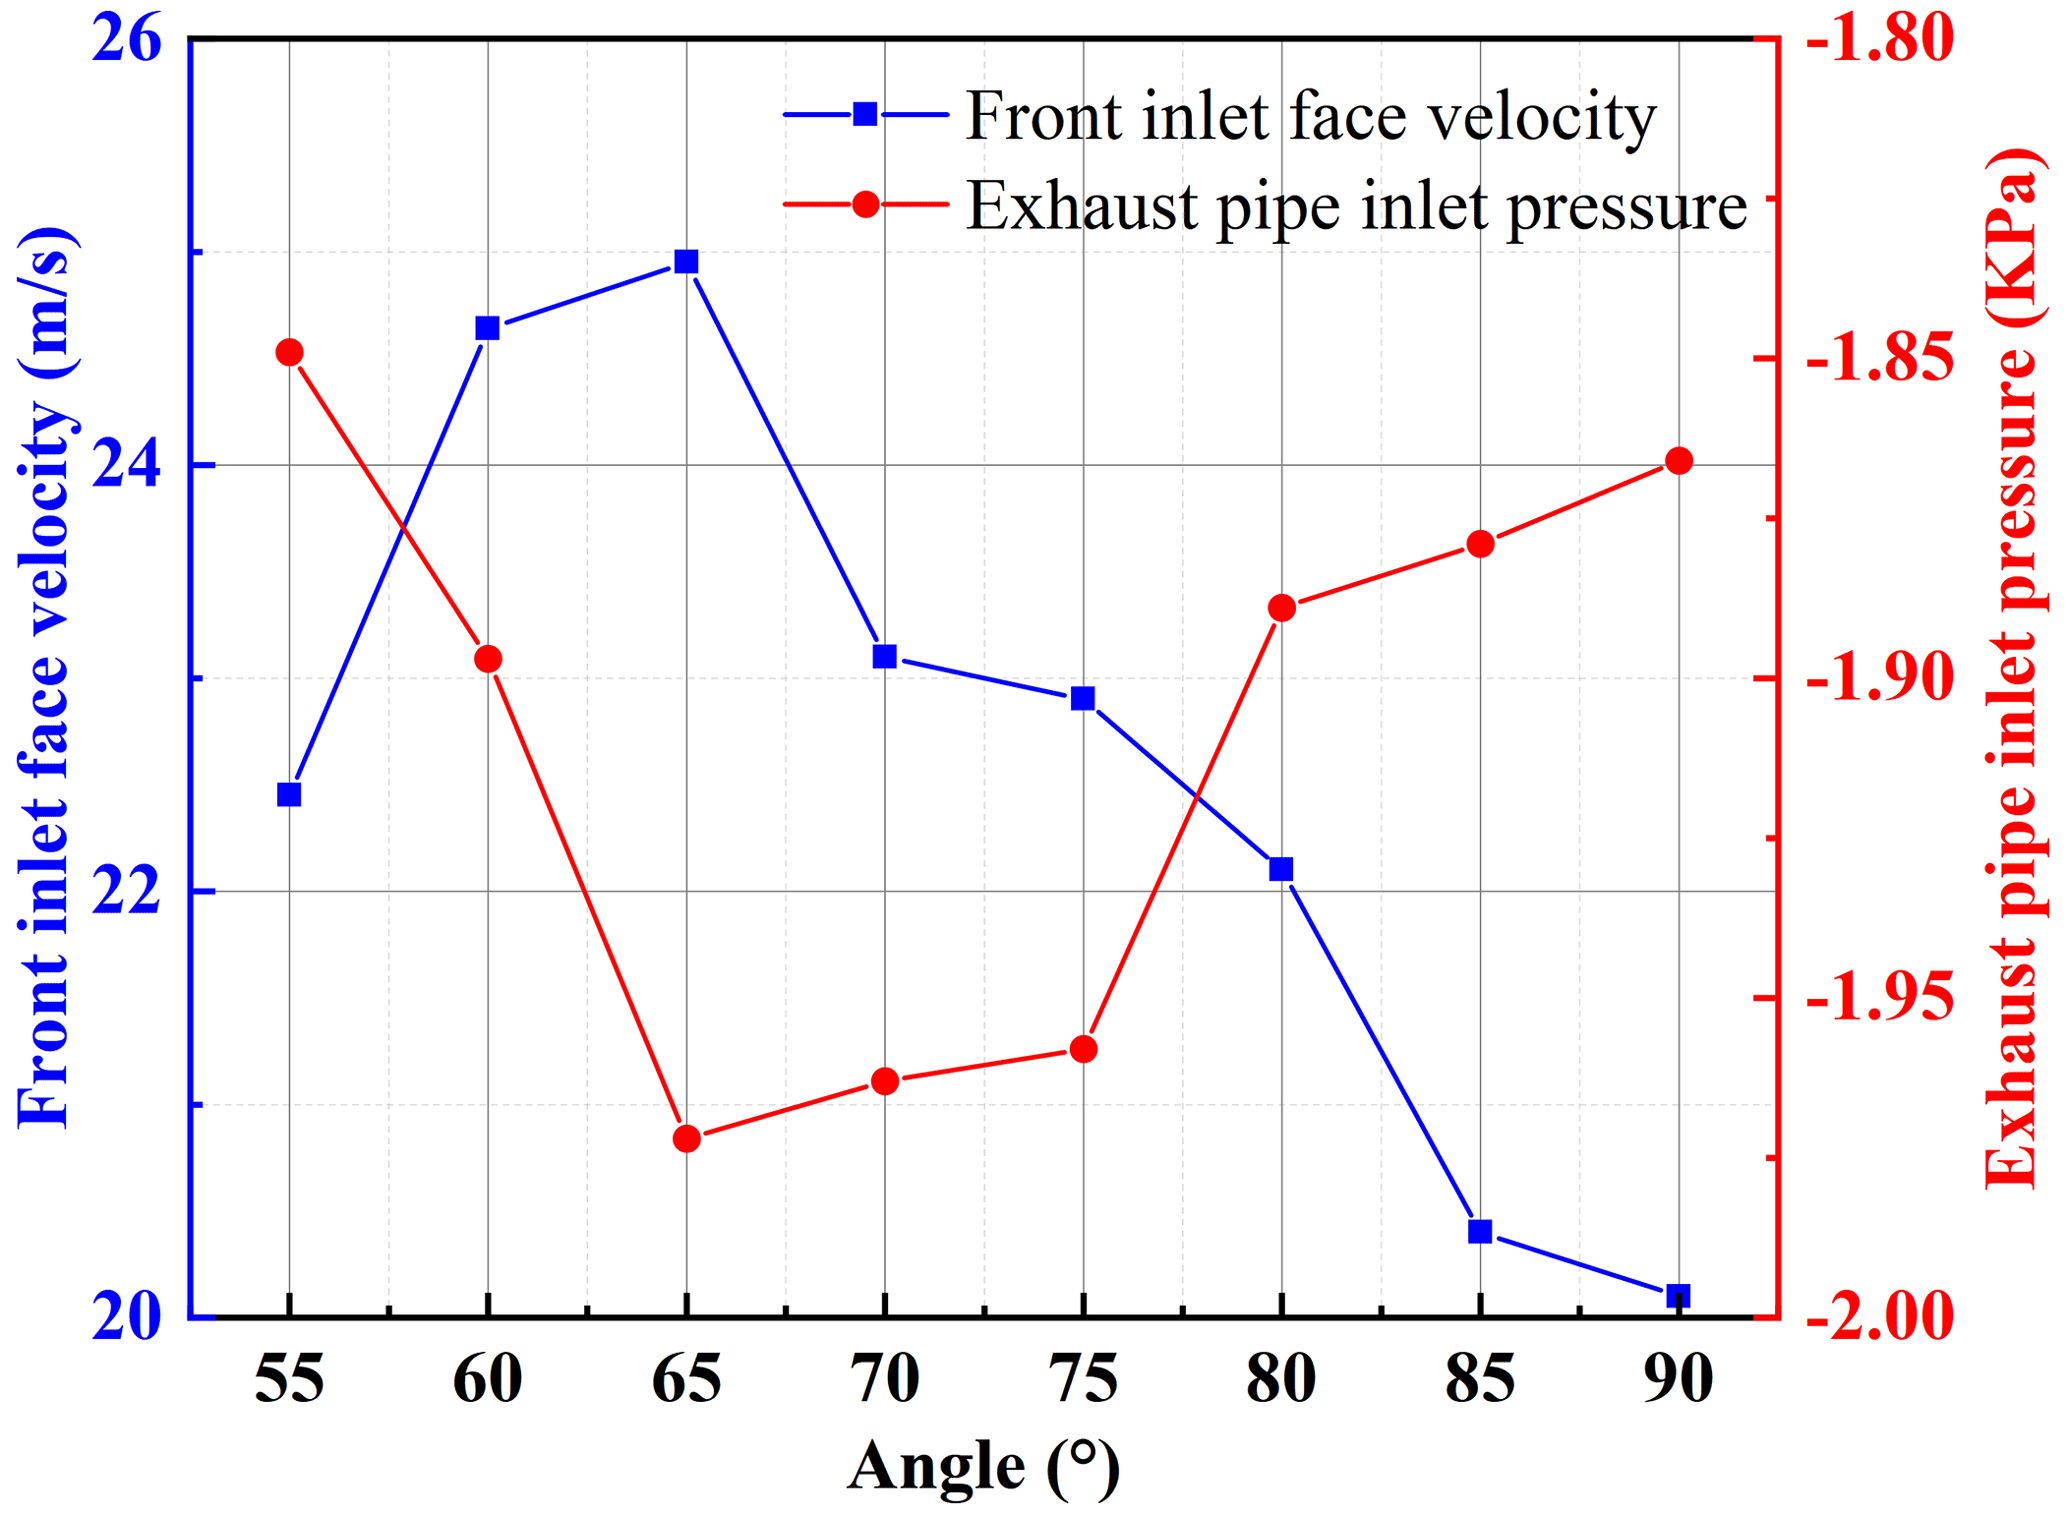
Figure 3Influence of the angle of inclination of the front inlet surface on the flow field characteristics.
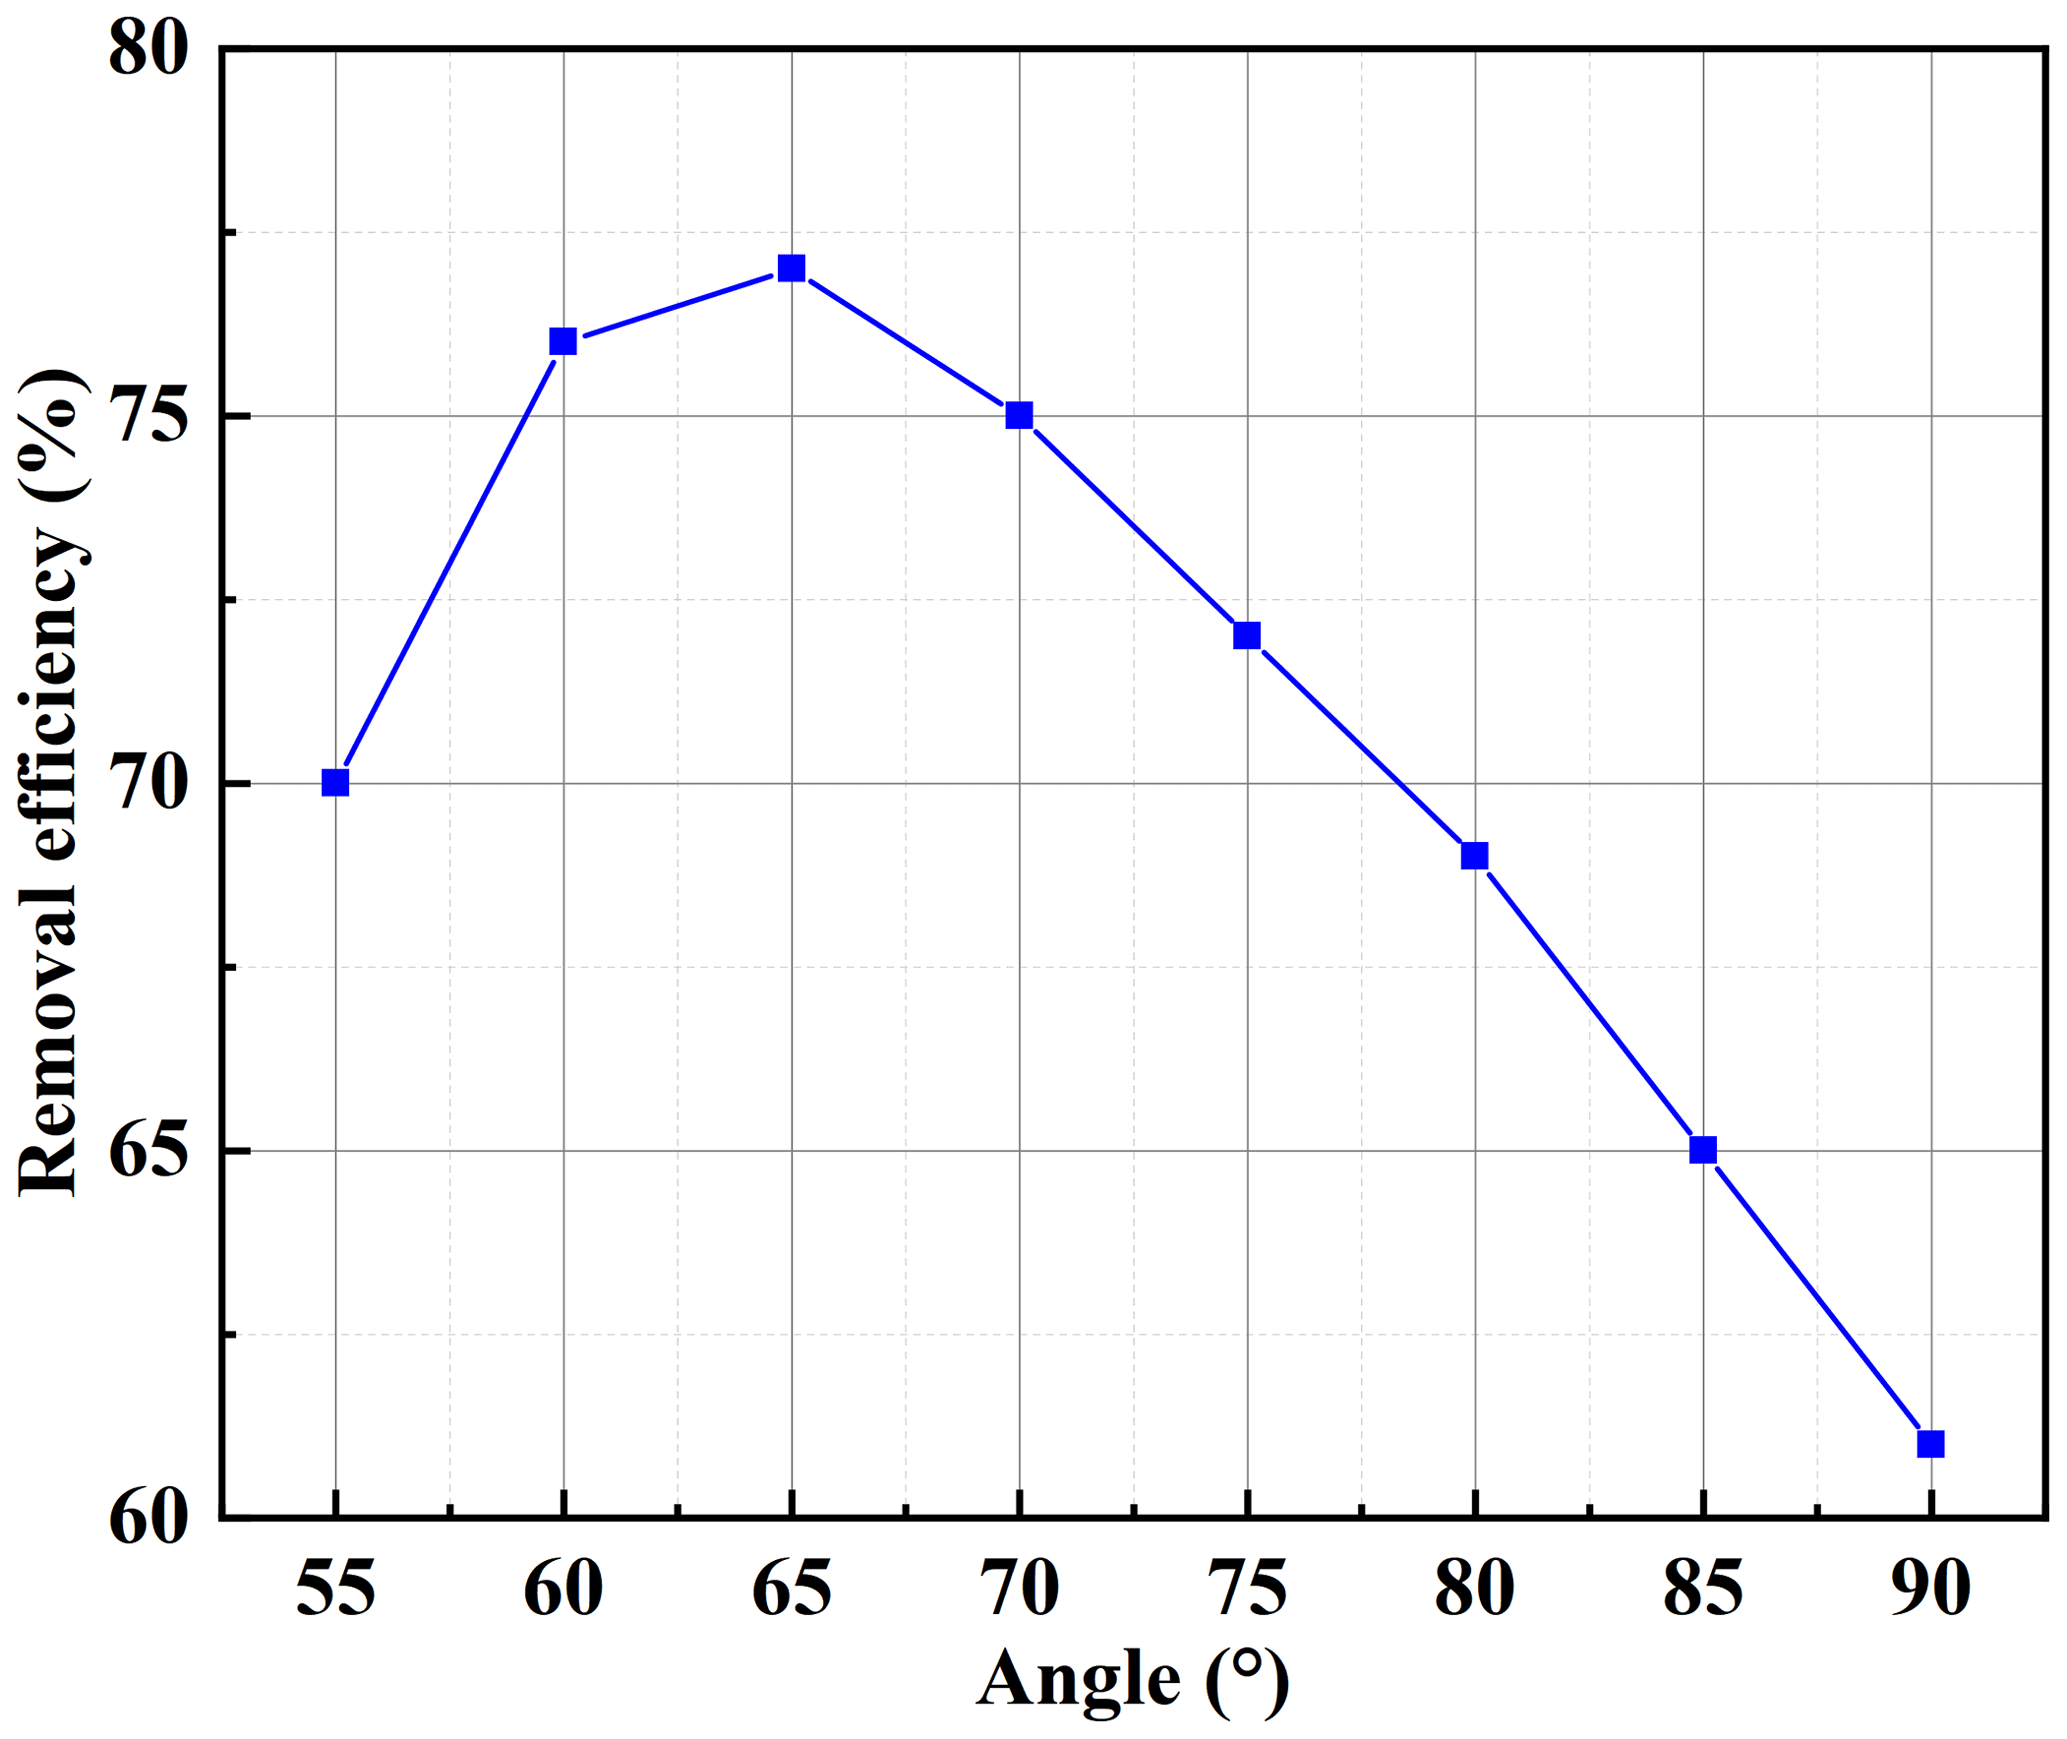
Figure 4Effect of the angle of inclination of the front intake surface on the efficiency of dust extraction.
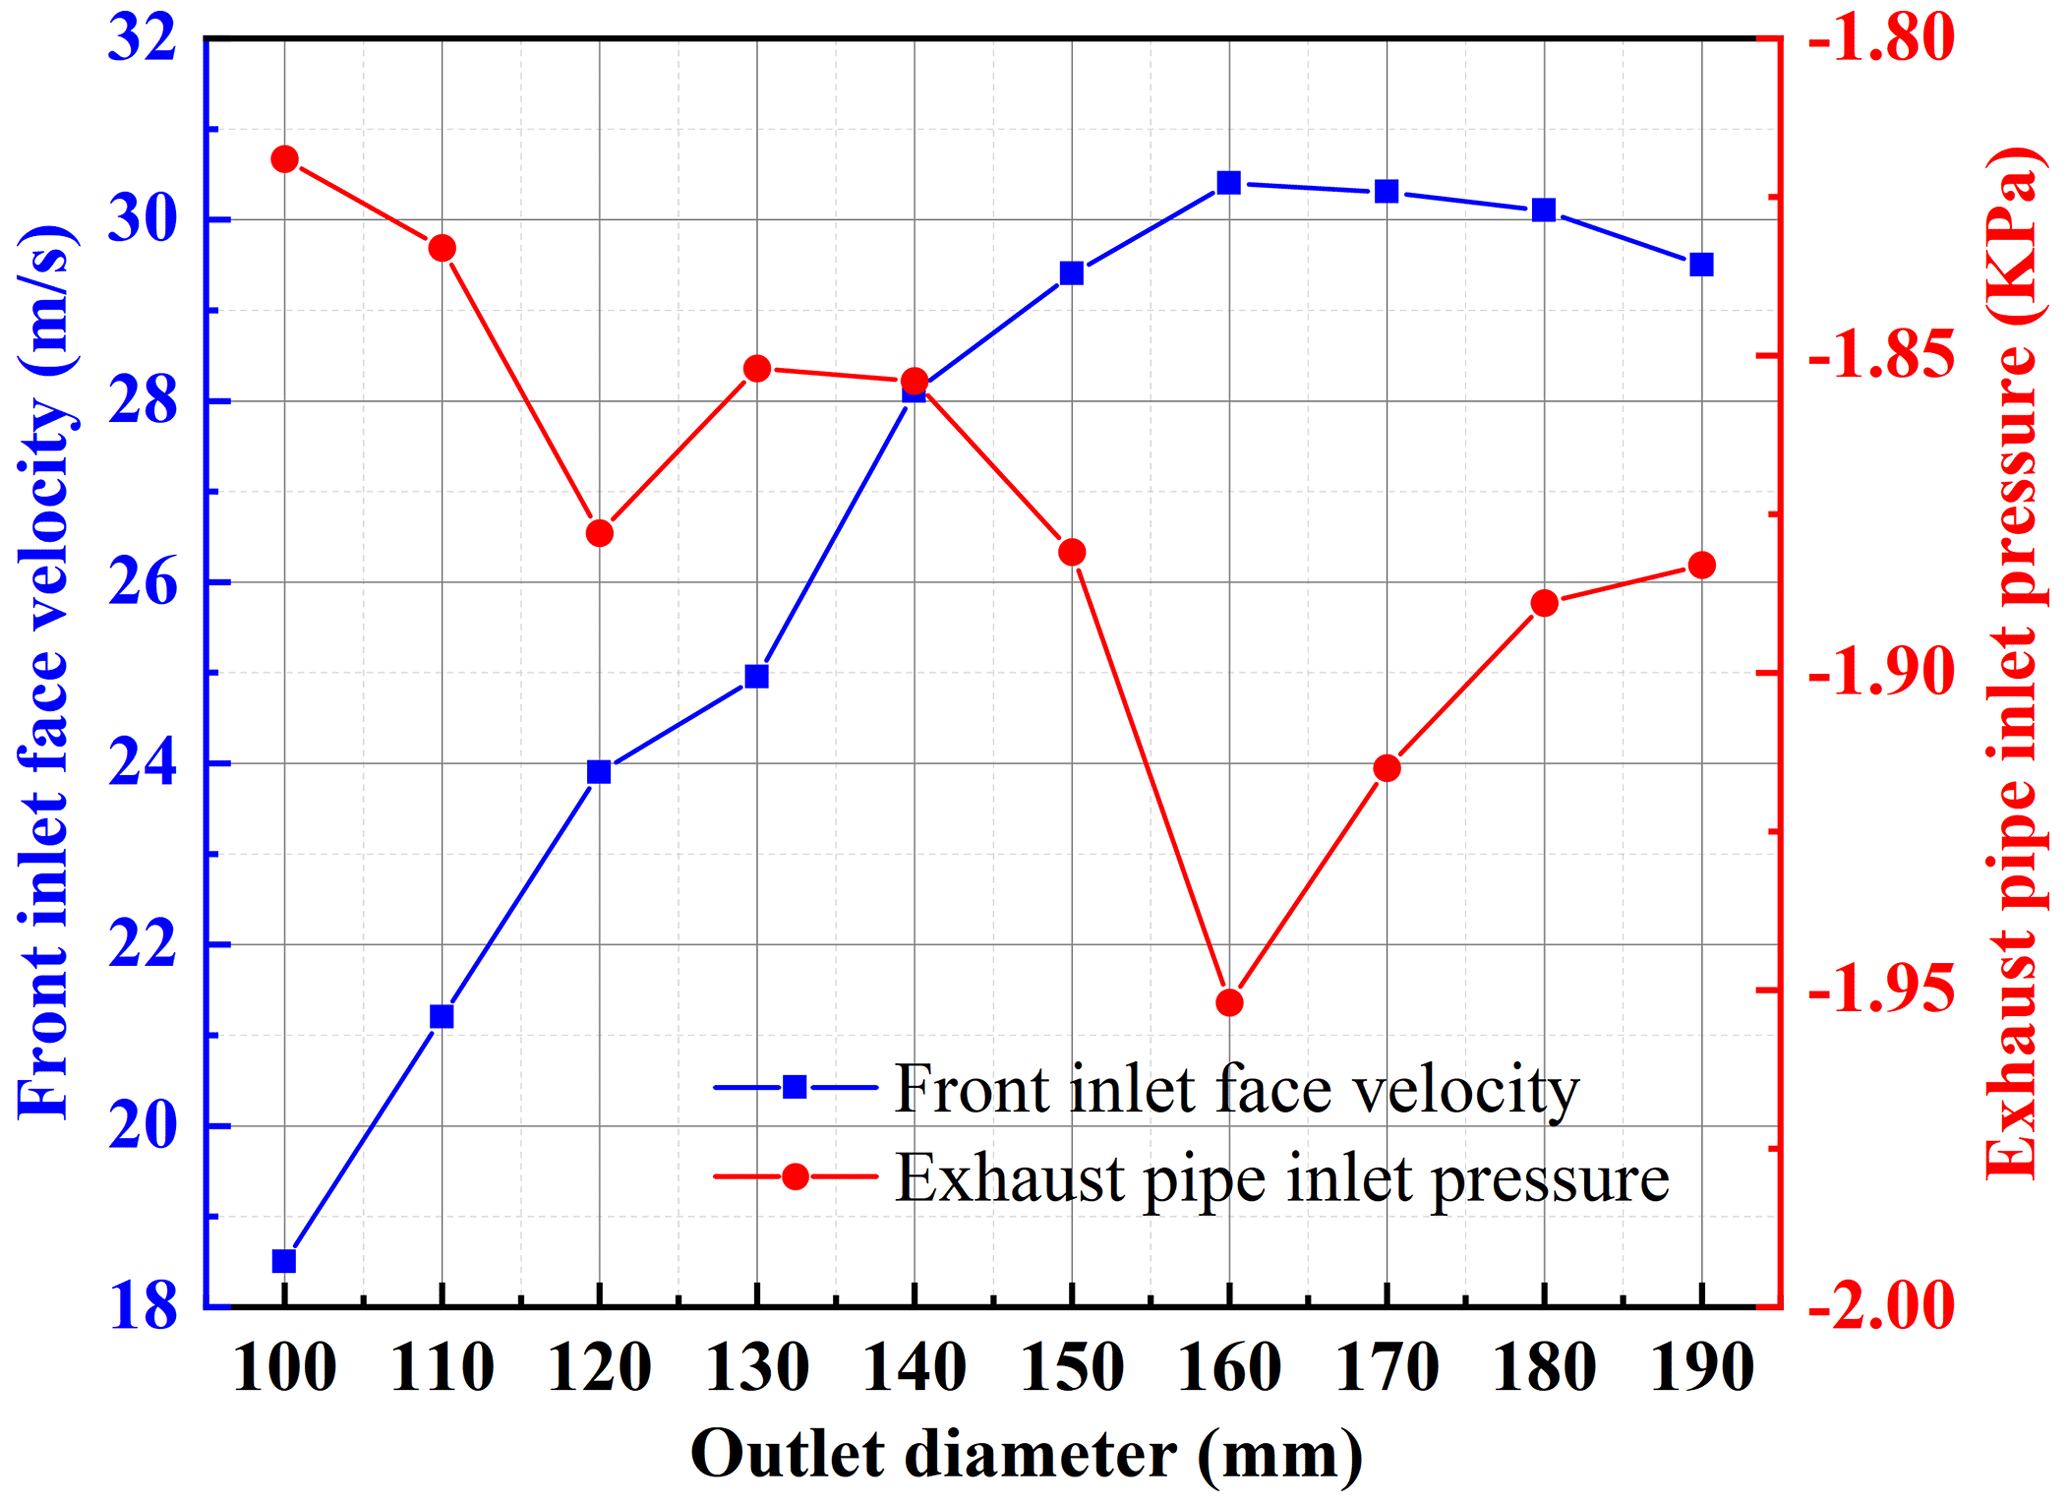

Figure 3 shows the effect of the angle of inclination of the forward air surface on the characteristics of the flow field. When the inclination angle is less than 65∘, the airflow in the dust suction port is smooth, and the energy loss is small; therefore, as the inclination angle increases, the forward airflow speed increases. The increase of the inclination angle inevitably causes the dust collection box cross-sectional area to increase, reducing the negative pressure from the outlet to the exhaust inlet, so the absolute value of the pressure at the exhaust inlet increases. When the inclination angle is greater than 65∘, the internal airflow loss increases, and the working power at the dust suction port near the ground decreases, resulting in a reduction of the forward airflow velocity. Figure 4 shows the effect of the angle of inclination of the forward air surface on the suction efficiency, which can be seen from Fig. 4; as the inclination angle increases, the suction efficiency increases and then decreases, and 65∘ is also its threshold value. It can be seen that the suction efficiency is directly related to the characteristics of the flow field. At an inclination angle of less than 65∘, the increase in airflow velocity at the forward air surface and the pressure at the exhaust inlet increase the suction force at the dust suction port. The opposite is true for inclination angles greater than 65∘.
The effect of exit diameter on the flow field characteristics is given in Fig. 5. As can be seen from this figure, as the outlet diameter increases, the airflow velocity at the forward air surface increases and then decreases slightly. The exhaust inlet pressure first decreases, then increases and then starts to decrease again, and then it finally increases. When the outlet diameter is 160 mm, both the forward air velocity and the exhaust inlet pressure reach their absolute maximum values. Increasing the diameter of the tube reduces the loss along the inlet and outlet, so at the beginning, the flow field characteristics increase. However, too large a pipe diameter causes the increased power to be offset by the losses, so the final trend is decreasing. Figure 6 shows the effect of the outlet diameter on the suction efficiency, which increases and then decreases as the outlet diameter increases, reaching a maximum at 160 mm.
According to the above analysis and related literature, there is a close correlation between the flow field characteristic parameters and the dust suction efficiency (Jin et al., 2022); when the flow field characteristic parameters increase, the dust suction efficiency will also increase with them. Therefore, when judging the dust suction performance of a sweeper, the dust suction efficiency should not be the only criterion, but the flow field characteristics and the dust suction efficiency should be investigated comprehensively.
2.4 Testing and validation
The tests were carried out with the aid of the S26 sweeper at Anhui Airuite New Energy Special Vehicle Co., Ltd. The S26 sweeper studied in this paper has three modes: energy-saving, normal and high-efficiency. The three modes correspond to the three pressures of 2400, 2800 and 3200 Pa respectively, so the tests were carried out at three different pressures. The test is divided into two parts; one is to investigate the characteristics of the flow field under different negative pressures, i.e. 12 points at the entrance to measure the wind speed and 5 points at the exit to measure the wind pressure (the specific location of the points is shown in Fig. 7), and the second is to investigate the vacuum efficiency under different driving speeds and negative pressures. The above tests were carried out without the use of auxiliary brushes and lances; i.e. only the flow field characteristics and the efficiency of the purely suction-type dust suction outlet itself were investigated.
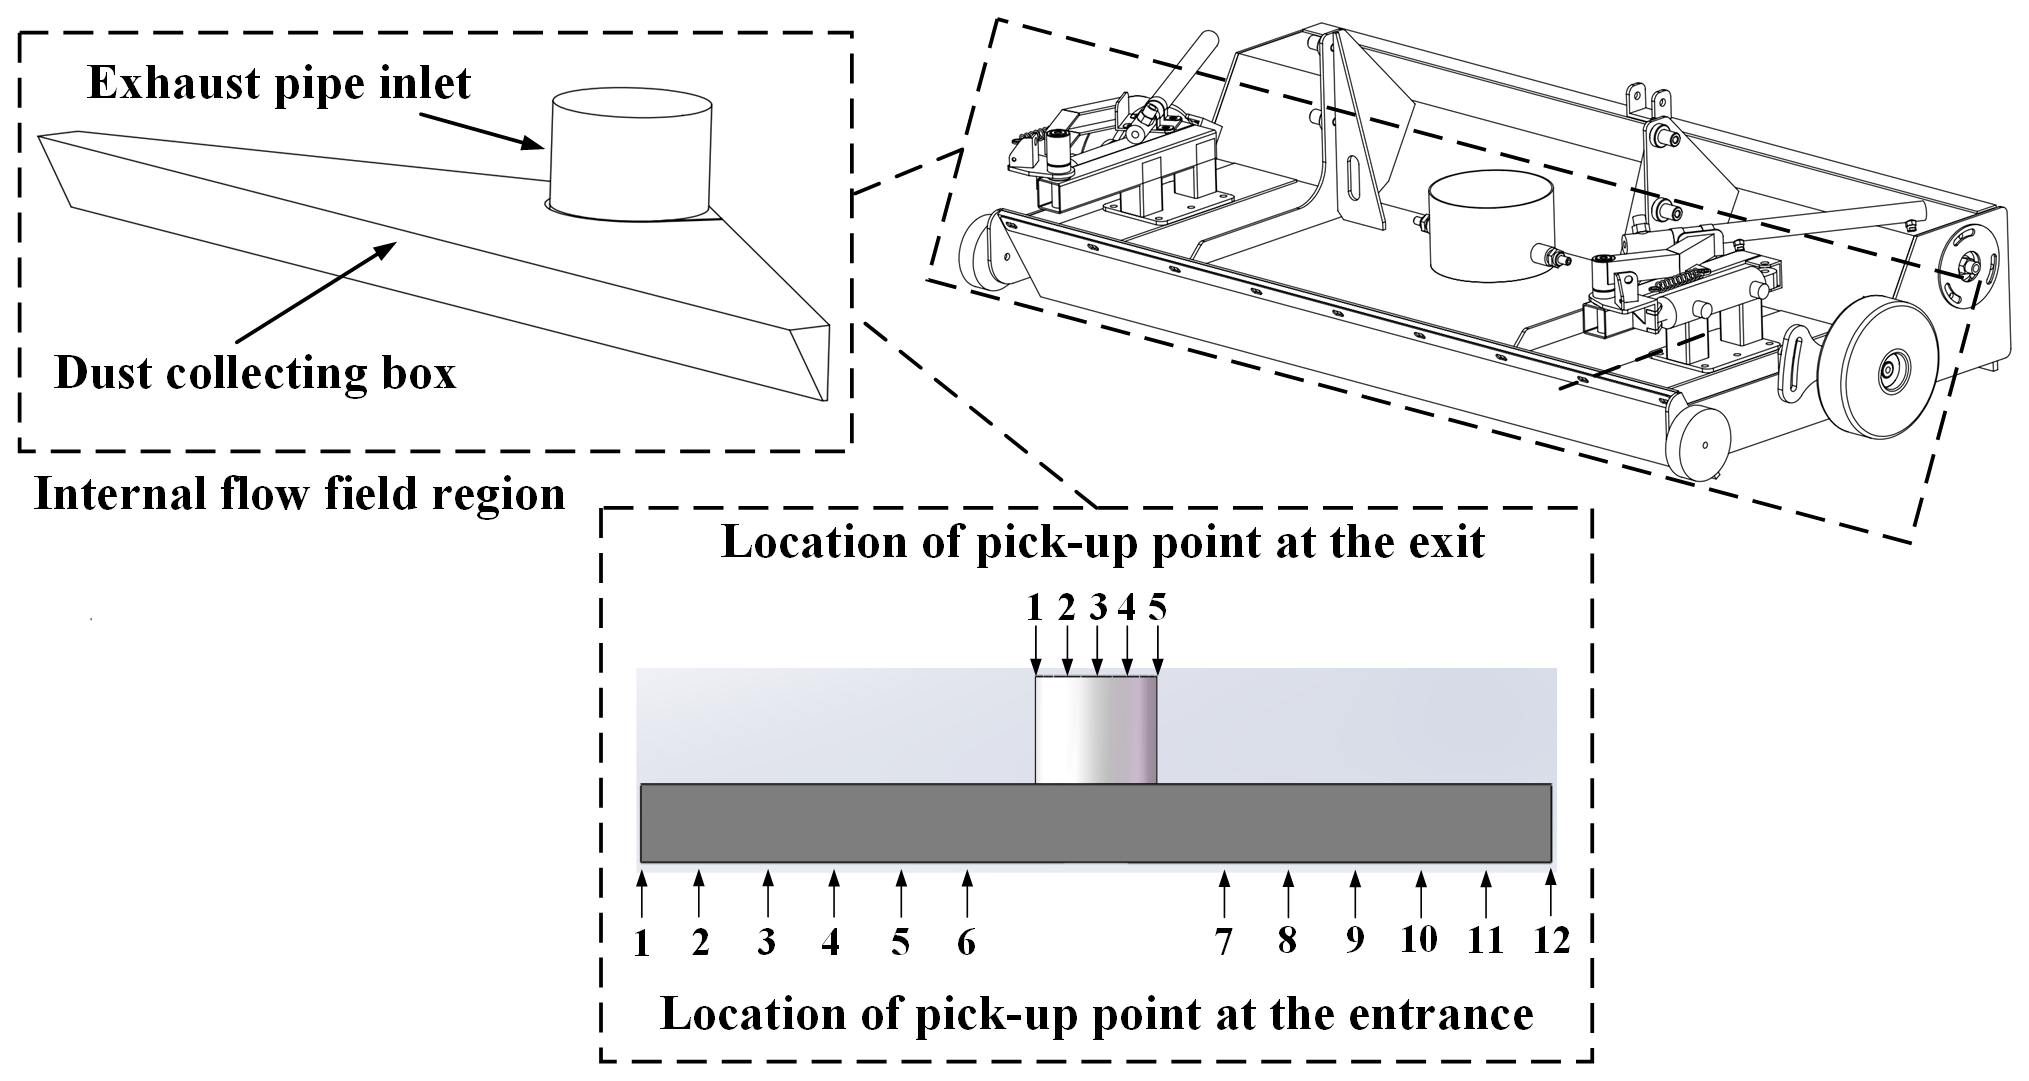
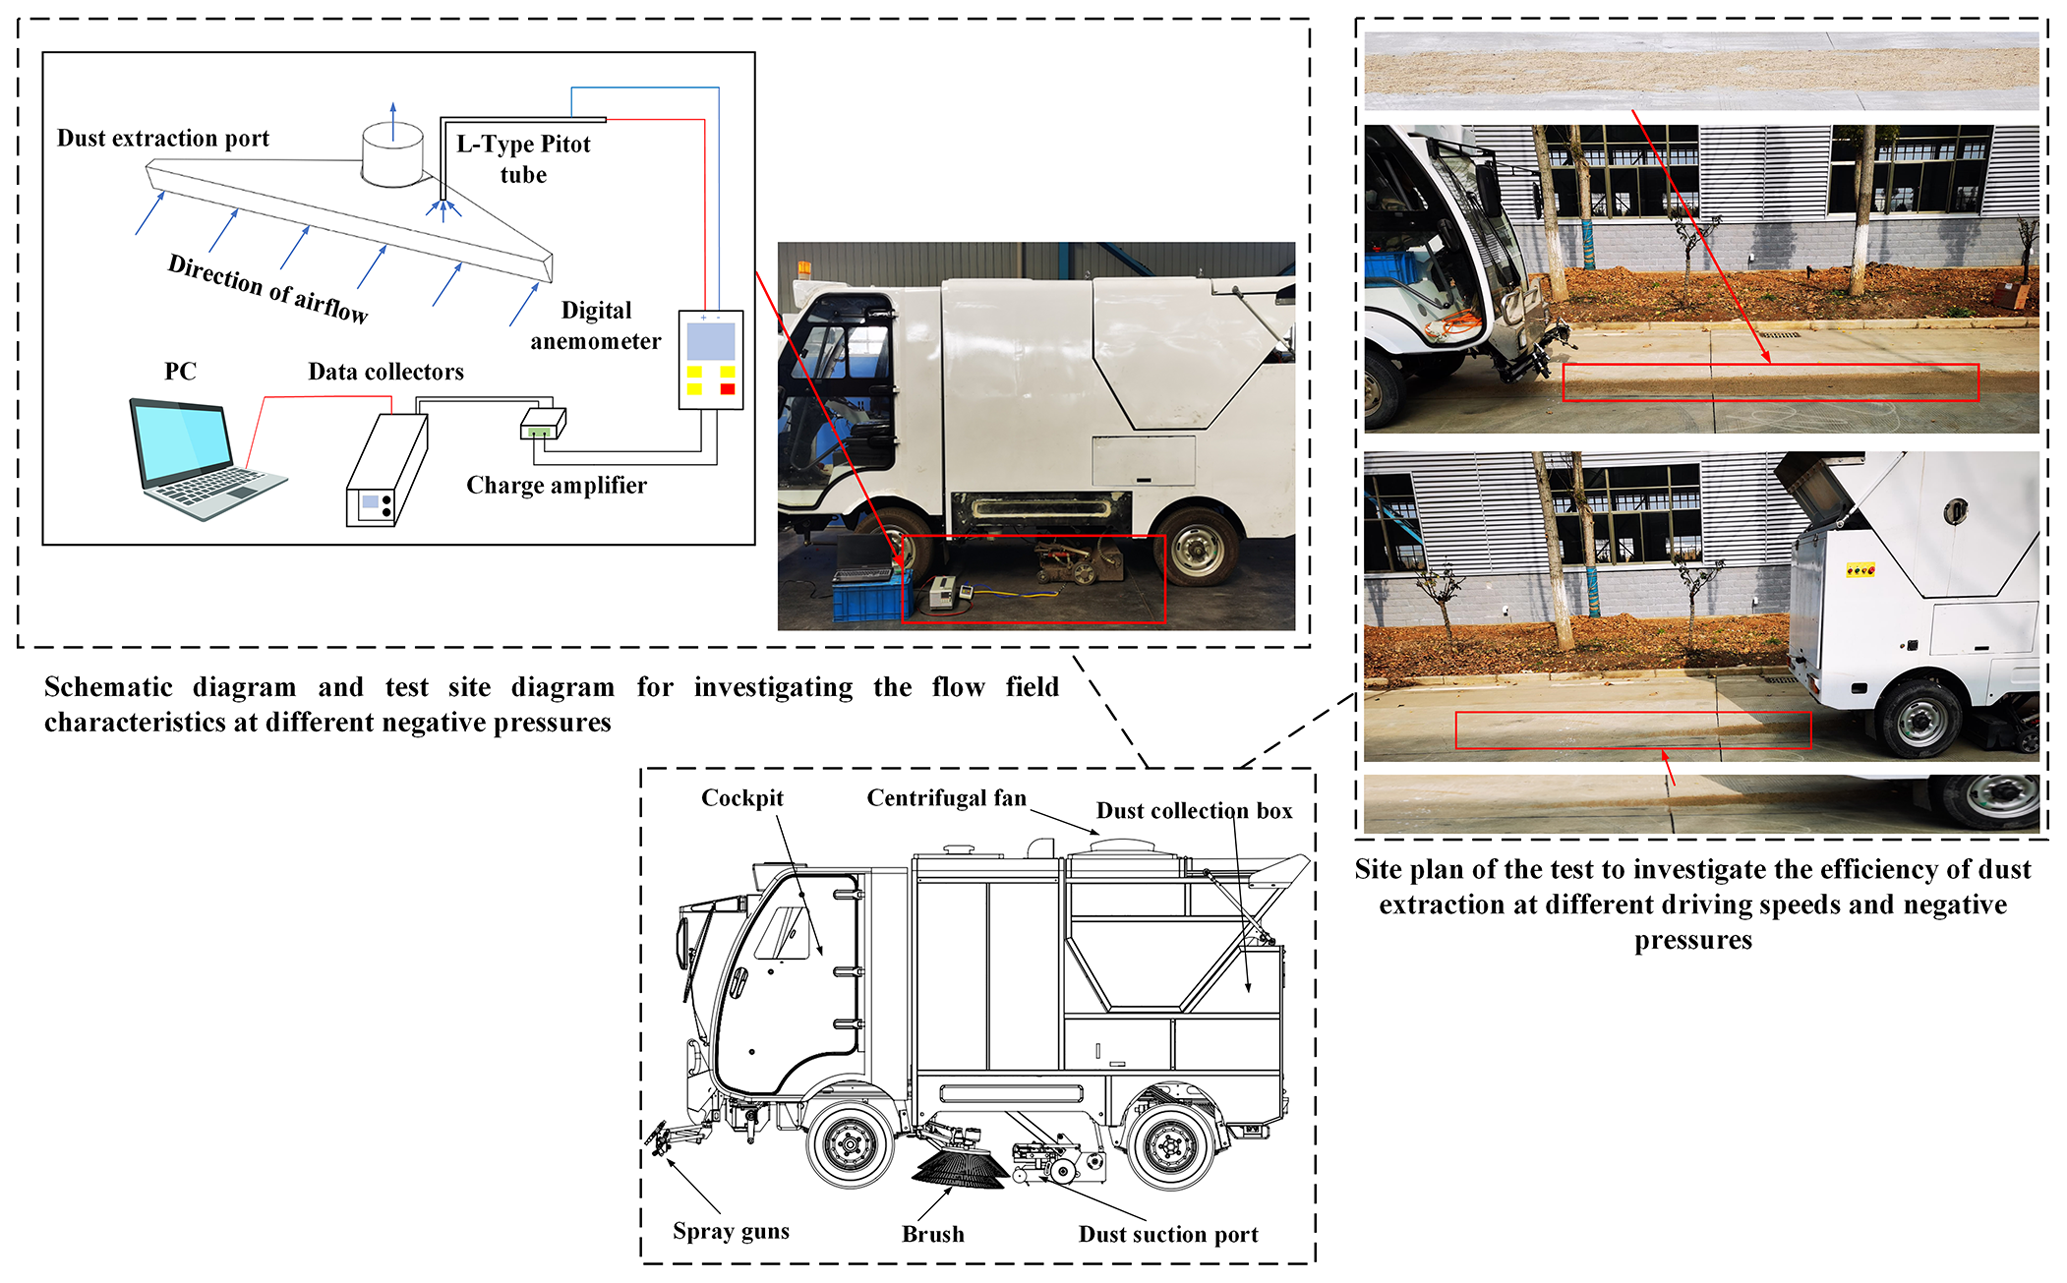
Figure 8 shows the physical diagram of the S26 sweeper and the test site. In the investigation of the flow field characteristics, the suction port needs to be connected to the corresponding test equipment, so the flow field characteristics in the driving condition cannot be measured, and only the flow field characteristics under different negative pressures are investigated here. When investigating the flow field characteristics under different negative pressures, the test uses the DP1000-IIIB digital pressure anemometer with an L-type pitot tube; the charge amplifier uses the WS-2401 charge, voltage, filter and integral four-function amplifier; and the data acquisition instrument is the WS-5931N/N240204. Before the test to investigate the dust suction efficiency at different driving speeds and negative pressure, 14 kg of dust on the road was weighed, and the distribution density of dust particles was about 0.15 kg m−2, thus simulating a more serious dust load on the road (Xi et al., 2016b). After the test, the dust collected in the bin was weighed to determine the dust extraction efficiency. To ensure the reliability of the tests, each set of tests was repeated three times in both parts of the test, and the average value was taken as the final result.
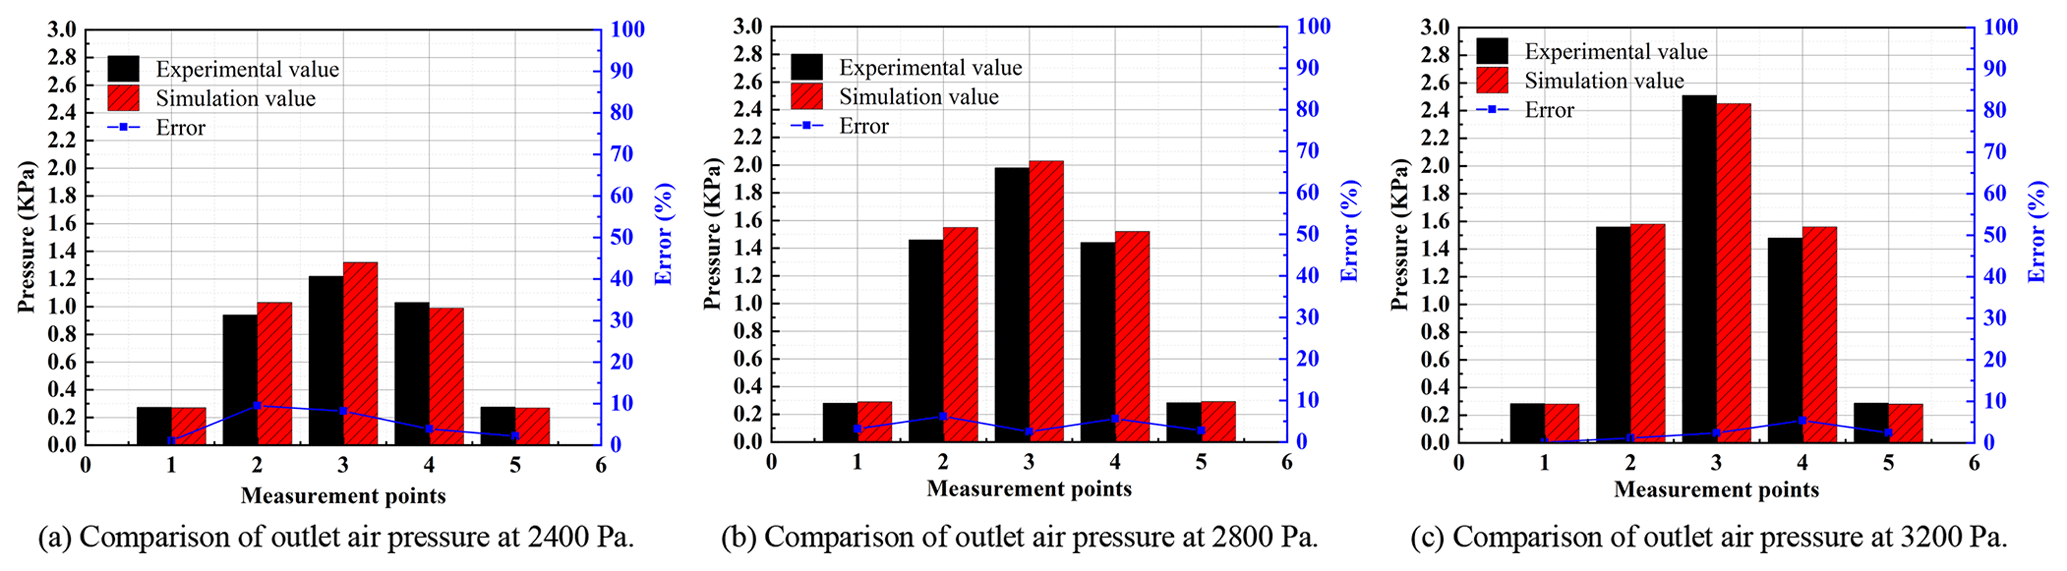
Figure 9Simulation and test comparison of outlet air pressure at different negative pressures.
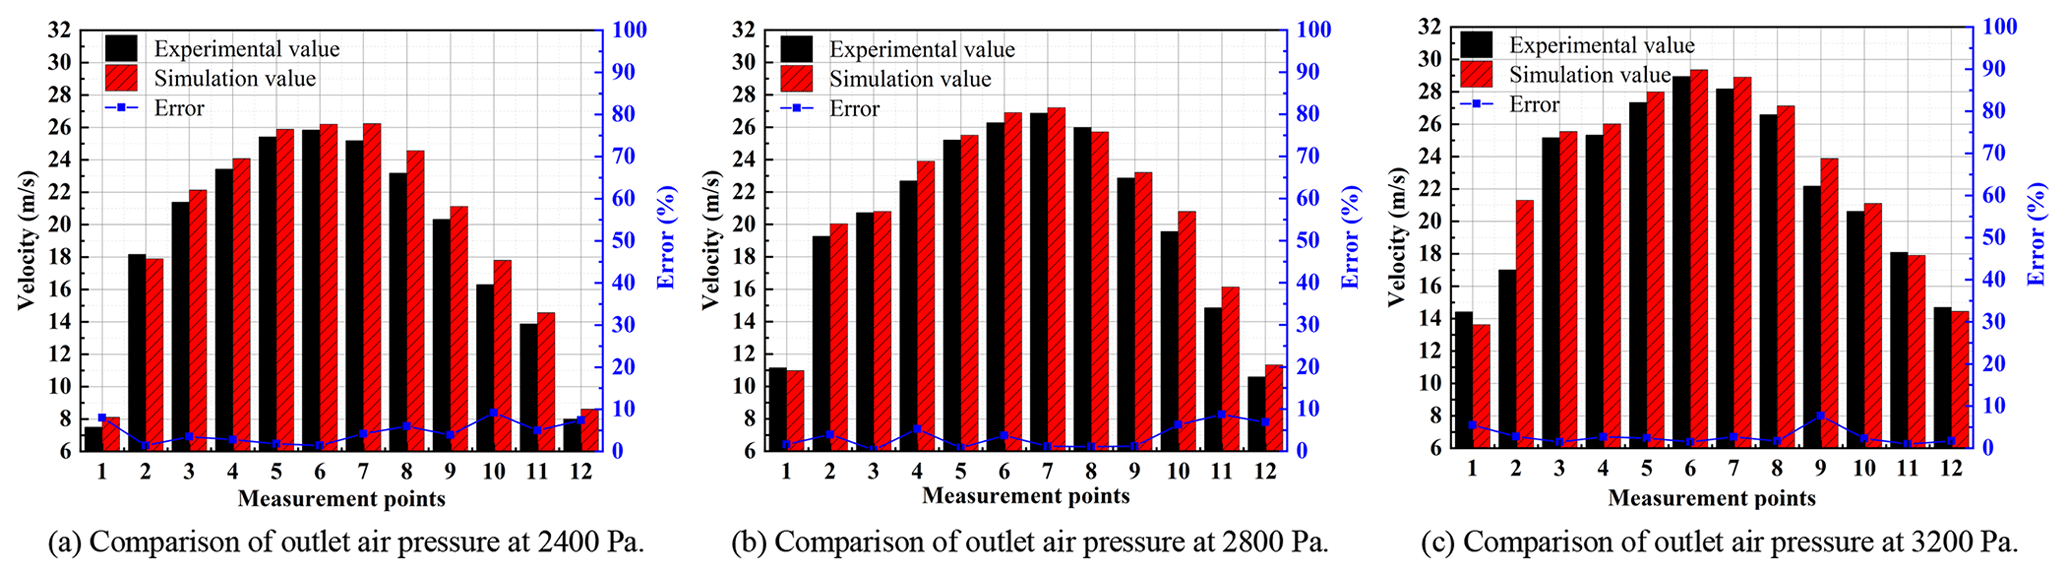
Figure 10Simulation and test comparison of inlet air velocity at different negative pressures.
Figure 9 gives a comparison between the simulated and experimental outlet wind pressure under different negative pressures. As can be seen from the figure, the trend of the simulated results is basically the same as that of the experimental results, with the wind pressure in the centre of the outlet area being greater than that in the edge area. The maximum error between the simulated data and the experimental data is 9.5 %, which is within the allowable error range of 10 % mentioned in the literature (Yuan et al., 2020a). Figure 10 gives a comparison between the simulated and experimental inlet wind speed at different negative pressures. The maximum error is 9.2 %, which is also within the allowable error range of 10 %. The main reason for the error here is that the positions of the measurement points in the simulation do not exactly coincide with the positions of the measurement points in the test, thus causing deviations.

Figure 11Comparison of simulated and experimental dust extraction efficiency at different driving speeds and negative pressures.
Figure 11 gives the simulation results and test comparison of the vacuum efficiency under different driving speeds and negative pressures. It can be seen from the figure that under the same negative pressure, the vacuum efficiency tends to decrease as the driving speed increases. Under the same driving speed, the greater the negative pressure, the greater the dust suction efficiency. The maximum error is 6.6 %, again within the allowable error range of 10 %. The main source of error is that the initial settings of the particle phases in the CFD simulation are ideal, whereas these conditions are always changing during the test. In addition, the road surface and the inner wall of the suction port are set to be smooth and slip-free in the simulation, but in reality they are rough, which does not allow for a realistic simulation of the collision between the particles and the inner wall. Through the above comparison test, it can be seen that the maximum error in the flow field characteristics and dust extraction efficiency is within the permissible range, which means that the simulation results are feasible.
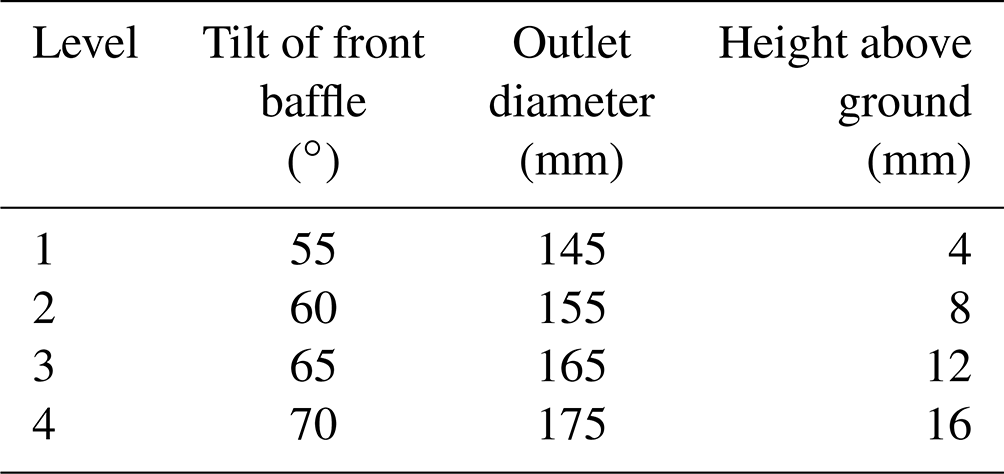
The “orthogonal test design” method is a way to select the optimal combination of test factors (Yang et al., 2021). From the above study, it is clear that the simulation results for the dust extraction port are feasible, so the simulation results will approximate the effect of the real operation of the equivalent dust extraction port. Under normal operating conditions, the height h of the dust extraction opening above the ground also has an effect on the dust extraction effect of the sweeper. Therefore, the influence of three important structural parameters on the sweeping performance is investigated by means of an orthogonal test design: the front flap inclination angle β, the outlet diameter d and the height h above the ground.
3.1 Design parameter variables
The parameters β, d and h were chosen as design variables, and there were a large number of combinations of parameters between them, so representative partial combinations were selected for testing from the full range of tests. The design variables were selected to have the same span values, while h was generally controlled to be within 20 mm (Ye et al., 2022). Therefore, the L16(43) orthogonal test table was chosen here. For each of the three factors, β, d and h, four equally spaced levels were used, and each of the four levels is shown in Table 2.
3.2 Objective function and calculation results
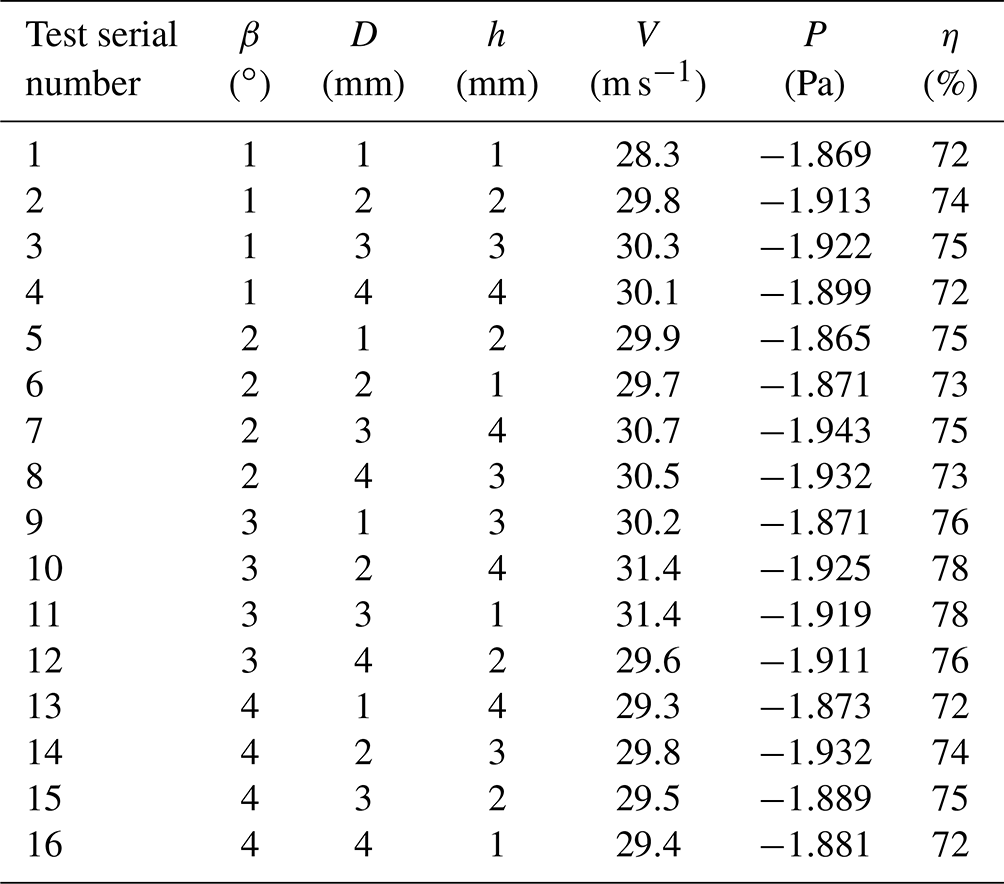
The objective function is used to evaluate the dust suction performance of the dust suction port under different combinations of parameters (Xia et al., 2016). When evaluating the dust suction performance, both the dust suction efficiency and the flow field characteristics of the dust suction port need to be considered. The dust suction efficiency η is calculated from Eq. (4): the larger the η, the greater the dust suction capacity. The greater the forward air velocity V and the lower the pressure at the exhaust inlet P, the lower the energy loss and hence the greater the suction capacity. The results of the simulation are shown in Table 3.
3.3 Range analysis
The range analysis is an intuitive method of analysing orthogonal experimental designs by calculating the R value (the value of the range of a factor) to reflect the magnitude of the effect of changes in the level of the factor on the range of the objective function (Yu et al., 2022b). The greater the R, the greater the effect of the number of levels selected under the factor on the index and also to determine the optimal level situation and thus the optimal combination. The specific range analysis is shown in Table 4, which reflects the degree of influence of each parameter on the objective function.
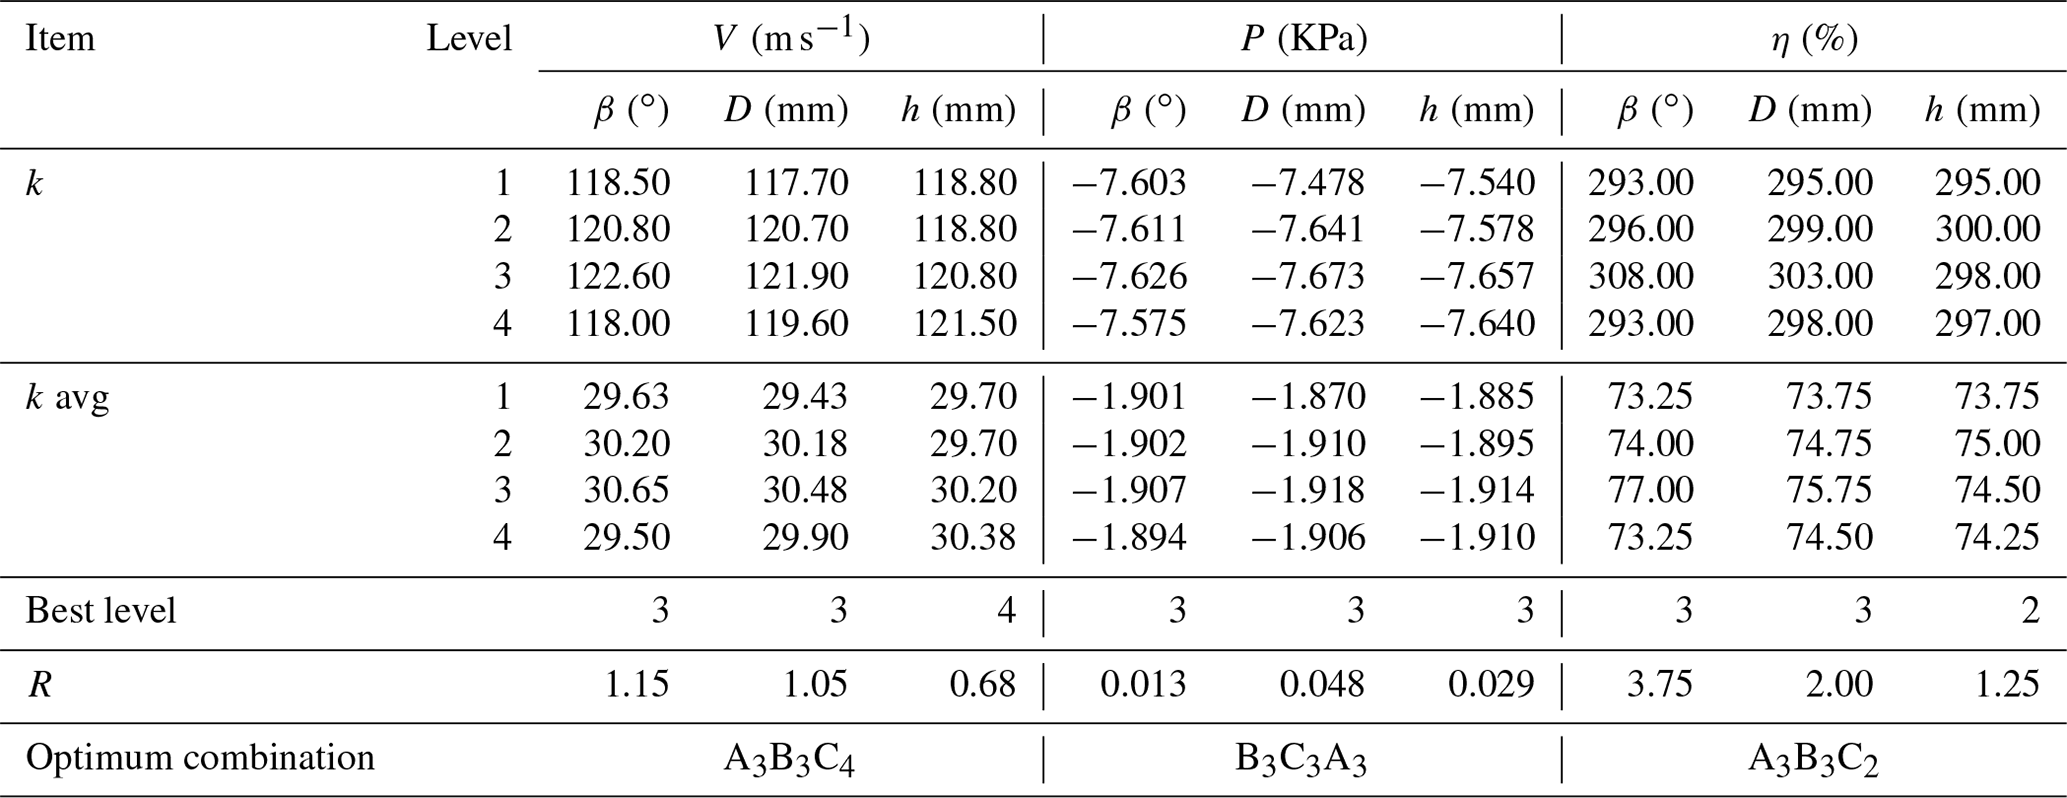
From the range analysis table it can be seen that for forward air surface velocity, combined with a comparison of the magnitude of the R values, factor A (front baffle inclination) is the optimum factor, followed by factor B (exit diameter) and finally factor C (height above ground). Therefore, the order of influence is factor A > factor B > factor C. For the exhaust inlet pressure, factor B (outlet diameter) is the optimum factor, followed by factor C (height above ground) and finally factor A (front baffle inclination), in order of influence: factor B > factor C > factor A. For the suction efficiency, factor A (front baffle inclination) is the optimum factor, followed by factor B (outlet diameter) and finally factor C (height above ground), in order of influence: factor A > factor B > factor C.
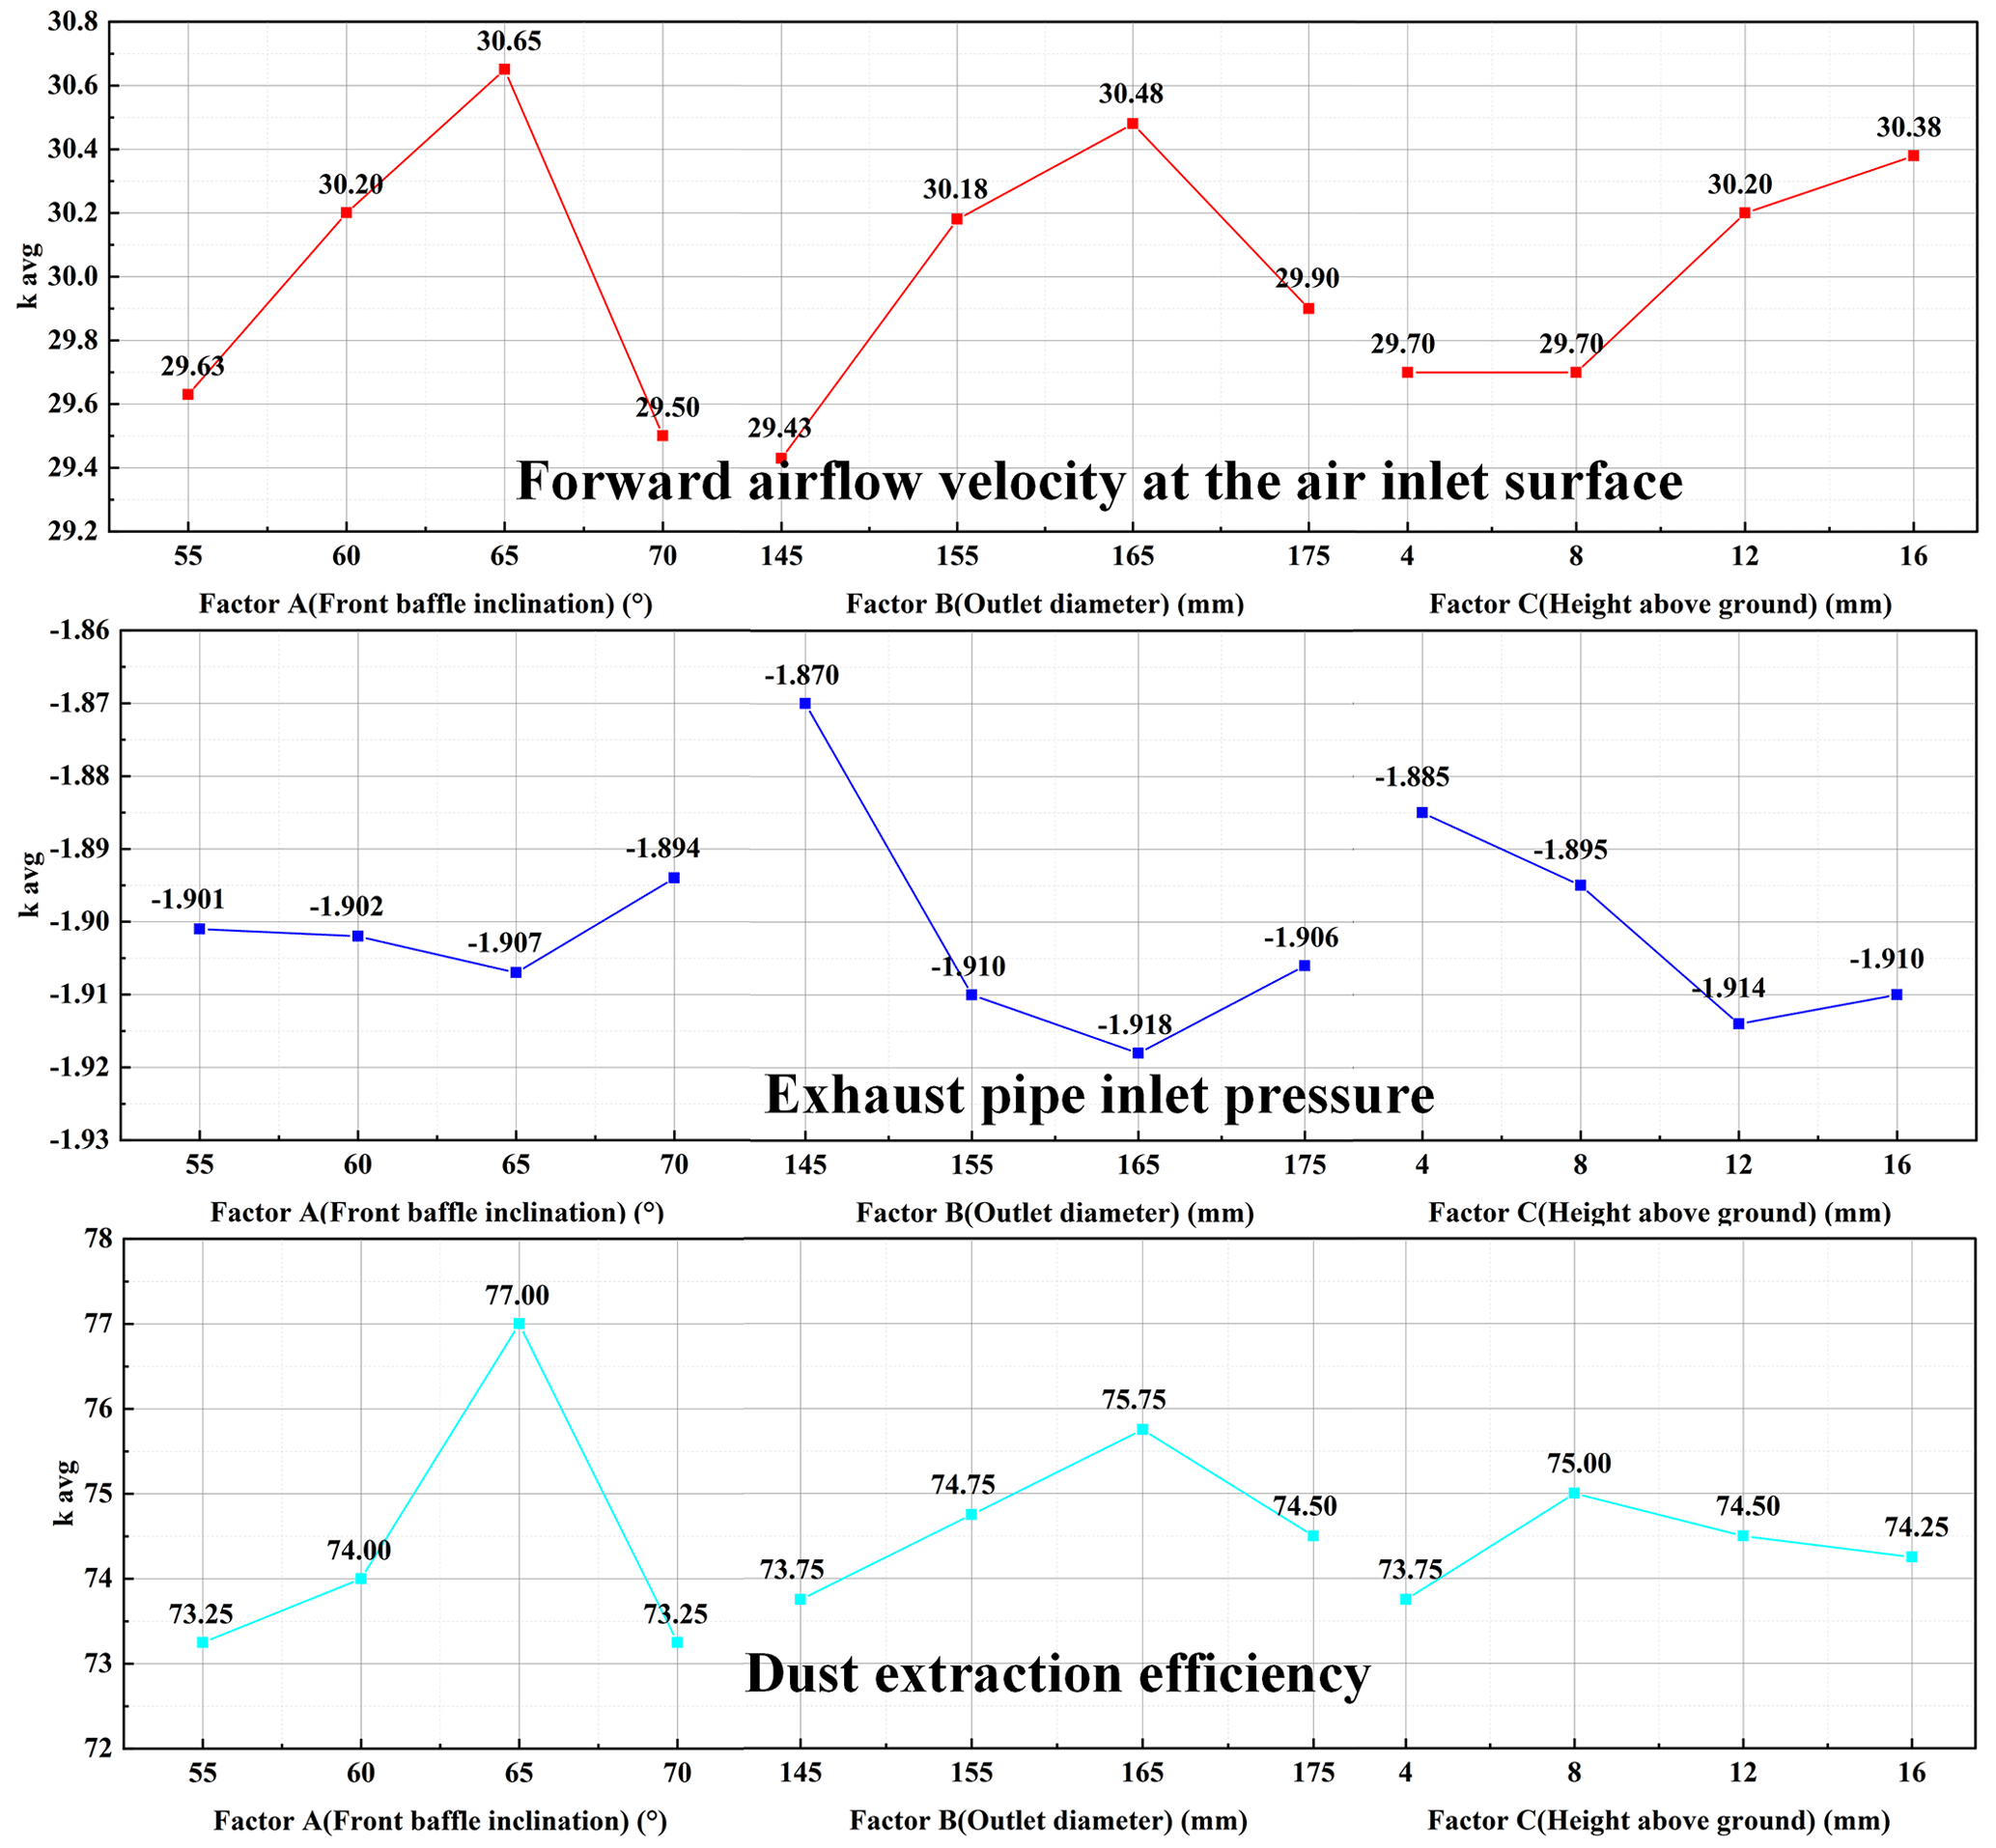
Figure 12 gives a graph of the average value of each level of the factors, from which the optimum level for each factor can be visualized. For the forward air surface velocity, factor A is optimal at the third level of front baffle inclination, i.e. 65∘; factor B (outlet diameter) is optimal at the third level, i.e. 165 mm; and factor C (height above ground) is optimal at the fourth level, i.e. 16 mm. For the exhaust inlet pressure, factor A is optimal at the third level of inclination of the front baffle, i.e. 65∘; factor B is optimal at the third level of the outlet diameter, i.e. 165 mm; and factor C is optimal at the third level of height above the ground, i.e. 12 mm. For suction efficiency, factor A is optimal at the third level of inclination of the front baffle, i.e. 65∘; factor B is optimal at the third level of outlet diameter, i.e. 165 mm; and factor C is optimal at the second level of height above the ground, i.e. 8 mm.
Combining Table 4 with Fig. 12, it can be seen that for the forward air surface velocity, A3B3C4 is the optimal combination of parameters. For the exhaust inlet pressure, B3C3A3 is the optimal combination of parameters. For suction efficiency, A3B3C2 is the optimal combination of parameters. The above analysis determines the optimal solution for the influence of a single-objective function, and it is not possible to select a comprehensive performance for multiple objective functions. Therefore, the following is a neural network to fit multiple influence factors and multiple objective functions, and the whale algorithm is used to find the optimal solution.
Neural networks have a strong non-linear fitting capability and can be used to fit problems where the relationship between the objective function and the influencing factors cannot be expressed directly in mathematical functional equations (Lin et al., 2021). In traditional test data collection processes, input and output data are obtained through extensive physical testing. However, for the dust suction port structure in this study, the cost is extremely significant. The above study has demonstrated that the error between the simulation data and the experimental data is within a reasonable range. This suggests that the simulated data can be used as a substitute for the experimental data. Therefore, here a BP neural network is fitted with the simulated data using the orthogonal test design data set described above.
The neural network model diagram is shown in Fig. 13, which mainly includes an input layer, a hidden layer and an output layer, with data transfer between two adjacent layers in the form of weight transfer (Egrioglu et al., 2019). This neural network is a two-layer feedforward network with s-shaped hidden neurons and linear output neurons (fitnet), which can fit a multidimensional mapping problem well given consistent data and sufficient hidden layer neurons (Zhang et al., 2018). The network is trained using the Levenberg–Marquardt backpropagation algorithm (trainlm), using mean squared error (MSE) as the loss function. Before starting to fit, the model divides the input samples into a training set, a validation set and a test set according to . The training set is input to the neural network during the training process and is adjusted for error. The validation set is used to measure the level of generalization of the network, and training is stopped when the level of generalization no longer improves. The test set evaluates the network performance independently during and after training (Y. Wang et al., 2022).

4.1 Sample training and evaluation
The front baffle inclination, exit diameter and ground clearance height are used as inputs, and the results of the objective function simulation in Table 3 are used as outputs. Before fitting, the input data also need to be normalized to eliminate fitting errors due to differences in magnitudes and also to prevent large data from assimilating small data (Wang et al., 2016). The normalization method is as follows:
where is the value of the ith input data after data normalization, Xi is the original value of the ith input data, Xmin is the minimum value of the input data set and Xmax is the maximum value of the input data set.
4.2 Number of neuron nodes in the hidden layer
The choice of the number of nodes in the hidden layer neurons is crucial (Yu et al., 2022a), with too few nodes leading to underfitting. On the contrary, for a training set with insufficient information, too many nodes will lead to overfitting (Yu et al., 2021). Therefore, the optimal number of nodes in the hidden layer should be selected, taking into account the fitting effect and operational efficiency.

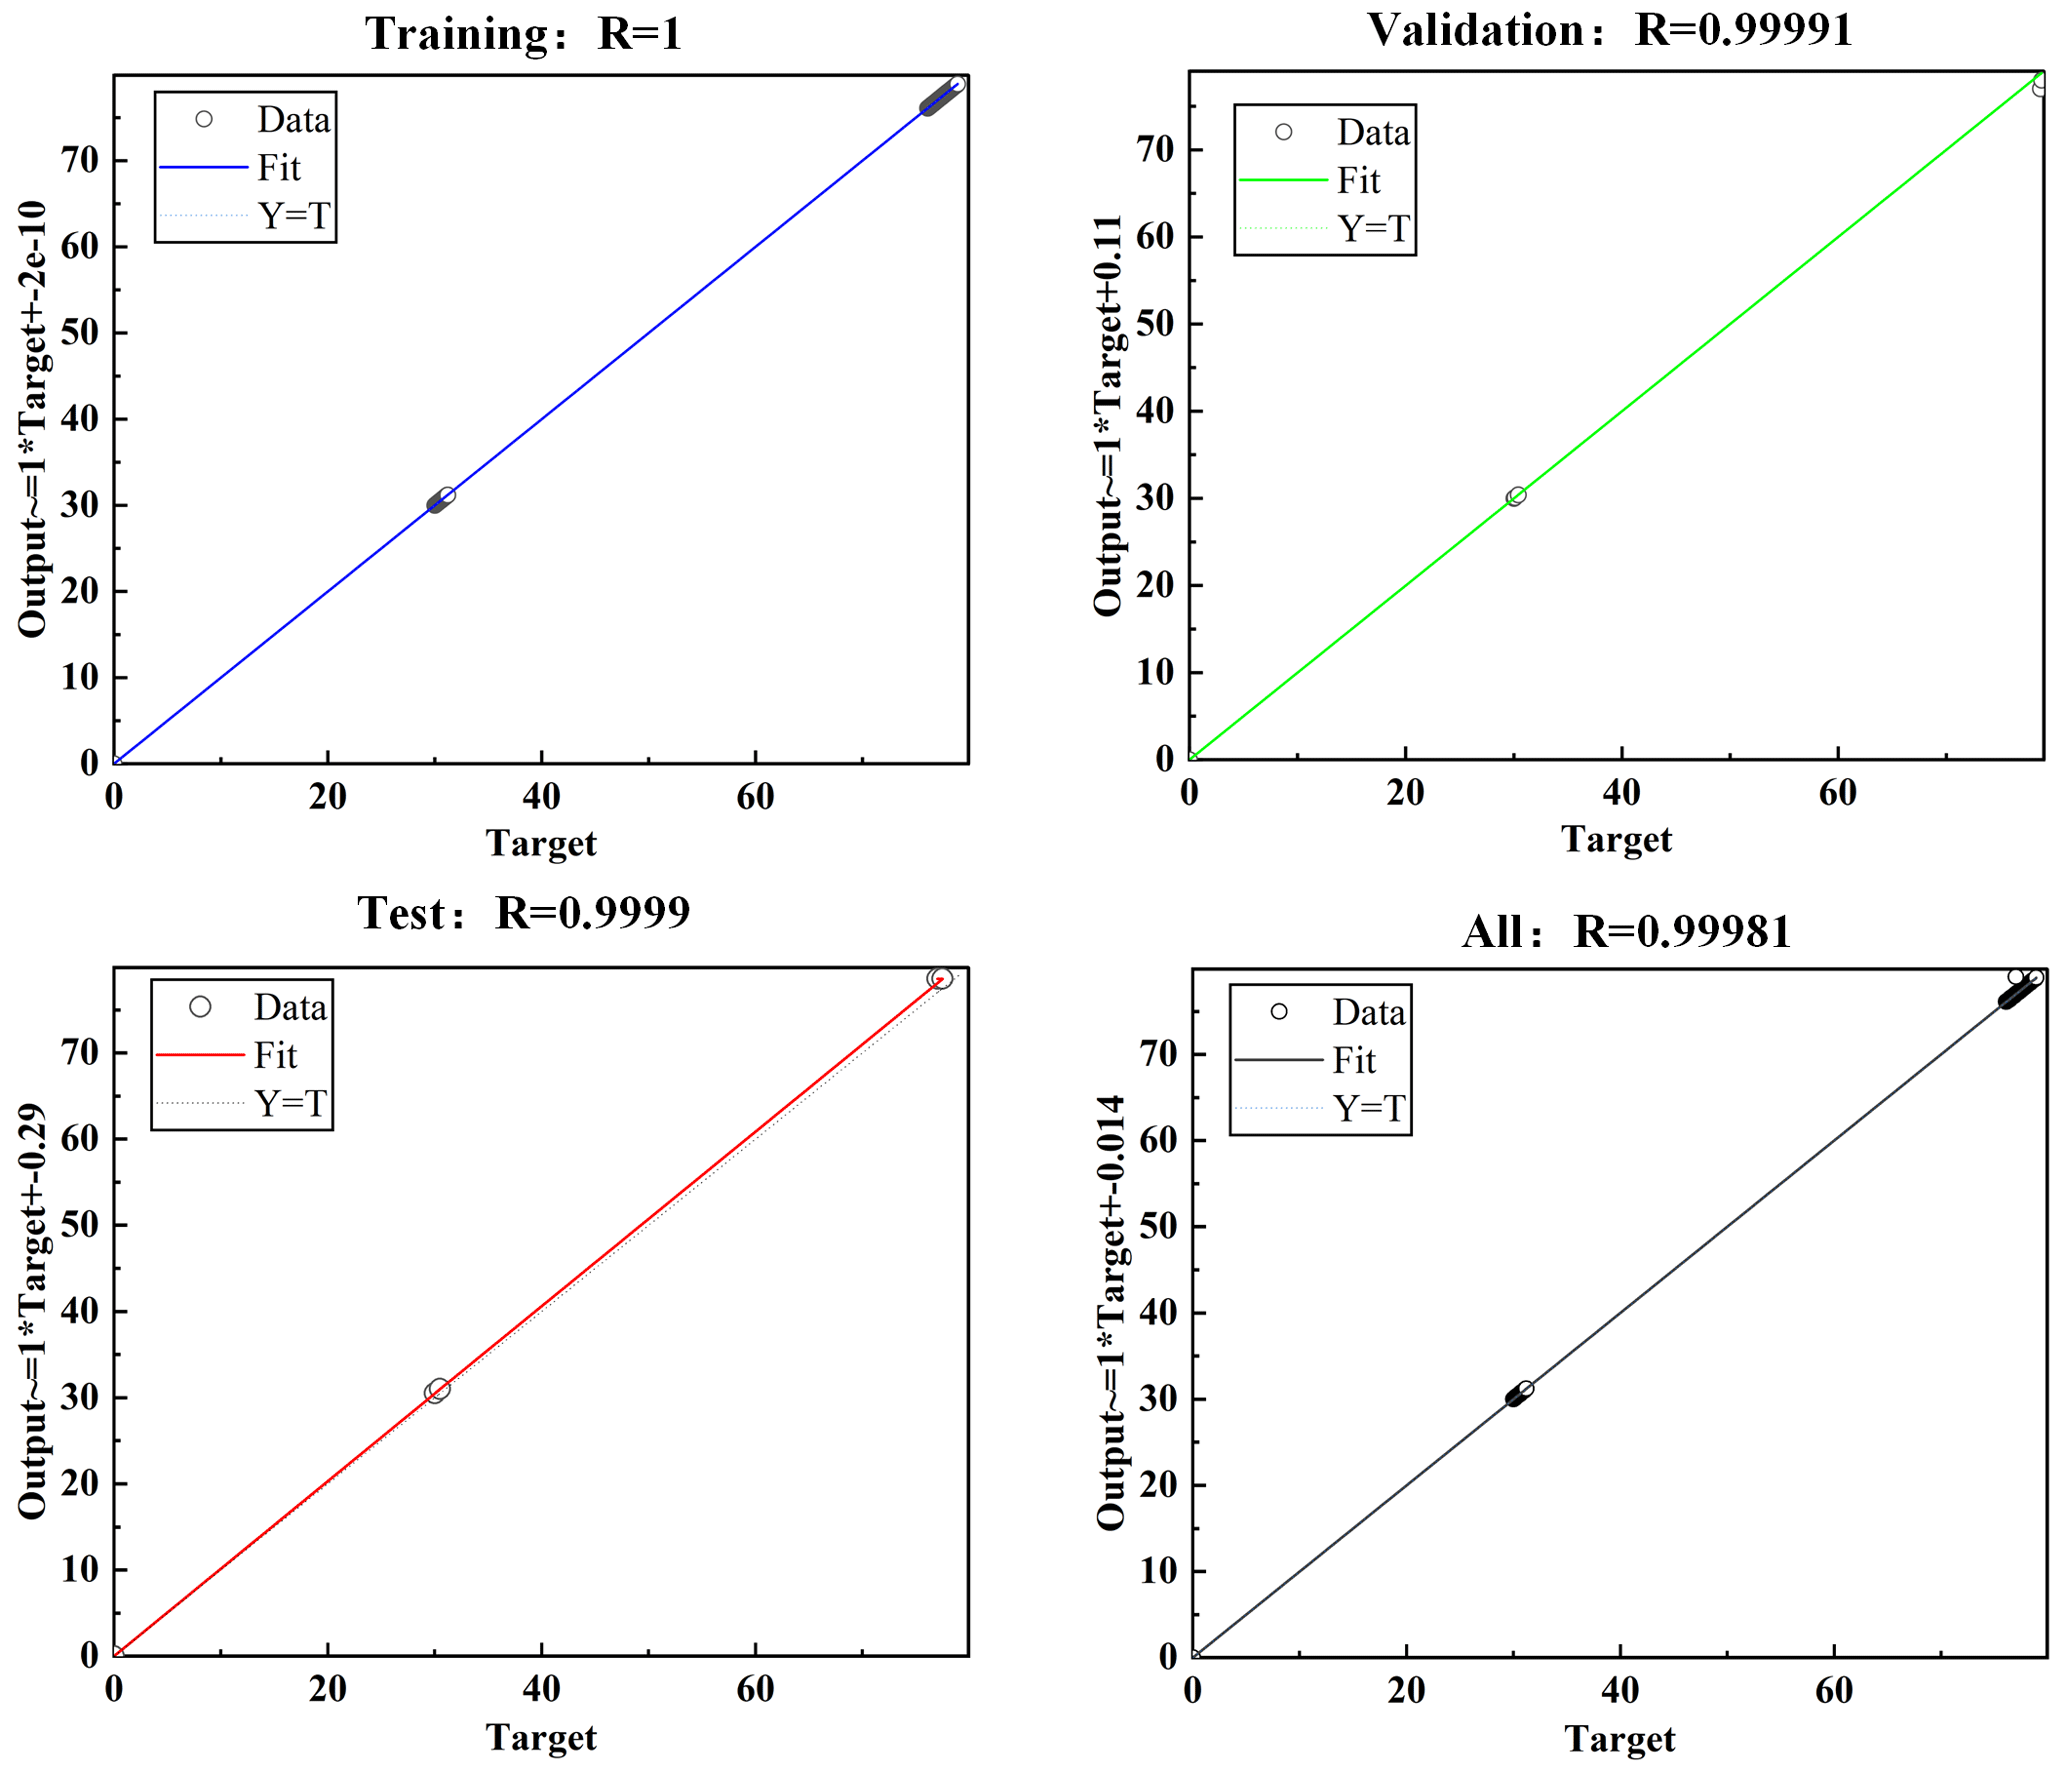
A comparison of the errors for different numbers of nodes is given in Table 5, from which it can be seen that the actual error is smallest at for a number of nodes of 10. Therefore the best fit is achieved when the number of nodes is taken as 10. A graphical representation of the regression curve is given in Fig. 14, which shows how the output compares to the training target, the validation target and the test set target. For an ideal fit, the data should fall along a 45∘ angle, and the output and target should be equal, ideally with R=1. As can be seen from the graph, the R value for the training set is 1, the R value for the validation set is 0.99991, the R value for the test set is 0.9999 and the overall R value is 0.99981, which shows a good fit between the predicted and target outputs.
4.3 Fitting results compared to test model
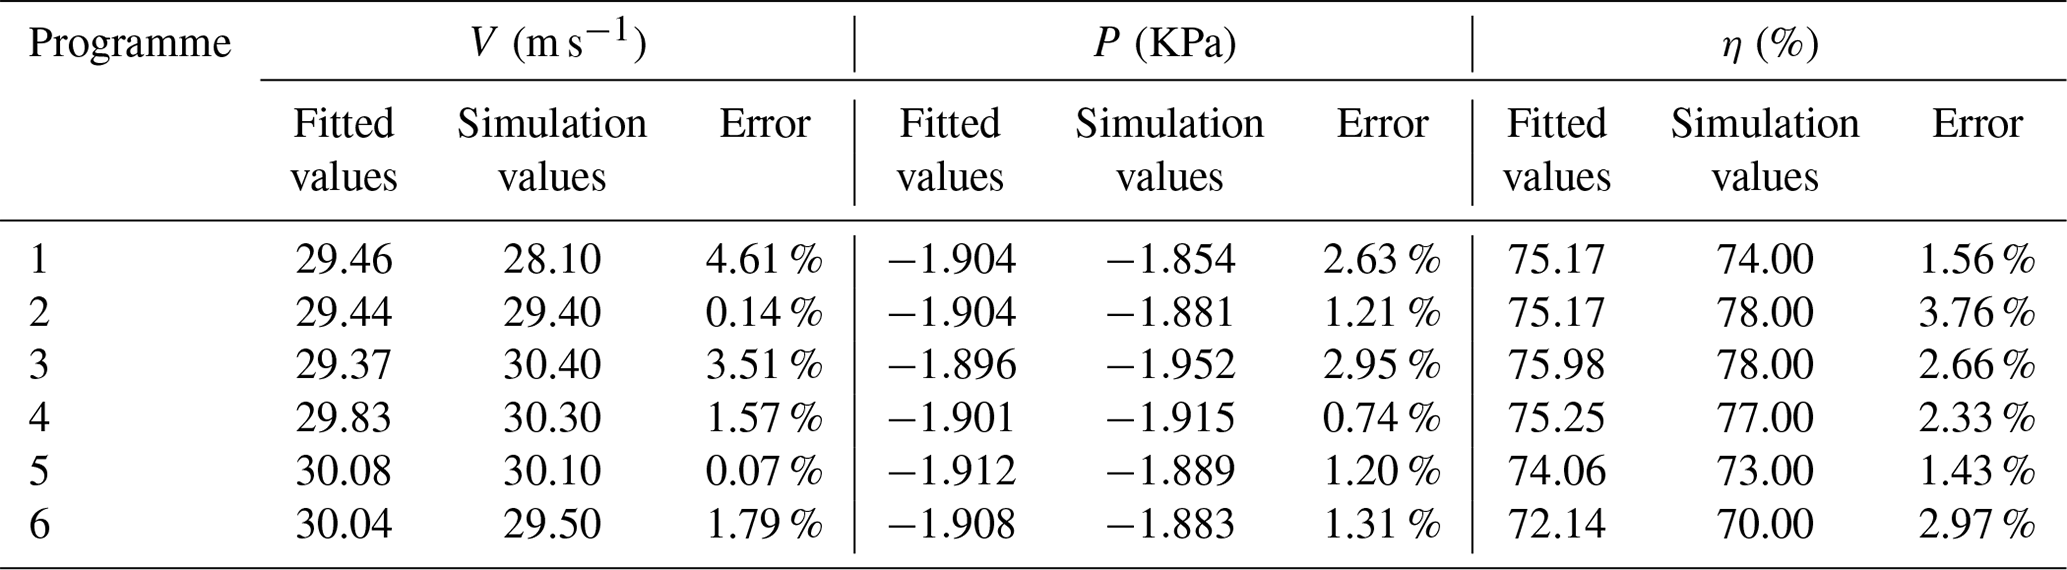
In order to further illustrate the fitting accuracy of the approximate model, six groups of parameters were randomly selected to establish the test model, and the test model was simulated and calculated according to the above simulation method. The simulation results were compared with the fitting results, and the results are shown in Table 6. From Table 6, it can be seen that the fitting errors of the six groups of test models are all within 5 %, which is within the acceptable range for engineering. It further illustrates the high fitting accuracy of the approximation model, which can be used for the subsequent optimization of the whale algorithm.
Based on the above BP neural network outputs V, P and η, the optimal structural parameters need to be further solved. The solution of these parameters is a multi-objective optimization problem, which cannot be solved by traditional optimization methods. Therefore, this paper converts the multi-objective problem into a single-objective optimal problem by constructing the fitness function E. Finally, the fitness function is solved by the whale optimization algorithm (WOA) to find the optimal solution. The specific expressions are as follows:
where η is the suction efficiency, V is the forward airflow velocity and P is the exhaust inlet pressure.
5.1 WOA optimizes processes
The WOA is an intelligent optimization algorithm that mimics the feeding behaviour of whales in nature, with each whale position representing a feasible solution. The algorithm has a simple structure, few adjustment parameters and a high level of optimization-seeking capability. The standard WOA simulates the whale's unique search and seizure mechanism, which consists of three key stages: prey seizure, bubble netting and prey search. Before using the WOA to solve the problem, the above three types of predation need to be expressed in mathematical formulations (Guo et al., 2022).
-
Prey roundup. The WOA assumes that the current best candidate solution is the target prey or the location closest to the optimal solution and that after the optimal location is defined, other locations will approach the optimal location. The mathematical expression for the location update is
where X∗(t) is the current optimal solution position, D is the distance between the current individual whale and the current optimal solution, X(t) denotes the current position, t denotes the number of iterations, and A and C are coefficient variables.
A and C are given by the following equations, with a decreasing linearly from 2 to 0 during the iteration; r is a random vector on [0, 1].
-
Bubble net predation. The position update between whale and prey during bubble net predation is expressed by the logarithmic spiral equation, with the following expression:
where D′ is the distance between the ith whale and its prey, b is the logarithmic spiral shape constant, and l is a random number on [−1, 1].
The whale approaches its prey by contracting the envelope while spiralling upwards, so the WOA assumes a random choice between contracting the envelope and spiralling upwards with 50 % probability, thus updating the whale's position. The mathematical expression is as follows:
where p is a random number on [0, 1].
-
Searching for prey. In addition to the bubble net method of predation, randomly searching for prey is a viable option for enhancing WOA explorability. In this case, the whales no longer update their position according to the current optimal prey but update according to the randomly selected whales. That is, distance D is updated randomly when . The individual whale will then deviate from its original target prey in order to search for it, which in turn will improve its predation ability, which will result in a certain global search performance of the WOA. The mathematical expression is as follows:
where Xrand(t) is the current position of the random whale individual.
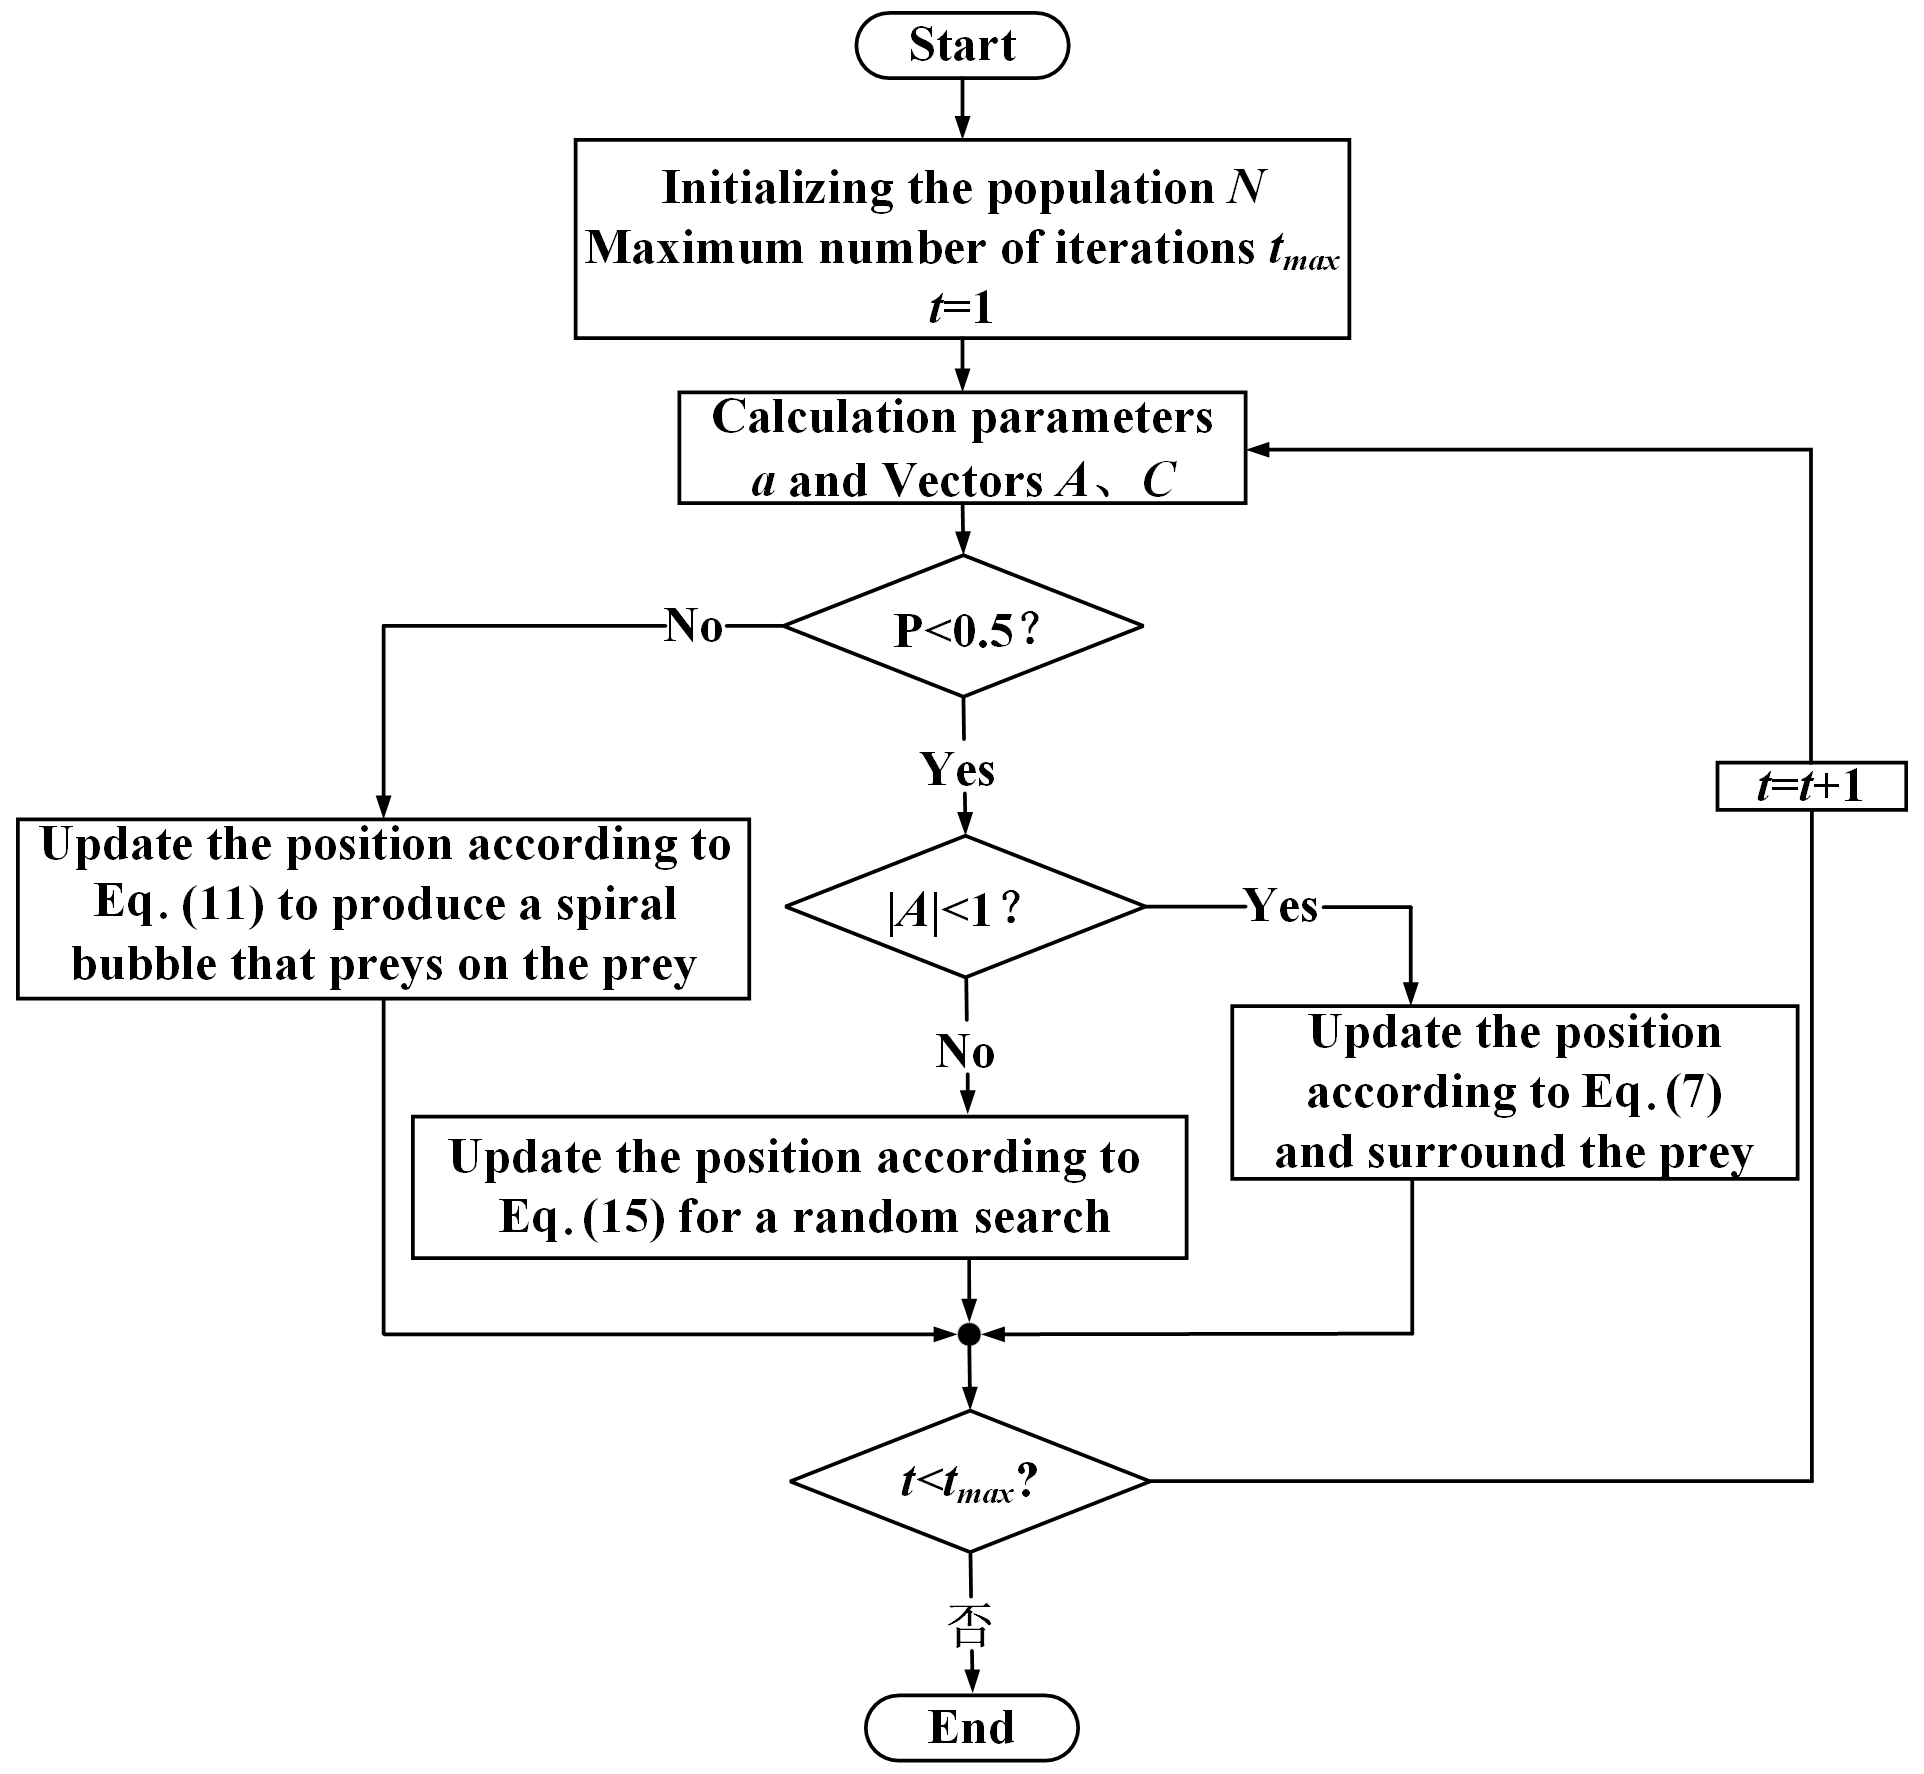
In order to more clearly express the standard WOA calculation process described above, a flow chart of the standard WOA calculation is given in Fig. 15.
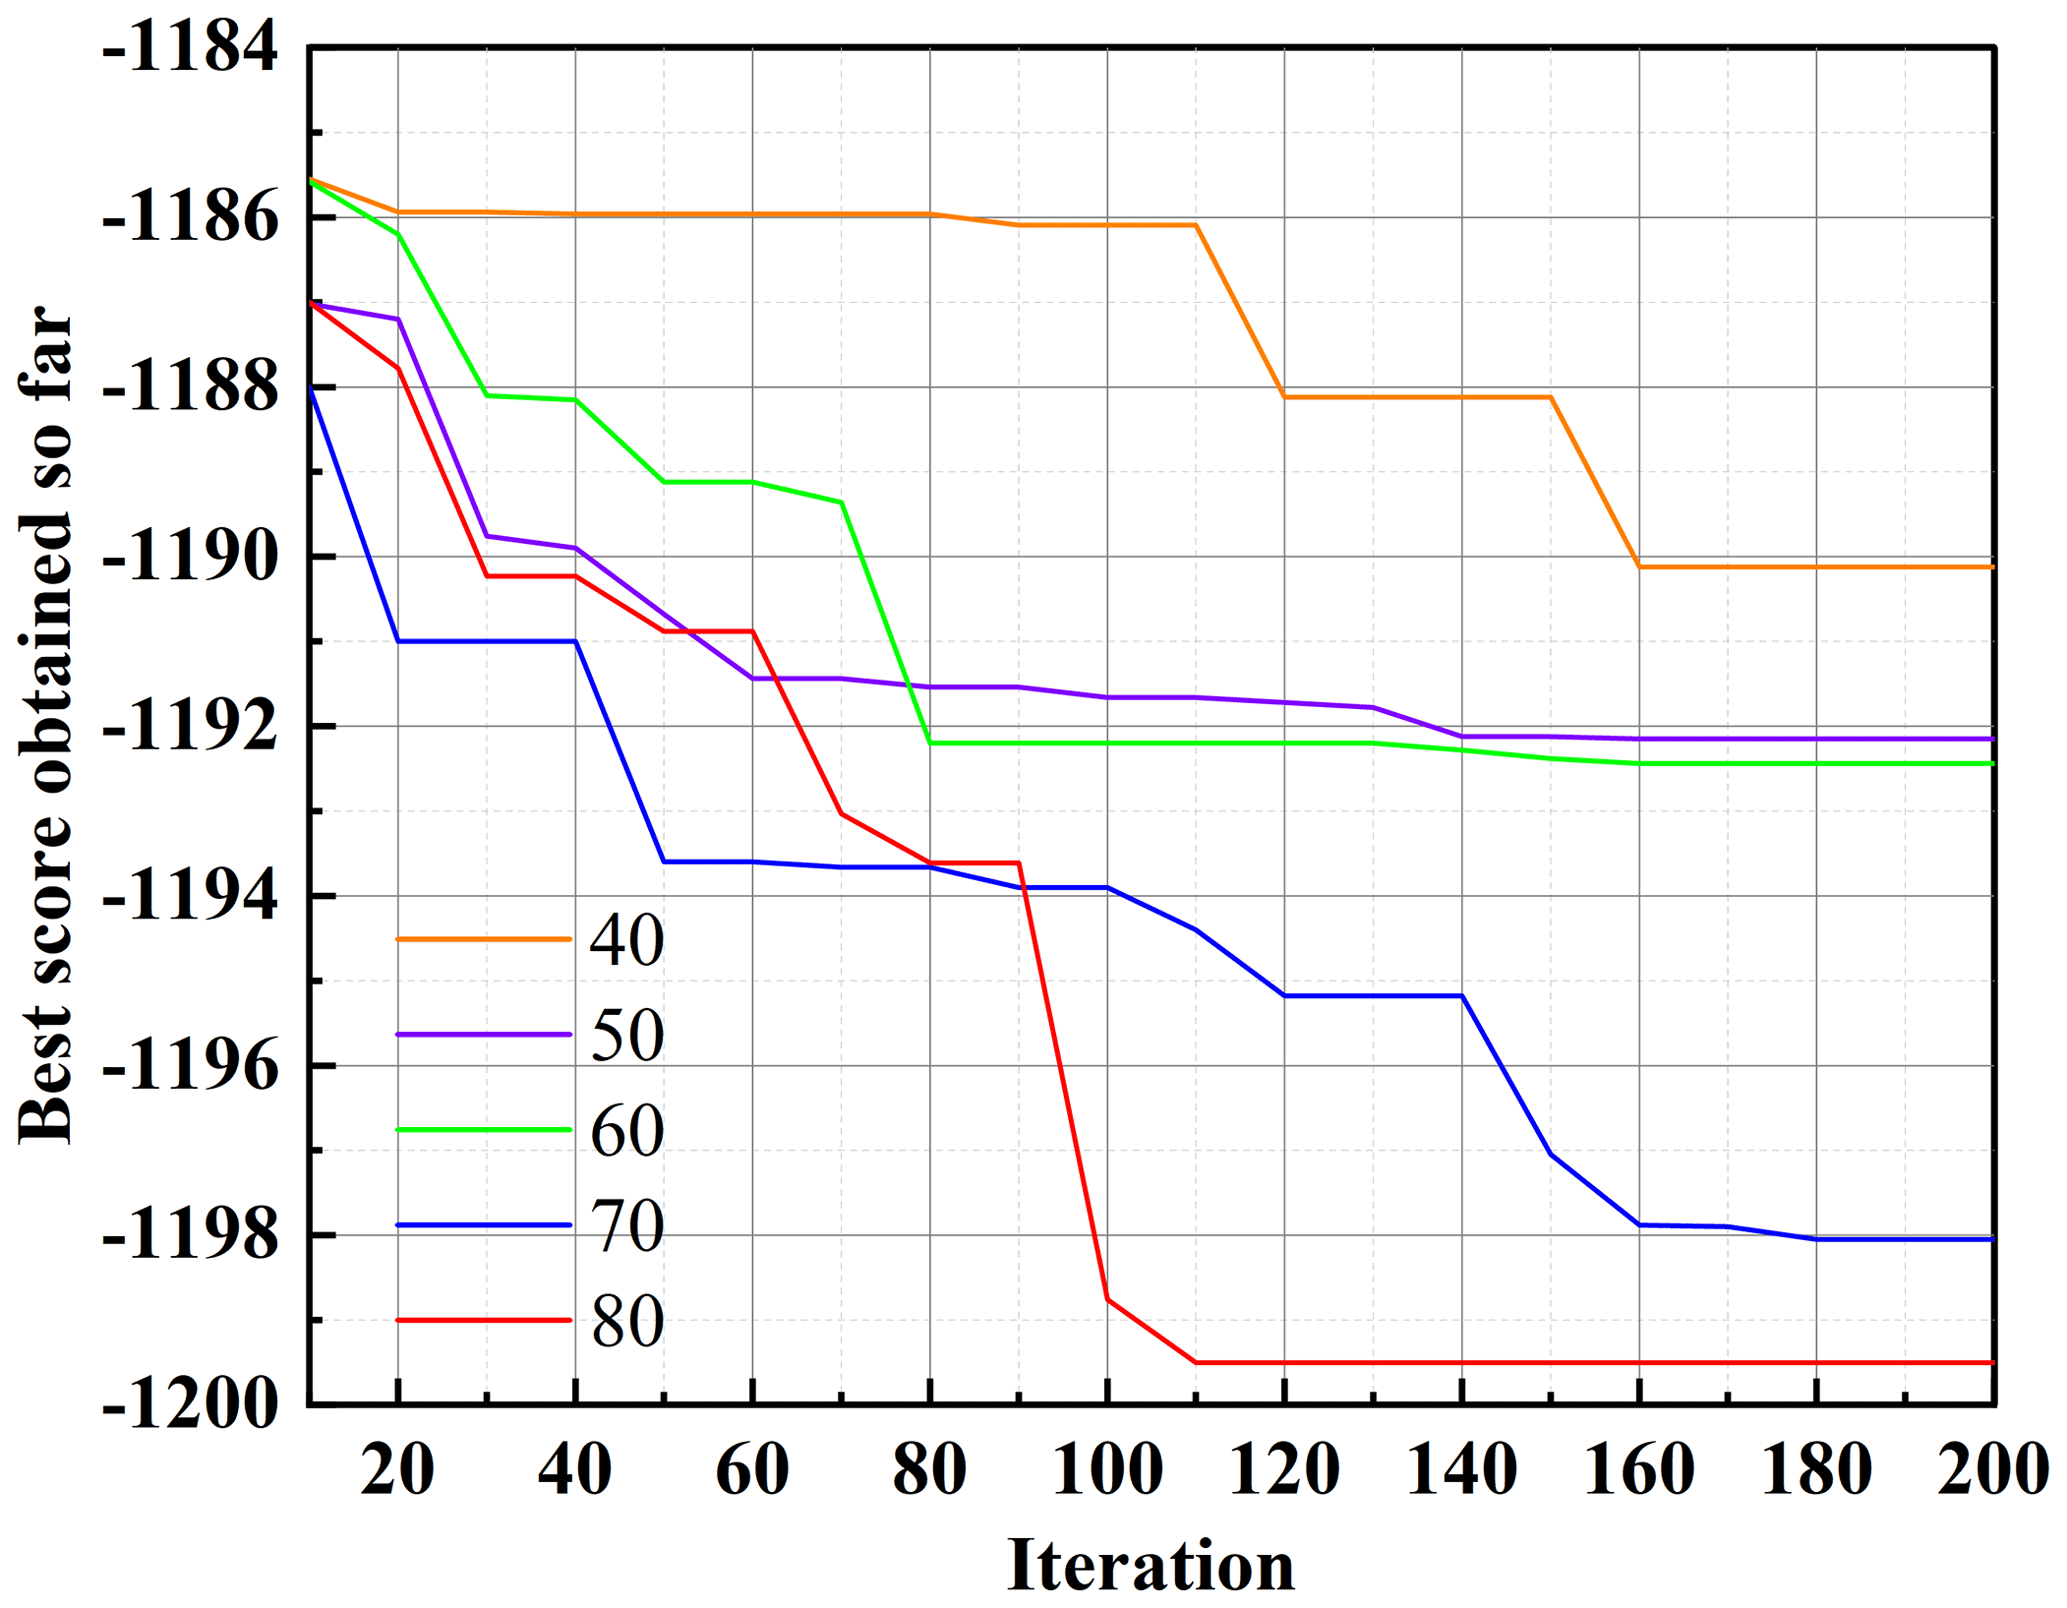
During the calculation, both the number of populations N and the maximum number of iterations tmax have an impact on the results. Figure 16 shows the effect of changing the number of populations on the fitness function E when the maximum number of iterations is the same. When tmax is large enough to be 200, the fitness function tends to decrease when N is changed and eventually converges in all cases. When N=80, E changes to a minimum value of −1199.5, which is smaller than the minimum value of E in other cases, and the accuracy also meets the requirements. After considering various factors, the best result is obtained when N=80 is taken. The best combination of parameters at this point is β=63∘, D=168 and h=12 mm.
5.2 Comparison of optimization results
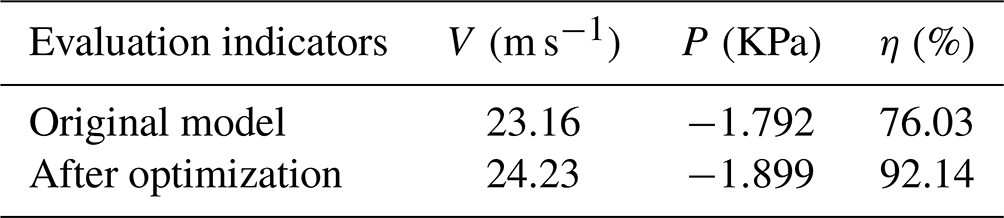
The optimum combination of parameters obtained above was simulated, and the simulation results were compared with the original model simulation results. The results are shown in Table 7. The dust extraction efficiency η was increased by 16.11 %, a large variation, which may be produced by the change in height h above the ground. The airflow velocity V at the front inlet surface increased by 1.07 m s−1, and the exhaust inlet pressure P increased by 0.107 KPa. The small change is due to the fact that the flow field characteristics are related to the structural parameters, which did not change much with the optimized parameter combination compared to the original model parameters. From the comparison results it can be seen that the above optimization method is indeed feasible for the structural optimization of the dust suction outlet, and the optimized parameters obtained can improve the dust suction capacity.
Table 7Comparison of evaluation indicators before and after optimization.
A comparison of the flow field characteristics before and after optimization is given in Fig. 17, from which it can be seen that both the velocity and pressure of the airflow inside the optimized dust suction outlet have been increased. Figure 17a gives a comparison of the cross-sectional pressures, and it can be seen that the optimized pressure in the exhaust pipe is significantly better than the original model. The optimized inlet and outlet pressure loss Δp is 1869.45 Pa compared to Δp of 1989.31 Pa for the original model, indicating that the optimized suction port has a low energy consumption. Figure 17b gives a comparison of the near-ground airflow velocities, and it can be seen that the optimized near-ground airflow velocities are more uniform. The average velocity of the optimized near-ground airflow is 14.22 m s−1 compared to 13.21 m s−1 for the original model, indicating a reduction in airflow losses within the optimized suction port. In summary, the optimized airflow inside the dust suction port has an increased ability to carry particles, which in turn improves the dust suction capacity.

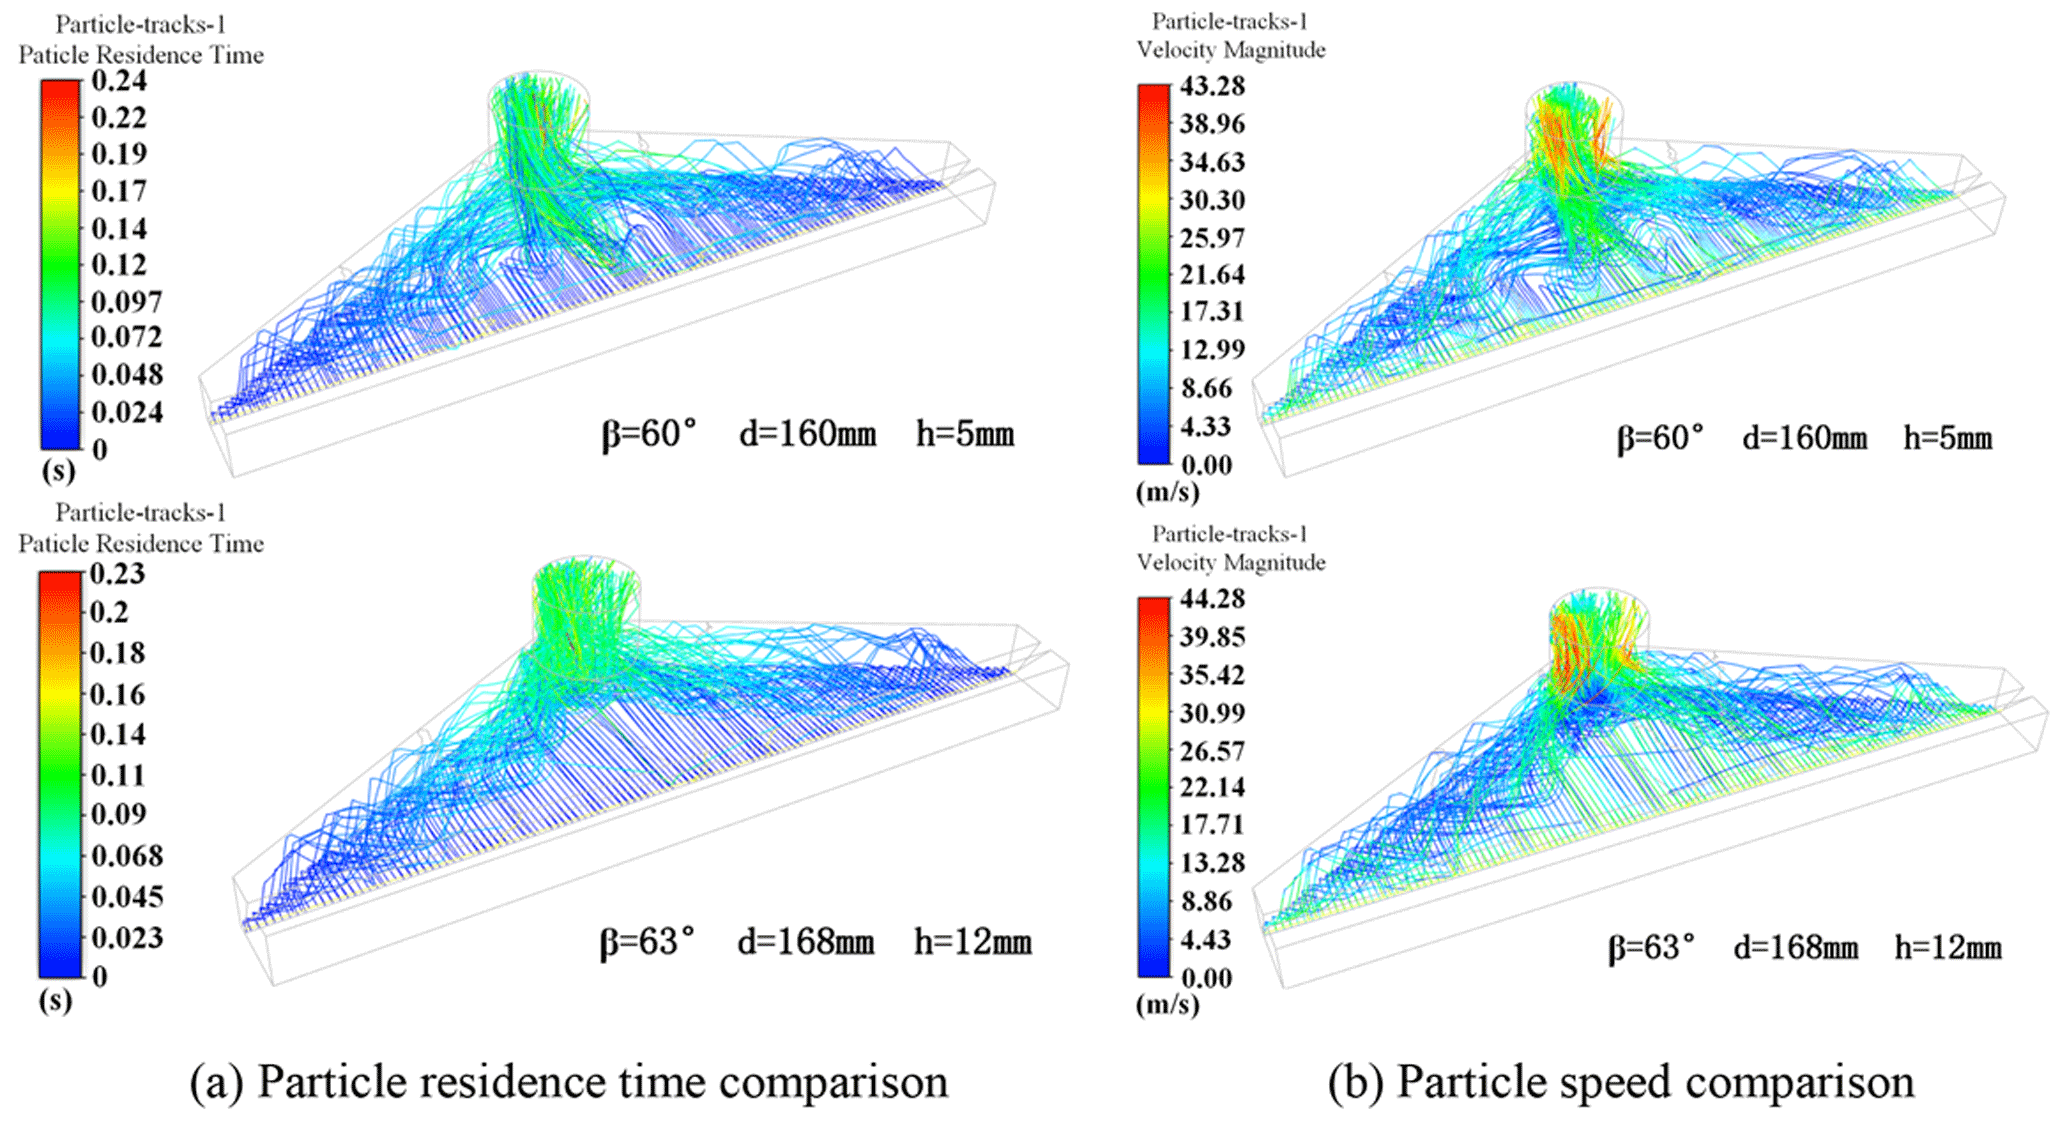
Figure 18 shows a comparison of the particle trajectories before and after optimization. The optimized particle trajectory is smoother, with particles colliding with the internal chamber of the dust collection box and still being picked up by the airflow. The velocity and residence time of the particle movement inside the dust suction port both reflect the particle trajectory inside the dust suction port. A comparison of particle residence times is given in Fig. 18a, which reflects the time from start to outflow of particles, and it can be seen that the optimized particle residence times become shorter. The shorter residence time indicates that the suction efficiency of the suction port has been improved. Figure 18b gives a comparison of the particle velocities, and it can be seen that the optimized particles become faster. A particle with too small a velocity will result in it not being able to overcome gravity and fall off, whereas the higher the particle velocity, the easier it will be to flow out of the outlet. The optimized model shows a slight increase in particle movement speed compared to the original model, as well as a shorter particle residence time. The particles flow out of the outlet more quickly, thus improving the suction effect.
Using the Ruiqing S26 pure electric sweeper as the research object, the CFD method is used to analyse the influence of the structural parameters of the dust extraction port and the height above the ground on the dust extraction effect of the sweeper, which cannot be solved by traditional optimization methods. This paper establishes a sample set through orthogonal tests, then uses neural networks to fit multiple influencing factors and multiple objective functions, and finally uses the whale algorithm to find the optimal solution. The specific conclusions are as follows:
-
There is a good correlation between the flow field characteristics and the dust extraction efficiency. The inclination angle β of the forward air surface and the outlet diameter D directly affect the internal flow field, and the size of the inclination angle affects the energy loss inside the dust extraction port; increasing the pipe diameter will reduce the along-route loss between the inlet and outlet, but too large a pipe diameter will offset the increased power and loss. The maximum error of the simulation result of the outlet air pressure under different negative pressures is 9.5 %, the maximum error of the simulation result of the inlet air speed under different negative pressures is 9.2 %, and the maximum error of the simulation result of the vacuum efficiency under different driving speeds and negative pressures is 6.6 %. The maximum error of the above simulation results is within the error tolerance of 10 %.
-
Using the extreme difference analysis of the orthogonal experiment, the optimal solution affecting the individual objective function is obtained: for the forward air surface velocity, A3B3C4 is the optimal combination of parameters; for the exhaust pipe inlet pressure, B3C3A3 is the optimal combination of parameters; and for the vacuum efficiency, A3B3C2 is the optimal combination of parameters.
-
The results of fitting the BP neural network to multiple influencing factors and multiple objective functions showed that the actual error was the smallest at for a neuron node number of 10, and the regression curves showed that all R values were within acceptable limits. Six sets of parameters were randomly selected to build the test model and were found to be within 5 % of the fitting error, indicating that this neural network fitted well.
-
The optimal combination of parameters is β=63∘, D=168 and h=12 mm. Based on the original model, V is increased by 1.07 m s−1, P by 0.107 KPa and η by 16.11 %. The inlet and outlet pressure loss Δp of the optimized model becomes smaller, indicating that the energy consumption of the optimized dust suction port is small. At the same time, the average velocity of the airflow near the ground is increased, which indicates that the airflow loss inside the optimized dust suction port is reduced. The optimized particle trajectory becomes smoother, where the particle velocity is slightly higher than in the original model, but the particle residence time is shorter than in the original model, and the particles flow out of the outlet more quickly, thus improving the suction effect.
Data can be obtained from the corresponding author upon request.
JP, HA, JW and YW oversaw validation, writing (review and editing), funding acquisition, visualization and resources. JY oversaw the methodology, software, formal analysis, data curation, and writing (original draft preparation).
The contact author has declared that none of the authors has any competing interests.
Publisher’s note: Copernicus Publications remains neutral with regard to jurisdictional claims in published maps and institutional affiliations.
The authors would like to acknowledge the financial support from the Major Science and Technology Special Projects in Anhui Province and the National Natural Science Foundation of China.
This research has been supported by the National Natural Science Foundation of China (grant no. 52005004) and the Major Science and Technology Special Projects in Anhui Province (grant no. 201903a05020061).
This paper was edited by Daniel Condurache and reviewed by two anonymous referees.
Bofu, W., Jinlai, M., and Jie, C.: Numerical study on particle removal performance of pickup head for a street vacuum sweeper, Powder. Technol., 200, 16–24, https://doi.org/10.1016/j.powtec.2010.02.001, 2010.
Egrioglu, E., Yolcu, U., and Bas, E.: Median-Pi artificial neural network for forecasting, Neural. Comput. Appl., 31, 307–316, https://doi.org/10.1007/s00521-017-3002-z, 2019.
Fayzullayevich, J. V., Tan, G. F., and Alex, F. J.: Numerical Study of Factors Affecting Particle Suction Efficiency of Pick-Up Head of a Regenerative Air Vacuum Sweeper, Processes, 10, 1252–1252, https://doi.org/10.3390/pr10071252, 2022.
Fu, P., Liu, L., and Yang, W.: Study on Structure Optimization of Feed Conveying Pipeline in Gas-Solid Two-phase Flow, Surf. Technol. (Chongqing, China), 50, 303–310 + 319, https://doi.org/10.16490/j.cnki.issn.1001-3660.2021.12.029, 2021 (in Chinese).
Guo, H., Fu, J., and Li, Z.: SVM parameters and feature selection were optimized based on improved whale algorithm, J. Jilin Univ., Eng. Technol. Ed., 1–22, https://doi.org/10.13229/j.cnki.jdxbgxb20211348, 2022 (in Chinese).
Hu, Z., Zhao, Q., and Wang, J.: The Prediction Model of Cotton Yarn Intensity Based on the CNN-BP Neural Network, Wirel., 102, 1905–1916, https://doi.org/10.1007/s11277-018-5245-0, 2018.
Jin, Y., Jiabao, P., and Hejin, A.: Relationship between flow field characteristics and dust collection efficiency of sweeper suction port, The J. Eng., 2022, 389–400, https://doi.org/10.1049/TJE2.12122, 2022.
Lin, H., Wang, C., and Chen, C.: Neural Bursting and Synchronization Emulated by Neural Networks and Circuits, IEEE. T. Circuits-I., 68, 3397–3410, https://doi.org/10.1109/TCSI.2021.3081150, 2021.
Liu, X., Zhang, Y., and Liu, F.: Structure design and flow field simulation analysis of a dust collector based on tornado principle, J. Harbin Inst. Technol. (Chin. Ed.), 52, 106–114, https://doi.org/10.11918/201812133, 2020 (in Chinese).
Lu, Q., Yang, R., and Zhong, M.: An Improved Fault Diagnosis Method of Rotating Machinery Using Sensitive Features and RLS-BP Neural Network, IEEE Trans. Instrum., Meas. 69, 1585–1593, https://doi.org/10.1109/TIM.2019.2913057, 2020.
Qin, X., Xiao, Q., and Zhou, F.: Simulation analysis of gas-particle flow through the pickup head of a street sweeper and its design improvement, Chin. J. Appl. Mech., 33, 73–79 + 181–182, 2016 (in Chinese).
Wang, S., Zhang, N., and Wu, L.: Wind speed forecasting based on the hybrid ensemble empirical mode decomposition and GA-BP neural network method, Renew. Energy., 94, 629–636, https://doi.org/10.1016/j.renene.2016.03.103, 2016.
Wang, E., Tian, Y., and Liu, X.: Prediction Model of Compressive Strength of Ultra Lowtemperature Frozen Soil Based on WOA-BP Neural Network, Chin. J. Mech., 54, 1145–1153, https://doi.org/10.6052/0459-1879-21-502, 2022 (in Chinese).
Wang, Y., Li, J., and Yuan, K.: Establishment of hot deformation flow stress prediction model based on GA improved BP neural net work, J. Mater. Eng. (Beijing, China), 50, 170–177, https://doi.org/10.11868/j.issn.1001-4381.2021.000624, 2022 (in Chinese).
Wang, Z., Zhao, H., and Xie, Y.: Prediction of Modulus of Composite Materials by BP Neural Network Optimized by Genetic Algorithm, J. Shanghai Jiaotong Univ., 1–8, https://doi.org/10.16183/j.cnki.jsjtu.2021.126, 2022 (in Chinese).
Xi, Y., Cheng, K., and Lou, X.: Research on Numerical Analysis and Dust Collection Efficiency of Reverse Blowing Pickup Mouth, J. South. West Jiaotong Univ., 51, 105–112, https://doi.org/10.3969/j.issn.0258-2724.2016.01.016, 2016a (in Chinese).
Xi, Y., Cheng, K., and Li, G.: CFD analysis of the operating parameters of reverse blowing pickup mouth for a street sweeper, J. Cent. South Univ. (Sci. Technol.), 47, 1144–1150, https://doi.org/10.11817/j.issn.1672-7207.2016.04.009, 2016b (in Chinese).
Xi, Y., Yongliang, Z., and Xilong, Z.: Enhancement of particle collection efficiency considering the structural interplay: particle motion characteristics analysis, Mech. Ind., 21, 15 pp., https://doi.org/10.1051/meca/2020093, 2020.
Xia, S., Lin, R., and Cui, X.: The application of orthogonal test method in the parameters optimization of PEMFC under steady working condition, Int. J. Hydrogen Energy., 41, 11380–11390, https://doi.org/10.1016/j.ijhydene.2016.04.140, 2016.
Yang, C., Zhang, Y., and Ouyang, Z.: Parametric design of dust collection port of vacuum sweeper based on flow simulation, J. Cent. South Univ. (Sci. Technol.), 43, 385–390, 2012 (in Chinese).
Yang, X., Liu, G., and Li, Y.: Structural Optimization of Reciprocating Seal with Magnetic Fluid Based on Orthogonal Test Design, J. Magn., 26, 229–239, https://doi.org/10.4283/JMAG.2021.26.2.229, 2021.
Ye, J., Pan, J., and Ai, H.: Pure Electric Sweeper Performance Analysis and Test Verification of Dust Extraction Port, Appl Sci-Basel., 12, 5188–5188, https://doi.org/10.3390/APP12105188, 2022.
Yu, H., Zhang, Z., and Zhang, L.: Improved Norfloxacin degradation by urea precipitation Ti/SnO2-Sb anode under photo-electro catalysis and kinetics investigation by BPneural-network-physical modeling, J. Cleaner Prod., 280, 124412, https://doi.org/10.1016/j.jclepro.2020.124412, 2021.
Yu, L., Xie, L., and Liu, C.: Optimization of BP neural network model by chaotic krill herd algorithm, Alexandria Eng. J., 61, 9769–9777, https://doi.org/10.1016/J.AEJ.2022.02.033, 2022a.
Yu, L., Cao, D., and Li, J.: Multi-objection Optimization Erthogonal Test of Y-type Screen Filter, Trans. Chin. Soc. Agric. Mach., 53, 322–333, https://doi.org/10.6041/j.issn.1000-1298.2022.09.033, 2022b (in Chinese).
Yuan, X., Yan, D., and Xilong, Z.: Prediction of particle-collection efficiency for vacuum-blowing cleaning system based on operational conditions, Processes, 8, 809, https://doi.org/10.3390/pr8070809, 2020.
Zeng, D., Yu, Z., and Xiong, L.: HFO-LADRC Lateral Motion Controller for Autonomous Road Sweeper, Sensors, 20, 2274–2274, https://doi.org/10.3390/s20082274, 2020.
Zhang, Y., Yang, C., and Baker, C.: Effects of expanding zone parameters of vacuum dust suction mouth on flow simulation results, J. Cent. South Univ., 21, 2547–2552, https://doi.org/10.1007/s11771-014-2210-2, 2014.
Zhang, G., Zhao, Y., and Gao, Y.: Wear analysis of gas-solid two-phase flow atomizing nozzle, Surf. Technol. (Chongqing, China), 46, 121–126, https://doi.org/10.16490/j.cnki.issn.1001-3660.2017.09.019, 2017 (in Chinese).
Zhang, L., Wang, F., and Sun, T.: A constrained optimization method based on BP neural network, Neural. Comput. Appl., 29, 413–421, https://doi.org/10.1007/s00521-016-2455-9, 2018.
Zhang, M., Zhang, Y., and Zhang, T., Design Optimization of Subway-Track Sweeper:A Simulation Study, Chin. J. Vac. Sci. Technol., 39, 273-278, https://doi.org/10.13922/j.cnki.cjovst.2019.03.14, 2019 (in Chinese).
Zhang, H., Li, G., and An, X.: Numerical Study on The Erosion Process of the Low Temperature Economizer Using Computational Fluid Dynamics-Discrete Particle Method, Wear., 450–451, 203269–203269, https://doi.org/10.1016/j.wear.2020.203269, 2020.
Zhang, M., Zhang, Y., and Zhang, F.: Numerical analysis on blowing-suction cleaning flow field between subway rails, J. Harbin Inst. Technol. (Chin. Ed.), 52, 137–143, https://doi.org/10.11918/201901164, 2020 (in Chinese).
Zhao, Y., Chen, Jun, and Li, W.: Improved whale algorithm and its application in cobot excitation trajectory optimization, Int. J. Intell. Robo. Appl., 6, 615–624, https://doi.org/10.1007/S41315-022-00264-W, 2022.
Zhu, L., Wang, S., and Wang, G.: Numerical simulation of influence factors on erosion characteristics of four-way pipe in heavy oil thermal recovery, Surf. Technol. (Chongqing, China), 1–12, https://doi.org/10.16490/j.cnki.issn.1001-3660.2022.11.022, 2022 (in Chinese).