the Creative Commons Attribution 4.0 License.
the Creative Commons Attribution 4.0 License.
 | 06 Apr 2022
Optimal sensor placement and model updating applied to the operational modal analysis of a nonuniform wind turbine tower
Mohammad Tamizifar
Masoud Mosayebi
Saeid Ziaei-Rad
Test planning is a crucial step in the operational modal analysis (OMA) of wind turbines (WT), and it is an essential part of choosing the best positions for installing the sensors of the structures. On the other hand, updating the finite element model (FEM) with the OMA results implies a better prediction of the real structure's dynamic and vibrational behavior. This paper aims to show how the OMA of a nonuniform and two-section wind turbine tower can be performed more effectively, using the required test planning and optimal sensor placement. Then, accordingly, the OMA is used in operating and parked conditions to find the objective bending mode characteristics. Moreover, the updating of the applicable FEM of the multi-sectional wind turbine tower will be described. The tailor-made genetic algorithm (GA) is used to find the MEMS (micro electro-mechanical system) sensors' optimal positions of the WT under study. The OMA was performed and the acquired data analyzed using the stochastic subspace identification (SSI) method. Based on the OMA results, the FEM is updated by applying the sensitivity method. The results show that a tailor-made GA is a practical and quick approach to finding the optimal position of the sensors to obtain the best results for the objective modes of the WT. The OMA results, under operating and parked conditions, prove some modal characteristics of WTs. Based on the sensitivity analysis and engineering judgment, the modulus of elasticity was selected as a parameter for updating. Finally, we found that the updated FEM had less than 1 % error compared to the obtained frequencies from the test.
- Article
(3603 KB) - Full-text XML
- BibTeX
- EndNote


Providing economic and reliable wind turbines is the most significant challenge for wind turbine designers. Understanding wind turbine dynamics is essential for meeting the requirements (Tittus and Diaz, 2020). Finding out or predicting the dynamic behavior can be obtained from creating a finite element model and modal testing. In this respect, using a modal test as a tool to understand wind turbine (WT) dynamics based on measured data seems very helpful. Generally, there are two methods for modal testing of massive structures like wind turbines, namely experimental modal analysis (EMA) or operational modal analysis (OMA). The engineering field that studies the modal properties of systems under ambient vibrations or normal operating conditions is called operational modal analysis (OMA) and provides useful methods for modal analysis of many structural engineering areas (Brincker and Ventura, 2015). Since testing large structures with the traditional method that requires the artificial excitation of the structure is difficult, time-consuming, and costly, OMA (operational modal analysis) is proposed as a practical and optimal solution for testing wind turbines (Carne et al., 1988). James et al. (1992, 1996) did the complementary research on modal testing using natural excitation. Then, Carne and James (2010) published their research reviews and then compared the OMA versus EMA of wind turbines and revealed the advantage of OMA for wind turbines' modal tests. Also, Osgood et al. (2010) did the modal field test on an on-shore wind turbine and compared the results.
Ozbek et al. (2013), and other studies by Lorenzo et al. (2015), Allen et al. (2011) and Tcherniak et al. (2011), discussed the most crucial challenges in the operating modal analysis of wind turbines. To solve the problems, a careful test planning for considering the OMA is essential. Several matters like test objectives, sensor placements, equipment, measurement duration, and FE analysis should be determined. Brincker and Ventura (2015) reviewed the effective test planning for a successful OMA of wind turbines. Zierath et al. (2018) present a contribution that summarizes the comprehensive experimental modal analysis techniques on a 2 MW industrial wind turbine. Also, in this study, CMA (classical modal analysis) and OMA techniques for a rotor blade are applied, while the dynamics of the entire wind turbine with a locked rotor are analyzed by means of operational modal analysis. For the OMA, different identification procedures are applied, and then the resulting modal parameters are compared to each other.
One of the most critical steps of the test planning procedure is the optimal placement of the available sensors on the wind turbine components to access the test objectives. In this regard, many techniques have been proposed for optimal sensor placement problems in the last 2 decades. Maul et al. (2007) reviewed the literature. In recent years, computational intelligence approaches have been applied to optimal sensor placement (OSP) effectively. The genetic algorithm (GA), as a computational intelligence method, is based on natural evolution theory. Jung et al. (2015) investigated the optimal layout of a flexible two-dimensional rectangular plane using the genetic algorithm method. Then, they compared it with the results of the proposed optimal layouts of the general methods like EI, EI-DPR, EVP, and ADPR. The results show that GA gives the best results compared to the other methods. Schulze et al. (2016) used GA for the optimal locations of 19 sensors for OMA of wind turbine blades, leading to high-quality and optimized results. Downey et al. (2017) developed an optimal sensor placement within a hybrid dense sensor network to construct accurate strain maps for large-scale structural components. The objective function and genetic algorithm are experimentally validated for a cantilever plate under three loading cases. Soman and Malinowski (2019) present a novel implementation of the genetic algorithm (GA) to improve the sensor network coverage for damage detection using guided wave structural health monitoring.
Also, a wind turbine's practical design needs a finite element model or numerical models. Model updating is essentially a process of adjusting specific parameters of the finite element model. The sensitivity method is probably the most successful of the many approaches to updating finite element models of engineering structures based on vibration test data. Camargo et al. (2019) investigated the dynamic behavior of a reinforced and post-tensioned concrete structure for applications in wind turbine towers by considering the obtained modal parameters from the OMA results. Also, since the vibration behavior originates from the mode's inherent properties, forces exciting the system at resonant frequencies yield large vibration responses that lead to discomfort or even damage.
First, this paper focuses on selecting the best location of the available sensors on the nonuniform tower, which is rarely applied, of studied wind turbine using genetic algorithms to achieve its bending modes. Then, the results of the wind turbine's OMA reveal its dynamic behavior. Finally, a sensitivity analysis was performed using a finite element model (FEM) to understand which parameters have the most significant effect on modal frequencies. Also, model adjustments were performed by updating the selected parameters to obtain the same values as in the experimental results.
A successful wind turbine OMA is closely dependent on the quality of the data obtained by careful test planning. So, the critical step in obtaining useful quality data is that the test has been planned carefully and executed. Due to the enormous wind turbines and a limited number of sensors, an essential issue in the test planning is to find the best location of the existing sensors to reach the test objectives. The structure has many nodes onto which the sensor may be mounted. However, because of the limited number of sensors, they can only place at some locations. This notwithstanding, from a practical perspective, the OMA needs to optimize the sensor locations to obtain as much information on the structural system as possible.
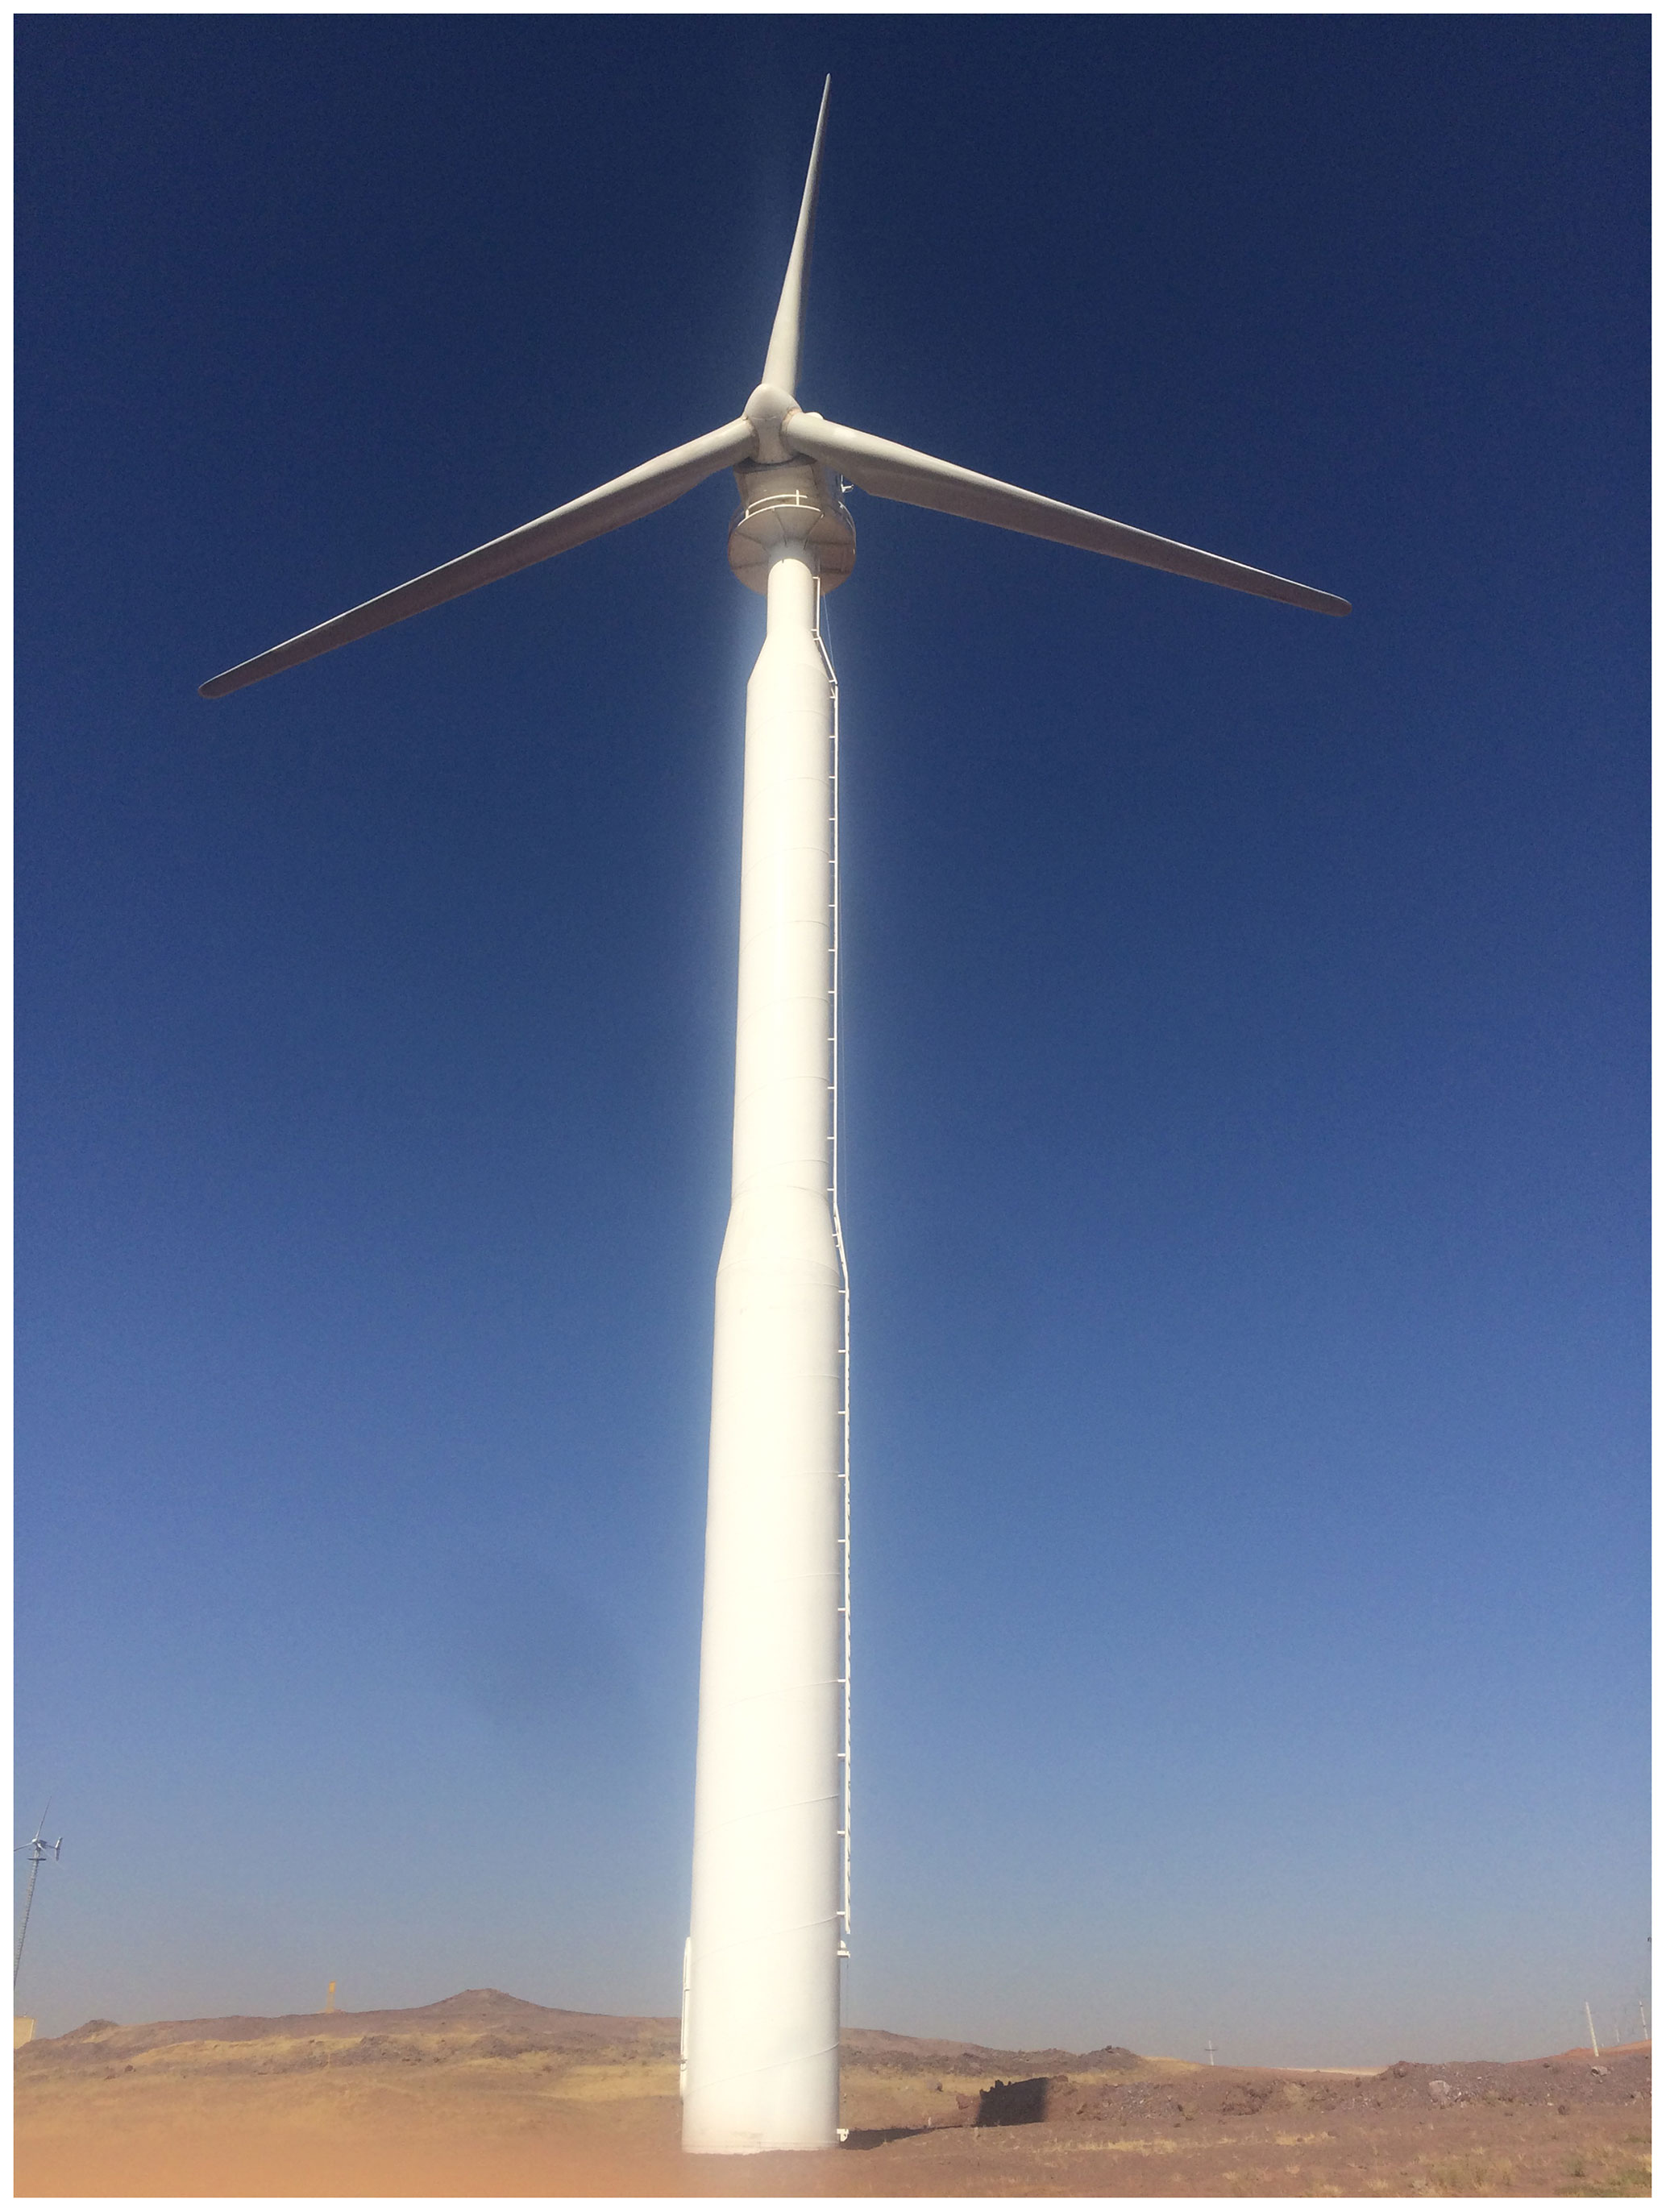
In this study, the operational modal analysis aims to take the modal parameters of the tower's first and second bending pair modes (fore-and-aft – FA; side-to-side – SS) in the 100 kW wind turbine installed at a research site. The studied wind turbine has three blades, a magnetic generator, and a medium-speed gearbox, with a multi-sectional and nonuniform steel tower of about 40 m, as shown in Fig. 1.
2.1 OSP methodology
The aim of selecting the optimal sensor positions is to determine the sensors' best locations for obtaining precise response data and the structural dynamic behavior. So, it is essential to select the nodes on the large structure that extract the objective modes with the least dependency. Therefore, the OSP procedure is an optimization problem with a suitable fitness function to reach the objective mode shapes dependency.
2.1.1 Fitness function
Considering the abovementioned concept, we should select the criterion that shows the modes' relation. Allemang (2003) reviewed the development of the original modal assurance criterion (MAC) and revealed how a simple statistical concept becomes a handy tool in experimental modal analysis and structural dynamics. Pastor et al. (2012) pointed out that the modal assurance criterion (MAC) is a suitable and most popular tool for evaluating this linear dependence. Bakhary et al. (2014) compared some of the most useful fitness functions (MAC; FIM – Fisher information matrix; MSE – mean square error) and concluded that MAC function performs the optimal sensor placement better. We determine the auto-MAC matrix build-up with target mode shapes from the following:
where Φi and Φj are ith and jth mode shape vectors at the sensor position nodes, respectively. All diagonal elements of the auto-MAC matrix are equal to 1, since the mode shapes are correlated with themselves for the case i=j. In contrast, for the case i≠j, the off-diagonal elements take values between 0 and 1, depending on the linear dependency between the mode shape pair Φi and Φj.
Thus, the off-diagonal terms of the auto-MAC matrix can be used to check the mode shapes' linear independence for optimal sensor placement. For this purpose, the sum of off-diagonal terms should be close to 0, as far as possible. So, the OSP optimization problem aims to find the auto-MAC matrix with the minimum number off-diagonal elements. The fitness function (F) can be defined as follows:
2.1.2 Genetic algorithm
A genetic algorithm is an optimization algorithm which evolves analogously, as does the Darwinian principle of natural selection. To obtain the optimal solution for design problems, the GA has been implemented to progress similarly to natural evolution. A combination of selection, mutation, crossover, and recombination is at work to evolve those storage individuals from an initial population (Zhao el at., 2020). The optimization process through a genetic algorithm is either carried out randomly or by selecting candidate design variables to create the initial population. This initial population is generated through natural selection tools so that newer or better generations achieve the optimization goals. The quality and value of the produced generations are evaluated based on a fitness function. Depending on the goal, the optimization of this fitness function can be programmed to maximize or minimize. To perform the genetic algorithm, it is necessary to define a coding system to express the optimization variables. The design variables should be coded by binary expression.

In order to apply a genetic algorithm to the sensor optimization placement problem, we have the following steps.
- (1)
Create an initial population randomly, and calculate the fitness values of the strings.
- (2)
Select the fittest individuals according to fitness values, and apply the crossover operation and mutation operation.
- (3)
Calculate the fitness values of the new strings.
- (4)
Repeat steps (2) and (3) until the termination criterion is met.
This study used the genetic algorithm toolbox in MATLAB to select the sensors' optimal position. We linked it to the FEM model in Ansys to evaluate each generated sensor placement's fitness function.
In optimizing the sensor's position by a genetic algorithm, the set of possible positions for the sensors' arrangement is considered to be an individual. A simple way to encode an individual is to use a binary vector to combine the possible positions of the sensor installation as follows:
The length sp is equal to the available degrees of freedom (DOF) for installing the sensors (n). The value of 1 in the vector indicates that one sensor is located on the DOF of a node. Therefore, the sum of the Sp0 element's values (as an initial individual) indicates the number of existing sensors in the optimization. Thus, the studied population in this optimization includes a set of sp layouts (possible arrangements for installing sensors in available locations and its related degrees of system freedom).
After coding the individuals, it is necessary to determine the fitness function to achieve the optimization goals. The fitness function indicates an individual's ability and determines how to ascend to the next generation. The value index is defined as follows:
As mentioned above, the objective function to optimize sensor placement is defined to minimize the non-diagonal elements of the auto-MAC matrix.
It is necessary to generate an initial population Sp0 with random individuals and the examined the fitness function to start optimization. The genetic selection criterion is defined by a genetic algorithm that determines which individual is passed on to the next generation. In the GA process calculation, the population size of 50, the crossover rate of 90 %, and the mutation with a probability of 10 % are used. To ensure that the best generations are not eliminated from the next stage by random selection, it states that the top 10 % of the generated generations automatically go to the next stage. Most generations are not eliminated by random selection, and the remaining 90 % is generated using genetic algorithms.
The above process continues until the defined termination criterion is met to achieve the individual that gives us the sensors' best position. The termination criterion is defined as follows:
The termination criterion is the difference between the fitness function's best value fmin and the fitness function's average values fave. The termination value for stopping optimization is assumed to be 0.05.
2.1.3 Assumptions
To do an effective and easy optimization procedure, considering some assumptions and limitations is necessary.
The wind turbine tower's finite element model was made using the beam element in Ansys software. Since finding the bending modes of the wind turbine tower in the fore-and-aft and side-to-side directions are the goals, UX and UY of the available nodes on the finite element were considered to be the individual element. Limitations or lack of access to some part of the tower lead us to remove their related nodes from the optimization process.
Also, there are six sensors to be mounted on the tower to measure objective bending modes.
2.1.4 Optimization results
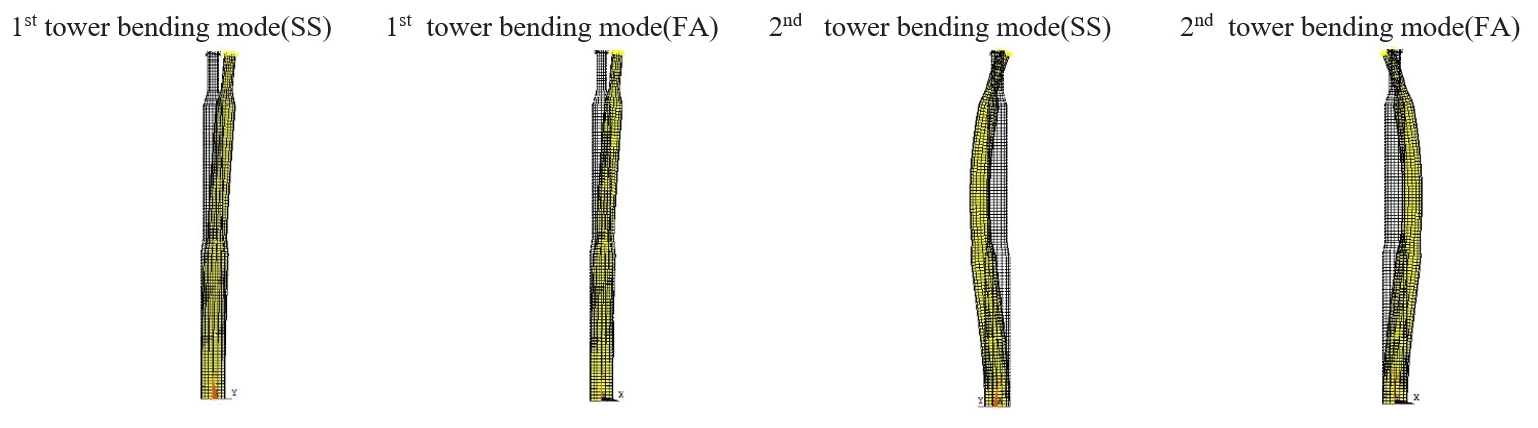
The considered mode shapes for selecting the sensors' optimal arrangement were the first and second bending modes in the fore-and-aft (UX) and side-to-side (UY) directions of the wind turbine tower structure under study.
The tower mode shape vectors were extracted from Ansys software and defined as optimization inputs in the MATLAB software optimization toolbox.
The fitness plot to reach the sensors' best configuration, using a genetic algorithm, is presented in Fig. 3. The column shows the obtained fitness value for each generation, and the row is the number of produced generations in the optimization problem up to obtain the best sensor configuration. This diagram shows the comparison of the best value of the fitness function and the average values of the fitness function obtained among each generation's population to find the best result. It is observed that, by increasing the number of generations, the fitness function's optimal and average values become closer to lower values. Obviously, all the minimum fitness (best) values tend to a constant quickly, and the average fitness value steadily tends to the best fitness value along with the increasing number of generations. It shows a good characteristic of convergence.
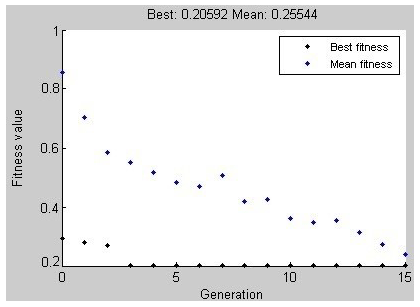
Figure 3A fitness function plot to obtain the best configuration sensors on the nonuniform wind turbine tower.
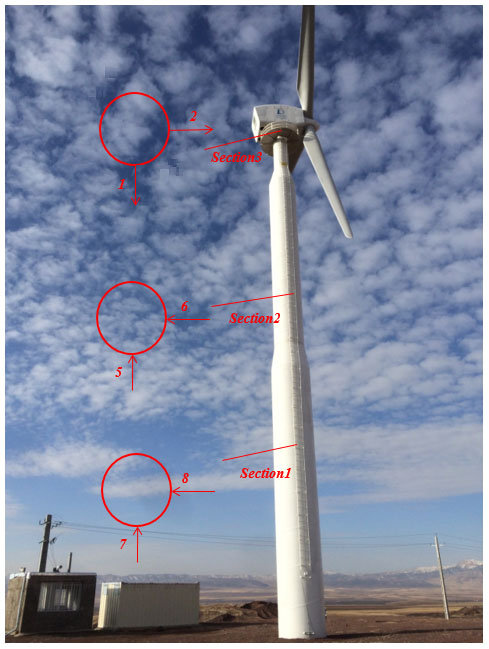
Based on the OSP results that considered available nodes on the actual tower structure, the six sensors (nos. 1, 2, 5, 6, 7, and 8) were mounted at levels of 38.8 m (Sect. 3; UX, UY), 26 m (Sect. 2; UX, UY), and 15.33 m (Sect. 1; UX, UY) to detect the first and second tower bending pair modes (FA/SS) of the wind turbine. The final sensor arrangement is shown in Fig. 4.
Finite element modeling helps to provide a preliminary understanding of the system's primary modes' structural dynamics, natural frequencies, and mode shape. So, finite element modeling should be created before the modal test for test planning and should specify the requirements, such as measurement duration, sampling frequency, and sensor placement.
In this research, the 3-D finite element model of the wind turbine tower was created by Ansys software. The parametric FE model was created with changeable design parameters to improve the model updating parameters.
Various types of Ansys library finite elements were tested to achieve a better numerical result of the wind turbine tower behavior, and finally, shell 281 was selected. It was also used in modeling the Ansys CERIG command, which creates a massless web of rigid bars. The extra masses of the nacelle, rotor hub, and blades are considered to be point masses located at the tower top on the height of the wind turbine.
To access the optimized mesh grid size, many of the mesh sizes are examined in the FEM, and the comparison shows that the first frequency has remained fixed, approximately for a size smaller than 30 cm.
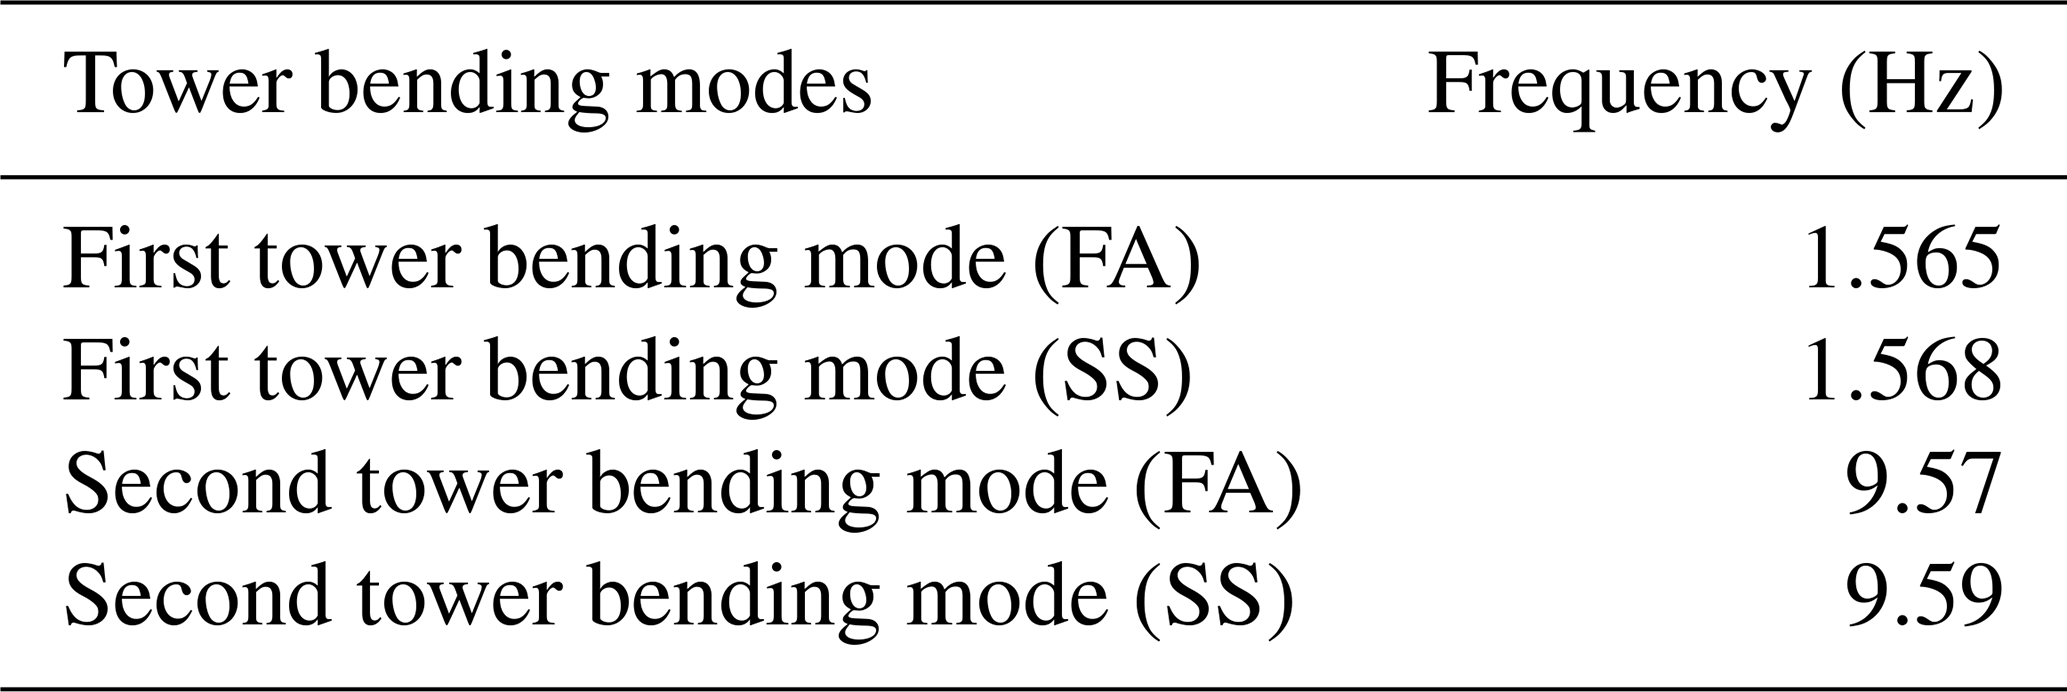
Based on the modal analysis of the FEM model, the natural frequencies and related mode shapes of the wind turbine tower were obtained and are revealed in Table 1 and Fig. 5.
The tower wind turbine's OMA was carried out using the MEMS accelerometer, the eight-channel data logger, and its software based on the test planning. Based on the modal frequency of interest and their expected magnitude considerations, MEMS sensors ADXL320 are chosen to be sensitive enough and have a suitable measurement and frequency range. The sensors were calibrated and equipped with the amplifier by considering the predicted cable lengths to prevent signal noises as much as possible. The sampling frequency of 100 Hz was chosen. Then for this study, it resampled to the frequency of 24.8 Hz.
To achieve an acceptable OMA analysis, we selected a sufficient measurement time length to identify the system's lowest natural frequency. Brincker and Ventura (2015) proposed the total measurement time length (Ttot) by Eq. (6), as follows:
where fmin is the lowest natural frequency, and ς is the structural damping.
Since the first natural frequency of a wind turbine tower was estimated to be about 1.6 Hz, based on the results of the initial finite element model, and with a damping ratio of about 0.01, the minimum data collection time for analysis is as follows:
The data were gathered in the two following cases during the test time:
-
The parked condition, which refers to a situation in which the wind turbine is not operating, and the rotor speed is 0, and the blade's pitch angle is fixed and in its large values (≈90∘).
-
Under the operating condition, the rotor is rotating with constant speed, the pitch angle is at a minimum, and the nacelle direction is along the wind direction.
From the recorded data matched to the SCADA (supervisory control and data acquisition) data, 10 min datasets covering OMA's time invariance assumptions were checked and screened. The few selected datasets were used in operational modal testing software, Artemis, to required extract modal parameters.
Finally, an operational modal analysis of the datasets was done using stochastic subspace identification (SSI) methods in the software package. Stochastic subspace identification (SSI) refers to standard algorithms for extracting modal parameters in operational modal analysis. The SSI method operates in the time domain, estimating the assumed time-invariant matrices of a linear dynamic system (Overschee et al., 2012; Boonyapinyo and Janesupasaeree, 2010). The SSI method can identify the modal parameters with the random input signal as the operational modal analysis. In the frequency domain decomposition (FDD) method, the inputs are unknown, similar to the SSI method. In this method, white noise with a Gaussian distribution and zero mean is used, and there is no need for using fast Fourier transform (FFT) to transform the signal from the time domain to the frequency domain, and the data in the time domain are utilized directly. This property eliminates the leakage error in the data and the variation in the stiffness matrix due to the use of windowing function (Mohammadi and Nasirshoaibi, 2017)
Accordingly, the stabilization diagrams under parked and operating conditions are presented in Figs. 6 and 7, respectively.
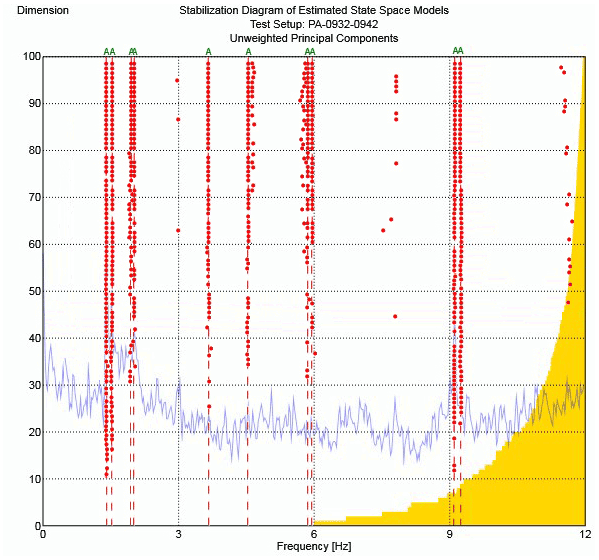
Figure 6Stabilization diagram of the wind turbine under parked conditions (PA), with a rotor speed of 0 rpm (revolutions per minute).
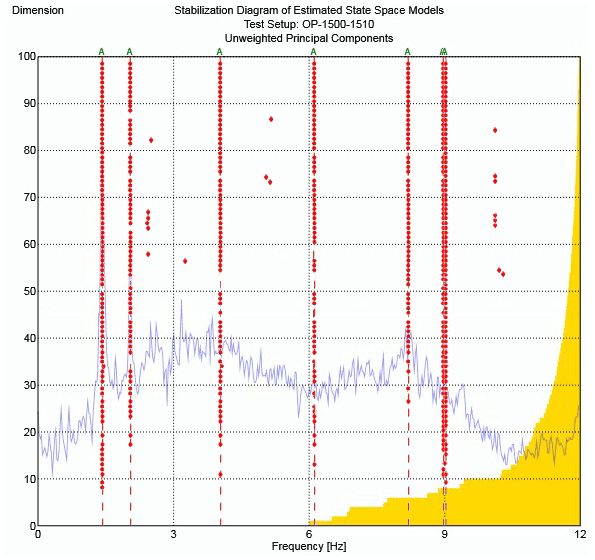
Figure 7Stabilization diagram of the wind turbine under operational conditions (OP), with a rotor speed of 41 rpm.
Other stable modes observed in the stabilization diagram may occur due to the frequencies of other elements connected to the tower, such as rotor blades, rotation harmonics, and excitation of generators and foundations. Since, in this study, the sensors were installed only on the wind turbine tower, it is not possible to accurately identify the origin of the other stable modes.
According to the results (Table 2), the first and second tower's bending pair frequencies, around 1.5 and 9 Hz under the parked state, remained approximately constant in spite of operating conditions. Therefore, changing the rotor speed and pitch angles do not change these bending modes. In comparison, the changes in the damping ratios obtained in these two cases are relatively significant. Also, the damping ratio of the SS modes of the tower in case 1 (OP – operating wind turbine conditions) is more than those for FA. Inversely, in case 2 (OP), the damping ratios are higher in direction FA compared to the ones in direction SS.
Table 2Natural frequencies and damping ratios of a wind turbine tower during OP and PA conditions.
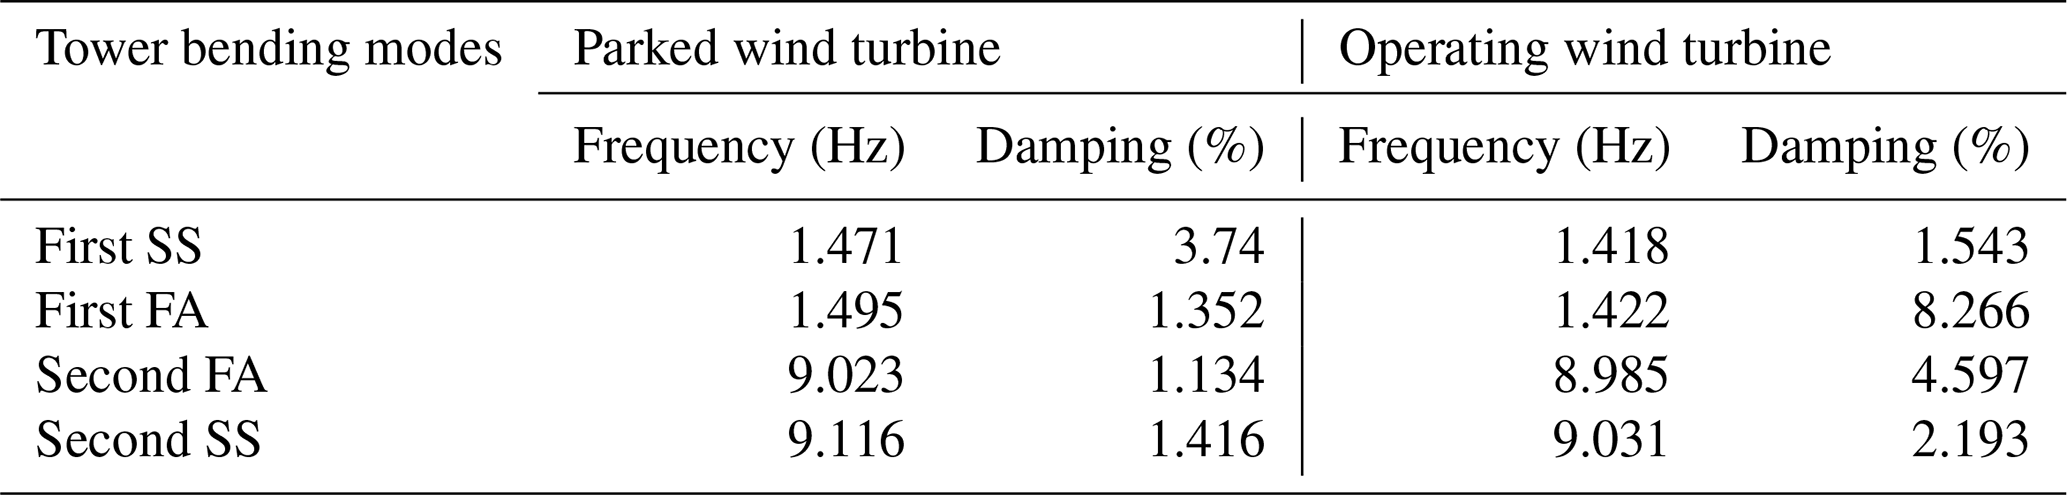
In describing this matter, since the blade angle is at a maximum in case 1 (PA), the blade surface is perpendicular to the SS direction. While a high drag force is taking place in the SS direction, the SS damping ratio will be higher than in the FA direction.
On the other hand, in the operating wind turbine (OP), the blade angle is close to 0, and more resistance occurs in the FA direction. Therefore, the damping coefficients in the wind turbine's operating mode in FA modes are more than SS. Generally, the tower's bending damping ratios under the operational case are higher than those for parked cases (especially for the first FA mode). This behavior is due to the existing aerodynamic damping in the operation case. Aerodynamic damping has its origin in the wind load acting on the rotor or, more accurately, in the interaction between the wind flow and the motion of the structure. Kuhn (2001) described aerodynamic damping and its effect on a wind turbine performance.
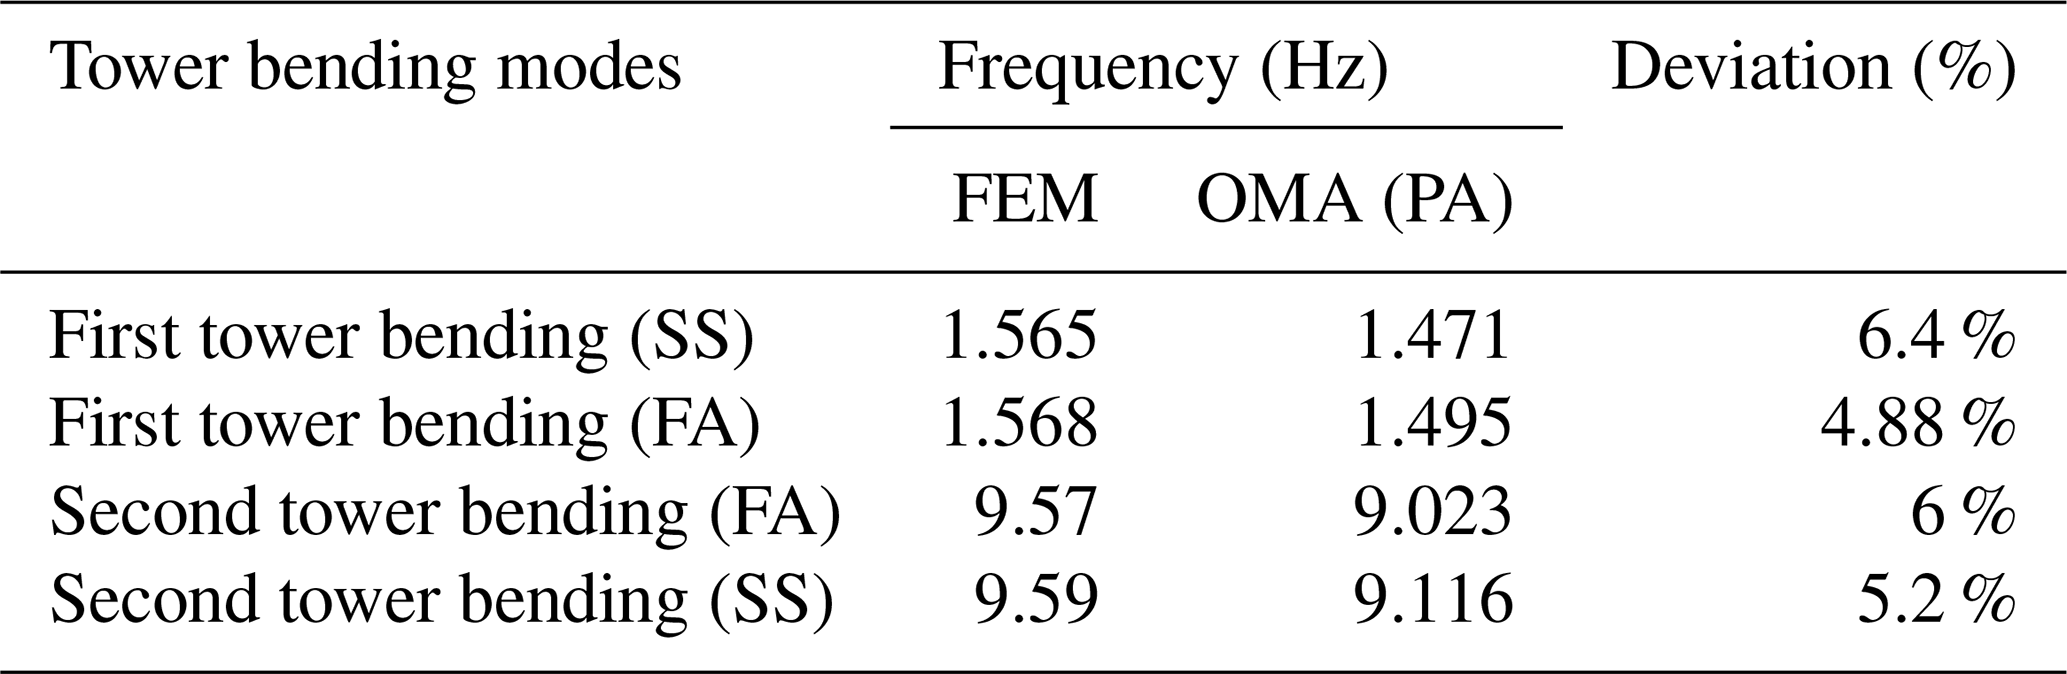
The FE model can be updated to validate the results obtained from the wind turbine tower's operational modal analysis using FEM updating. Since the finite element modeling was carried out and analyzed for the parked condition, the modal frequencies obtained from the OMA test, in this case, are compared with FEM results, as shown in Table 3.
To perform the model updating process, every parameter considered in an FE model can be a candidate for the updating parameter. Some parameters that can be improved in the primary finite element model are Young's modulus, density, joints specifications, Poisson's ratio, thicknesses, and model dimensions.
Many references have suggested methods for selecting the updating parameters. Most of the proposed methods are based on sensitivity analysis. One of the easiest and efficient methods that has been proposed is to combine the sensitivity analysis with engineering judgment, based on the knowledge of the original model.
As mentioned, the primary purpose of updating the finite element model is to minimize the difference between the model and the obtained natural frequencies from the test. This optimization problem is solved in the software. This method is a sensitivity-based method in which the physical parameters are changed, and as a result of this change, the mass and stiffness parameters of the structure are updated. This makes it possible to weigh the structure's physical parameters based on their effect on the structure's dynamic response, which is critical because the natural frequencies and mode shapes have different uncertainty levels.
Assuming that the parameter exists in the finite element model (as the initial value and the amount of variation), the frequency sensitivity () to the parameter needs to be obtained.
When the corresponding frequency is obtained in FE software under these conditions, then .
If the parameter changes, will use the finite element again, and the frequencies of these conditions are also calculated as .
According to the definition, the natural frequency's sensitivity to changes in a parameter is as follows:
The finite element model has many parameters that can be changed, but only the parameters that affect the modes are used to calculate the sensitivity. Based on engineering judgments in the finite element model of this study, the parameters and their initial values that do not change the dimensional characteristics of the structure are selected for the model updating as E=200 Gpa, υ=0.3 and ρ=7850 kg−1 m3.
According to the theory of the sensitivity analysis, to find the most sensitive parameter to the first and second natural frequencies of the wind turbine tower structure (first FA, first SS, second FA, and second SS), optimization tools in ANSYS software were used. Based on the sensitivity analysis, the model sensitivity values to the desired parameters are shown in Table 4.
Table 4Sensitivity analysis of the wind turbine tower bending frequencies to parameters.
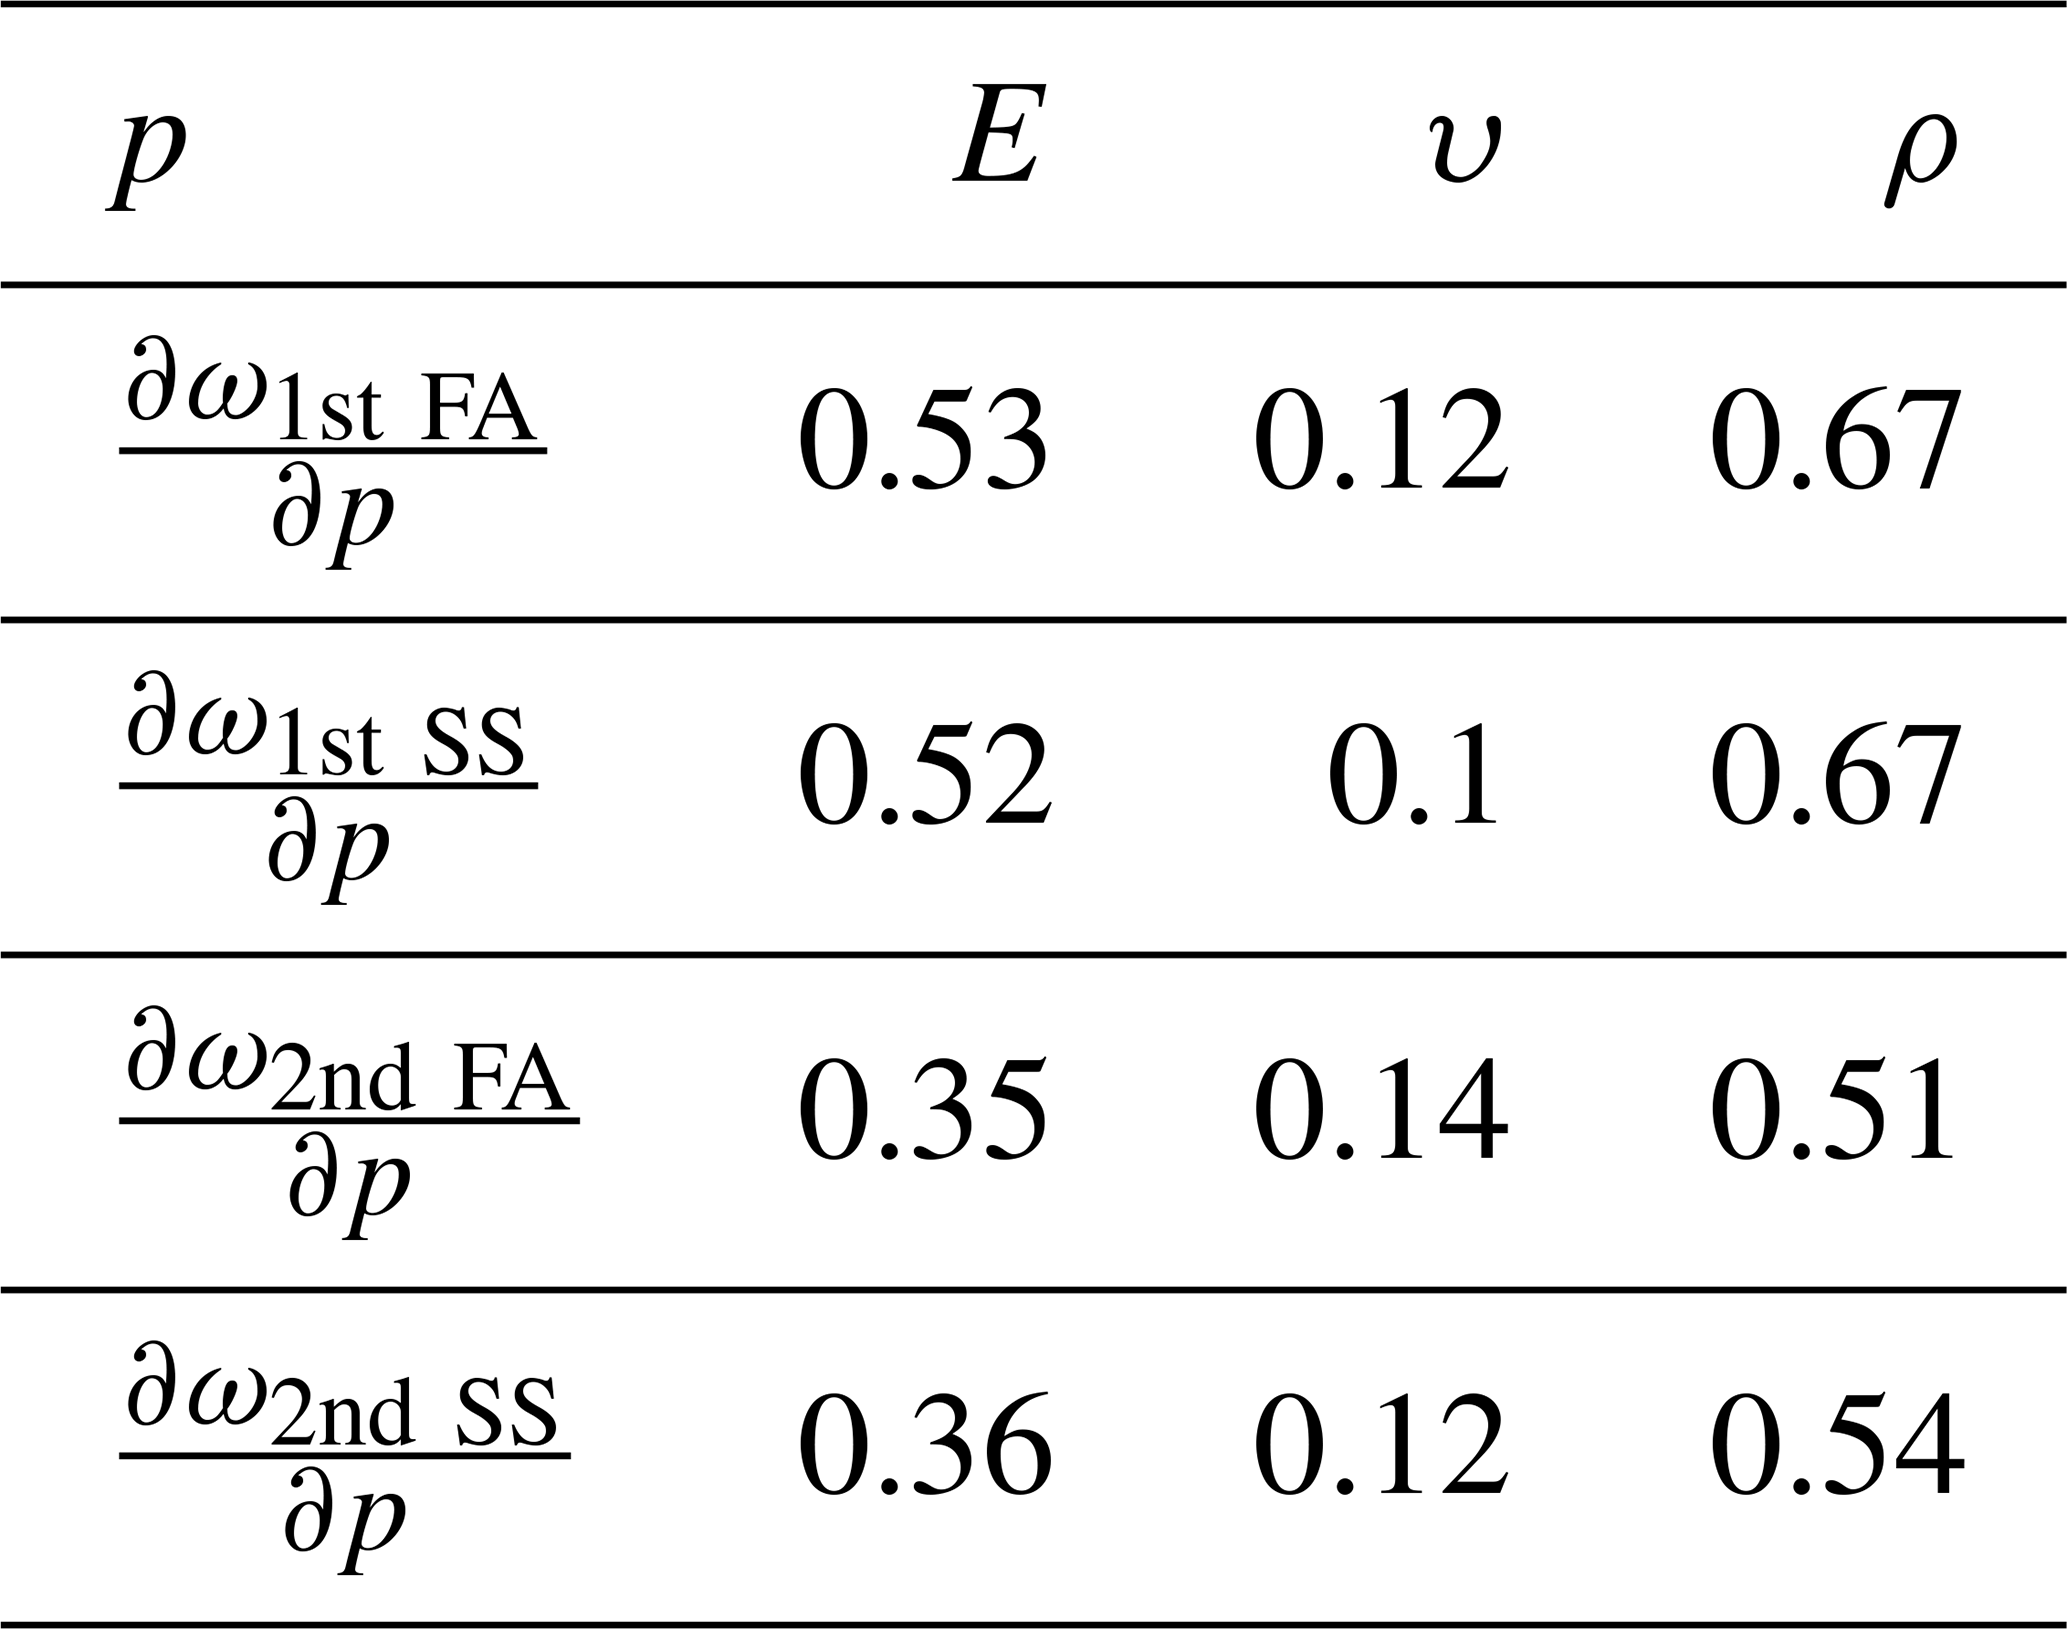
Based on the sensitivity analysis, the elastic modulus and density parameters significantly impact the tower bending modes' natural frequencies. Since changing the tower density leads to varying its weight and its actual characteristics, the model is updated by changes at the structure's modulus of elasticity.
As stated in the sensitivity analysis, the modulus of elasticity was selected to update the studied wind turbine's FE model based on the OMA's obtained frequencies. In this manner, the objective function to minimize the error between the frequency of the FEM and the test results is defined as follows:
The error function (ER) is the differences between natural frequencies of FEM (f) and test results (). The natural frequencies were updated in the model updating procedure. But the objective function aims to minimize the error for the first tower bending modes (ER ≤1%).
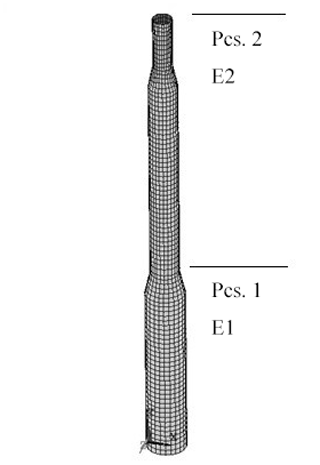
As the tower of the studied wind turbine is divided into two main parts (because of the simplicity in manufacturing and erection), the FEM model is created in two pieces with different properties parameters. So, E1 and E2 were the parameters to change for updating the model.
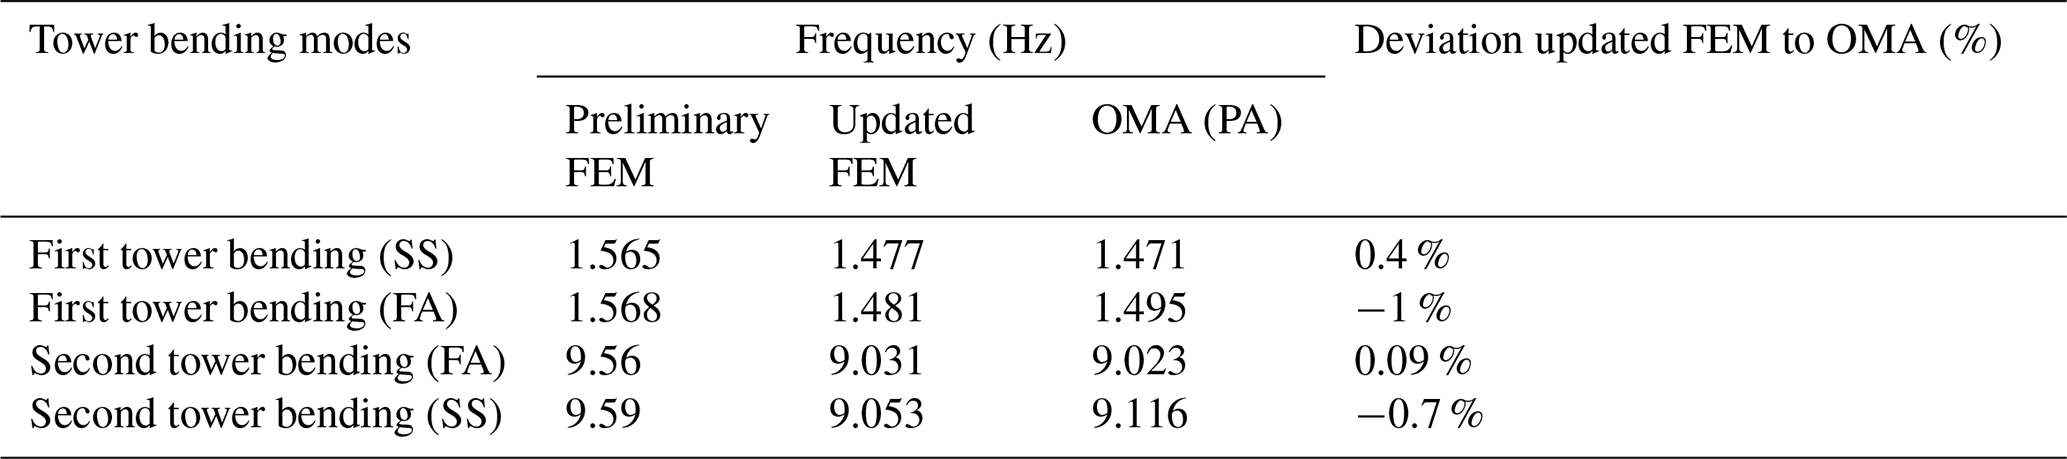
The updating procedure continued up to receive the error limitation, and the elasticity module of pieces 1 (E1) 2 (E2) obtained 176 and 178 Gpa, respectively. Finally, the updated FE model's natural frequency is compared to the ones from the operational modal test in the parked condition (Table 5).
Wind turbines have complicated dynamic behaviour, so we need to extend our knowledge about their dynamic. Operational modal analysis is one of the best ways to obtain real information about the wind turbine dynamic. Optimal placement of the existing sensors (as a step of test planning) is required to obtain accurate and acceptable results from OMA of wind turbines with a large structure. In this paper, a genetic algorithm was used to find the best sensors to mount on the wind turbine tower. The fitness function is defined by auto-MAC, which is the most popular tool to evaluate this linear dependence. Some assumptions are then applied to limit the available nodes based on the real structure, leading to accelerating the optimization procedure. This optimization procedure puts the six sensors on three levels in two directions (UX, UY) of the tower to obtain the first and second bending pair modes of the wind turbine. Also, to extend the study, two additional sensors were mounted on top of the tower. As a result, using GA to find the sensor's optimized location on the wind turbine is a practical and quick approach.
The wind turbine's operational modal analysis was then done using the SSI method and the tower bending modes obtained for two conditions (parked/operation). Natural bending frequencies were approximately constant in the parked and operating wind turbine, but the wind turbine damping ratios were varied significantly by changing its rotor speed and pitch angle.
Finally, the parametric model updating was used to match the natural bending frequencies of FEM to the test results. By sensitivity analysis and engineering judgment, the modulus of elasticity was selected to update the model. As the wind turbine tower contains two assembled parts, the two modulus of elasticity of each part (E1 and E2) were updated. The correlation between the finite element model and the experimentally obtained modal frequencies improved significantly with less than 1 % error.
This study shows the effective procedure and application of optimization tools to provide an acceptable test and model updating to the wind turbine tower.
All data used in this paper can be obtained on request from the corresponding author.
This research arises from a doctoral thesis under the supervision of MM and the advisement of SZ. MT, MM, and SZ designed the experiments, and MT carried them out. MT analyzed the test data, developed the model, and performed the optimizations. Finally, MM and SZ reviewed the results and approved them. MM prepared the paper with contributions from all co-authors.
The contact author has declared that neither they nor their co-authors have any competing interests.
Publisher’s note: Copernicus Publications remains neutral with regard to jurisdictional claims in published maps and institutional affiliations.
This paper was edited by Dario Richiedei and reviewed by three anonymous referees.
Allen, M. S., Sracic, M. W., Chauhan, S., and Hansen, M. H.: Output-Only Modal Analysis of Linear Time Periodic Systems with Application to Wind Turbine Simulation Data, Structural Dynamics and Renewable Energy, Conference Proceedings of the Society for Experimental Mechanics Series, Springer, New York, NY, 1, 1–4 February 2010, 361–374, https://doi.org/10.1007/978-1-4419-9716-6_33, 2011.
Allemang, R. J.: The Modal Assurance Criterion – Twenty Years of Use and Abuse, J. Sound. Vib., 37, 14–23, 2003.
Bakhary, N., Tong, K. H., Kueh, A. B. H., and Yassin, A. Y.: Optimal sensor placement for mode shapes using improved simulated annealing, Smart Struct. Syst., 13, 389–406, https://doi.org/10.12989/sss.2014.13.3.389, 2014.
Boonyapinyo, V. and Janesupasaeree, T.: Data-driven stochastic subspace identification of flutter derivatives of bridge decks, Wind Eng. Ind. Aerodyn., 98, 784–799, 2010.
Brincker, R. and Ventura, C. E.: Introduction to Operational Modal Analysis, Wiley, 372 pp., ISBN 978-1-119-96315-8, 2015.
Camargo, E. A., Ulfkjaer, J. P., Brincker, R., Nøergaard, J., and Gadegaard, S.: Operational Modal Analysis and Finite-Element Model Updating of Pilot Concrete Wind Turbine Tower, Struct. Eng., 45, 05018003, https://doi.org/10.1061/(ASCE)ST.1943-541X.0002242, 2019.
Carne, T. G. and James, H.: The inception of OMA in the development of modal testing technology for wind turbines, Mech. Syst. Signal Pr., 24, 1213–1226, https://doi.org/10.1016/j.ymssp.2010.03.006, 2010.
Carne, T. G., Lauffer, J. P., Gomez, A. J., and Benjannet, H.: Modal testing an immense flexible structure using natural and artificial excitation, The International Journal of Analytical and Experimental Modal Analysis, 3, 117–122, 1988.
Downey, A., Hu, C., and Laflamme, S.: Optimal sensor placement within a hybrid dense sensor network using an adaptive genetic algorithm with learning gene pool, Struct. Health Monit., 17, 450–460, https://doi.org/10.1177/1475921717702537, 2017.
James, G. H., Carne, T. G., Lauffer, J. P., and Nard, A. R.: Modal Testing Using Natural Excitation, Proc. of the 10-th IMAC, San Diego, CA, USA, 3–7 February 1992, 1209–1216, 1992.
James, G. H., Carne, T. G., and Veers, P. S.: Damping measurements using operational data, Transactions of the ASME, 118, 190–193, 1996.
Jung, B. K., Cho, J. R., Jeong, W. B., and Sower, T. S.: Sensor placement optimization for structural modal identification of flexible structures using genetic algorithm, J. Mech. Sci. Technol., 29, 2775–2783, https://doi.org/10.1007/s12206-015-0606-z, 2015.
Kuhn, M. J.: Dynamics and Design Optimisation of Offshore Wind Energy Conversion Systems, PhD thesis, Delft University of Technology, 2001.
Lorenzo, E., Kosova, G., and Musella, U.: Structural Health Monitoring challenges on the 10-MW offshore wind turbine model, J. Phys. Conf. Ser., 628, 012081, https://doi.org/10.1088/1742-6596/628/1/012081, 2015.
Maul, W. A., Kopasakis, G., Saniti, L., Sower, T. S., and Chicatelli, M.: sensor selection and optimization for health assessment of aerospace system., Tech. Rep., NASA/ TM-2007-214822, https://doi.org/10.2514/1.34677, 2007.
Mohammadi, N. and Nasirshoaibi, M.: Modal parameter identification of a three-storey structure using frequency domain techniques FDD and EFDD and time domain technique SSI: experimental studies and simulations, J. Vibroeng., 19, 2759–2776, https://doi.org/10.21595/jve.2017.17588, 2017.
Osgood, R., Gunjit, B., Mutha, H., Peeters, B., Salbon, G., and Luczak, M.: Full-scale modal wind turbine tests: comparing shaker excitation with wind excitation, Proceedings of the IMAC-XXVIII, Florida USA, 1–4 February 2010, 2010 Society for Experimental Mechanics Inc, 113–124, https://doi.org/10.1007/978-1-4419-9716-6_11 2010.
Overschee, P. V. and De-Moor, B.: Subspace Identification for Linear Systems – Theory, Implementation, Applications, Springer Science & Business Media, https://doi.org/10.1007/978-1-4613-0465-4, 2012.
Ozbek, M., Meng, F., and Rixen, D. J.: Challenges in testing and monitoring the in-operation vibration characteristics of wind turbines, Mech. Syst. Signal Pr., 41, 649–666, https://doi.org/10.1016/j.ymssp.2013.07.023, 2013.
Pastor, M., Binda, M., and Harcarik, T.: Modal Assurance Criterion, SciVerse, Procedia Engineer., 48, 543–548, https://doi.org/10.1016/j.proeng.2012.09.551, 2012.
Schulze, A., Zierath, J., Rosenow, S., Bockhahn, R., and Rachholz, R.: Optimal sensor placement for modal testing on wind turbine, J. Phys. Conf. Ser., 753, 072031, https://doi.org/10.1088/1742-6596/753/7/072031, 2016.
Soman, R. and Malinowski, P.: A Real-Valued Genetic Algorithm for Optimization of Sensor, J. Sensors, 2019, 9614630, https://doi.org/10.1155/2019/9614630, 2019.
Tcherniak, D., Chauhan, S., and Hansen, M. H.: Applicability Limits of Operational Modal Analysis to Operational Wind Turbines, Structural Dynamics and Renewable Energy, Conference Proceedings of the Society for Experimental Mechanics Series, Springer, New York, NY, 1–4 February 2010, 317–327, https://doi.org/10.1007/978-1-4419-9716-6_29, 2011.
Tittus, P. and Diaz, P. M.: Horizontal axis wind turbine modelling and data analysis by multilinear regression, Mech. Sci., 11, 447–464, https://doi.org/10.5194/ms-11-447-2020, 2020.
Zhao, D., Zhang, J., Carbone, G., Yang, H., Ni, T., and Yao, S.: Dynamic parameters identification of a haptic interface for a helicopter flight simulator, Mech. Sci., 11, 193–204, https://doi.org/10.5194/ms-11-193-2020, 2020.
Zierath, J., Rachholz, R., Rosenow, S. E, Bockhahn, R., Schulze, A., and Woernle, C.: Experimental identification ofmodal parameters of an industrial 2-MW wind turbine, Wind Energy, 21, 338–356, https://doi.org/10.1002/we.2165, 2018.