the Creative Commons Attribution 4.0 License.
the Creative Commons Attribution 4.0 License.
 | 12 Jun 2019
Stability analysis of bicycles by means of analytical models with increasing complexity
Sergio Roa
Luis Muñoz
The basic Whipple-Carvallo bicycle model for the study of stability takes into account only geometric and mass properties. Analytical bicycle models of increasing complexity are now available, they consider frame compliance, tire properties, and rider posture. From the point of view of the designer, it is important to know if geometric and mass properties affect the stability of an actual bicycle as they affect the stability of a simple bicycle model. This paper addresses this problem in a numeric way by evaluating stability indices from the real parts of the eigenvalues of the bicycle's modes (i.e., weave, capsize, wobble) in a range of forward speeds typical of city bicycles. The sensitivity indices and correlation coefficients between the main geometric and mass properties of the bicycle and the stability indices are calculated by means of bicycle models of increasing complexity. Results show that the simpler models correctly predict the effect of most of geometric and mass properties on the stability of the single modes of the bicycle. Nevertheless, when the global stability indices of the bicycle are considered, often the simpler models fail their prediction. This phenomenon takes place because with the basic model some design parameters have opposite effects on the stability of weave and capsize, but, when tire sliding is included, the capsize mode is always stable and low speed stability is chiefly determined by weave stability.
- Article
(2603 KB) - Full-text XML
- BibTeX
- EndNote


The stability of bicycles has drawn the attention of scientists since the development of the first modern bicycles. The first dynamic models for understanding the bicycle dynamics were written independently by two scientists at the end of the nineteenth century: Whipple (1899) and Carvallo (1899). The Whipple–Carvallo bicycle model (WCBM) (Meijaard et al., 2007) consists in the linearized equations of motion of the bicycle and the rider. This model makes it possible to conduct open loop analysis with the rider hands-off the handlebar. Many authors have analyzed bicycle stability using the WCBM (Limebeer and Sharp, 2006; Meijaard et al., 2007; Schwab et al., 2007; Sharp, 2008) by solving the eigenvalue problem in order to analyze the modes of vibration of the system.
Starting from the WCBM many linearized bicycle models of increasing complexity have been developed to study bicycle stability. Some researchers have extended the WCBM in order to include compliance of the front assembly (CFA). This compliance commonly includes the effects of the frame head tube, the fork, and the wheel (Doria and Roa, 2017; Doria et al., 2017; Klinger et al., 2014; Limebeer and Sharp, 2006; Plöchl et al., 2012; Sharp, 2008). These models add an additional velocity degree of freedom to the WCBM in order to take into account the lateral velocity of the front-assembly due to compliance. Other authors have extended the model including tire mechanics (Doria et al., 2013; Doria and Roa, 2017; Klinger et al., 2014; Sharp, 2008; Souh, 2015). When tire lateral slip is considered at least four degrees of freedom (DOFs) are needed to model the bicycle.
Even if bicycle tires may exhibit a non-linear behavior (Doria et al., 2013) and the shock absorbers that nowadays equip many bicycles have non-linear characteristics (Cossalter et al., 2010), very few authors have carried out stability analysis taking into account non-linear properties (Bulsink et al., 2015), because stability analysis with non-linear models requires cumbersome time-domain simulations and specific identification methods for extracting the properties of the modes of vibration from time-domain data.
The rider with his/her mass, stiffness and damping characteristics has a large effect on bicycle dynamics, even if the control actions (Kooijman and Schwab, 2013) are neglected and a completely passive behavior is assumed. For this reason, some researchers have integrated the bicycle model with rider models composed of rigid bodies (the limbs) connected by means of joints (the articulations) and by lumped stiffness and damping elements (Schwab et al., 2012; Doria and Tognazzo, 2014). These models make it possible to simulate the passive response of the rider both in the hands-off and in the hands-on configuration.
The extensions of the WCBM improve the quality and range of reliability of the stability analysis. For instance, when the front-assembly compliance and tire mechanics are included, the wobble mode appears as an additional mode of vibration and bicycle stability at relatively high speed is better predicted. Additionally, when the hands-on condition is analyzed, the weave, capsize and wobble modes are changed with respect to the hands-off condition, in particular the wobble mode becomes more damped due to the rider's arms influence (Klinger et al., 2014; Roa et al., 2018). Nonetheless, it is useful to determine the limits and potentialities of each model.
The purpose of this paper is to compare different models of increasing complexity in terms of their capability of predicting bicycle stability. Since bicycle stability depends on many parameters, only the effect of geometrical properties is analysed, tire properties, stiffness properties, and rider body properties are kept constant. The possible geometric configurations are explored numerically with a design of experiment (DOE) approach based on the space filling method proposed by Sobol (1967). This method compared with a random method assures a lower uncertainty for the same number of sample points (Saltelli et al., 2008) which are associated with the computational effort. The stability of each bicycle configuration is evaluated by means of numerical indices that are calculated from the eigenvalues obtained by means of the models of increasing complexity.
The simplest model considered in this research is the WCBM, that was checked and reviewed in Meijaard et al. (2007). This model has two velocity degrees of freedom (DOFs): the steer rotation of the handlebar around the steering axis , and the roll rotation of the rear frame and rider around the longitudinal axis . Since the bicycle components (front frame, rear frame, and wheels) and the rider are assumed to be rigid bodies and the wheels are assumed to be rigid disks, which roll without sliding, the stability features foreseen by this model depend only on the geometric and mass properties. A set of 25 geometric and mass properties is needed to describe this bicycle model (Meijaard et al., 2007). Actually, some of these parameters cannot be affected by the designer, e.g. rear assembly (rear frame plus rider) mass and inertia chiefly depend on the properties of the rider's body. Other parameters are interconnected, e.g. wheel mass and inertia depend on the radius of the wheel. For this reason, a reduced set of parameters is considered in this research, they are: the front and rear wheel radii (rF and rR), mass mH of fork plus handlebar, wheelbase (w), trail (c), caster angle (λ), and the coordinates of the center of mass of the rear assembly (xB and zB), which largely depend on the position of the saddle. Since the aim of this research is the study of the single effect of each of these eight parameters, the mathematical model was carefully implemented in order to avoid that the variation in a parameter affects other parameters. Figure 1a shows the WCBM with the design parameters.

The second model considered in this research is the improvement of the WCBM recently proposed in Doria et al. (2017), see Fig. 1b. This model accounts for front assembly compliance by introducing a revolute joint, a rotational spring, and a rotational damper (not shown in the figure); the revolute joint defines the deformation axis of the front frame that makes possible the lateral displacement of the front wheel. Therefore, the number of DOFs increases to three, and the new variable is the velocity about the deformation axis of the front frame. The values of rotational stiffness and damping and the position of the deformation axis were identified by means of experimental tests and are kept constant in all the numeric calculations here reported, they are summarized in Table 1.
The most complex bicycle model considered in this research is the one developed in Klinger et al. (2014). In this model lateral slips of front and rear tires are allowed. A linear model of tire forces and torques is adopted, since they depend in a linear way on side-slip and camber angles. The DOFs are five: , , , yaw rate of the rear frame and lateral velocity of the rear frame , see Fig. 1c. Mean values of tire properties from experimental tests (Doria et al., 2013; Dressel and Rahman, 2012) have been adopted and are kept constant in the numerical calculations here reported. In particular, the values of cornering stiffness, camber stiffness and overturning stiffness that are reported in Table 1 are the mean values of the characteristics of six different tires tested in two laboratories. The values of self-aligning stiffness and twisting stiffness are the mean values of the characteristics of three tested tires.
In all the previous models the rider with the hands-off the handlebar is simulated assuming the center of mass and inertia properties as in Meijaard et al. (2007). The model developed in Klinger et al. (2014) makes it possible to simulate bicycle dynamics considering the rider with the hands-on the handlebar as well. In order to avoid introducing new DOFs, the rider's body is connected to the handlebars by means of arms equipped with joints located at the shoulders, elbows and wrists, according to the approach suggested in Schwab et al. (2012). In the hands-on model, a bent-forward posture is assumed, and the center of mass and inertia properties are modified accordingly (Moore et al., 2009).
Stability of bicycles and powered-two-wheeled vehicles usually is analyzed by plotting the real and imaginary parts of the eigenvalues against forward speed (Meijaard et al., 2007). This research focuses on the stability of city bicycles and the nominal geometric and mass properties of the reference bicycle are set equal to the ones of the benchmark bicycle defined in (Meijaard et al., 2007). Figures 2–5 represent the eigenvalue plots of the bicycle with the reference parameters of Tables 1 and 2 that are obtained carrying out stability analysis by means of the four models here considered.
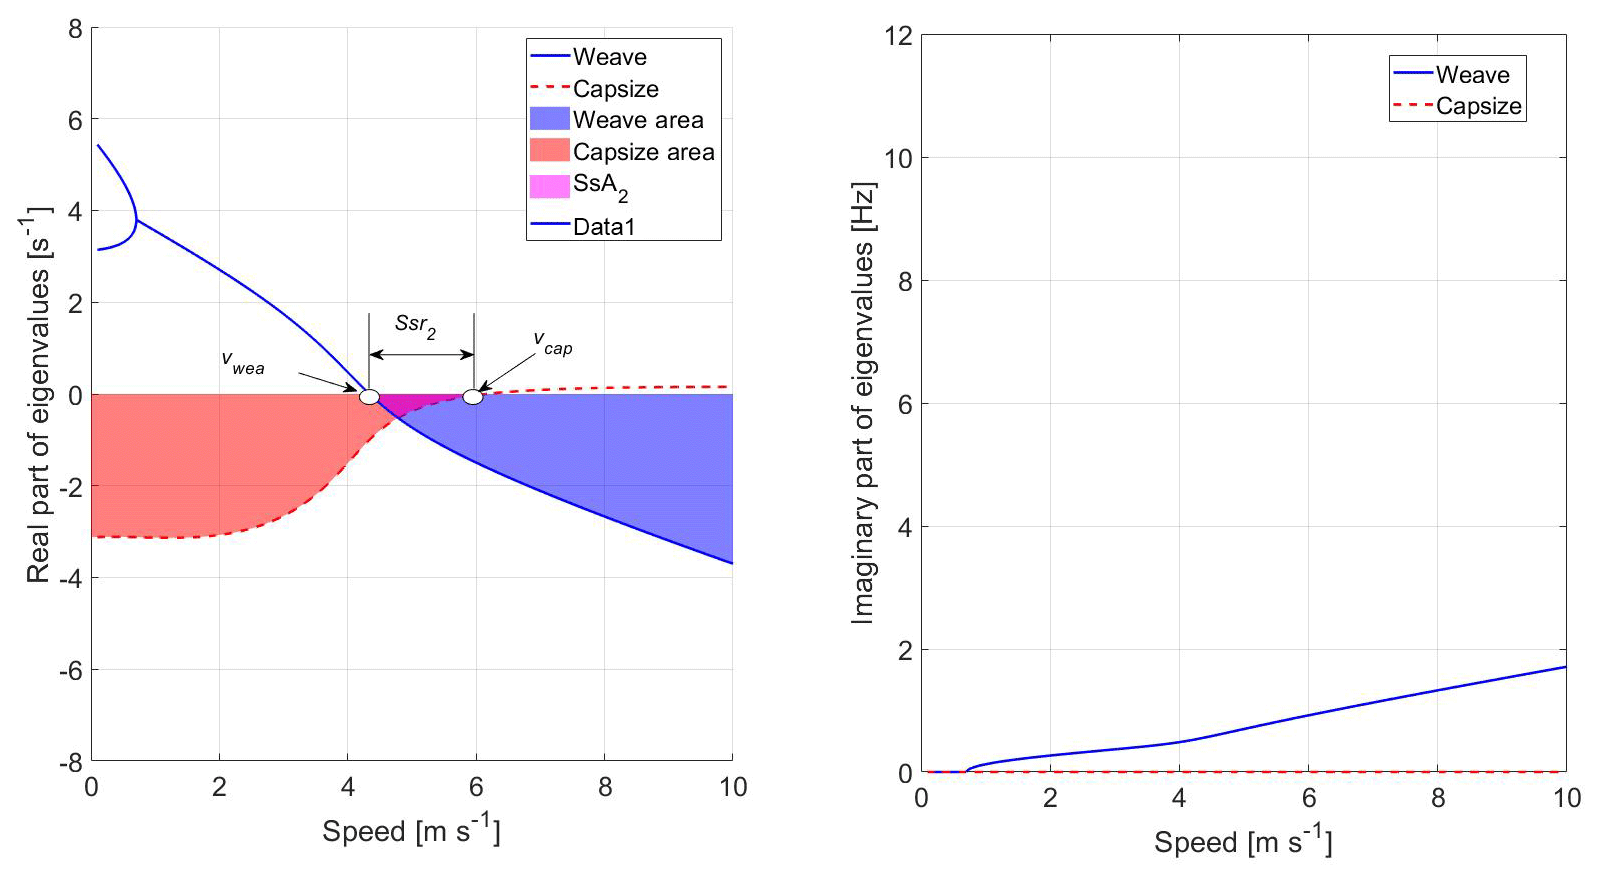
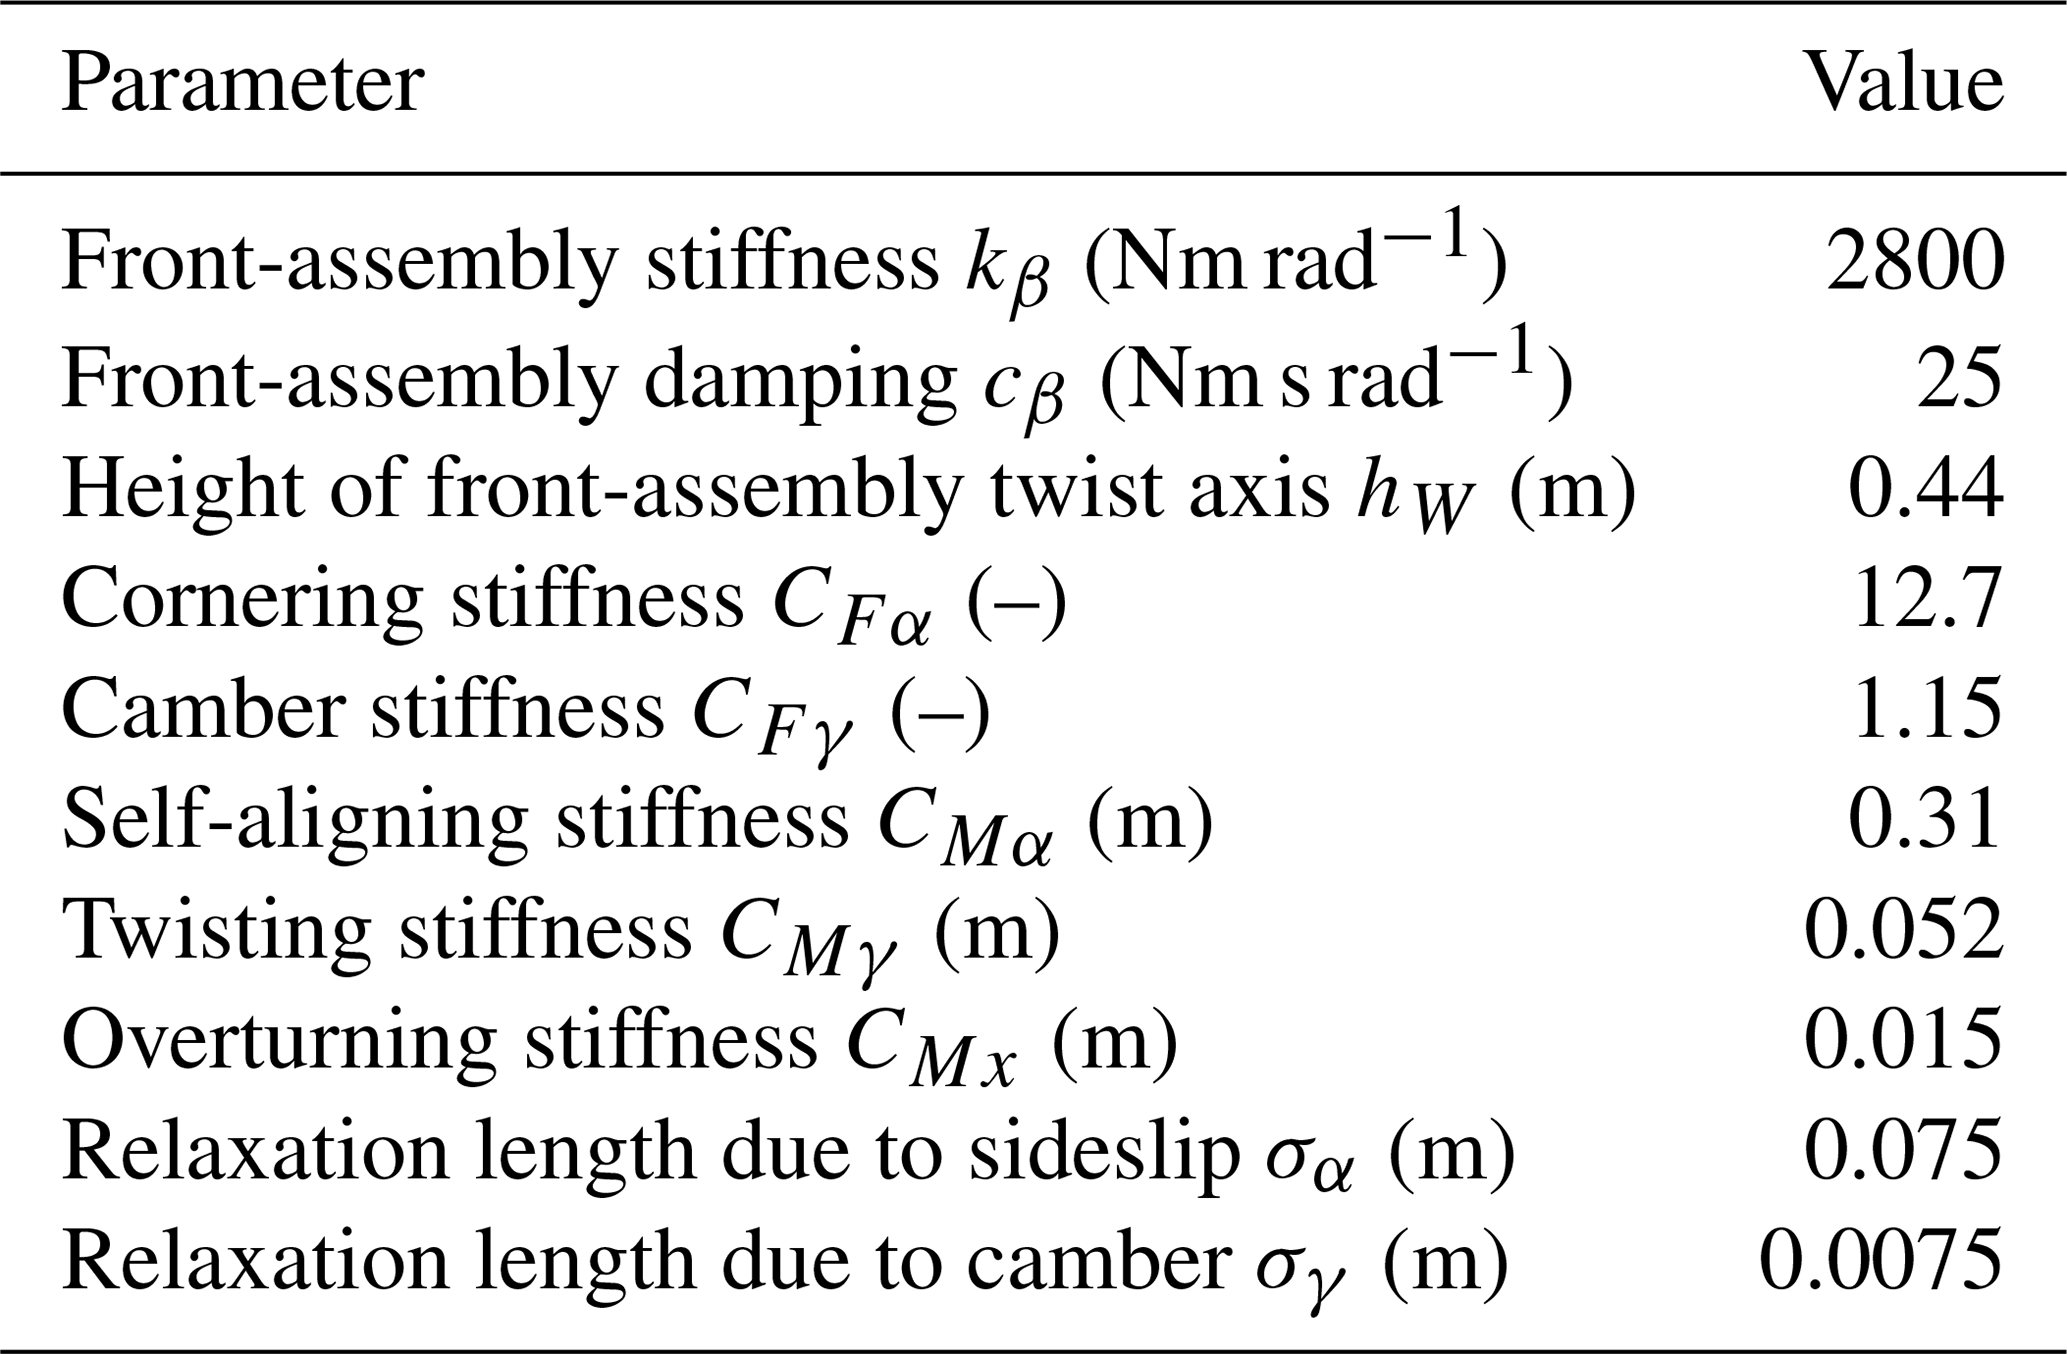
Figure 2Eigenvalues against speed using the WCBM and the nominal parameters in Tables 1 and 2.
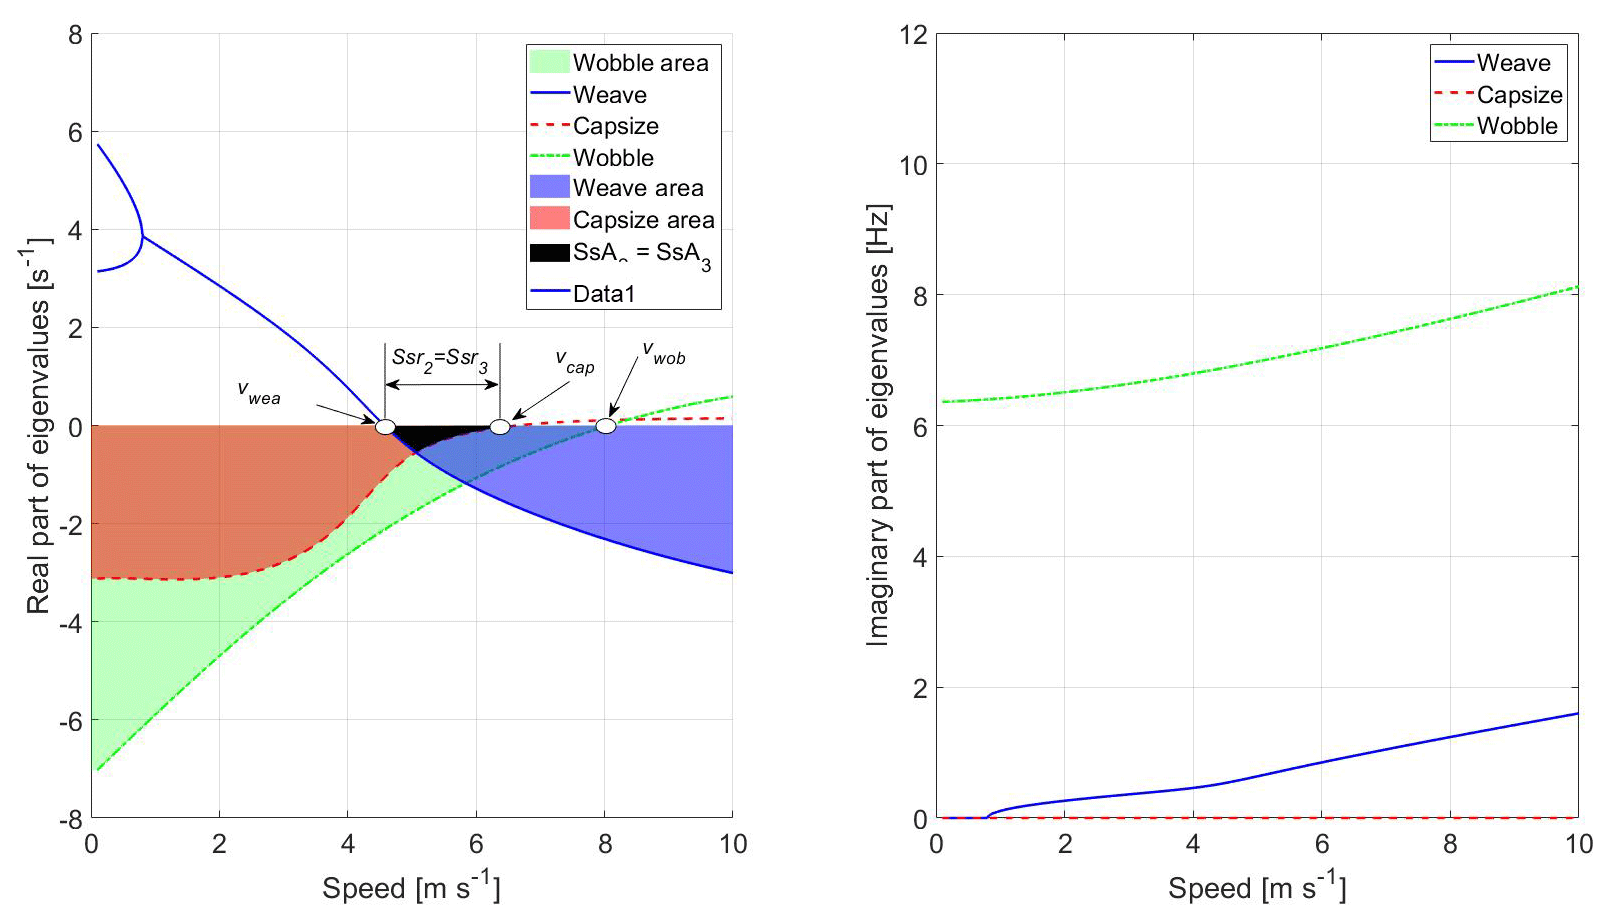
Figure 3Eigenvalues against speed using the WCBM with CFA and the nominal parameters in Tables 1 and 2.
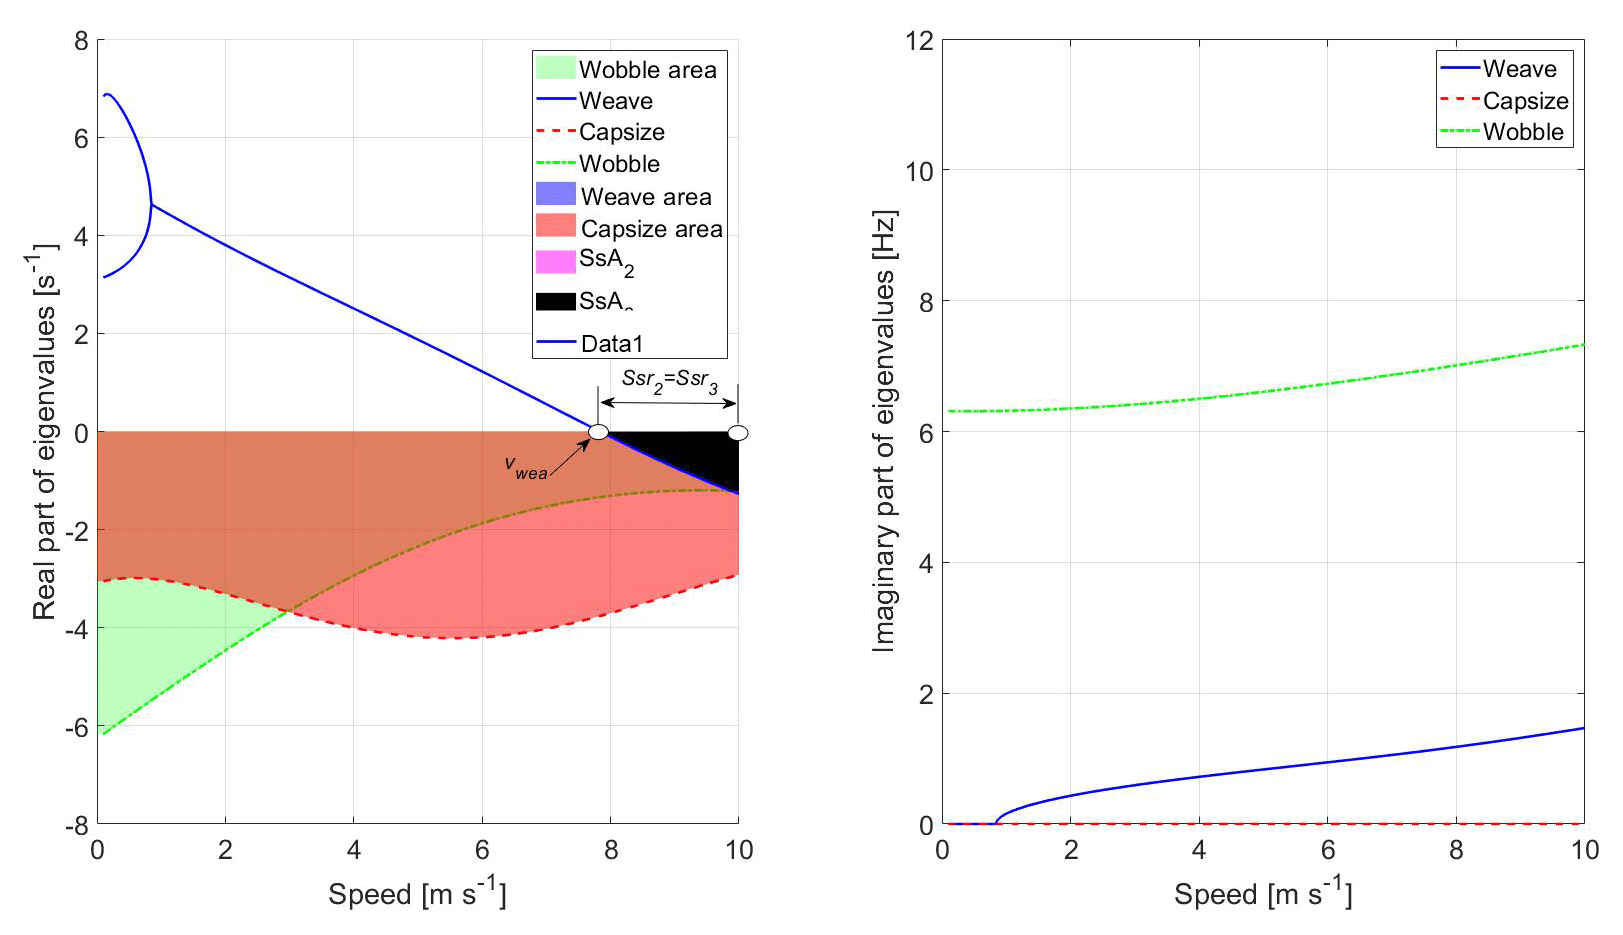
Figure 4Eigenvalues against speed using the complete model and the nominal parameters in Tables 1 and 2, hands-off.
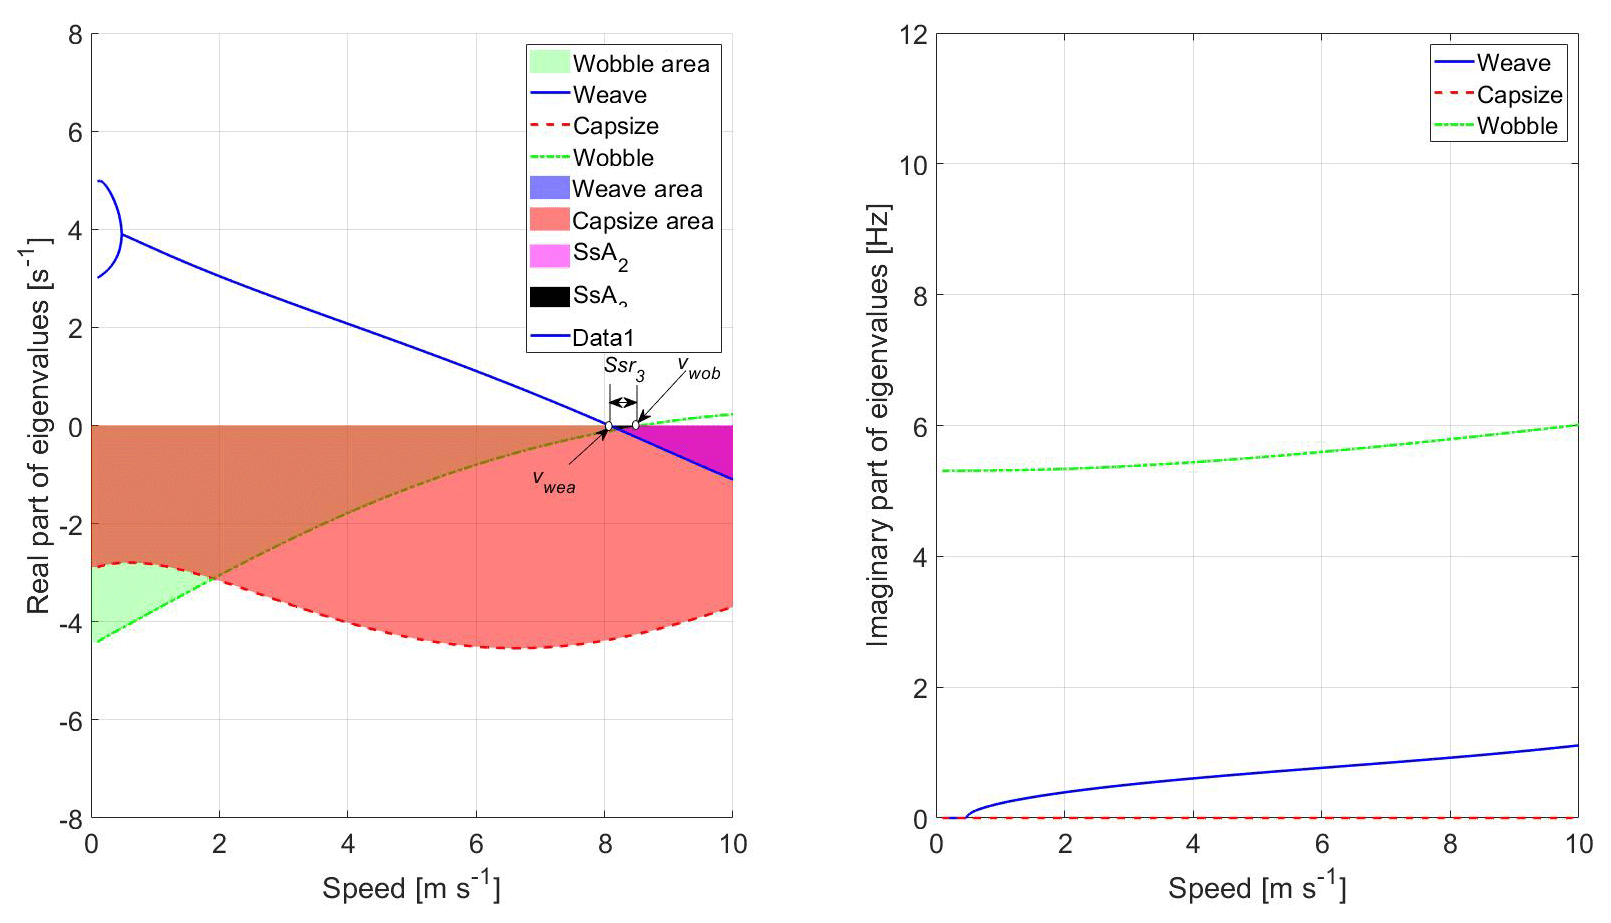
Figure 5Eigenvalues against speed using the complete model and the nominal parameters in Tables 1 and 2, hands-on.
In the field of bicycle dynamics very few stability indices have been defined. With reference to stability analysis carried out by means of the WCBM, which predicts only the weave and capsize modes, weave speed vwea, capsize speed vcap, and self-stability range Ssr2 are defined, see Fig. 2. Weave speed is the lowest speed at which the weave mode becomes stable (negative real part of the eigenvalue), whereas capsize speed is the lowest speed at which the capsize mode becomes unstable. vwea and vcap are modal stability indices, because they give information about the stability of a specific mode of vibration, but they do not tell if the bicycle is globally stable or unstable. The third stability index (Ssr2) is the speed range on which the uncontrolled bicycle is stable and it is a global stability index. These indices are very simple and clear, but they have a limit, since they do not give information about the level of stability/instability.
The analysis of the eigenvalues plots becomes more complex when more detailed models able to predict the wobble mode are used to study stability. In this case, it is possible to introduce another modal stability index, which is the wobble speed (vwob) and represents the lowest speed at which the wobble mode becomes unstable, see Fig. 3. Global stability can be analyzed using the three modes stability index (Ssr3), which is the range of speeds on which all the three modes (weave, capsize and wobble) are stable. It is worth noticing that in some cases Ssr3 is determined by the weave and capsize modes only, because the wobble mode becomes unstable at speeds larger than vcap (see Fig. 3). In other cases, Ssr3 is determined by the weave mode only, because the capsize and wobble modes are always stable in the range of speed that is analyzed (see Fig. 4). In some cases, as in Fig. 5, Ssr3 is determined by the weave and wobble mode, because capsize is always stable.
In order to improve the stability analysis, the concept of stability area (Doria and Roa, 2017) is used in the framework of this research.
Dealing with single mode stability, the stability area index is the area formed by the curve of the real part of an eigenvalue and the speed axis when this real part is negative:
In Eq. (1) v is speed, vmax the maximum speed considered in the analysis, γmode the eigenvalue of a specific mode of vibration (mode = weave, capsize, wobble) and δ is the index defined in Eq. (2). Amode index quantify the damping of a mode when it is stable, the larger the area, the larger the damping. For this study, the value of vmax is chosen as 10 m s−1, which defines the relevant range to city bicycles, which seldom reach larger speeds. Racing bicycles and certain electrical bicycles can operate at higher speed regimes. Some preliminary tests showed that, if the speed range is increased, sometimes the eigenvalue plots are not simply the extrapolations of those presented in this paper, therefore specific analyses are required.
Global stability can be studied considering the self-stability area, which is the intersection of the stability areas of the modes. If two modes are considered:
If three modes are considered:
The self-stability area index gives information about the damping of the system when all modes are stable.
Table 2Nominal values and ranges of geometric and mass properties.

The aim of this research is to analyze the effect of the geometrical parameters of the bicycle on the stability indices defined in the previous section. This analysis is performed numerically by exploring the effect of the various parameters by means of large series of simulations to assess the sensitivity of the stability indices to the design parameters. The sensitivity is analyzed combining two approaches. First, a variance-based sensitivity method is used to explore the possible high-order interactions between the design parameters that can affect the stability indices. Second, a correlation analysis is used to investigate the main trend of the variation in the stability indices associated with the change in each design parameter across the whole domain. In both cases, eight design parameters are considered: rR, rF, mH, xB, zB, w, c, λ.
4.1 Variance-based sensitivity of the stability indices
The analysis of the interactions of the different design parameters and their effect on the stability indices is performed through the variance-based method presented in Sobol (2001); Saltelli et al. (2008) and numerically implemented by Cannavo (2012). In the framework of this approach, two factors are said to interact when their contribution to the variance of the output cannot be expressed as the sum of their single contributions. In this paper, the importance of the interactions between variables on the stability indices is studied. To this aim, the contribution to the total variance of the single parameters (i.e., first-order interactions), and the contribution to the total variance of the pairs of parameters (i.e., second-order interactions) are calculated. When these contributions are calculated, the remaining variance is associated to higher-order interactions (i.e., third-order or higher).
For a design parameter Xi, the corresponding sensitivity index of its effect on the output Y is calculated as the variance of the expectation of Y conditional on Xi normalized by the unconditional variance of Y, as presented in Eq. (5) (Saltelli, 2008).
For a pair of design parameters Xi, Xj, (with i≠j) the corresponding sensitivity index of their effect on the output Y is Sij. This value is calculated as the normalized variance of the expectation of Y conditional on Xi and Xj minus Si and Sj, as presented in Eq. (6).
For the numerical implementation of the method, a total of 40 000 points are used for the exploration of the domain and the evaluation of the sensitivity indices. Each parameter is sampled with a uniform probability density function, within the range defined by the lower and upper bounds presented in Table 2.
4.1.1 Variance-based sensitivity of the stability indices of the single modes
Figure 6 presents the contribution of first, second, and higher order interactions, to the variance of the weave mode indices calculated by means of the various bicycle models. The sum of the sensitivities of the weave speed index (vwea) to each single parameter (first-order interactions) explains 93.5 % or more of the total variance. The model with the lowest percentage of the total variance explained by the first-order interactions is the complete model with the “hands-off” condition. For the same model, it is found that the first-order sensitivities explain 90.3 % of the total variance of the weave area index (Awea).

Figure 6Sensitivity of the weave mode to first, second, and higher orders of interaction. Models of increasing complexity from bottom to top.
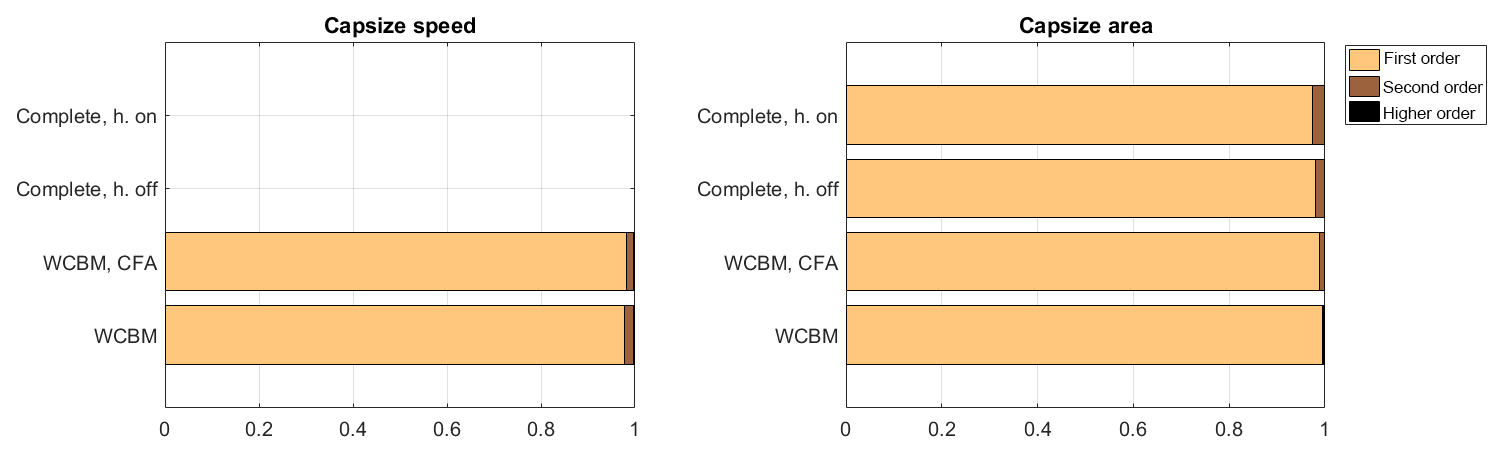
Figure 7Sensitivity of the capsize mode to first, second, and higher orders of interaction. Models of increasing complexity from bottom to top.
Figure 7 summarizes the results of the sensitivity analysis for the capsize mode indices, showing the contribution of the orders of interaction. First-order interactions explain 97.8 % or more of the total variance of the capsize speed index (vcap). It is worth noticing that for the complete model the capsize mode remains stable over the range of speed considered (0 to 10 m s−1). Even if capsize mode is stable, it is possible to calculate the capsize area index (Acap), which is related to the damping of this mode. It is found that for the capsize area index the complete bicycle model in “hands-on” condition has the lowest percentage of the total variance explained by the first-order interactions (97.3 %).

Figure 8Sensitivity of the wobble mode to first, second, and higher orders of interaction. Models of increasing complexity from bottom to top.
Figure 8 shows the sensitivity of the wobble mode indices to the different orders of interaction. The sum of the sensitivities explained by the first-order interactions decreases for wobble, compared with those obtained for the other two modes. For the wobble speed index (vwob) the sum of the first-order sensitivities explains 64.8 % of the total variance in the case of the complete model in “hands-off” condition. When the WCBM with CFA is used, the first-order interactions explain 88.8 % of the total variance, whereas when the complete model in the “hands-on” condition is adopted, 90.4 % of the total variance is associated to the first-order interactions. For the wobble area index (Awob), the first-order interactions explain 85.8 % of the total variance when the WCBM with CFA is used, 86.9 % when the full model in “hands-off” condition is used, and 91.3 % when the full model in “hands-on” condition is used. Regarding the effect of the second-order interactions on vwob and Awob, the interaction between the two coordinates of the location of the center of mass of the main body (xB, zB) is the most relevant contribution for some models (i.e., over 5 %).
4.1.2 Variance-based sensitivity of the global stability indices of the bicycle
The analysis of the interactions of the design parameters with the global stability indices is also performed by means of the variance-based method. Figure 9 presents the contribution of first, second, and higher order interactions to the variance of Ssr2 and SsA2. For these indices, the variances are mainly explained by the contribution of first order terms. The model with the largest effect of second order and high order interactions is the complete model with the “hands-off” condition, in this case the first order interactions explain 93.3 % of the total variance of Ssr2 and 89.6 % of the total variance of SsA2.
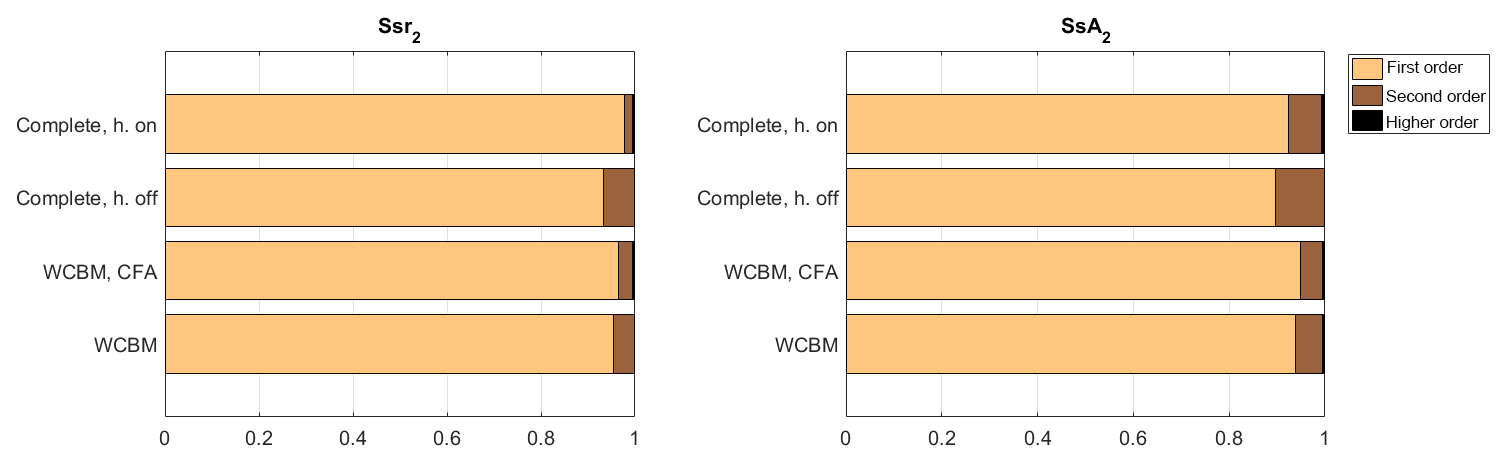
Figure 9Sensitivity of the stability indices taking into account weave and capsize to first, second, and higher orders of interaction. Models of increasing complexity from bottom to top.
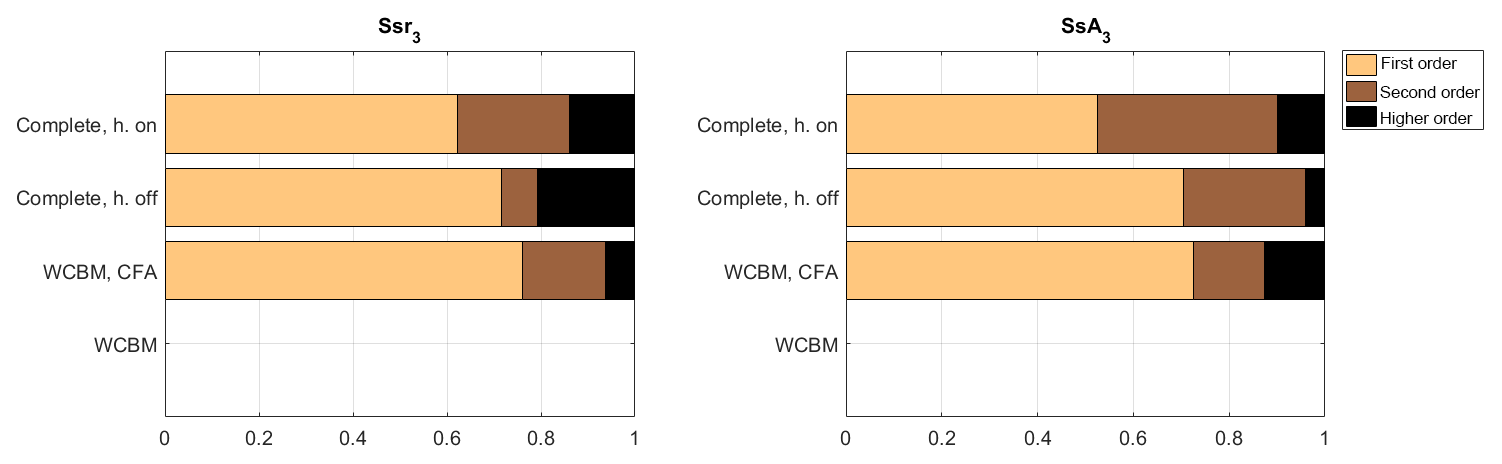
Figure 10Sensitivity of the stability indices taking into account the three modes to first, second, and higher orders of interaction. Models of increasing complexity from bottom to top.
Figure 10 shows the sensitivity of Ssr3 and SsA3 to the different orders of interaction. The sum of the variances explained by the first-order interactions is smaller for the 3-modes global stability indices than for the 2-modes global stability indices. For the Ssr3, the sum of the first-order variances explains 62.2 % of the total variance in the case of the complete model in “hands-on” condition. For the complete model in “hands-off” condition, the first-order interactions explain 71.6 % of the total variance, and for WCBM the with the CFA 75.9 % of the total variance is associated to the first-order interactions. For SsA3, the first-order interactions explain 52.6 % of the total variance when the complete model in “hands-on” condition is used, 70.4 % when the complete model in “hands-off” condition is used, and 72.5 % when the WCBM with CFA is used. Regarding the effect of the second-order interactions on Ssr3 and SsA3, the interaction between the radius of the front wheel and the wheelbase (rF, w) presents an important contribution for the complete model (i.e., over 5 %), and the interaction between the two coordinates of the location of the center of mass of the main body (xB, zB) presents a relevant contribution for the WCBM with CFA.
4.2 Correlation analysis of the stability indices
The correlations associated to the single modes of vibration are studied one at a time considering both the speed index and the area index. A space-filling computational experiment is used, implementing a quasi-Monte Carlo exploration of the domain based on a Sobol low discrepancy sequence (Sobol, 1967). 40 000 points are evaluated, and the results are used for the computation of the correlation coefficients.
In the present case, σy is the standard deviation of an output (e.g., capsize speed), yi are the values computed for all the simulations, and is the arithmetic average of yi. σx is the standard deviation of a design parameter (e.g., wheelbase), xi are the values of the parameter taken for the study, and is the arithmetic average of xi. σxy is the covariance between an output and a design parameter. The correlation coefficient represents the normalized measure of the strength of linear relationship between variables, and ranges from −1 to 1. Values close to 1 indicate a strong linear positive relationship between the variables; values close to −1 indicate a strong linear negative relationship between them (anti-correlation); values close or equal to 0 indicate no evidence of linear relationship between variables.
4.2.1 Effect of geometric parameters on the stability of the single modes
Figures 11, 12, and 13 summarize the results of the correlation analysis. The correlation coefficients are shown in solid red when they represent positive correlations, and in dotted blue when they represent negative correlations. The circles that represent each correlation coefficient have an area that is proportional to the magnitude of the index.
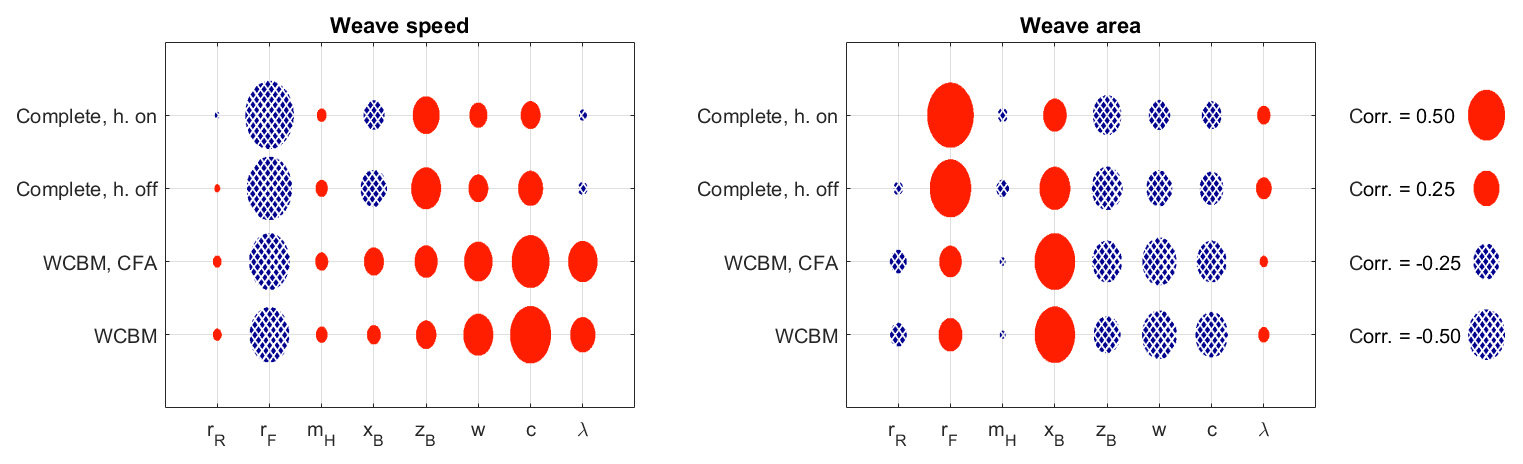
Figure 11Correlation coefficients for the indices of the weave mode. Models of increasing complexity from bottom to top. Speed range: 0 to 10 m s−1.

Figure 12Correlation coefficients for the indices of the capsize mode. Models of increasing complexity from bottom to top. Speed range: 0 to 10 m s−1.
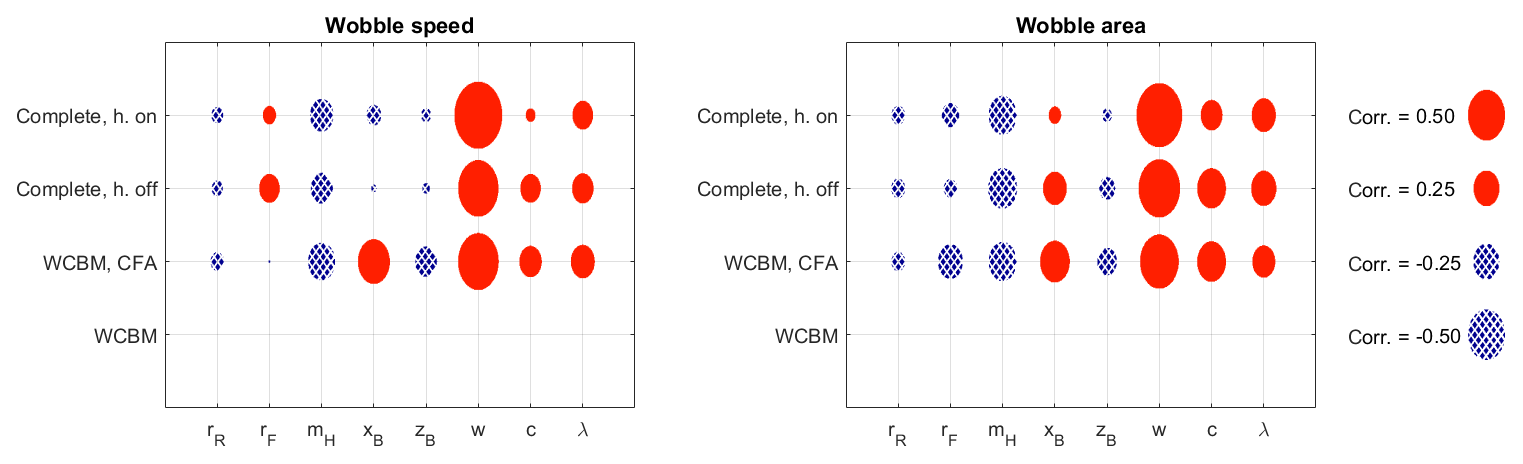
Figure 13Correlation coefficients for the indices of the wobble mode. Models of increasing complexity from bottom to top. Speed range: 0 to 10 m s−1.
Figure 11 presents the correlation coefficients related with the weave mode. The basic WCBM shows that c and rF have a strong correlation with the weave speed index (vwea), while w has a moderate correlation with vwea. When rF increases vwea decreases, which is a stabilizing effect. For all the other parameters, the effect of an increment is an increase in vwea, which is a de-stabilizing effect. The analysis of weave stability by means of the weave area index (Awea) confirms the previous results but shows two differences. The correlation between xB and Awea is strong and shows a stabilizing effect. The correlation between rF and Awea is weak. The inclusion of front assembly compliance does not strongly modify vwea and Awea, there are only minor variations in the values of the correlation coefficients. When the full bicycle model is considered (with front assembly compliance and sliding tires) most of the bicycle parameters roughly show the same effect on vwea and Awea that they showed with the simpler models. The exception is the effect of xB and λ on vwea, because with the full model when these parameters increase, there is a decrease in vwea (stabilizing effect).
Therefore, as far as the weave mode is concerned, it can be stated that the predictions on weave stability made by the simplest models are confirmed when more complex models are adopted, there are only some variations in the relative importance of the various parameters.
All the previous results dealt with the hands-off condition, the full model makes it possible to study the hands-on condition as well. Positioning the rider's hands on the handlebar has a very small influence on the stability of the weave mode considering both the weave speed index and the weave area index.
Figure 12 makes it possible to analyze the effect of geometric parameters on the stability of the capsize mode. The basic WCBM shows that c, rF, and xB have a strong correlation with the capsize speed index: an increment in rF has a de-stabilizing effect, because it decreases the capsize speed, whereas increments on xB or c have a stabilizing effect. The analysis of capsize stability by means of the capsize area index confirms the previous results but shows that zB has a moderate influence on capsize stability. The inclusion in the model of front assembly compliance does not influence the capsize stability indices. Conversely, the introduction of sliding tires in the bicycle model has a very large effect on the capsize mode, which remains stable on the full range. The correlation coefficients of the capsize area index calculated by means of the full model with hands-on the handlebar are in good agreement with the correlation coefficients calculated by means of the simpler models, only the effects of c, w and λ are different. The simpler models present a strong positive correlation of the capsize area and c, and the complete model has only a weak correlation for the same pair. With the simpler models the coefficients of w and λ show a weak positive correlation, whereas with the full model the correlation coefficient of w is negative and large, while the correlation coefficient of λ is negative but negligible. The correlation analysis (carried out by means of the full model) shows that the “hands-on” condition has negligible effect on capsize stability.
Finally, the effect of geometric parameters on wobble stability is analyzed by means of the correlation coefficients that are shown in Fig. 13. The 2 DOF WCBM does not simulate the wobble mode and the simplest model predicting wobble is the WCBM with CFA. With this model, the parameter with the strongest positive correlation coefficient with vwob is w, followed by xB, which has a moderate correlation; the parameter mH has a negative correlation coefficient (de-stabilizing effect). The correlation coefficients of Awob calculated by means of the same model have a similar trend, with only two noticeable differences: a moderate negative correlation coefficient of rF with Awob, and an increased positive correlation coefficient of c with Awob. When the sliding behavior of tires is considered, there are two phenomena that are independently able to generate a wobble mode: front assembly compliance (Doria et al., 2017) and tire model with relaxation length (Sharp, 2008). Correlation coefficients of vwob and geometric parameters calculated by means of the hands-off model show that the most influential parameters have the same effect on wobble stability they showed with the WCBM with CFA. Only parameter xB has a different effect on wobble stability with a negligible correlation with wobble speed. Correlation analysis between Awob and the geometric parameters shows results very similar to the ones obtained with the WCBM with CFA, only the correlation coefficient of xB is weaker but it maintains the same sign. Correlation analysis carried out with the full model with hands-on the handlebar shows some differences with respect to the hands-on case, but all the parameters maintain the same effect on stability.
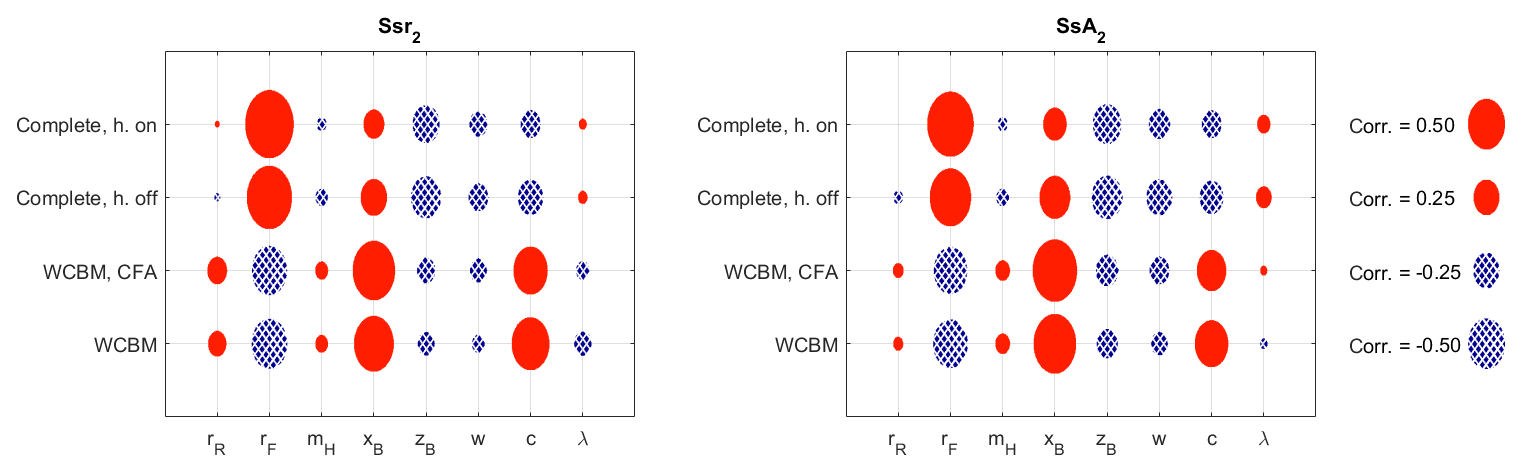
Figure 14Correlation coefficients for the stability indices taking into account weave and capsize. Models of increasing complexity from bottom to top. Speed range: 0 to 10 m s−1.

Figure 15Correlation coefficients for the stability indices that consider the three modes (i.e., capsize, weave, and wobble). Models of increasing complexity from bottom to top. Speed range: 0 to 10 m s−1.
4.2.2 Effect of geometric parameters on the global stability of the bicycle
The correlation between the geometric parameters and the indices that define the global stability of the bicycle can be considered the most important result from the practical point of view. The key question is if the predictions made by the simpler models hold true even when more realistic bicycle models are considered. The WCBM can predict only weave and capsize stability, therefore indices Ssr2 and SsA2 are considered. Figure 14 shows that the predictions made by the WCBM hold true when front assembly compliance is included in the model. The scenario drastically changes when the effect of tires is taken into account. In this case only the correlation coefficients of Ssr2 and SsA2 with xB, zB, and w maintain the same sign they showed with the WCBM, even if some of them have an important change in magnitude. This phenomenon takes place because in the presence of sliding tires the capsize mode is stable over the full range of forward speeds here considered (see Fig. 4) and the self-stability range actually depends only on the weave speed. Therefore, some geometric parameters (like rF and c), which in the WCBM have important and opposite effects on vwea and vcap, influence only vwea when the full model is used. In the WCBM trail c has a de-stabilizing effect on weave, because it increases vwea (see Fig. 11), and a stabilizing effect on capsize, because it increases vcap (see Fig. 12), the latter effect being stronger thus the self-stability range increases with c. Conversely, in the full model c increases vwea (de-stabilizing effect) but it has no effect on vcap, hence the self-stability range decreases if c increases. A similar argument holds true for the effect of rF. The self-stability range of weave and capsize slightly changes if the full model with hands-on is considered. Figure 14 also shows that the geometric parameters influence the SsA2 index roughly in the same way they influence Ssr2.
The simplest model that can be used for calculating the self-stability indices taking into account three modes (weave, capsize, and wobble) is the WCBM with front compliance, see Fig. 15.
Correlation analysis shows that in this case parameter xB has the highest stabilizing effect followed by w and c, whereas parameter zB has the highest destabilizing effect followed by mH and rF. When tire sliding is included in the model, parameters mH, zB, and w maintain their correlations on Ssr3 and SsA3, only with small changes in magnitude. Parameter xB reduces its correlations with Ssr3 and SsA3, whereas parameter c changes the sign of its correlations with Ssr3 and SsA3. When the tire sliding is included, the importance of rF grows and takes on a strong stabilizing effect. On the one hand, tire properties did not show a very large influence on vwob and Awob (see Fig. 13). On the other hand, when tire sliding is included in the model the correlation coefficients of c and rF show similar changes in both the stability of two and three modes. Therefore, it may be concluded that these phenomena are mainly related to capsize and weave stability. Actually, Figs. 3 and 4 show that the large differences in the stability range and area that take place when tire sliding is considered are mainly due to the modifications in the loci of capsize and weave. Finally, the full model makes it possible to analyze the effect of geometric parameters on Ssr3 andSsA3 with hands-on the handlebar. There are not large differences with respect to the hands-off case, but parameter xB with hands-on has a weak de-stabilizing effect.
The comparison between the stability indices calculated with 2 and 3 modes shows that some parameters change their effect on stability: with 3 modes the increase in w has a strong stabilizing effect, instead of the weak de-stabilizing effect that it has with 2 modes; additionally, with 3 modes the increase in mH has a weak de-stabilizing effect, instead of the negligible effect that it has with 2 modes. This phenomenon is due to the large effect of w and mH on wobble stability (see Fig. 13).
When the basic WCBM is extended by introducing front assembly compliance, the most important effect is the appearance of a high frequency wobble mode, which may become unstable at the highest speeds considered in the framework of this research (i.e., 10 m s−1 for a city bicycle). Nevertheless, the stability features of weave and capsize are not strongly modified and the effects of the geometric and mass properties on the stability of these modes that are predicted by the WCBM still hold true. The analysis of the global stability indices (Ssr and SsA) shows that some parameters (mH, w) have an effect on the global stability of the three modes opposite to the one they showed in the WCBM, considering only weave and capsize modes. This happens because mH and w has a strong effect of wobble stability.
The introduction of tire slip in the model has an important effect on stability, because not only the wobble mode appears, but also the capsize mode becomes stable over the whole range of speeds. Therefore, even if the influence of the various geometric and mass properties on the stability of the single modes (weave and capsize) is very similar to the one predicted by the WCBM, the effect on global stability is often different. This phenomenon takes place because some parameters have opposite effects on the stability of weave and capsize and in the simple WCBM their effect on global stability derives from a combination of the effects they have on the single modes. Conversely, in the presence of tire slip, the capsize mode is always stable and no longer relevant, thus the combined effects do not take place, and global stability is dominated by the weave and wobble modes. Only parameters xB and zB maintain the effect of stability they showed in the WCBM.
A different posture of the rider with hands-on the handlebar does not strongly change the effect of mass and geometric parameters on the stability indices. The most important effect is that with hands-on xB has a small de-stabilizing effect.
According to the presented results, it is possible to state that the simple WCBM gives useful hints for understanding the physical phenomena determining bicycle stability, especially at low speed. The simpler models give more accurate information about the stability of the single modes than about the global stability of the bicycle; therefore they can be useful when the stability of a single mode is the main concern, because the other modes can be stabilized by the rider, or become unstable at very high speed. Generally speaking, a full bicycle model is strongly recommended for studying the global stability properties of actual bicycles.
All the data used in this manuscript can be obtained by request from the corresponding author.
AD coordinated the research activity and analyzed the results. SR developed the numerical codes and carried out the simulations. LM developed the correlation analysis and analyzed the results.
The authors declare that they have no conflict of interest.
This research has been partially supported by the Colombian Administrative Department of Science, Technology, and Innovation (Colciencias) (grant no. Doctorate Formation Program 617 of 2013).
This paper was edited by Anders Eriksson and reviewed by James Sadauckas and one anonymous referee.
Bulsink, V., Doria, A., van de Belt, D., and Koopman, B.: The effect of tyre and rider properties on the stability of a bicycle, Adv. Mech. Eng., 7, 1–19, https://doi.org/10.1177/1687814015622596, 2015.
Cannavo, F.: Sensitivity analysis for volcanic source modeling quality assessment and model selection, Comput. Geosci., 44, 52–59, https://doi.org/10.1016/j.cageo.2012.03.008, 2012.
Carvallo, E.: Théorie du mouvement du monocycle et de la bicyclette, Gauthier-Villars, Paris, France, 1899.
Cossalter V., Doria A., Pegoraro R. and Trombetta L.: On the non-linear behaviour of motorcycle shock absorbers, Proceedings of the Institution of Mechanical Engineers, Part D: Journal of Automobile Engineering, 224, 15–27, https://doi.org/10.1243/09544070JAUTO1273, 2010.
Doria, A. and Roa, S.: On the influence of tyre and structural properties on the stability of bicycles, Vehicle Syst. Dyn., 56, 947–966, https://doi.org/10.1080/00423114.2017.1403032, 2017.
Doria, A. and Tognazzo, M.: The influence of the dynamic response of the rider's body on the open-loop stability of a bicycle, Proceedings of the Institution of Mechanical Engineers, Part C: Journal of Mechanical Engineering Science, 228, 3116–3132, https://doi.org/10.1177/0954406214527073, 2014.
Doria, A., Tognazzo, M., Cusimano, G., Bulsink, V., Cooke, A., and Koopman, B.: Identification of the mechanical properties of bicycle tyres for modelling of bicycle dynamics, Vehicle Syst. Dyn., 51, 405–420, https://doi.org/10.1080/00423114.2012.754048, 2013.
Doria, A., Favaron, V., Taraborrelli, L., and Roa, S.: Parametric analysis of the stability of a bicycle taking into account geometrical, mass and compliance properties, Int. J. Vehicle Des., 75, 91–123, https://doi.org/10.1504/IJVD.2017.090908, 2017.
Dressel, A. and Rahman, A.: Measuring sideslip and camber characteristics of bicycle tires. Vehicle Syst. Dyn., 50, 1365–1378, https://doi.org/10.1080/00423114.2011.615408, 2012.
Klinger, F., Nusime, J., Edelmann, J., and Plöchl, M.: Wobble of a racing bicycle with a rider hands on and hands off the handlebar, Vehicle Syst. Dyn., 52, 51–68, https://doi.org/10.1080/00423114.2013.877592, 2014.
Kooijman, J. and Schwab, A.: A review on bicycle and motorcycle rider control with a perspective on handling qualities, Vehicle Syst. Dyn., 51, 1722–1764, https://doi.org/10.1080/00423114.2013.824990, 2013.
Limebeer, D. and Sharp, R.: Bicycles, motorcycles, and models, IEEE Contr. Syst. Mag., 26, 34–61, https://doi.org/10.1109/MCS.2006.1700044, 2006.
Meijaard, J., Papadopoulos, J., Ruina, A., and Schwab, A.: Linearized dynamics equations for the balance and steer of a bicycle: a benchmark and review, Proc. R. Soc. A, 463, 1955–1982, https://doi.org/10.1098/rspa.2007.1857, 2007.
Moore, J., Hubbard, M., Kooijman, J., and Schwab, A. L.: A method for estimating physical properties of a combined bicycle and rider, in: Proceedings of the ASME 2009 International Design Engineering Technical Conferences, San Diego, California, USA, 30 August–2 September 2009, DETC2009-86947, 2011–2020, 2009.
Plöchl, M., Edelmann, J., Angrosch, B., and Ott, C.: On the wobble mode of a bicycle, Vehicle Syst. Dyn., 50, 415–429, https://doi.org/10.1080/00423114.2011.594164, 2012.
Roa, S., Doria, A., and Muñoz, L.: Optimization of the bicycle weave and wobble modes, in: Proceedings of the ASME 2018 International Design Engineering Technical Conferences, Quebec City, Quebec, Canada, 26–29 August 2018, V003T01A022, 2018.
Saltelli, A., Ratto, M., Andres, T., Campolongo, F., Cariboni, J., Gatelli, D., Saisana, M., and Tarantola, S.: Global sensitivity analysis: the primer, John Wiley & Sons, West Sussex, England, 2008.
Schwab, A., Meijaard, J., and Kooijman, J.: Some recent developments in bicycle dynamics, in: Proceedings of the 12th IFToMM World Congress in Mechanism and Machine Science, Besançon, France, 18–21 June 2007, 1–6, 2007.
Schwab, A., Meijaard, J., and Kooijman, J.: Lateral dynamics of a bicycle with a passive rider model: stability and controllability, Vehicle Syst. Dyn., 50, 1209–1224, https://doi.org/10.1080/00423114.2011.610898, 2012.
Sharp, R.: On the stability and control of the bicycle, Appl. Mech. Rev., 61, 060803, https://doi.org/10.1115/1.2983014, 2008.
Sobol, I.: On the distribution of points in a cube and the approximate evaluation of integrals, USSR Comp. Math. Math+, 7, 86–112, https://doi.org/10.1016/0041-5553(67)90144-9, 1967.
Sobol,: I. Global sensitivity indices for nonlinear mathematical models and their Monte Carlo estimates, Math. Comput. Simulat., 55, 271–280, https://doi.org/10.1016/S0378-4754(00)00270-6, 2001.
Souh, B.: Influence of tire side forces on bicycle self-stability, J. Mech. Sci. Technol., 29, 3131–3140, https://doi.org/10.1007/s12206-015-0711-z, 2015.
Whipple, F.: The stability of the motion of a bicycle, Q. J. Pure Appl. Math., 30, 312–321, 1899.