the Creative Commons Attribution 4.0 License.
the Creative Commons Attribution 4.0 License.
 | 26 May 2026
Effect of surface roughness on erosion wear of turboshaft engine compressor blades
Dunyuan Luo
Guangfu Bin
Andrew Ball
Fengshou Gu
Haiyan Miao
Chao Li
Ahmed Hamood
Wei Yuan
When a turboshaft engine operates in a sand-laden environment, it is prone to erosive wear, which leads to the continuous evolution of surface roughness on compressor blades and consequently alters particle impact behaviour. However, existing studies have mainly focused on the erosion process of smooth surfaces, and there is still a lack of in-depth understanding of the influence of surface roughness on the erosive wear of multi-stage compressor blades. To address these issues, this paper theoretically derives the intrinsic relationship between blade surface roughness and wear rate. An erosion experimental setup for titanium alloy with adjustable impact angles is established to accurately characterize key parameters of the erosive wear model for titanium alloys with different surface roughness values. A dynamic model of blade erosive wear based on gas–solid two-phase flow is constructed, and computational fluid dynamics is employed to analyse the effects of sand particles on the distribution characteristics of erosive wear on compressor blades with varying surface roughness. The research reveals that in the erosion wear experiments conducted at impact angles ranging from 0 to 90°, titanium alloys with different surface roughness exhibited the highest wear rate at an impact angle of 30°. At this specific impact angle, the maximum erosion wear depth of the titanium alloy with Ra =6 µm increased by 88.9 % and 183.3 % compared to those with Ra =3 and Ra =0.1 µm, respectively. Roughness has the most significant impact on erosive wear of rotor blades, followed by stator blades, and the least on guide blades. As roughness increases, the maximum wear rate concentration on the blades rises, while the location of the erosion-concentrated area does not significantly shift with changes in roughness. The results can provide a basis for the erosion wear assessment of compressor blades at different service stages.
- Article
(10251 KB) - Full-text XML
- BibTeX
- EndNote


As the primary power unit for helicopters, turboshaft engines have been widely used (Hao et al., 2023; He et al., 2019). As the core component of a turboshaft engine, responsible for energy conversion, the compressor's performance is directly related to the operational efficiency of the entire engine. Titanium alloys are widely used in compressor blades due to their low density and high specific strength (Wang et al., 2026). During helicopter operations in sandy environments such as deserts or sandy plateaus, external sand particles are inevitably ingested into the engine and collide with compressor blades, causing erosion wear (Kwon et al., 2021; Shi et al., 2023). With extended service duration, the surface roughness of the blade differs from its pre-service condition (Suzuki and Yamamoto, 2011). Surface roughness is a critical factor influencing wear (Joaquin et al., 2024; Persson, 2023), and its variation will alter the contact and impact behaviour between sand particles and the blades, resulting in notable differences in erosion wear characteristics. Therefore, investigating the influence of surface roughness on blade erosion wear characteristics holds significant engineering value for enhancing the operational safety of aero engines.
The erosion wear inflicted by solid particles on a target material is governed by multiple factors, such as particle velocity, impact angle, shape, density, and hardness (Hu et al., 2024; Zhang et al., 2023; Azakli and Gumruk, 2021; Yan et al., 2020; Shinde and Upadhyay, 2025). Azimian et al. (2015) found that the erosion depth and pile-up height increase linearly with rising impact velocity. However, the rate of increase in penetration depth progressively declines as the number of non-overlapping particle impacts grows. Li et al. (2021) and Ji et al. (2018) found that the damage inflicted by particles on Ti-6Al-4V alloy plates is dominated by micro-cutting at low impact angles and by extrusion deformation at high impact angles. Takaffoli and Papini (2012) found that the particle impact angle and initial motion state affect the material erosion pattern. Naveed et al. (2017) compared the effects of angular and spherical particles on the erosion wear of ductile and brittle materials. The results demonstrated an inverse trend in the erosion behaviour of these materials with changing particle shape. Specifically, spherical particles produced a lower material removal rate on ductile materials, while angular particles resulted in a lower removal rate on brittle materials. Wang and Nguyen (2021) found that both particle fraction and particle size have a significant influence on the material removal. Di et al. (2019) found that flake particles have a greater influence on erosion through micro-cutting than through extrusion, whereas spherical particles influence erosion more via extrusion than micro-cutting. They further found that higher particle roundness leads to a lower wear rate. Yang et al. (2023a) investigated the effect of particles with different hardness levels on the erosion wear of titanium alloy samples. They found that particles with higher hardness cause more severe erosion wear to the plates than those with lower hardness. Meanwhile, the extent of material erosion wear is also closely related to the material itself (Wang et al., 2019; Cai et al., 2021a; Shinde et al., 2025). Finnie et al. (1992) and Tilly (1973) found that for brittle materials, the wear rate increases with the impact angle, while for ductile materials, it first increases and then decreases. Islam et al. (2015) investigated the effect of microstructure on the erosion of pearlitic ferrite and pearlite. They found an inverse relationship between the hardness of the various microstructures and the wear rate. Coto et al. (2021) investigated the erosion behaviour of particles on coatings with different thicknesses and found that increasing the coating thickness can enhance erosion resistance. Ma et al. (2021) investigated the damage behaviour of TiZrN coatings under low-angle (30°) and high-angle (90°) impacts. They found that the coating improved the erosion resistance of the titanium alloy under low-angle impact. Under high-angle impact, the multi-layer coating exhibited the best erosion resistance. Owing to the complex structure of compressor blades and the irreversible damage caused by erosion tests on engines, conducting such tests on real engine blades is subject to significant limitations. Consequently, numerical simulation remains the primary method for investigating compressor blade erosion wear. In recent years, computational fluid dynamics (CFD) has been widely applied to this problem, enabling more detailed analysis of the erosion process (Wang et al., 2023; Shi et al., 2023). Tarodiya et al. (2022) investigated the erosion performance of a hydro-turbine injector using CFD simulations. They found an asymmetric distribution of erosion wear on the nozzle and needle valve surfaces. Increasing the design angle was shown to aggravate erosion at the nozzle, while reducing the erosion degree on the needle valve. Zhan et al. (2025) conducted a numerical simulation of gas–solid two-phase flow in a multi-stage axial compressor using CFD. They observed that erosion primarily occurs at the blade tip, leading edge, and trailing edge regions. Li et al. (2023) investigated the effect of sand particles on compressor blade erosion at four different rotational speeds. The results indicated that the erosion wear on the rotor blades at the design speed was significantly more severe than at other speeds. Poursaeidi et al. (2017) studied the erosion characteristics of solid particles on the first-stage compressor blades. Their findings revealed that in the erosion patterns observed on the guide blades, rotor blades, and stator blades, the highest wear rate occurred at the rotor blade tips and the leading edge of the stator hub. Cai et al. (2021b) employed methods such as separately tracking the incident and rebound information to study the rebound characteristics of flake and angular particles impacting stainless steel at high temperatures. Their work revealed the influence of incident parameters and particle size on particle rebound behaviour. Li et al. (2022) investigated three typical intake distortion angles (30, 90, and 120°), finding significant differences in erosion characteristics across the affected blade regions. Compared to blades without distortion, those subjected to distorted inflow exhibited substantially aggravated erosion wear. Yang et al. (2023b) investigated the influence of deformation degree on compressor blade erosion wear. The results showed that the surface wear rate of the blades increases with the degree of distortion. They further compared the effects of tip distortion, hub distortion, and no distortion on compressor erosion wear, finding that tip distortion has the greatest impact on compressor erosion, followed by no distortion, with hub distortion having the smallest effect (Yang et al., 2024).
The above literature review indicates that considerable progress has been made in the study of erosion wear, both domestically and internationally. However, with the extension of engine service time, the variation in blade surface roughness has emerged as a non-negligible issue. Liu et al. (2023) used the Finnie wear model to study the effect of surface roughness on the erosion wear of turbocharger aluminium alloy blades. The study found that as roughness increased, the erosion wear distribution on the pressure surface of the main blades spread from the blade tip towards the blade root. Taherkhani et al. (2025) conducted a numerical study and comparison of erosion wear on smooth and rough surfaces. They found that after single-particle low-velocity impact, the damage on the smooth surface was symmetric, while the damage on the rough surface was asymmetric. Liu et al. (2020) employed a hybrid approach combining CFD and the boundary element method (BEM) to investigate the effects of different surface roughness on compressor performance and noise. The study demonstrated that with increasing roughness, the total pressure ratio and isentropic efficiency of the compressor decrease, while the sound pressure level increases. Malhotra et al. (2022) investigated the effect of non-uniform roughness distribution on compressor performance and found that roughness at the blade leading edge has a more pronounced impact on performance than roughness at the trailing edge. Ma et al. (2025) studied the influence of surface roughness on compressor performance under different altitude conditions. The results indicated that surface roughness significantly affects both the aerodynamic performance and flow stability of the compressor. Biazar and Afzalian (2025) investigated the influence of blade surface roughness on turbine performance and efficiency. Their study demonstrated that increased roughness leads to reductions in the power coefficient, generator speed, and rotor torque, ultimately decreasing power output. Altmeppen et al. (2022) conducted experimental and numerical analyses focusing on the effect of surface roughness on particle rebound and its statistical distribution. Their research revealed that surface roughness significantly affects individual particle rebound. Chen et al. (2022) investigated the influence of surface roughness on the performance of a five-stage axial compressor. They found that changes in roughness have a greater impact on the performance of rear stages compared to front stages, with the performance degradation in the fifth stage having the most significant effect on the overall compressor performance. Yazik et al. (2024) employed a one-way 3D fluid–structure interaction method to simulate turbine performance under different surface roughness conditions. Their results showed that as roughness increases, the pressure difference across the blades decreases, thereby reducing the overall turbine performance.
From the above analysis, it can be seen that current research at home and abroad mainly focuses on the impacts of surface roughness on the noise and aerodynamic performance of compressor blades, and is limited to studies on the characteristics of erosion wear caused by single particles on rough surfaces. However, studies on the influence of surface roughness on the distribution and severity of erosion wear to multi-stage axial-flow compressor blades have not been reported. Therefore, this study takes the 1.5-stage compressor model of a turboshaft engine as the research object. Experimental setups for particle velocity measurement and titanium alloy erosion wear testing were designed and constructed. By conducting erosion wear experiments on the titanium alloy sample with different surface roughness, key parameters for the Tabakoff erosion wear model expression were obtained. The gas–solid two-phase flow method was employed to investigate the effect of surface roughness on compressor blade erosion wear. The study reveals the distribution of erosion wear and wear rate concentration on blades with different surface roughness, providing valuable references for erosion-resistant design and protection of turboshaft engine compressor blades.
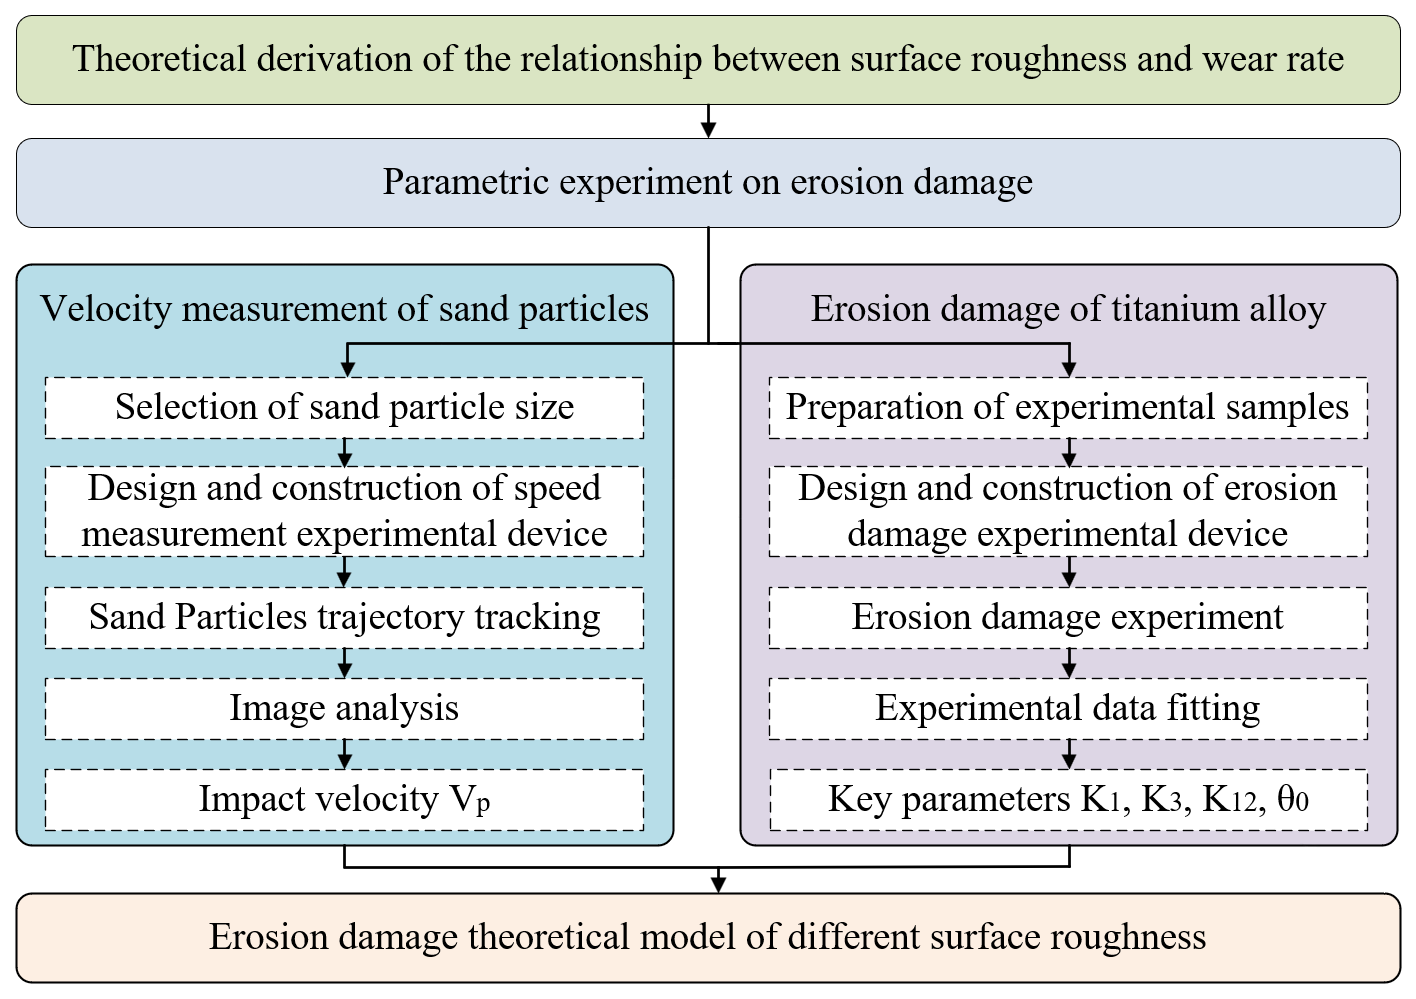
This section establishes the theoretical model for erosion wear, revealing the correlation between surface roughness and erosion wear through parameters such as wear rate and surface friction coefficient. It specifies the parametric experiments involved in the erosion wear theoretical model, including particle velocity measurement experiments and titanium alloy erosion wear experiments, with the experimental flowchart shown in Fig. 1. The particle velocity measurement experiments primarily consist of selecting the sand particle size, designing and constructing the experimental apparatus, and acquiring the sand particle trajectory data, ultimately enabling the determination of sand particle impact velocity under different air pressure conditions. The titanium alloy erosion wear experiment involves preparing test samples, designing and constructing the experimental apparatus, conducting erosion wear experiments, and calculating wear rates, with subsequent fitting of the experimental data to achieve the parameterization of the erosion wear theoretical model.
2.1 Erosion wear model considering surface roughness
Erosion wear caused by solid particles to engine blades has consistently been a serious problem in the field of turbine engines. Researchers worldwide have proposed numerous erosion models, including the Tabakoff erosion wear model (Grant and Tabakoff, 1973), the Finnie erosion wear model (Finnie, 1960), and the Oka erosion wear model (Oka et al., 2005). The Tabakoff model integrates particle dynamics, rebound characteristics, and material removal mechanisms, forming an empirical and semi-empirical model established through erosion tests on titanium alloy, stainless steel, and aluminium alloys. This model comprehensively accounts for interactions at different impact angles, leading to its widespread application. The present study adopts the Tabakoff erosion wear model, whose wear rate (E) is expressed as follows (Tabakoff et al., 1979):
where E is the dimensionless mass (eroded mass divided by sand particle mass); VP is the particle velocity; θ is the erosion angle; θ0 is the maximum erosion angle; RT is the tangential velocity recovery coefficient of particles; and k1, k2, k3, k4 and k12 are material constants. Through extensive experimentation, Tabakoff determined that for titanium alloy material, the value of k4 is 0.0016 (Tabakoff et al., 1974). Substituting Eqs. (2)–(5) into Eq. (1) yields
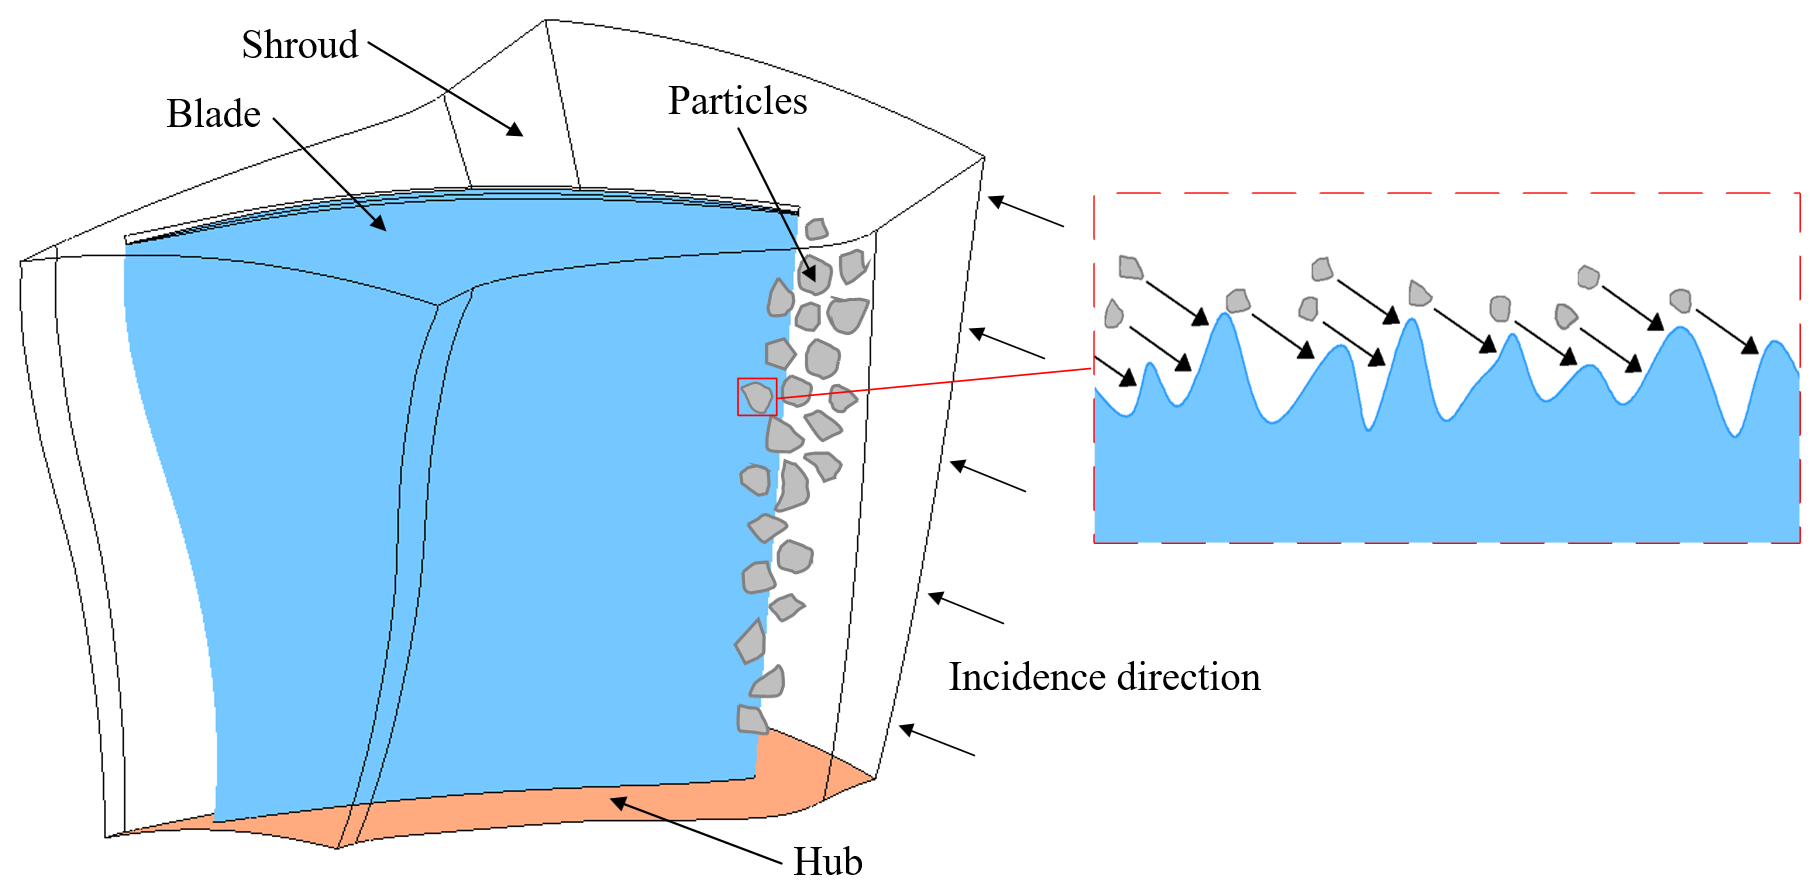
Since the tangential velocity recovery coefficient of particles after impacting the titanium alloy is related to the surface friction coefficient of the material, the expression for the tangential velocity recovery coefficient is given by (Wedel et al., 2024)
Combining Eqs. (8) and (9) yields
Combining Eqs. (7) and (10) yields
where vt is the tangential velocity of the particle before impact, vt′ is the tangential velocity of the particle after impact, vn is the normal velocity of the particle before impact, Jt is the tangential impulse of the particle, Jn is the normal impulse of the particle, e is the normal restitution coefficient of the particle, and μ is the surface friction coefficient of the material.
From Eqs. (1) and (11), it can be seen that the erosion rate E is correlated with the surface friction coefficient μ, and the surface friction coefficient is closely related to the surface roughness (Jiang et al., 2008). Therefore, it can be inferred that there is a relationship between surface roughness and the erosion rate.
2.2 Acquisition of parameters for erosion wear models based on experiments
2.2.1 Particle velocity measurement experiments
Based on existing research, this paper selects SiO2 particles with a mean particle size of 177 µm and a purity of ≥ 99.5 %. The particle size measurement method adopts the standard sieve analysis method in compliance with GB/T 6003.1-2012. To obtain the impact velocity of sand particles striking the titanium alloy sample, a particle velocity measurement (PIV) experimental setup was constructed, as illustrated in Fig. 3. The PIV experimental setup comprises a charge-coupled device (CCD) camera, laser, laser system, data acquisition and analysis system, three-dimensional coordinate frame, and nozzle. As a non-contact fluid dynamic velocity measurement technique, PIV can instantaneously measure both average and instantaneous particle velocities. With advantages including high accuracy, it has been widely applied in particle velocity measurement experiments (Cai et al., 2021b). The experimental procedure was conducted as follows: with air pressure set at 0.5 MPa, the three-dimensional coordinate frame was adjusted to ensure proper laser illumination of the sand particle flow region. The CCD camera subsequently captured continuous images of sand particles from the nozzle exit to a position 30 mm downstream. Using specialized processing software and cross-correlation algorithms, the sand particle trajectories were synthesized to generate the velocity vector field. Through three repeated test trials, the average impact velocity of sand particles at 30 mm from the nozzle was determined to be 74.71 m s−1.
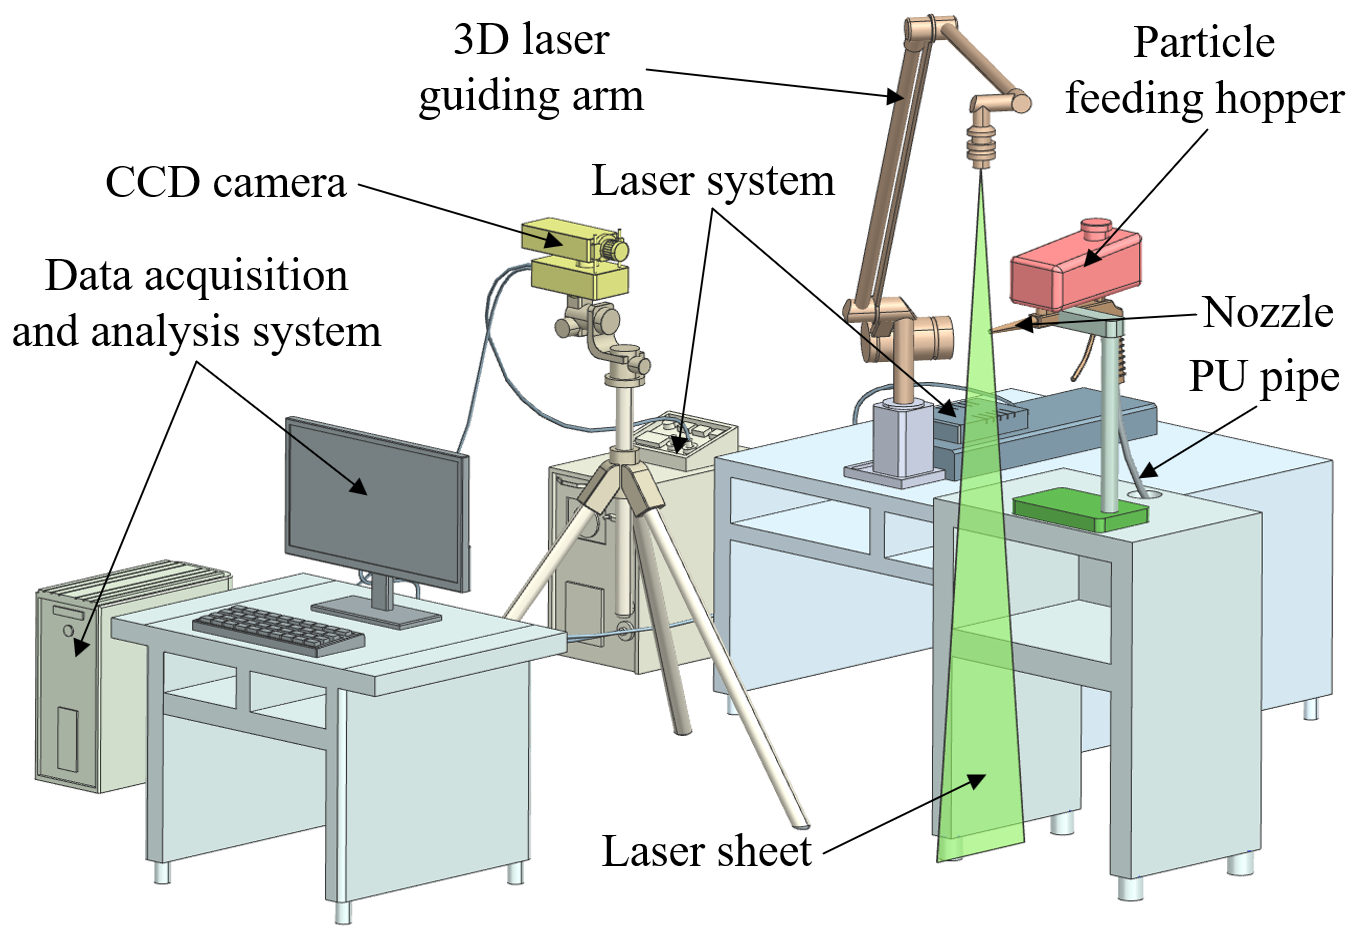
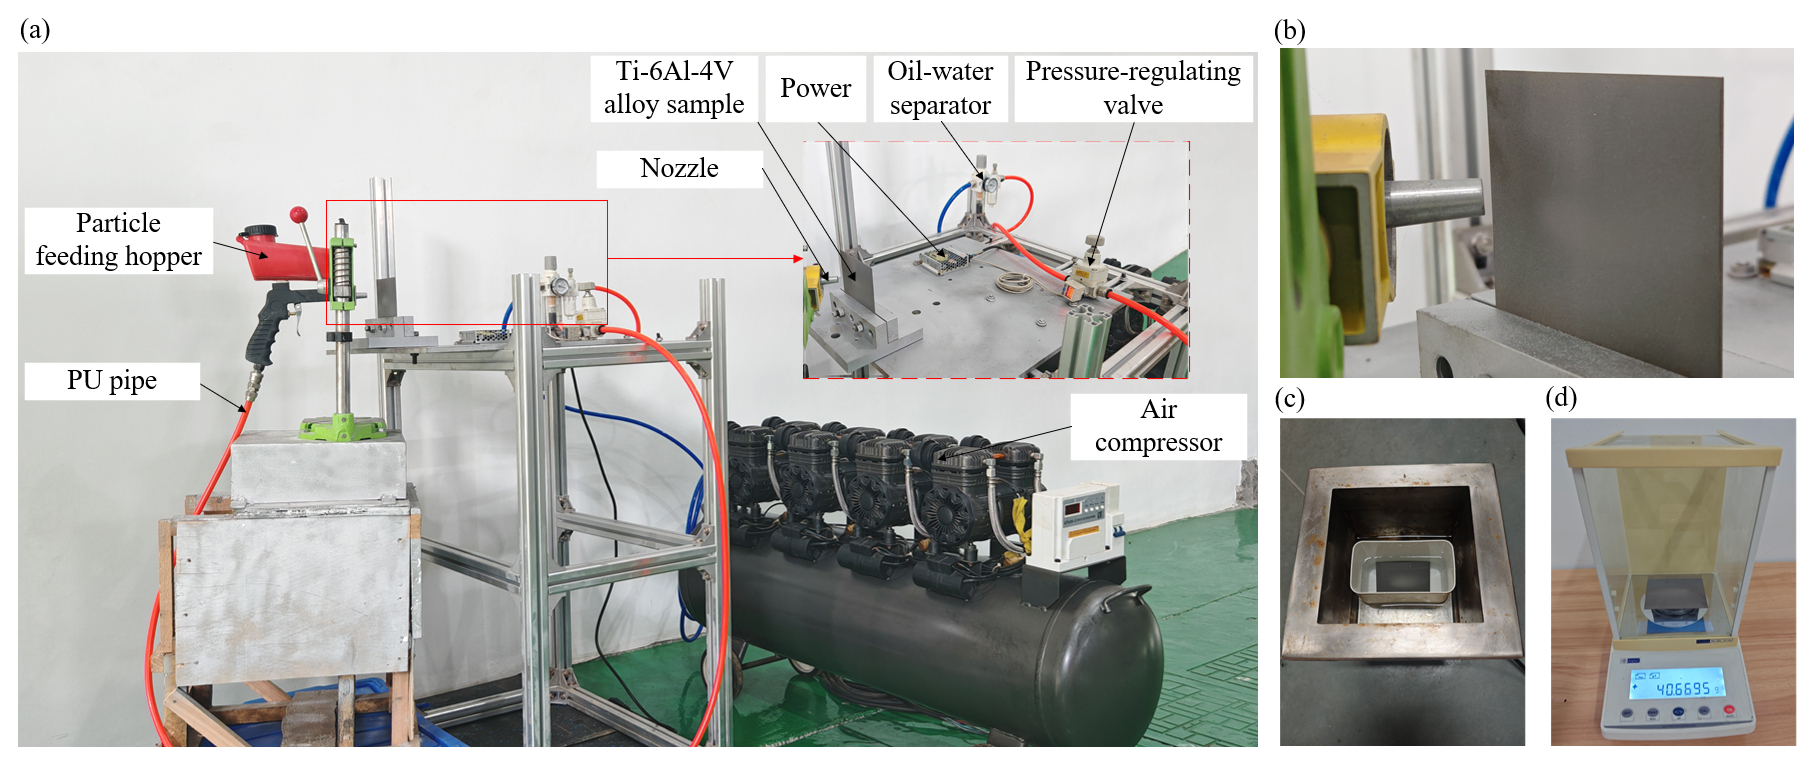
Figure 4(a) Experimental setup of Ti-6Al-4V alloy erosion wear, (b) erosion of the sample, (c) ultrasonic cleaning of the sample, (d) weighing the sample.
2.2.2 Erosion wear experiments on titanium alloy with different surface roughness
An erosion wear experiment bench, as shown in Fig. 4a, was constructed to obtain the erosion wear of titanium alloy samples caused by SiO2 particles at different impact angles. The test bench consists of an air compressor, oil-water separator, precision digital pressure regulating valve, spray gun, and fixture. Air is pressurized by the compressor to form high-pressure gas, which then passes through the oil-water separator to remove moisture. The gas flow rate is controlled by the precision digital pressure regulating valve, and the gas enters the spray gun, carrying sand particles that are ejected from the nozzle to erode the titanium alloy sample. To achieve titanium alloy samples with different surface roughness, surface treatment was performed. First, the titanium alloy plate was polished using 600-grit and 2000-grit sandpapers to remove the surface oxide layer. The surface roughness of the polished specimen was then measured using a TR210 surface roughness tester, yielding an Ra value of 0.1 µm. Considering the high hardness of the material, sandblasting was applied to the titanium alloy samples to obtain different surface roughness. It should be noted that, due to the uncontrollable nature of the sandblasting equipment, the surface roughness Ra of the treated plates is not absolutely uniform. To reduce measurement error, three measurement points were randomly selected in the eroded region of each titanium alloy specimen, and their average value was taken as the surface roughness of the sample.
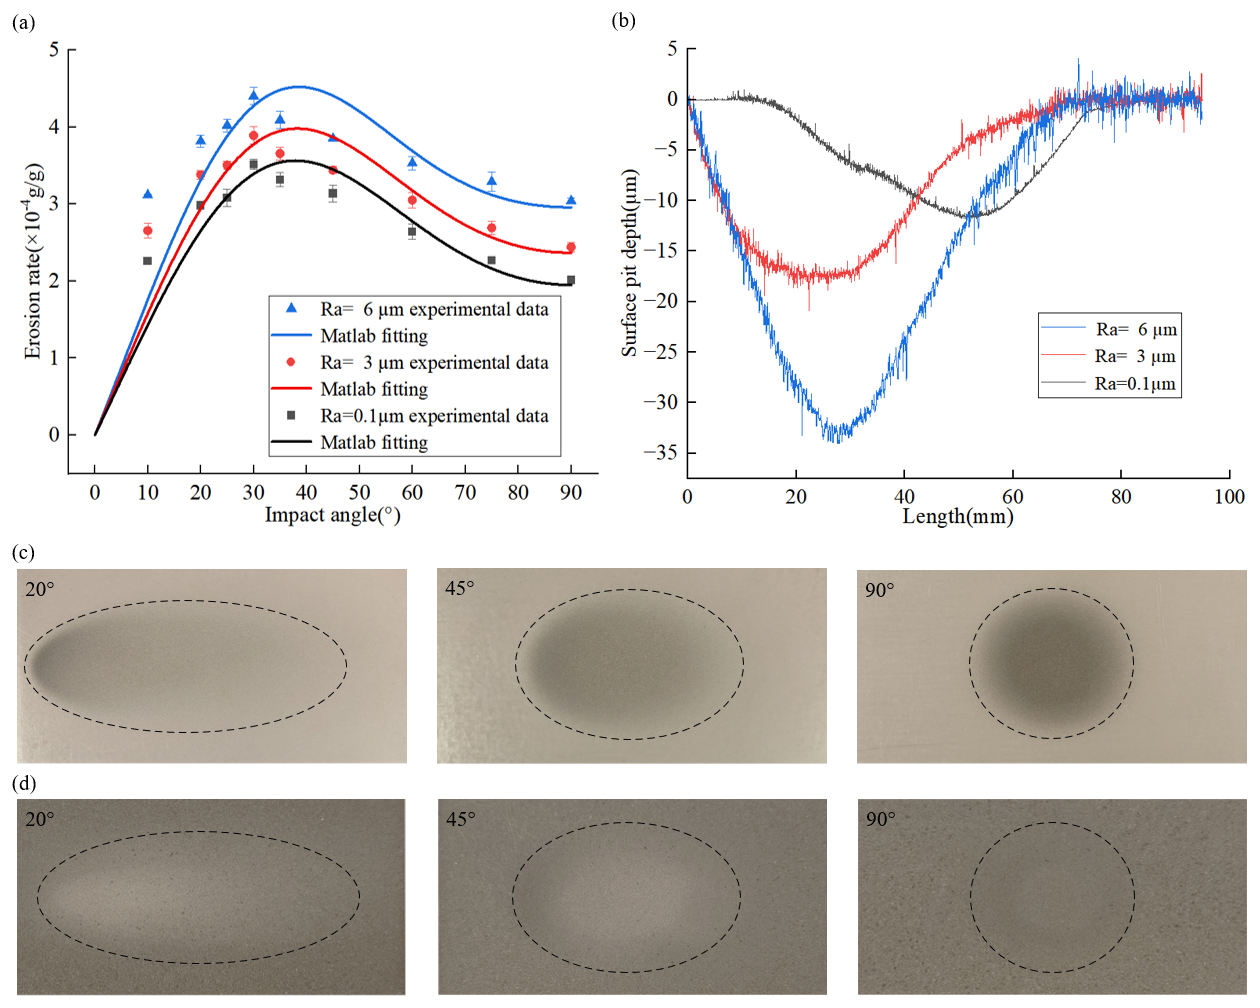
Figure 5(a) Wear rate of titanium alloy at different impact angles, (b) surface profile of titanium alloy at an impact angle of 30°, (c) experimental results of erosion wear on titanium alloy samples with Ra =0.1 µm at different impact angles, (d) experimental results of erosion wear on titanium alloy samples with Ra =3 µm at different impact angles.
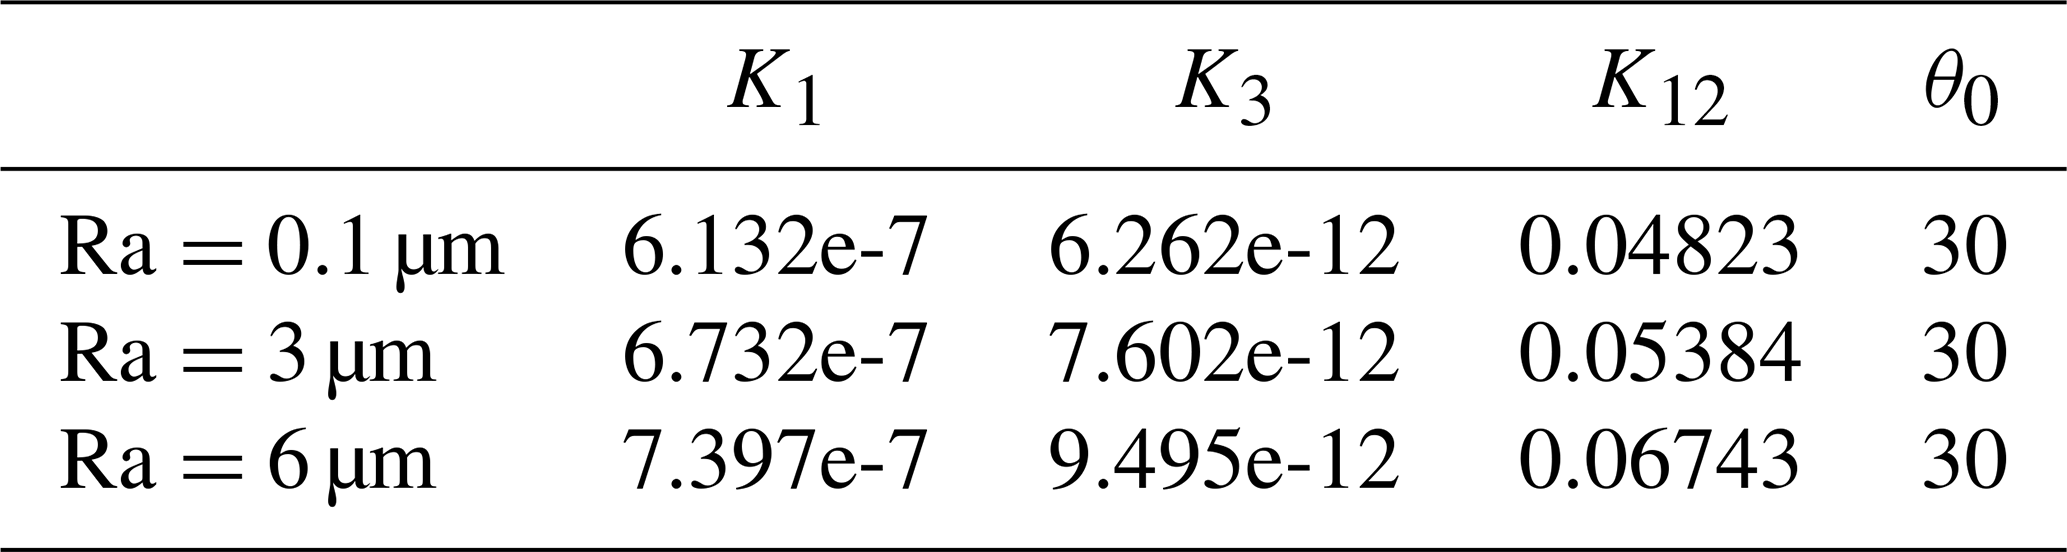
This study selected surface roughness Ra of 0.1, 3, and 6 µm for experimentation. Prior to the experiment, the titanium alloy samples underwent ultrasonic cleaning, drying, and initial weighing on an analytical balance with 0.1 mg precision, recorded as M1. After the erosion test, the titanium alloy samples were again subjected to ultrasonic cleaning, drying, and a second weighing, recorded as M2. The wear rate was calculated as , where Mp is the mass of sand particles. By adjusting the fixture angle and repeating the above experimental procedure, erosion wear results under different impact angles were obtained, as shown in Fig. 5a. The results demonstrate that the wear rate initially increases and then decreases with increasing impact angle, reaching its maximum at 30°. Figure 5b presents the surface profiles of the titanium alloy with three different roughnesses after erosion testing at a 30° impact angle. As observed, the titanium alloy with Ra =6 µm exhibits relatively deep surface pits with significant profile fluctuations, reaching a maximum pit depth of 34 µm. In comparison, the Ra =3 µm titanium alloy demonstrates shallower pits with reduced profile fluctuations and a maximum depth of approximately 18 µm, while the Ra =0.1 µm titanium alloy shows even shallower pits with relatively smooth profile variations and a maximum depth of about 12 µm. The maximum pit depth of the Ra =6 µm titanium alloy was 88.9 % and 183.3 % greater than that of the Ra =3 and Ra =0.1 µm samples, respectively. This analysis reveals a correlation between surface roughness and the depth of erosion-induced pits. Higher surface roughness indicates a greater distribution of surface asperities and valleys. During sand particle impact, the sand particles are more likely to interact with these irregular structures, resulting in greater impact forces on localized areas. This leads to increased material loss and, consequently, deeper pit formation. Observation results for Ra =0.1 and Ra =3 µm titanium alloy samples after erosion testing at impact angles of 20, 45, and 90° are presented in Fig. 5c and d, respectively. Through the fitting of experimental data, key parameters of the Tabakoff erosion wear model for the three roughnesses were obtained, as summarized in Table 1.
Table 1Key parameters of the Tabakoff erosion wear model for different surface roughness conditions.
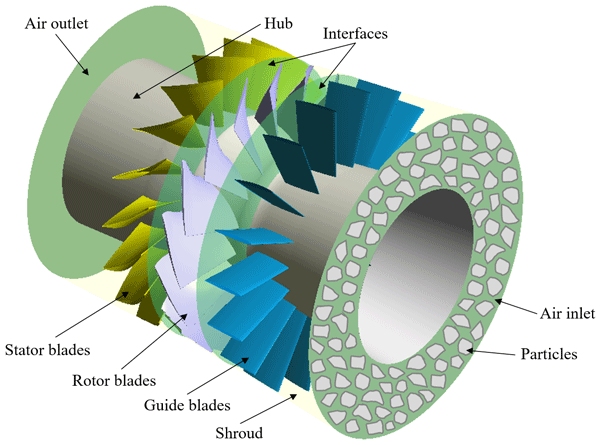
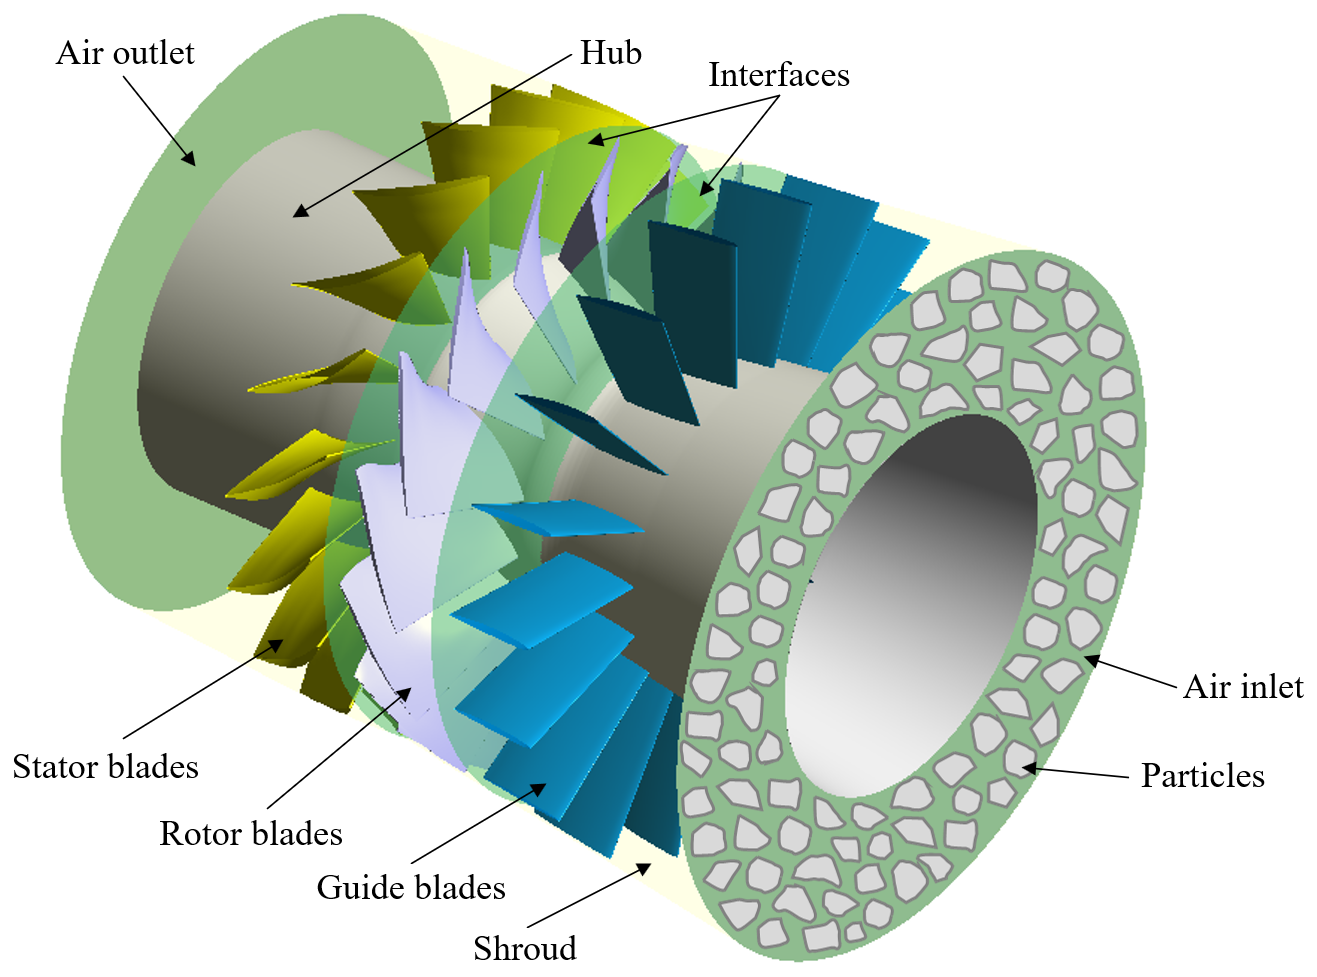
This section begins by delineating the constituent elements of the research subject and establishes a three-dimensional compressor model, as illustrated in Fig. 6. To conduct the numerical simulation study, the model was discretized using three distinct types of grids. Experimentally determined parameters obtained from Sect. 2.2 were incorporated as input conditions to define the boundary conditions. Finally, to validate the reliability of the adopted numerical approach, the simulation results were compared with publicly available experimental data, confirming the effectiveness of the simulation methodology.
3.1 Composition of the research subject
This study investigates the first 1.5-stage compressor model of a turboshaft engine, whose structural composition is shown in Fig. 6. It mainly includes 18 guide vanes, 16 rotor blades, 18 stator blades, a casing, and a hub. The guide vanes function to smoothly direct airflow into the rotor blade region while minimizing flow losses. The rotor blades transfer mechanical energy to the airflow through rotation, converting part of this energy into a pressure increase. The stator blades further convert the remaining energy from the rotor blades into additional pressure rise and guide the airflow to the required inlet direction for the next rotor stage. The casing serves to protect the internal structure of the compressor and enhance air compression efficiency, while the hub supports the rotation of the rotor blades.
3.2 Mesh generation and boundary condition setup
Mesh quality is crucial for numerical simulation results. This study employs O-grid, H-grid, and butterfly grid for discretizing the compressor model. Specifically, O-grids are applied around the guide blades, rotor blades, and stator blades with local refinement to accurately capture sand particle erosion behaviour on blade surfaces. Considering the effects of tip leakage flow, butterfly grids are utilized in the tip clearance region, while H-grids are adopted for the remaining areas of the model. The turboshaft engine mesh model is presented in Fig. 7. To reduce the influence of mesh density on the simulation results, a grid independence study was conducted prior to the numerical simulations. Under the same erosion wear model and for the same research object as those used in this study, it was reported that when the total number of compressor mesh elements reaches 2.74 million (Yang et al., 2023a), the average blade erosion wear rate becomes essentially stable. Therefore, this study employs a model containing 2.74 million grids.
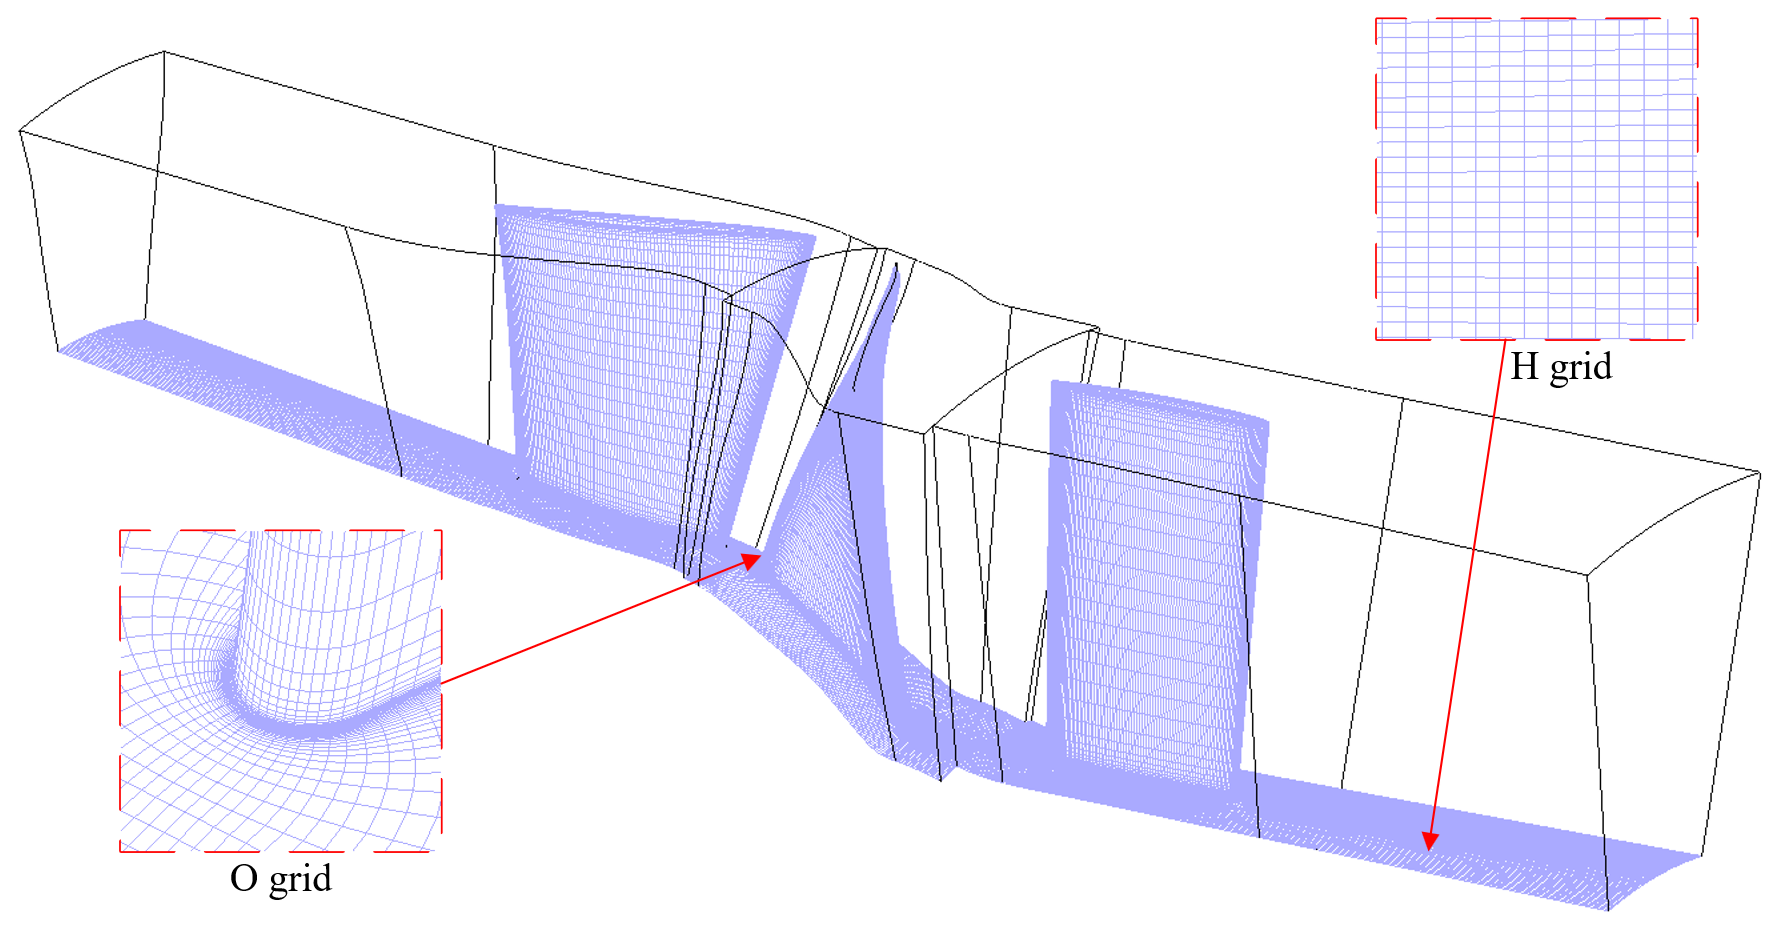
The mesh model was imported into the CFD computational platform, and a gas–solid two-phase flow model of the compressor was established. Since the internal flow process of the compressor is highly complex, the following assumptions are made to ensure the feasibility and reasonableness of the simulation: the inlet total pressure was set to the atmospheric pressure of 101 325 Pa, with a total temperature of 288.15 K. The outlet static pressure was determined by solving the radial equilibrium equation. The compressor blade surfaces, hub, and casing were configured as adiabatic no-slip walls. Data transfer between the guide blades and rotor blades, as well as between the rotor blades and stator blades, was achieved using the frozen rotor method. The SiO2 particles are treated as an adiabatic discrete phase, and their motion velocity is governed by the airflow. The particles enter the compressor randomly from the inlet with the flow, and their particle size is consistent with that used in the erosion wear experiments. The k−ε turbulence model is employed for numerical solution. The Tabakoff erosion model was employed in the analysis software, and the key parameters obtained from the parametric experiments in Sect. 2.2 were input to analyse the interaction between sand particles and the blades. At the same time, the surface roughness Ra needs to be converted into the equivalent sand-grain roughness Ks and incorporated into the wall function in CFX. The relationship between the surface roughness Ra and the equivalent sand-grain roughness Ks is given as follows (Koch and Smith, 1976):
In CFX, the erosion rate E refers to the local erosion rate on the blade surface, defined as the material removal per unit area per unit of time, with units of kg m−2 s−1 (Shah and Jain, 2007):
where mP represents the mass flow rate of particles, C(RP) is a function of particle size, f(θ) is a function of the impact angle, A is the velocity exponent, and S denotes the surface area.
3.3 Gas–solid two-phase flow theory
3.3.1 Gas-phase governing equations
The working medium in the compressor is continuously flowing high-speed compressible air, and the internal flow field is a typical locally transonic turbulent flow. The characteristics of the flow field are usually described using numerical discretization methods to solve the continuity equation and the Reynolds-averaged Navier–Stokes (RANS) equations. The governing equations are as follows.
Continuity equation:
Momentum equations:
where ρ is the density, Ui and Uj are the velocity components, xi and xj are the spatial coordinates in tensor form, p is the pressure, τ represents the viscous shear stress, R denotes the Reynolds stress term, and SM is the generalized source term in the momentum equations.
The solution of the above momentum equations requires a turbulence model to close the system of equations. The standard k−ε turbulence model is adopted, and its governing equations are as follows:
where k is the turbulent kinetic energy, μ is the dynamic viscosity, ε is the turbulent dissipation rate, Gk is the production term of turbulent kinetic energy, σk is the turbulent Prandtl number, and C1ε, C2ε, Cμ, and σε are empirical constants, which are taken as 1.44, 1.92, 0.09, and 1.3, respectively (Kamble et al., 2020).
3.3.2 Solid-phase governing equations
The solid particles in the gas–solid two-phase flow of the compressor are dilute-phase particles, which can be simulated using a one-way coupled discrete particle model. The governing equations for particle motion can be expressed as follows:
where UP, ρP, and dP are the particle velocity, density, and diameter, respectively; U and ρ are the gas velocity and density, respectively; g is the gravitational acceleration; CD is the dimensionless drag coefficient; FR is the sum of external forces acting on the particle; and Re is the particle relative Reynolds number.
3.4 Accuracy verification of the numerical method
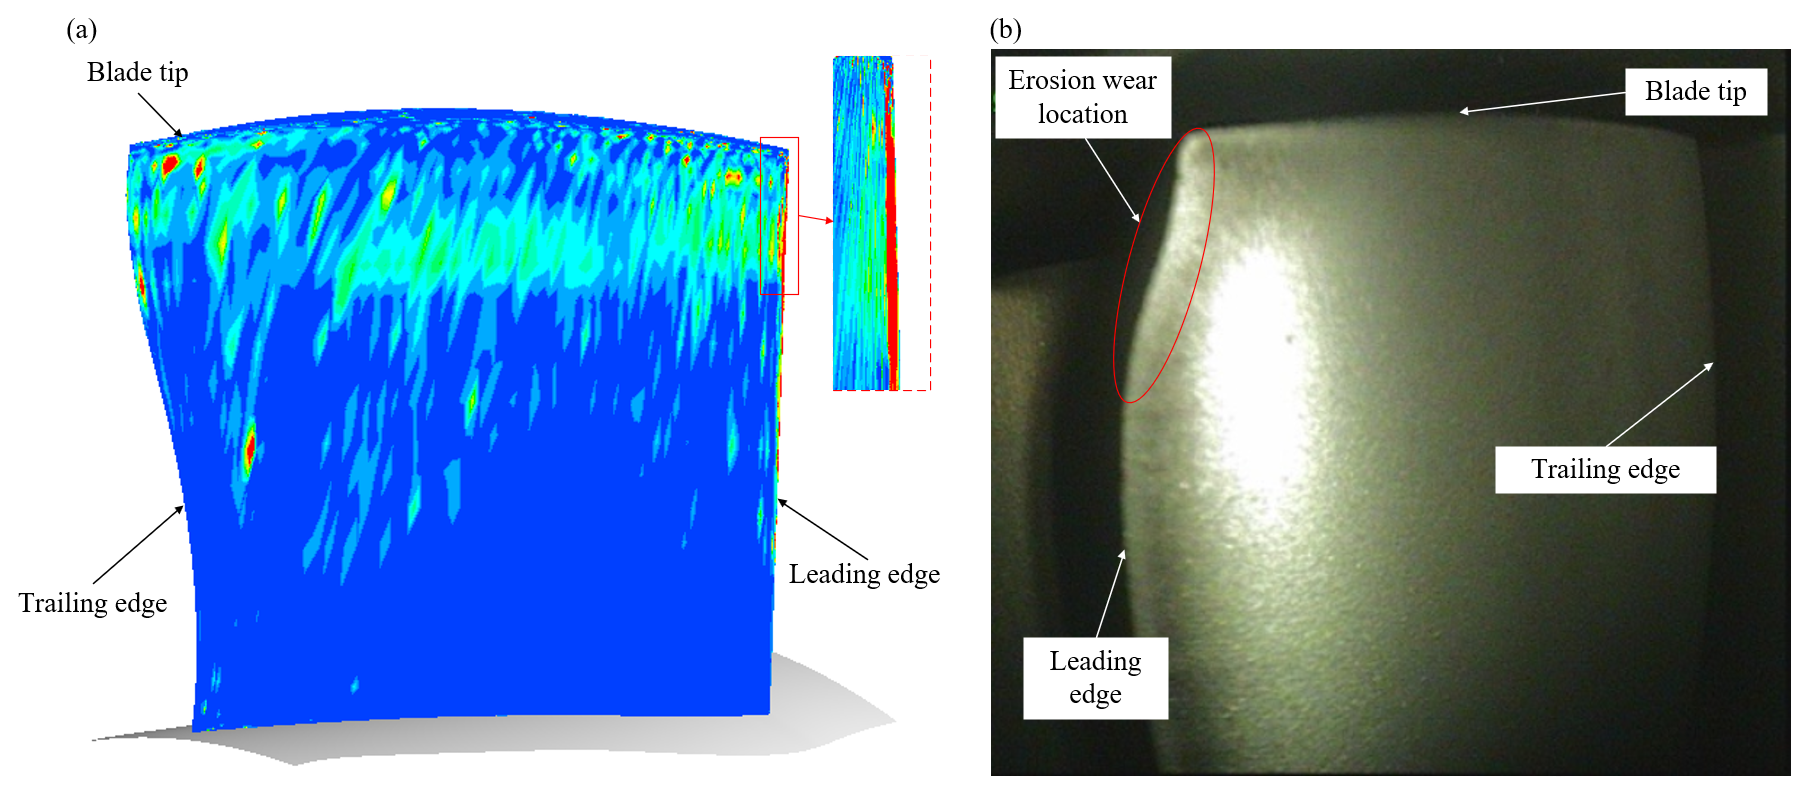
Through fitting analysis of experimental data, the key parameters in the Tabakoff erosion wear theoretical model were obtained. This method enables quantitative characterization of particle–wall interaction mechanisms by accurately simulating erosion wear behaviour under actual compressor operating conditions. To validate the model's reliability, the Tabakoff research team first optimized the model parameters by fitting experimental data under specific velocity conditions, then predicted wear rates under different velocity conditions. Comparative results demonstrated strong agreement between the model predictions and the measured data, fully verifying the model's accuracy and applicability in engineering practice. Furthermore, the numerical simulation results of this study were compared with the compressor blade erosion wear patterns observed by Polish researchers. Under actual operating conditions, minor discrepancies in erosion wear distribution exist between the simulated and observed results due to factors such as non-uniform sand particle sizes and intake distortion. However, both approaches consistently indicate a higher wear rate characteristic at the leading edge of the rotor blades. Based on the comprehensive analysis above, it can be confirmed that the numerical calculation method employed in this study possesses high accuracy and effectively meets the requirements for analysing gas–solid two-phase flow phenomena and their fundamental mechanisms.
When the engine operates under different sand particle concentration conditions and varying service durations, the impact of sand particles ingested into the engine on the blades leads to significant variations in local wear, consequently causing spatial distribution changes in the blade surface roughness. This paper presents the erosion wear distribution patterns of the guide blades, rotor blades, and stator blades under three surface roughness conditions. By examining the sand particle average volume fraction in the blade flow field, the underlying causes for the different erosion wear distributions are investigated. The erosion wear extent at typical blade span positions under different surface roughness is quantified.
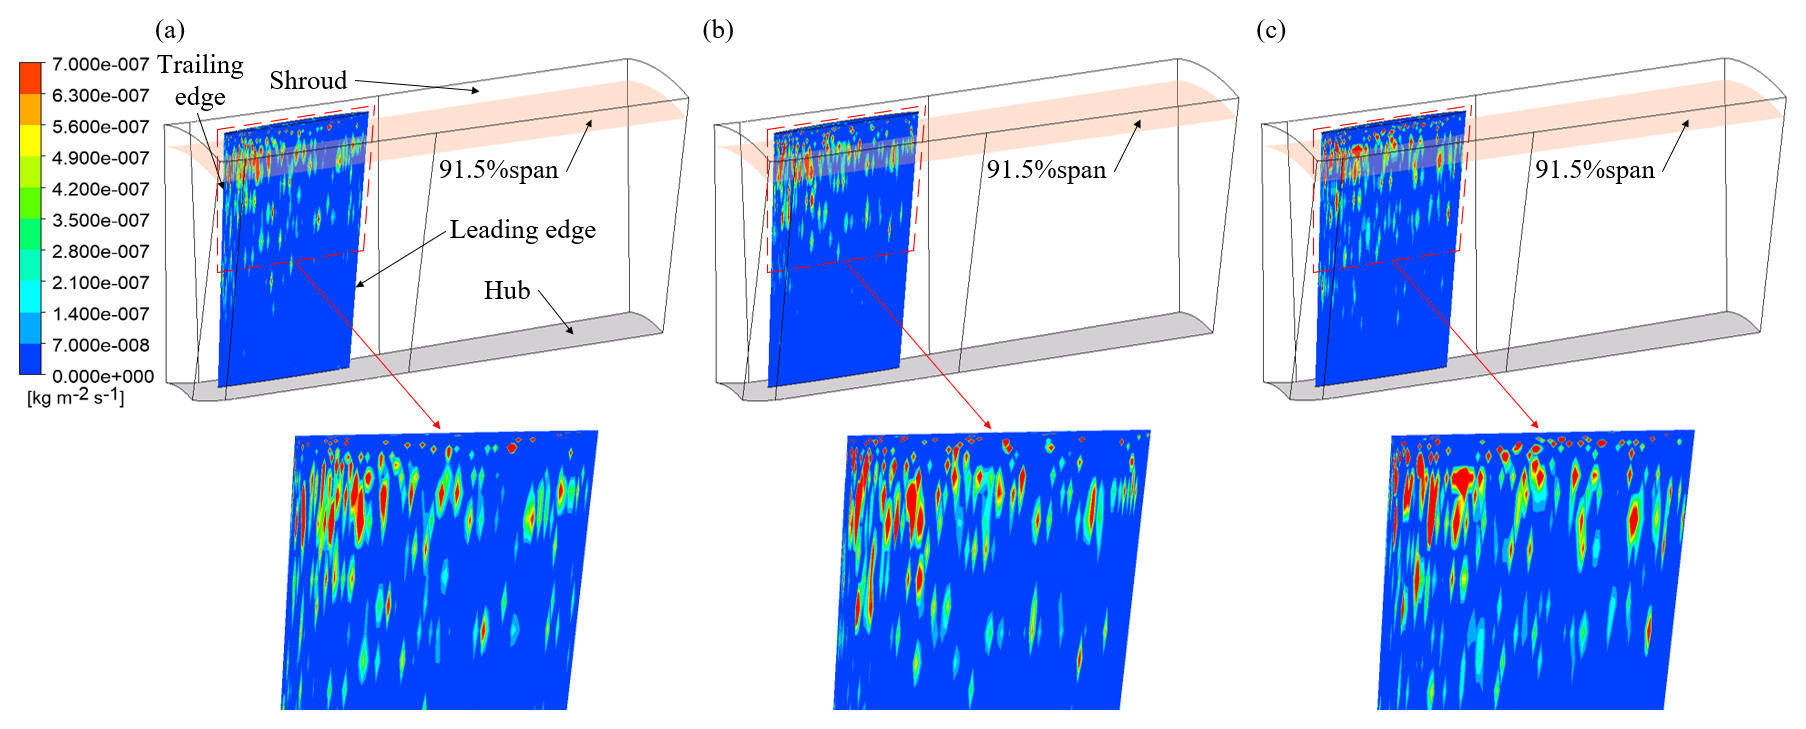
Figure 9Erosion wear distribution on the pressure surface of the guide blade for (a) Ra =0.1 µm, (b) Ra =3 µm, and (c) Ra =6 µm.
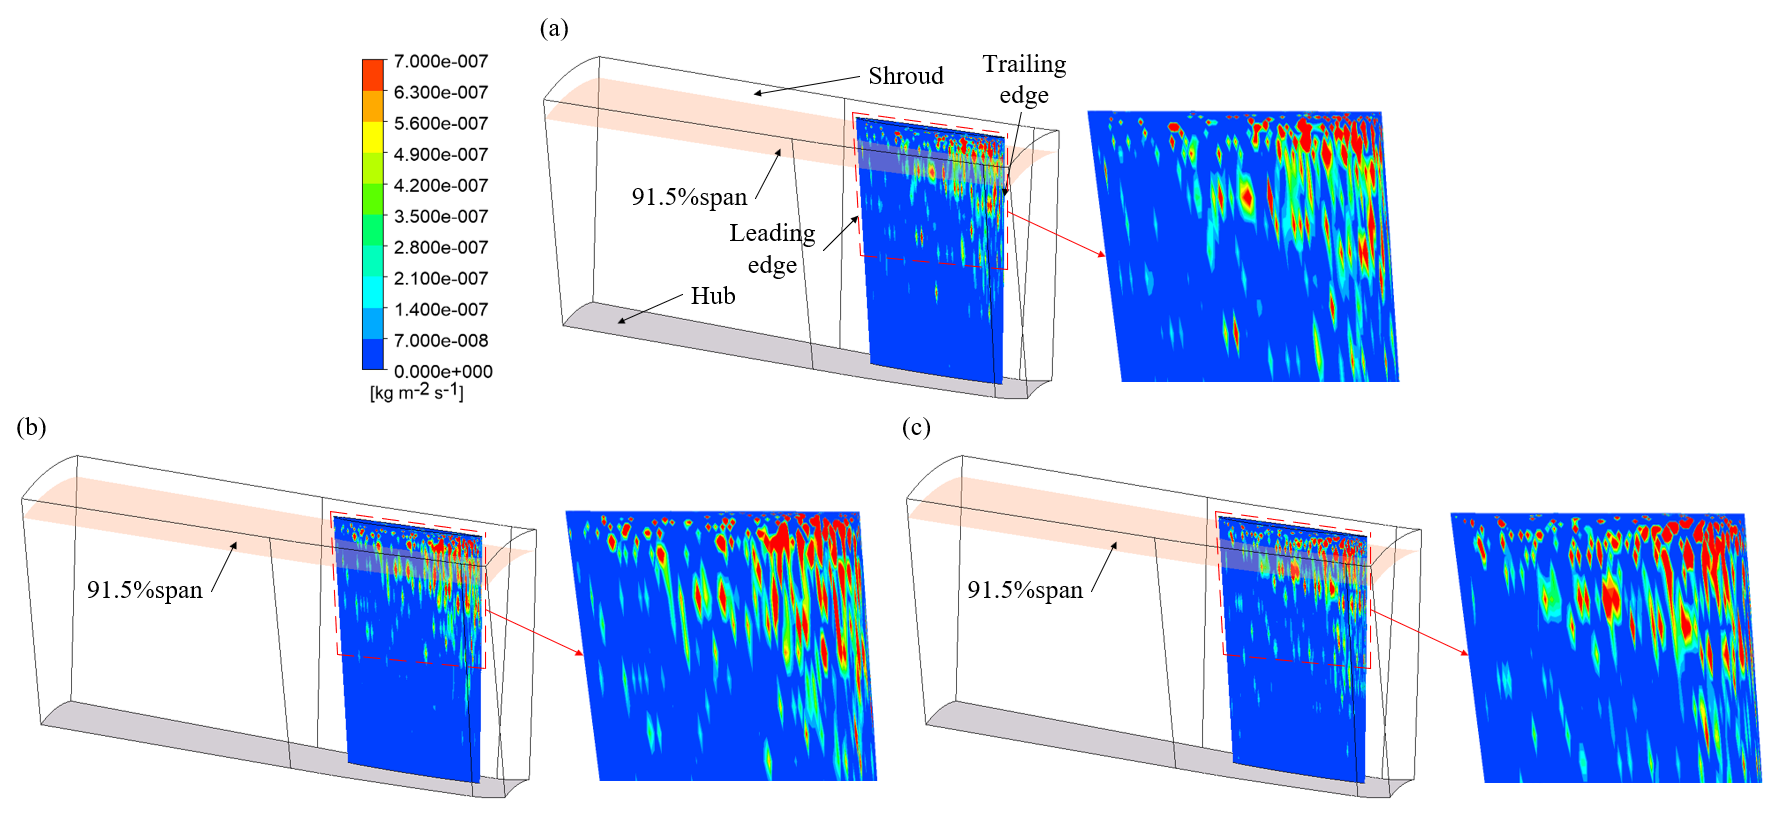
Figure 10Erosion wear distribution on the suction surface of the guide blade for (a) Ra =0.1 µm, (b) Ra =3 µm, and (c) Ra =6 µm.
4.1 Influence of surface roughness on the guide blade erosion wear
After sand particles enter the compressor, they collide with the leading edge, pressure surface, and suction surface of the guide vanes. The erosion wear distribution patterns of the guide vanes under different surface roughness conditions are presented in Figs. 9 and 10. Analysis reveals that the erosion wear exhibits relatively scattered distribution characteristics, with the primary erosion wear area concentrated near the trailing edge of both the pressure and suction surfaces. Furthermore, while the location of the main erosion wear area does not shift significantly with changes in surface roughness, the area of the erosion wear region shows a gradual expansion as roughness increases. The underlying mechanism for these observations can be attributed to three main factors. First, due to the installation angle of the guide blades, when particles enter the guide blade passage, a portion of them have an impact on the trailing edge of the blades and then rebound, subsequently striking the trailing edge region of adjacent blades. As a result, erosion wear is mainly concentrated near the trailing edge of the guide blades. Second, increased surface roughness enhances the height of surface micro-asperities, promoting more frequent cutting interactions between sand particles and surface peaks, thereby enlarging the erosion wear area. Finally, the relatively regular geometric profile of the guide vanes, combined with the small airflow attack angle at the leading edge region, reduces the probability of sand particle impact on the leading edge, resulting in comparatively lower wear rates in this area.
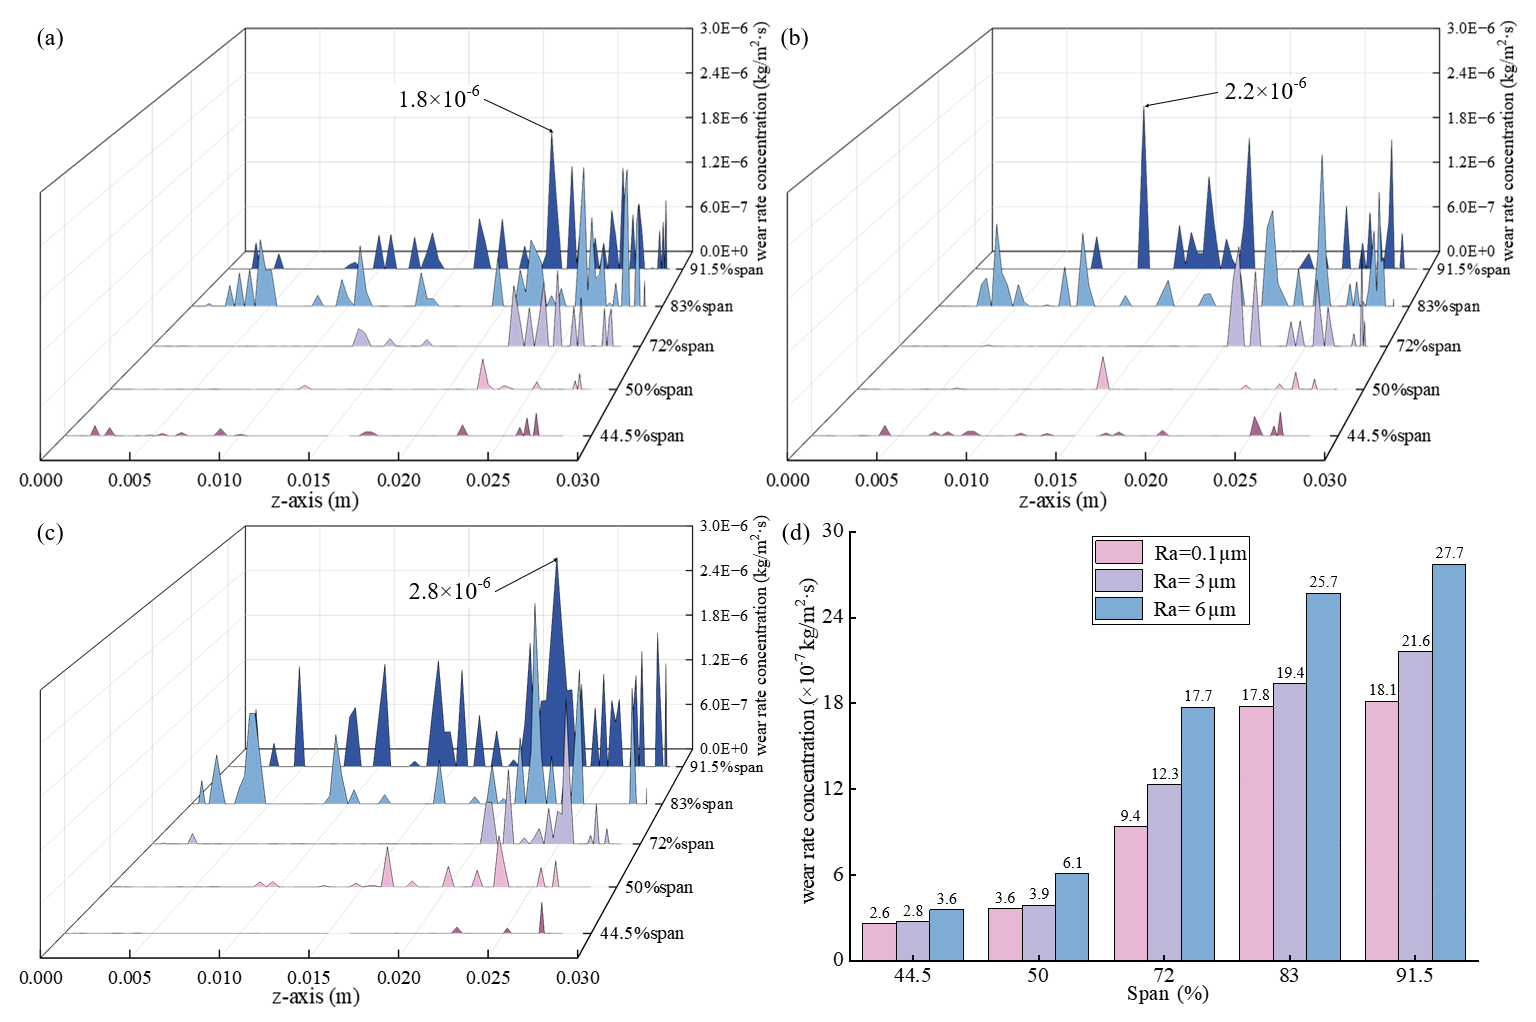
Figure 11Wear rate concentration values at typical blade heights on the pressure surface of the guide blade for (a) Ra =0.1 µm, (b) Ra =3 µm, and (c) Ra =6 µm; (d) maximum wear rate concentration value at typical blade heights.
The wear rate concentration values at typical blade span positions on the pressure surface of the guide blade with different roughness are shown in Fig. 11a–c. The results indicate that when the blade span exceeds 72 %, the wear rate concentration value in the trailing edge region increases significantly. Under different roughness conditions, the distribution curves of wear rate at the typical blade span on the pressure surface of the guide blades exhibit noticeable fluctuations. This phenomenon stems from the randomness of sand particle trajectories and spatial distribution. The irregular motion of sand particles in the flow field leads to non-uniform impact on the blade surface, consequently resulting in the absence of a strict linear proportional relationship between wear rate and surface roughness. The distribution characteristics of the maximum wear rate concentration values at typical blade span positions on the pressure surface of the guide blade are presented in Fig. 11d. The figure shows that the maximum wear rate concentration value increases synchronously with both rising surface roughness and increasing blade span. This trend aligns well with the overall wear rate pattern observed in Fig. 9, further validating the influence of surface roughness on blade wear severity. Specifically, at 83 % blade span, the maximum wear rate concentration value shows a marked increase compared to that at 72 % blade span, with a 45.2 % increase observed at Ra =6 µm. Further examination of the maximum wear rate concentration values at the 91.5 % blade span position reveals clear gradient variations across different roughness conditions: at Ra =0.1 µm, the maximum wear rate concentration value is kg m−2 s−1; at Ra =3 µm, it increases to kg m−2 s−1, representing a 19.3 % increase relative to Ra =0.1 µm; while at Ra =6 µm, it further rises to kg m−2 s−1, corresponding to a 53.0 % increase compared to Ra =0.1 µm.
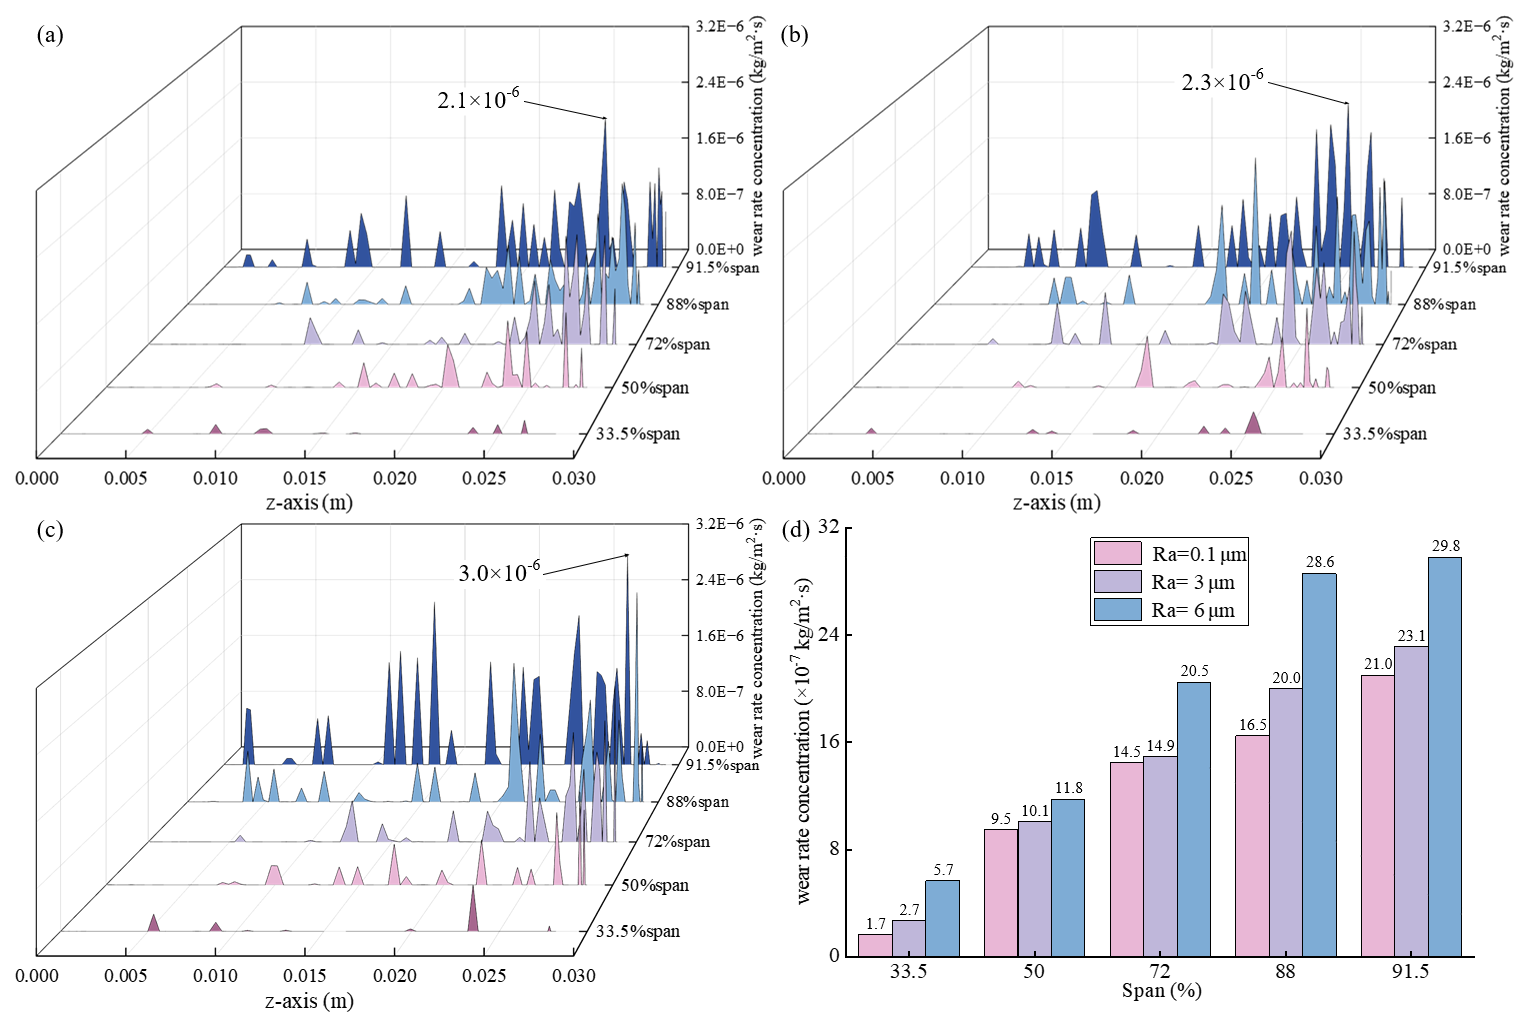
Figure 12Wear rate concentration values at typical blade heights on the suction surface of the guide blade for (a) Ra =0.1 µm, (b) Ra =3 µm, and (c) Ra =6 µm; (d) maximum wear rate concentration value at typical blade heights.
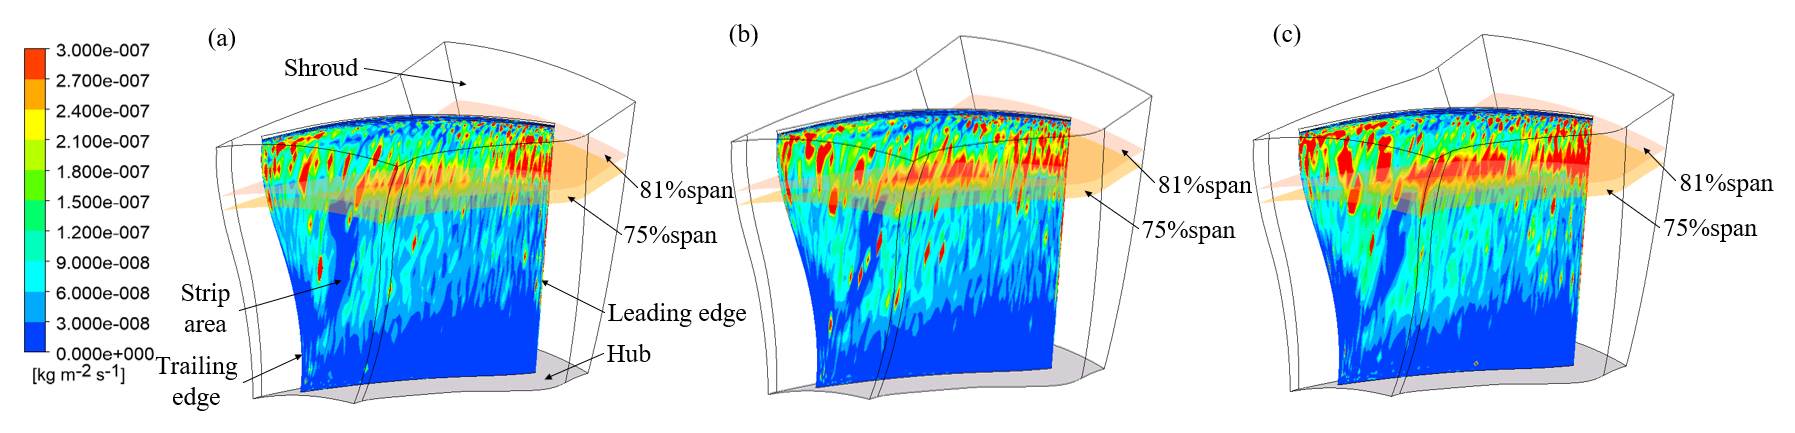
Figure 13Erosion wear distribution on the pressure surface of the rotor blade for (a) Ra =0.1 µm, (b) Ra =3 µm, and (c) Ra =6 µm.
The wear rate concentration values at typical blade span positions on the suction surface of the guide blade with different roughness are shown in Fig. 12a–c. It can be observed from the figures that when the blade span exceeds 72 %, the wear rate concentration value in the trailing edge region shows a significant increasing trend, which is consistent with the erosion wear characteristics observed in the trailing edge region of the pressure surface of the guide blade. Further observation of the wear rate concentration value curves at the typical blade span reveals a distinct fluctuating distribution pattern, indicating non-uniform erosion wear distribution at the same blade span position across different roughness. This phenomenon similarly originates from the randomness of sand particle trajectories and spatial distribution. The irregular motion of sand particles in the flow field leads to intermittent and locally concentrated impacts on the suction surface, resulting in the absence of a strict linear proportional relationship between wear rate and surface roughness. Specifically, the random distribution of sand particle impacts creates alternating zones of high and low wear on the suction surface, ultimately manifesting as fluctuating wear rate characteristics. The distribution characteristics of the maximum wear rate concentration values at typical blade span positions on the suction surface of the guide blade are presented in Fig. 12d. The results demonstrate that the maximum wear rate concentration value increases synchronously with both increasing surface roughness and blade span, showing consistency with the overall wear rate trend observed in Fig. 10. Specifically, at the 91.5 % blade span position on the suction surface, the maximum wear rate concentration values for Ra =0.1, Ra =3, and Ra =6 µm are , , and kg m−2 s−1, respectively. Compared to Ra =0.1 µm, the maximum wear rate concentration values for Ra =3 and Ra =6 µm increase by 10.0 % and 41.9 %, respectively. Notably, when Ra =6 µm, the maximum wear rate concentration value on the suction surface is 7.6 % higher than that on the pressure surface, suggesting that the suction surface trailing edge region may become a more critical wear area under high roughness conditions.
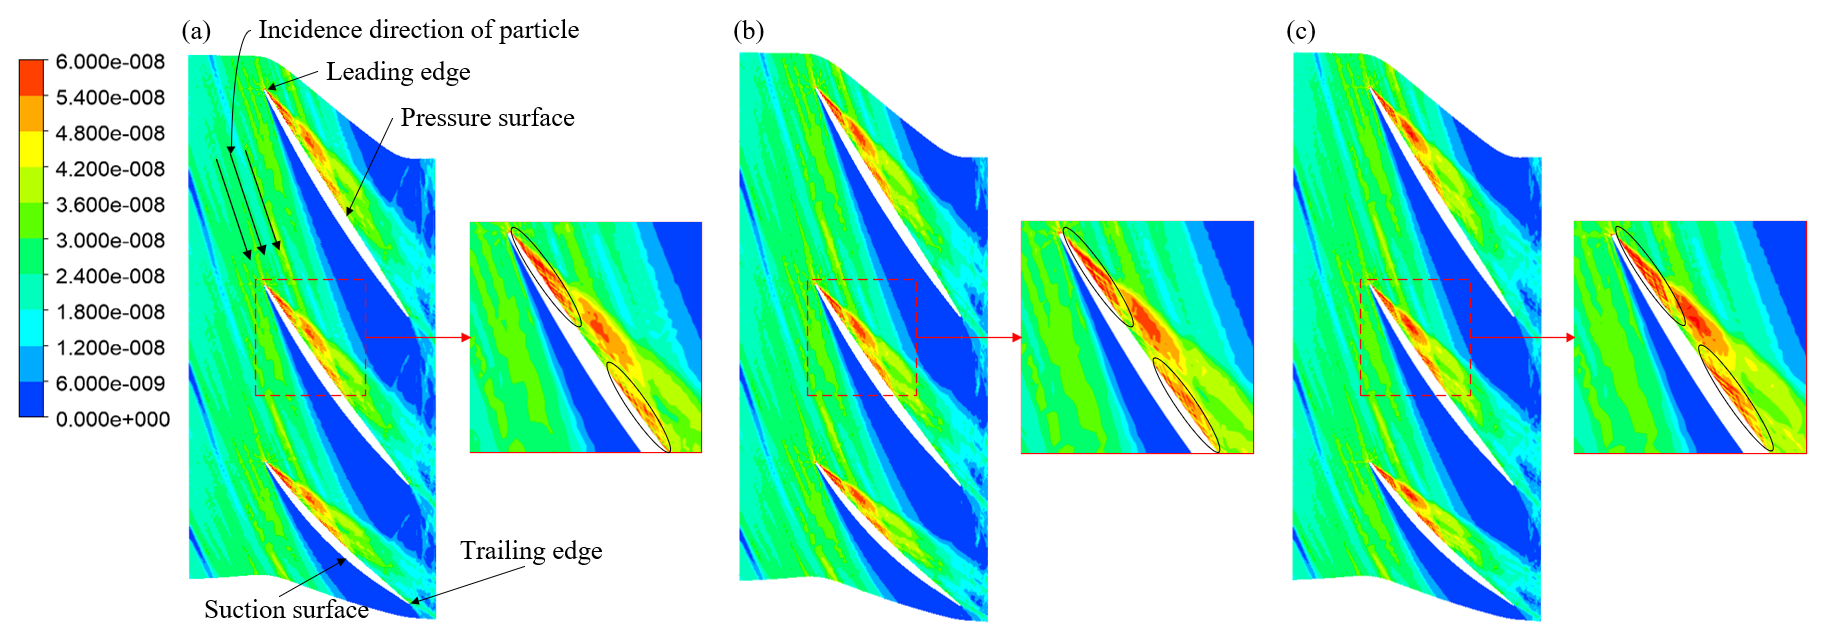
Figure 14The sand particle average volume fraction at 81 % span of the rotor blades for (a) Ra =0.1 µm, (b) Ra =3 µm, and (c) Ra =6 µm.
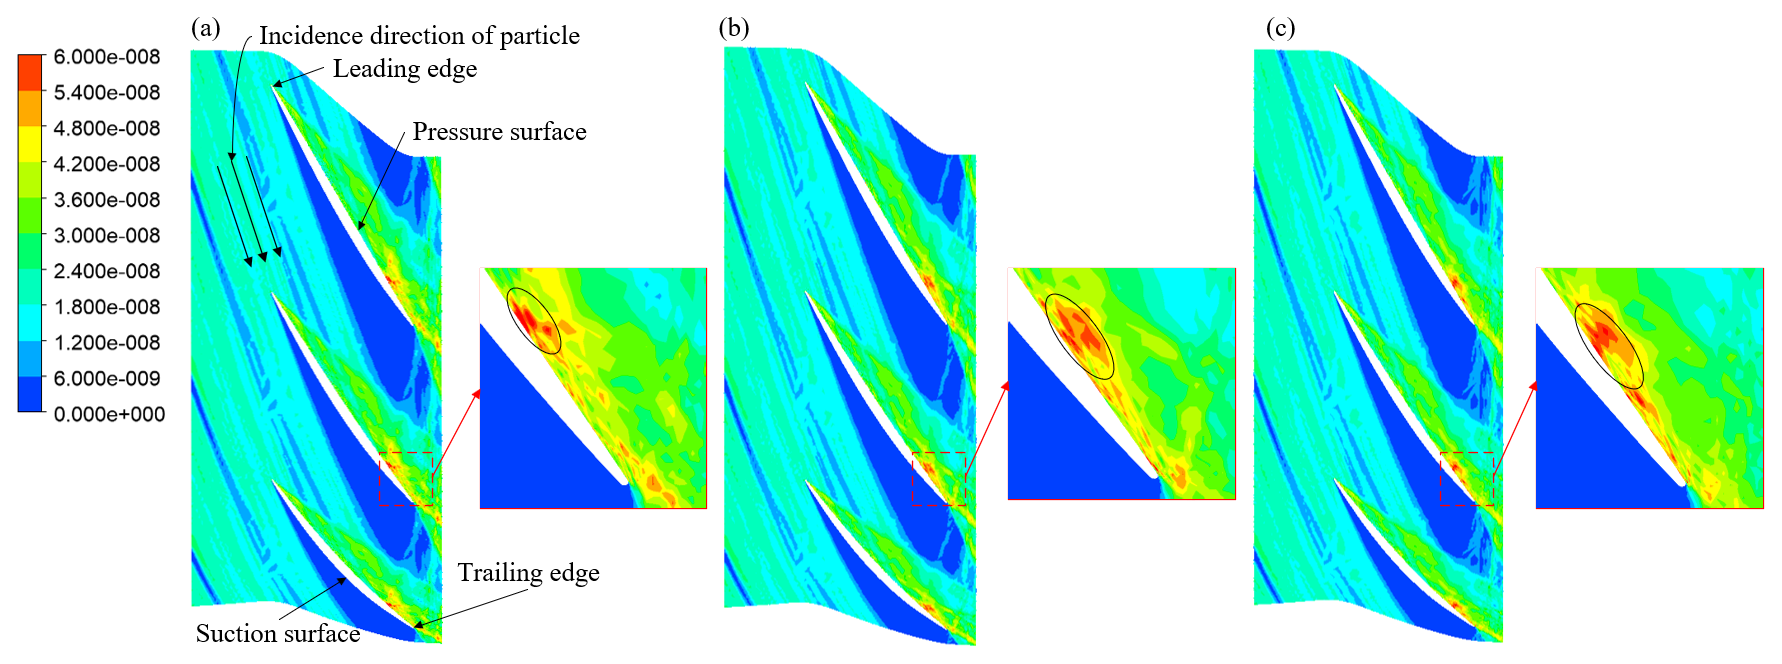
Figure 15The sand particle average volume fraction at 88 % span of the rotor blades for (a) Ra =0.1 µm, (b) Ra =3 µm, and (c) Ra =6 µm.
4.2 Influence of surface roughness on the rotor blade erosion wear
The primary function of the rotor blades is to transfer energy to the airflow through mechanical work, thereby increasing both the kinetic energy and pressure of the airflow. After passing through the guide blade passage, sand particles enter the rotor blade region. Influenced by both the outlet flow direction from the guide blades and the rotation of the rotor blades, their trajectories deflect, initially impacting the pressure surface of the rotor blades. The erosion wear distribution on the pressure surface of the rotor blade is shown in Fig. 13, with concentrations primarily observed at the leading edge, blade tip, and pressure surface. Specifically, the rotating flow generated by the high-speed rotation of the rotor blades causes particles to migrate towards the blade tip, while their velocity is further increased. As a result, the erosion wear on the leading edge and pressure surface shows an increasing trend from the blade root to the blade tip. The concentrated erosion wear areas are mainly distributed at the leading edge and mid-chord of the 81 % blade span, and at the mid-chord of the 75 % blade span. Notably, the locations of these concentrated erosion wear areas do not shift significantly with changes in surface roughness; however, the erosion wear area expands outward as roughness increases. At the 96 % blade span position on the pressure surface of the rotor blade, erosion wear is relatively concentrated at the leading and trailing edges, while being more dispersed in the mid-chord region. This phenomenon is closely related to sand particles carried by the tip leakage flow passing through the rotor blades. Additionally, influenced by the shielding effect of the guide blade trailing edge, a banded region with low erosion wear forms on the pressure surface of the rotor blade.
An in-depth investigation of sand particle distribution characteristics in the blade flow field contributes to a more precise revelation of the formation mechanisms of blade erosion wear. The sand particle average volume fraction refers to the ratio of the particle volume to the total volume in a given spatial region. The sand particle average volume fractions in the flow field at 81 % and 88 % blade span were extracted, with their distribution characteristics shown in Figs. 14 and 15, respectively. Figure 14 demonstrates that the sand particle average volume fraction in the 81 % blade span flow field increases significantly with rising surface roughness. The enhanced sand particle accumulation near the blade wall intensifies local impact frequency, consequently elevating the degree of blade erosion wear. Figure 15 reveals that the sand particle average volume fractions at 88 % blade span show an increasing trend with roughness, while the contact length between sand particles and blade wall extends, leading to a gradual expansion of the erosion wear area. Furthermore, after impacting the pressure surface, most sand particles follow the airflow into the stator blade domain, with only a small fraction rebounding to strike the suction surface. Due to the relatively minimal erosion wear on the suction surface, this study does not provide a detailed analysis of the suction surface of the rotor blade erosion wear.
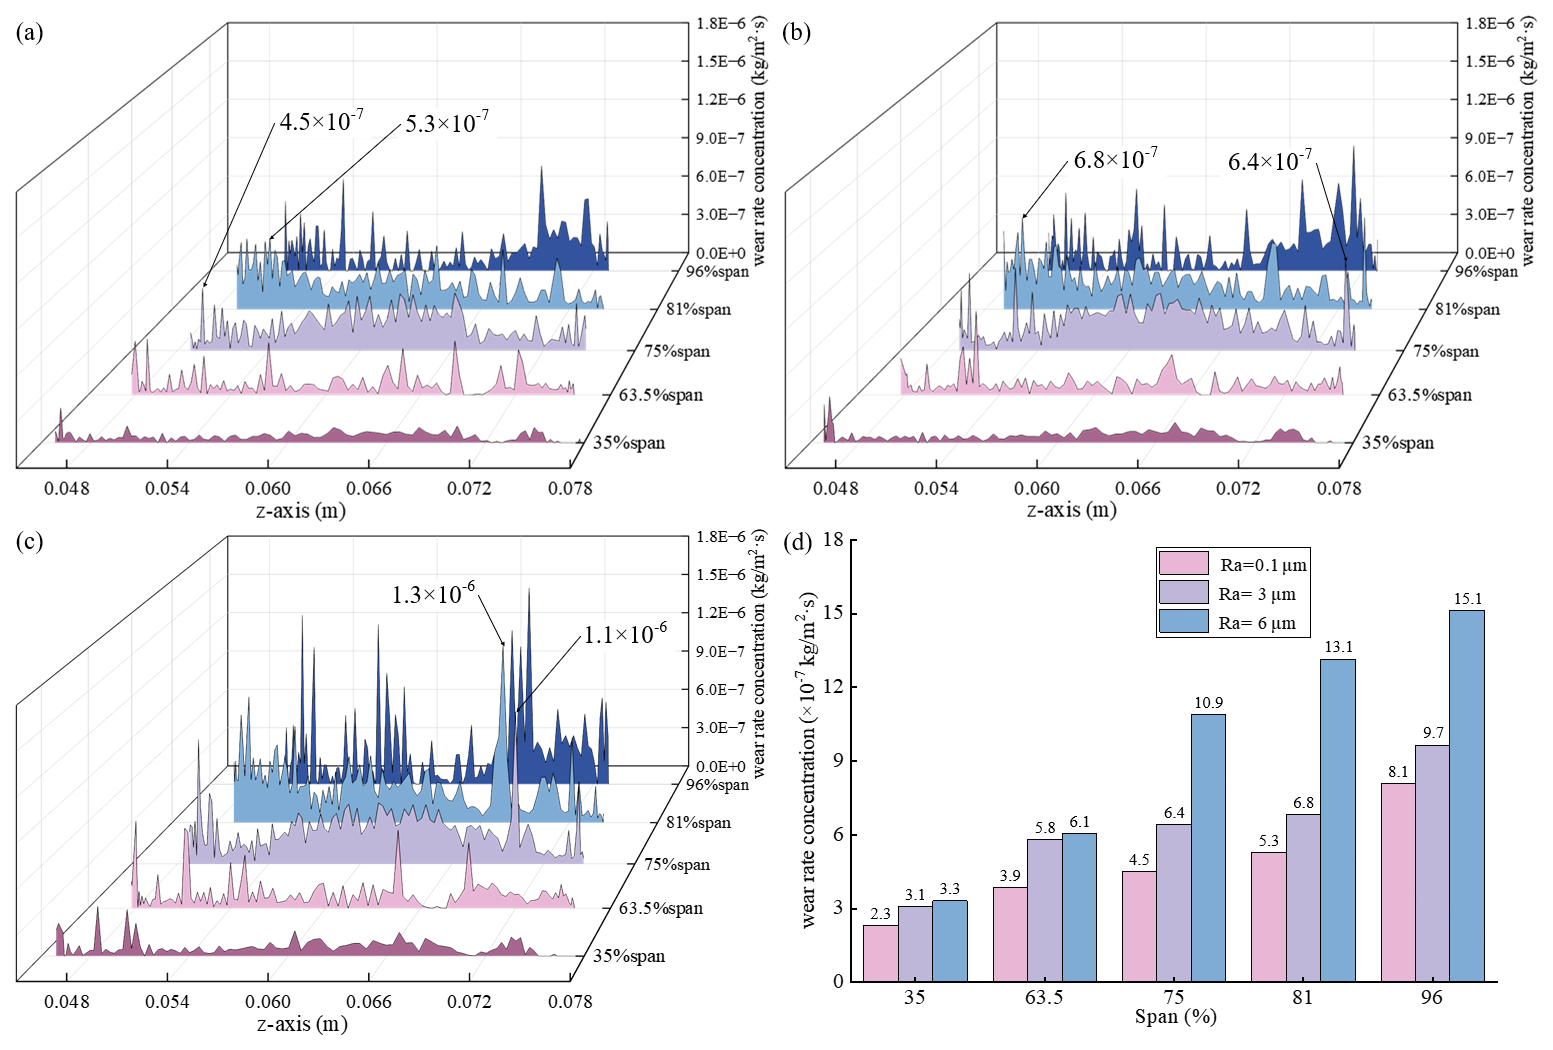
Figure 16Wear rate concentration values at typical blade heights on the pressure surface of the rotor blade for (a) Ra =0.1 µm, (b) Ra =3 µm, and (c) Ra =6 µm; (d) maximum wear rate concentration value at typical blade heights.
The wear rate concentration values at typical blade span positions on the pressure surface of the rotor blade with different roughness are shown in Fig. 16a–c. The results indicate that for all three roughness conditions, the wear rate primarily concentrates at the leading edge and mid-chord of the 81 % blade span, and at the mid-chord of the 75 % blade span. In contrast, the wear rate concentration values in the mid-chord region of the 96 % blade span remain relatively low. This phenomenon occurs because while the centrifugal force generated by high-speed rotation drives sand particles towards the blade tip region, the clearance between the blade tip and casing allows some sand particles to pass through without directly affecting the blade surface, thereby reducing both the sand particle impact probability and wear severity in the mid-chord tip region. Although the overall wear rate is low, a few nodes at the leading and trailing edges of the 96 % blade span show relatively high wear rate concentration values, which are closely related to the local high-velocity particle flow formed by sand particles carried by the tip leakage flow. Notably, the primary erosion wear areas on the pressure surface of the rotor blade do not shift significantly with changes in surface roughness, and the distribution characteristics of the low-wear region near the mid-chord of the 96 % blade span remain consistently stable. These observations align with the distribution pattern observed in Fig. 13, where wear concentrates at the leading edge and mid-chord of the 81 % blade span and the mid-chord of the 75 % blade span. The distribution characteristics of the maximum wear rate concentration values at typical blade span positions on the pressure surface of the rotor blade are presented in Fig. 16d. The results demonstrate that under all three roughness conditions, the maximum wear rate concentration values on the pressure surface of the rotor blade increase with rising blade span, and at the same blade span position, the values elevate with increasing surface roughness. Specifically, when the blade span increases from 63.5 % to 75 %, the maximum wear rate concentration value under Ra =6 µm conditions shows a significant jump, increasing by 80.2 % compared to the value at the 63.5 % blade span position. At the 81 % blade span position, the maximum wear rate concentration value for Ra =0.1 µm is kg m−2 s−1. When the roughness increases to 3 and 6 µm, the maximum wear rate concentration values on the pressure surface of the rotor blade become and kg m−2 s−1, respectively. Compared to Ra =0.1 µm, the maximum wear rate concentration values for Ra =3 and Ra =6 µm increase by 28.7 % and 147.2 %, respectively. These data quantitatively reveal a non-linear positive correlation between surface roughness and wear rate. The increase in roughness not only enhances the contact probability between sand particles and the blade surface, intensifying friction and tangential interactions, but may also enhance the impact kinetic energy of sand particles by altering the local flow field structure, thereby aggravating erosion wear.
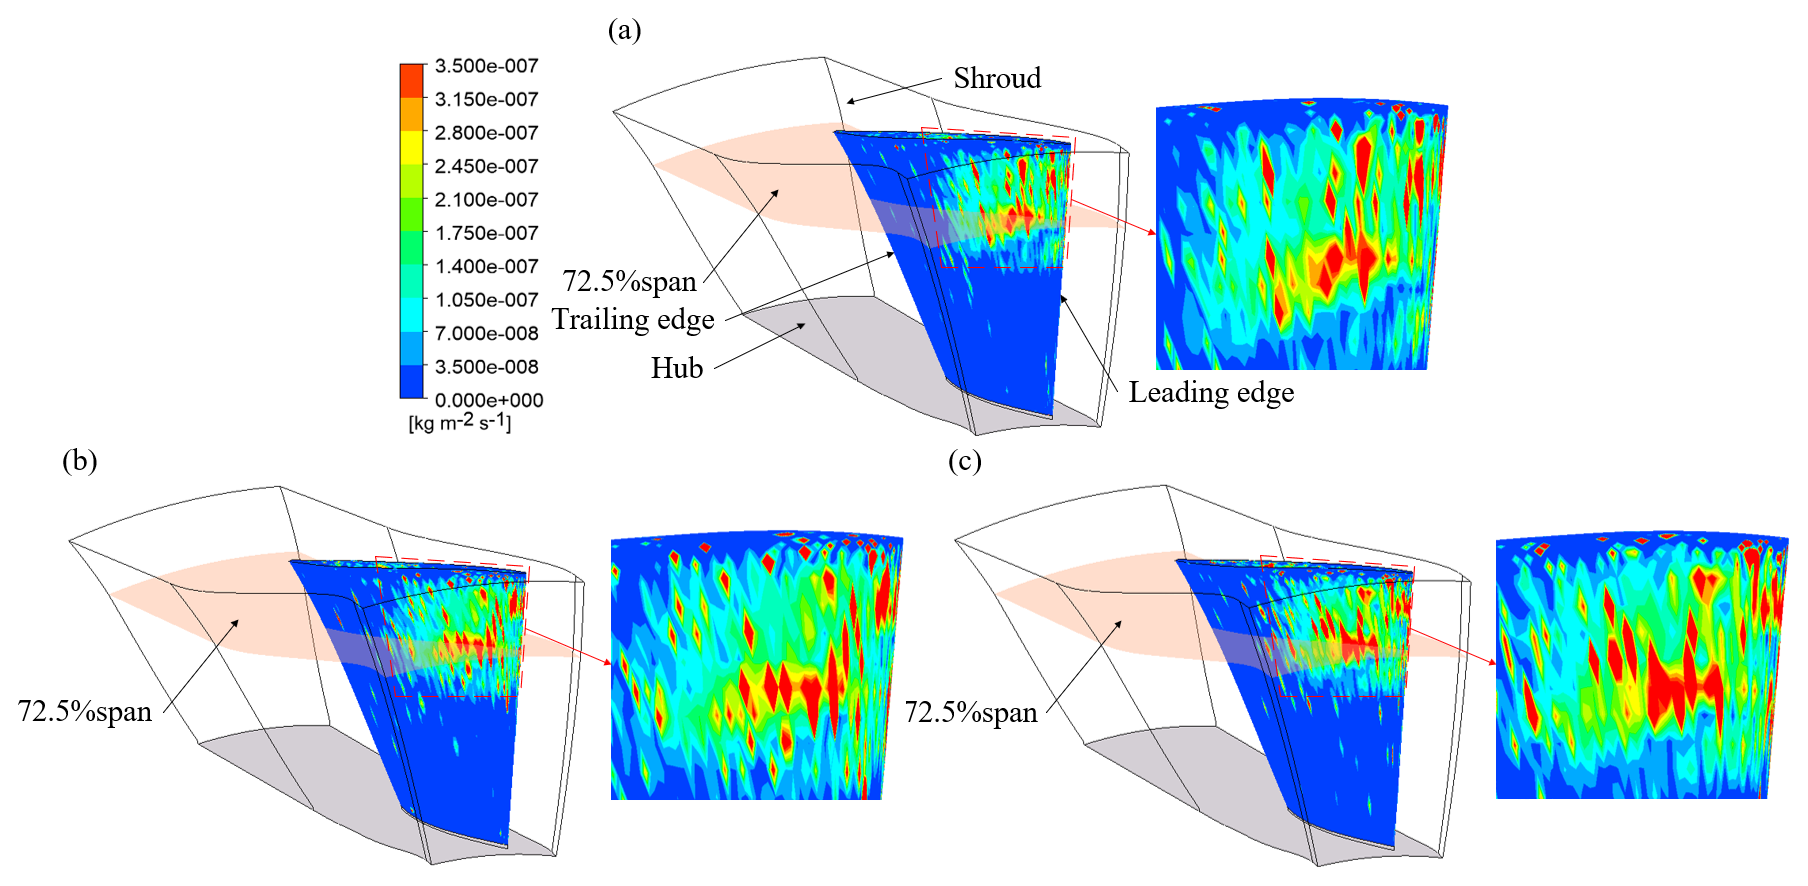
Figure 17Erosion wear distribution on the suction surface of the stator blade for (a) Ra =0.1 µm, (b) Ra =3 µm, and (c) Ra =6 µm.
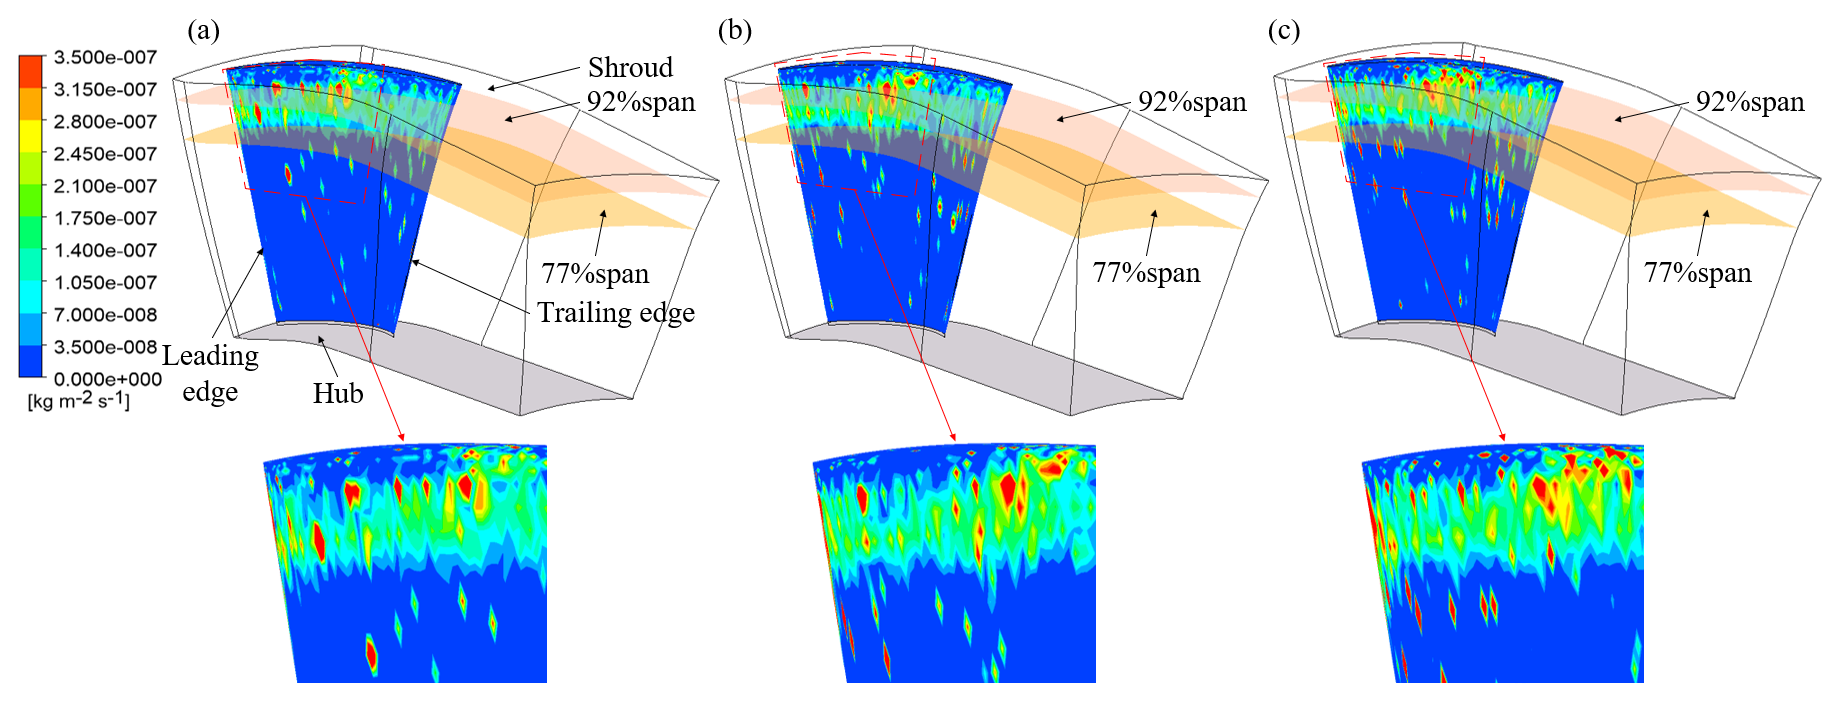
Figure 18Erosion wear distribution on the pressure surface of the stator blade for (a) Ra =0.1 µm, (b) Ra =3 µm, and (c) Ra =6 µm.
4.3 Influence of surface roughness on the stator blade erosion wear
The primary function of the stator blades is to guide the flow direction of the gas compressed by the rotor blades, and structural alterations can directly affect compressor efficiency. After impacting the pressure surface of the rotor blades, the particles rebound and are carried by the high-speed airflow into the stator passages. Most particles are driven by the flow field to migrate towards the upper part of the blade passage, and subsequently impact the suction surface and leading edge region of the stator blades at relatively high velocities. As a result, the erosion wear distribution of the stator blades exhibits variations along the blade span. The erosion wear distribution on the suction surface of the stator blade is shown in Fig. 17. The erosion wear is primarily concentrated near the leading edge above 60 % blade span, while the wear severity in the trailing edge region remains relatively low. This phenomenon is closely related to the significant curvature of the stator blade structure. The curved structure causes abrupt changes in airflow direction at the trailing edge region, reducing the probability of sand particle impact in this area. Specifically, after rebounding from the concentrated erosion wear areas on the pressure surface of the rotor blade, sand particles continue their motion in the stator blade passage and impact the region near the leading edge of the suction surface, resulting in a relatively concentrated erosion wear area around the leading edge at 72.5 % blade span. Notably, as surface roughness increases, the concentrated erosion wear area location on the suction surface of the stator blade remains unchanged. However, the erosion wear area expands outward due to the enlarged interaction range between sand particles and the blade wall. Furthermore, some sand particles undergo secondary rebound after impacting the suction surface of the stator blade and subsequently strike the pressure surface of the adjacent stator blades. The erosion wear distribution on the pressure surface of the stator blade is shown in Fig. 18. The erosion wear mainly occurs in regions above 77 % blade span, with a distinct concentrated erosion wear area forming at 87 % blade span. Similar to the suction surface, the concentrated erosion wear area location on the pressure surface does not shift with roughness variations, but the erosion wear area gradually expands as roughness increases.
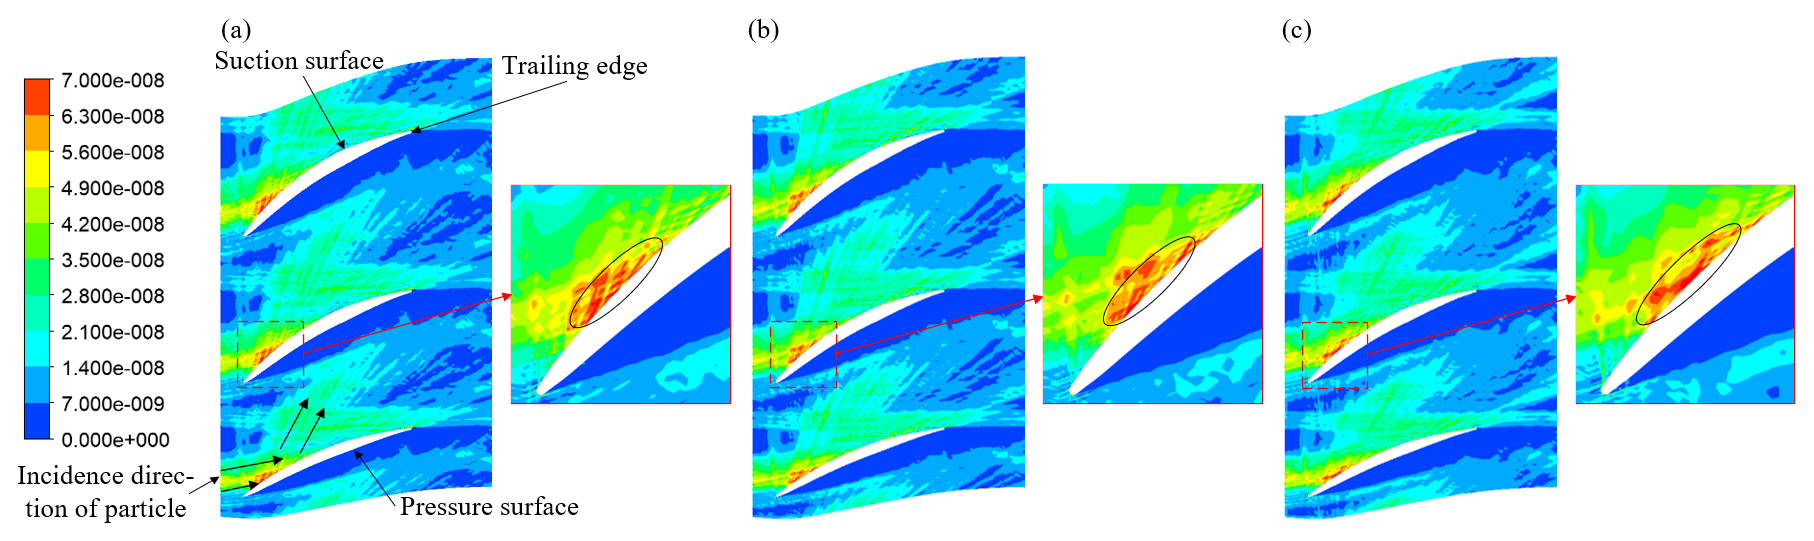
Figure 19The sand particle average volume fraction at 72.5 % span of the stator blades for (a) Ra =0.1 µm, (b) Ra =3 µm, and (c) Ra =6 µm.
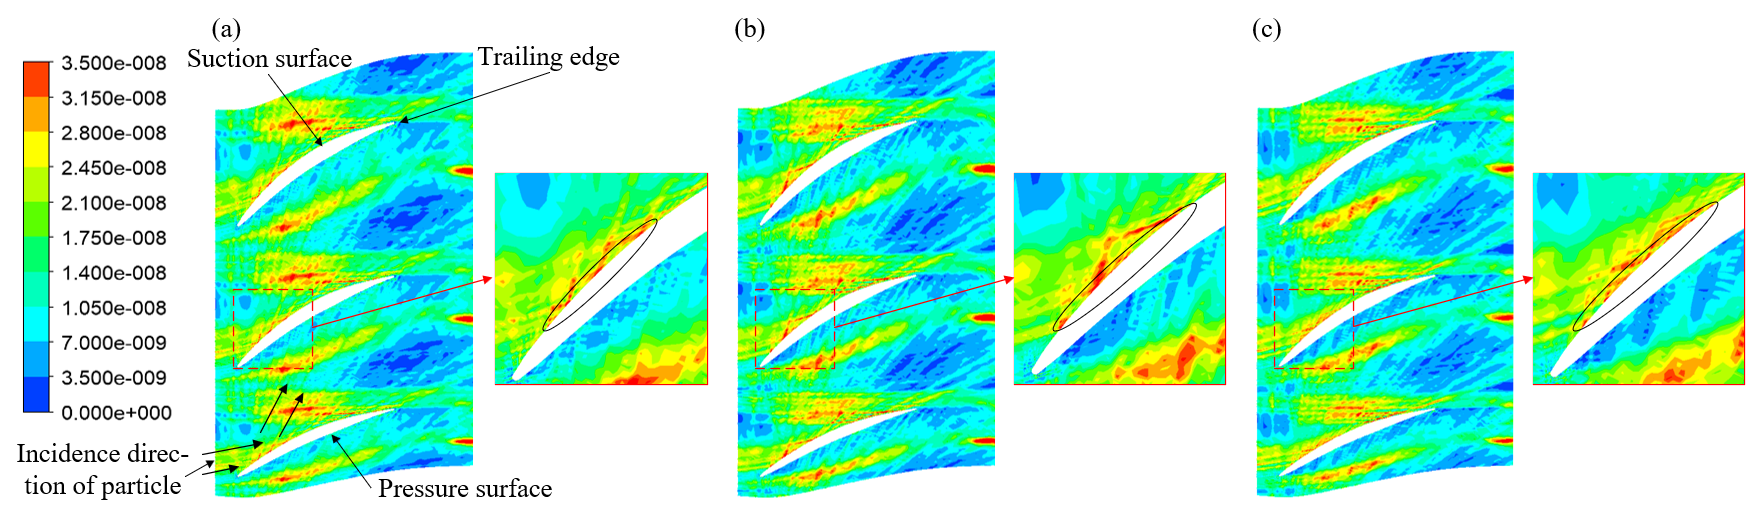
Figure 20The sand particle average volume fraction at 77 % span of the stator blades for (a) Ra =0.1 µm, (b) Ra =3 µm, and (c) Ra =6 µm.
The sand particle average volume fractions in the flow field at 72.5 % and 77 % blade span were extracted, with their distribution characteristics shown in Figs. 19 and 20, respectively. Figure 19 indicates that sand particles in the 72.5 % blade span region directly impact the suction surface of the stator blade, causing significant erosion wear. As surface roughness increases, the contact length between sand particles and the blade wall extends significantly, leading to a gradual expansion of the erosion wear area. This phenomenon is closely related to the curved structure of the stator blade. The curved structure causes sand particles to rebound after impacting the suction surface, while minimal sand particle accumulation occurs on the pressure surface side due to airflow direction adjustment, resulting in a relatively low sand particle average volume fraction on the pressure surface. Figure 20 shows a distribution of the sand particle average volume fraction on the pressure surface of the stator blade at 77 % blade span. This is attributed to the secondary rebound of some sand particles after impacting the suction surface, causing them to re-enter the flow passage on the pressure surface side. The trajectories of sand particles rebounding from the suction surface exhibit significant radial deflection characteristics, determined collectively by the sand particle impact angle and the stator blade structure. Further observation reveals that when the surface roughness Ra increases from 0.1 to 6 µm, the contact length between sand particles and the pressure surface wall increases, directly resulting in an expansion of the erosion wear area.
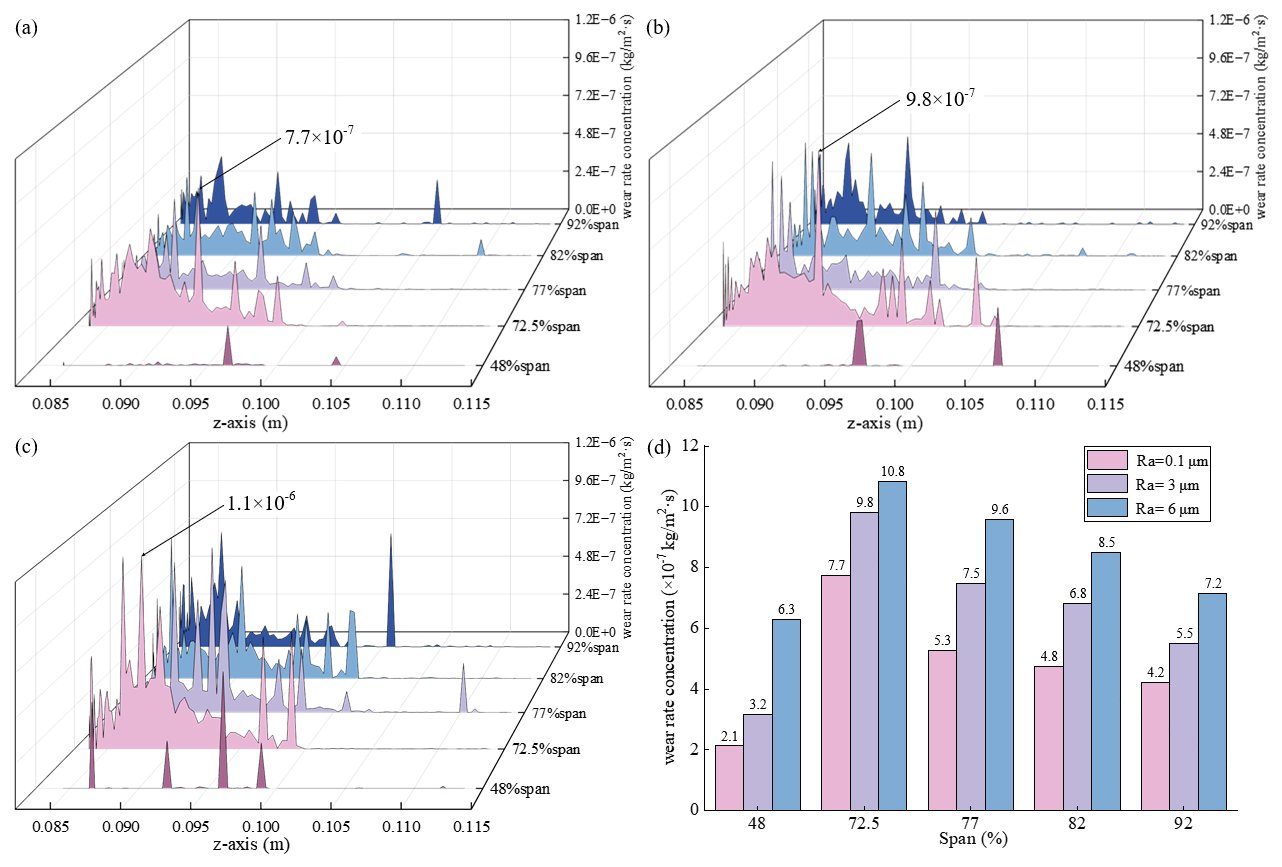
Figure 21Wear rate concentration values at typical blade heights on the suction surface of the stator blade for (a) Ra =0.1 µm, (b) Ra =3 µm, and (c) Ra =6 µm; (d) maximum wear rate concentration value at typical blade heights.
The wear rate concentration values at typical blade span positions on the suction surface of the stator blade with different roughness are shown in Figs. 21a–22c. It can be observed that the erosion wear is mainly concentrated in the region near the leading edge at 72.5 % blade span. This distribution pattern aligns with the observation in Fig. 17, which indicates erosion wear near the leading edge above 60 % blade span on the suction surface of the stator blade. Further examination of the wear rate variation trends at different blade span positions reveals that at 72.5 %, 77 %, 82 %, and 92 % blade span locations, the wear rate distribution from leading edge to trailing edge initially increases and then decreases, with nearly zero wear rate concentration values in the trailing edge region. This demonstrates that the curved structure causes abrupt changes in airflow direction at the trailing edge area, altering sand particle trajectories and effectively reducing the impact probability between sand particles and the blade surface. Notably, the concentrated erosion wear areas positioned on the suction surface of the stator blade do not shift significantly with changes in surface roughness, indicating that sand particle trajectories and impact angles on the suction surface are primarily determined by the flow field structure rather than surface roughness. The distribution characteristics of the maximum wear rate concentration values at typical blade span positions on the suction surface of the stator blade are presented in Fig. 21d. The results show that under all three roughness conditions, the maximum wear rate concentration value peaks at the 72.5 % blade span position. This phenomenon is closely related to sand particle trajectories between the rotor and stator blades: after rebounding from concentrated impact areas on the pressure surface of the rotor blade, sand particles follow the main flow into the stator blade passage and undergo secondary impact near the leading edge at 72.5 % blade span on the suction surface of the stator blade, making this region the concentrated erosion wear area. Further analysis at the 77 % blade span position shows that when Ra =0.1 µm, the maximum wear rate concentration value is kg m−2 s−1. When Ra increases to 3 and 6 µm, the maximum wear rate concentration values become and kg m−2 s−1, respectively. Compared to Ra =0.1 µm, the maximum wear rate concentration values for Ra =3 and Ra =6 µm increase by 41.9 % and 81.6 %, respectively. It is noteworthy that at Ra =6 µm, the maximum wear rate concentration values on the suction surface of the stator blade are 39.8 % lower than those on the pressure surface of the rotor blade, indicating significantly more severe erosion wear on the pressure surface of the rotor blade under high roughness conditions. This difference primarily stems from the centrifugal effect generated by the rotor blade rotation and the influence of tip leakage flow on sand particle trajectories, while the relatively stable airflow in the stator blade passage results in relatively lower sand particle impact energy (Yang et al., 2023a; Li et al., 2021).
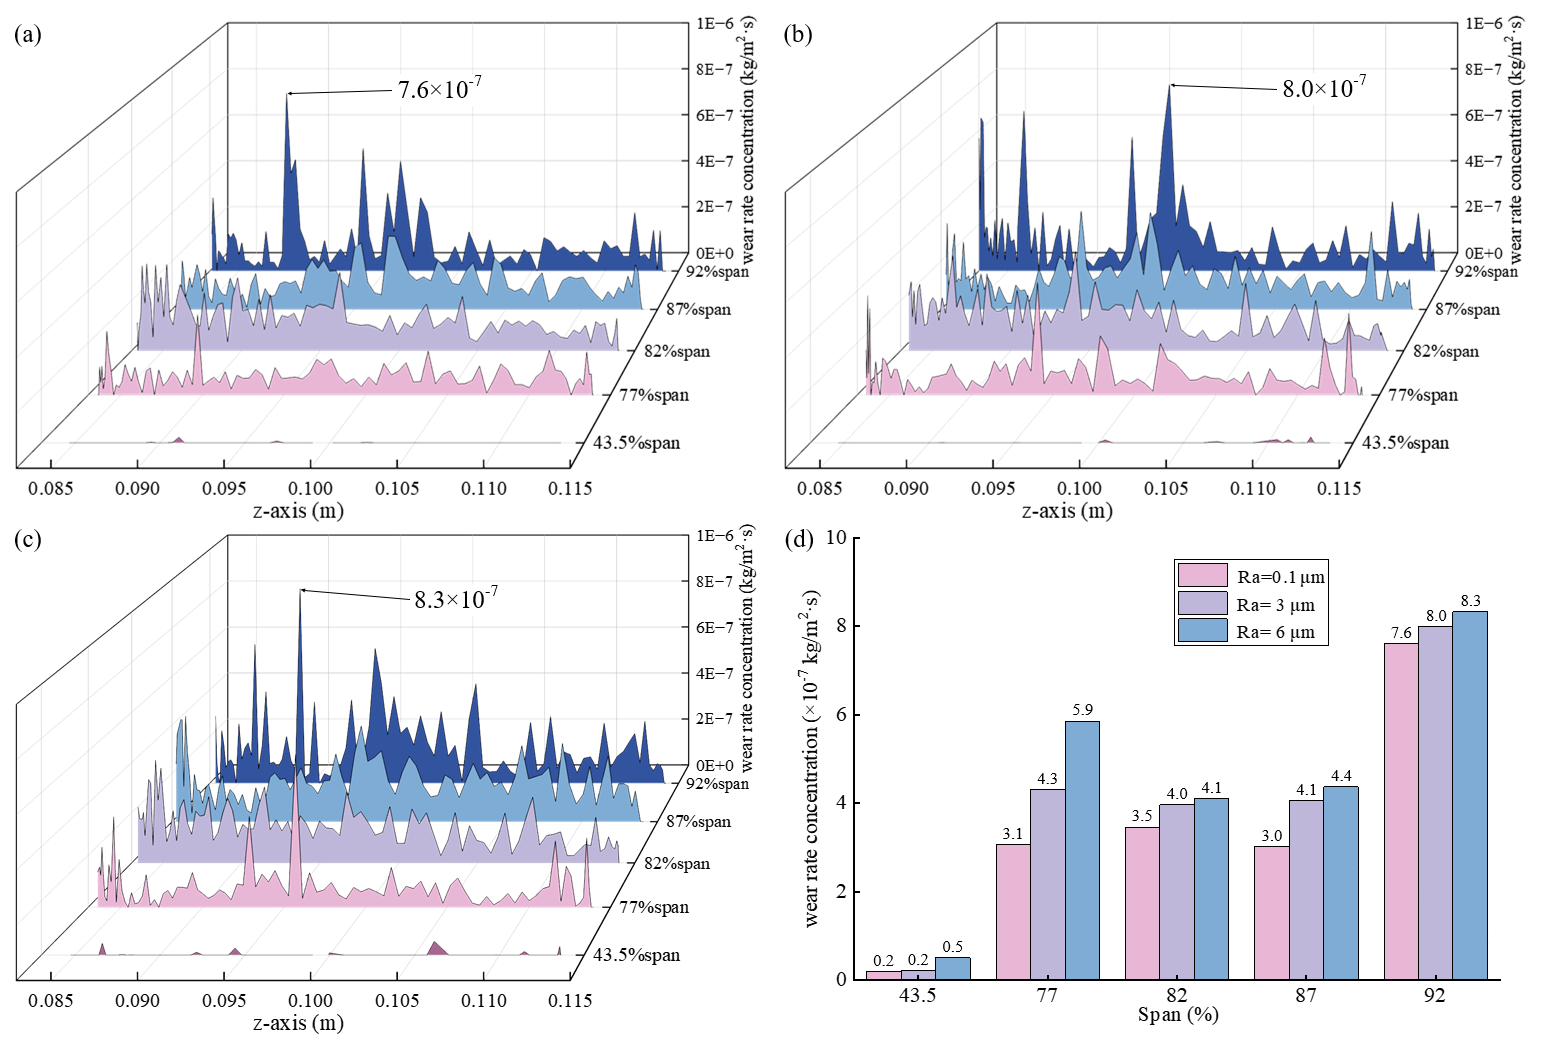
Figure 22Wear rate concentration values at typical blade heights on the pressure surface of the stator blade for (a) Ra =0.1 µm, (b) Ra =3 µm, and (c) Ra =6 µm; (d) maximum wear rate concentration value at typical blade heights.
The wear rate concentration values at typical blade span positions on the pressure surface of the stator blade with different roughness are shown in Fig. 22a–c. The results indicate that the erosion wear regions are primarily distributed above 77 % blade span, with significant erosion wear observed from the leading edge to the trailing edge. This distribution pattern aligns with the observation in Fig. 18, which shows continuous erosion wear from the leading edge to the trailing edge above 77 % blade span on the pressure surface of the stator blade. Specifically, the wear rate variation trends differ across blade span positions. At the 82 % blade span location, the wear rate gradually decreases from the leading edge towards the trailing edge. In contrast, at the 87 % and 92 % blade span positions, the wear rate initially increases and then decreases along the same direction. The distribution characteristics of the maximum wear rate concentration values at typical blade span positions on the pressure surface of the stator blade are presented in Fig. 22d. The analysis reveals two key distribution features: first, relatively high wear rate concentration values are observed at the 77 % blade span position, which is closely related to sand particle rebound trajectories in the stator passage. The sand particles impacting the 72.5 % blade span region of the suction surface of the stator blade rebound and subsequently strike near the 77 % blade span of the pressure surface on the adjacent blade, making this area a concentrated erosion wear area. Second, the wear rate concentration values increase significantly at the 92 % blade span position, primarily due to sand particle accumulation towards the blade tip region under centrifugal force effects, resulting in substantially elevated wear rate concentration values. Regarding specific data, at the 77 % blade span position, the maximum wear rate concentration values under the three roughness conditions show significant gradients. When Ra =0.1 µm, the maximum wear rate concentration value is kg m−2 s−1; at Ra =3 µm, it increases to kg m−2 s−1, representing a 40.7 % increase compared to Ra =0.1 µm; while at Ra =6 µm, it further rises to kg m−2 s−1, corresponding to a 90.9 % increase relative to Ra =0.1 µm. Additionally, at Ra =6 µm, the maximum wear rate concentration values on the suction surface of the stator blade are 14.9 % higher than those on the pressure surface.
-
In the erosion wear experiments conducted at impact angles ranging from 0 to 90°, the impact angle that resulted in the highest wear rate for titanium alloy with different surface roughness was found to be 30°. At this impact angle, the maximum erosion depth of the titanium alloy with Ra =6 µm increased by 88.9 % and 183.3 % compared to those with Ra =0.1 µm and Ra =3 µm, respectively. Meanwhile, the numerically simulated distribution of blade erosive wear is in good agreement with the experimentally observed results, which verifies that the Tabakoff model and the established numerical method are applicable to investigating the effects of surface roughness on the erosive wear characteristics of compressor blades.
-
The erosion rate of blades with a surface roughness of 6 µm is significantly higher than that of blades with a roughness of 0.1 µm. When the roughness increases from 0.1 to 6 µm, the wear rate concentration value at 91.5 % blade span of the guide blade rises by 53.0 %, the value at 81 % blade span of the rotor blade increases by 147.2 %, and the value at 77 % blade span of the stator blade goes up by 90.9 %. Surface roughness has the greatest impact on the erosion wear of the rotor blade, followed by the stator blade, and the least on the guide blade. The location of the concentrated erosion wear area does not shift significantly with changes in roughness.
-
The findings obtained in this study can provide a basis for the erosion wear assessment of compressor blades at different service stages. This paper mainly focuses on the influence of a single sand particle size and shape on blades with different roughness. In future research, the combined effects of particle size, particle morphology, particle concentration, and other factors on the erosive wear characteristics of blades with various surface roughness can be investigated.
Data will be made available on request.
Dunyuan Luo: investigation, software, data curation, writing (original draft), and formal analysis. Guangfu Bin: conceptualization, methodology, writing (review and editing), project administration, and supervision. Andrew Ball: conceptualization and investigation. Fengshou Gu: supervision, conceptualization, and methodology. Haiyan Miao: conceptualization, methodology, and investigation. Chao Li: conceptualization, methodology, and writing (review and editing). Ahmed Hamood: conceptualization, methodology, and investigation. Wei Yuan: conceptualization, methodology, and investigation.
The contact author has declared that none of the authors has any competing interests.
Publisher's note: Copernicus Publications remains neutral with regard to jurisdictional claims made in the text, published maps, institutional affiliations, or any other geographical representation in this paper. The authors bear the ultimate responsibility for providing appropriate place names. Views expressed in the text are those of the authors and do not necessarily reflect the views of the publisher.
This research was supported by the National Natural Science Foundation of China (grant nos. 12572061 and 52405103), the Hunan Provincial Natural Science Foundation Project (grant nos. 2024JJ5156 and 2024JJ6216), the Science and Technology Innovation Program of Hunan Province (grant no. 2025RC4015), and the 77th Batch of General Projects of the China Postdoctoral Science Foundation (grant no. 2025M77139).
This work was supported by the National Natural Science Foundation of China (grant nos. 12572061 and 52405103); the Hunan Provincial Natural Science Foundation Project (grant nos. 2024JJ5156 and 2024JJ6216); the Science and Technology Innovation Program of Hunan Province (grant no. 2025RC4015); and the 77th Batch of General Projects of the China Postdoctoral Science Foundation (grant no. 2025M77139).
This paper was edited by Liangliang Cheng and reviewed by four anonymous referees.
Azakli, Z. and Gumruk, R.: Particle Erosion Performance of Additive Manufactured 316L Stainless Steel Materials, Tribol. Lett., 69, https://doi.org/10.1007/s11249-021-01503-0, 2021.
Azimian, M., Schmitt, P., and Bart, H. J.: Numerical investigation of single and multi impacts of angular particles on ductile surfaces, Wear, 342, 252–261, https://doi.org/10.1016/j.wear.2015.08.022, 2015.
Altmeppen, J., Sommerfeld, H., Koch, C., and Staudacher, S.: Experimental and numerical investigation into the effect of surface roughness on particle rebound, Front. Mech. Eng., 8, 918708, https://doi.org/10.3389/fmech.2022.918708, 2022.
Biazar, D. and Afzalian, A.: The Impact of Blade Surface Roughness on Wind Turbine Efficiency: A Monte Carlo Method Approach, Energy Sci. Eng., 13, 2022–2030 https://doi.org/10.1002/ese3.70026, 2025.
Coto, B., Hallander, P., Mendizabal, L., Pagano, F., and Kling, H.: Particle and rain erosion mechanisms on Ti/TiN multilayer PVD coatings for carbon fibre reinforced polymer substrates protection, Wear, 466, 203575, https://doi.org/10.1016/j.wear.2020.203575, 2021.
Cai, F., Zhang, J., Wang, J., Zheng, J., and Wang, Q.: Improved adhesion and erosion wear performance of CrSiN/Cr multi-layer coatings on Ti alloy by inserting ductile Cr layers, Tribol. Int., 153, 106657, https://doi.org/10.1016/j.triboint.2020.106657, 2021a.
Cai, L., Wang, S., Li, Y., Mao, J., and Li, F.: Experimental and numerical studies on rebound characteristics of non-spherical particles impacting on stainless-steel at high temperature, Powder Technol., 381, 110–121, https://doi.org/10.1016/j.powtec.2020.12.004, 2021b.
Chen, Y., Gao, C., and Chu, W.: Effect and mechanism of roughness on the performance of a five-stage axial flow compressor, Aerospace, 9, 428, https://doi.org/10.3390/aerospace9080428, 2022.
Di, J., Wang, S., and Xie, Y.: Investigation on the erosion characteristics of martensitic blade steel material 1Cr12W1MoV by micro-particle swarm with high velocity, Powder Technol., 345, 111–128, https://doi.org/10.1016/j.powtec.2018.12.083, 2019.
Finnie, I.: Erosion of surfaces by solid particles, Wear, 3, 87–103, https://doi.org/10.1016/0043-1648(78)90147-3, 1960.
Finnie, I., Stevick, G., and Ridgely, J.: The influence of impingement angle on the erosion of ductile metals by angular abrasive particles, Wear, 152, 91–98, https://doi.org/10.1016/0043-1648(92)90206-N, 1992.
Grant, G. and Tabakoff, W.: An experimental investigation of the erosive characteristics of 2024 aluminum alloy, University of Cincinnati, Cincinnati 1–41, 1973.
Hao, Y., Yang, S., Li, D., Li, W., and Li, X.: Vibratory finishing for the cavity of aero-engine integral casting casing: mechanism analysis and performance evaluation, Int. J. Adv. Manuf. Tech., 125, 713–729, https://doi.org/10.1007/s00170-022-10728-9, 2023.
He, G., Sun, D., Chen, J., Han, X., and Zhang, Z.: Key problems affecting the anti-erosion coating performance of aero-engine compressor: A review, Coatings, 9, 821, https://doi.org/10.3390/coatings9120821, 2019.
Hu, G., Ou, J., Tang, K., Luo, H., and Wang, G.: Influence of Particle Size on Friction and Wear Behavior of Hydrogenated Nitrile Rubber, Tribol. Lett., 72, https://doi.org/10.1007/s11249-024-01854-4, 2024.
Islam, M. A., Alam, T., Farhat, Z. N., Mohamed, A., and Alfantazi, A.: Effect of microstructure on the erosion behavior of carbon steel, Wear, 332, 1080–1089, https://doi.org/10.1016/j.wear.2014.12.004, 2015.
Joaquin, G., Brink, T., and Molinari, J.: Roughness evolution induced by thirdbody wear, Tribol. Lett., 72, https://doi.org/10.1007/s11249-024-01833-9, 2024.
Ji, X., Qing, Q., Ji, C., Cheng, J., and Zhang, Y.: Slurry erosion wear resistance and impact-induced phase transformation of titanium alloys, Tribol. Lett., 66, https://doi.org/10.1007/s11249-018-1015-0, 2018.
Jiang, H., Browning, R., Fincher, J., Gasbarro, A., and Jones, S.: Influence of surface roughness and contact load on friction coefficient and scratch behavior of thermoplastic olefins, Appl. Surf. Sci., 254, 4494–4499, https://doi.org/10.1016/j.apsusc.2008.01.067, 2008.
Kwon, H. J., Lee, D., and Lee, Y. K.: Failure analysis of blades and vanes of a compressor for a gas turbine engine, Eng. Fail. Anal., 124, 105386, https://doi.org/10.1016/j.engfailanal.2021.105386, 2021.
Koch, C. C. and Smith, L. H.: Loss sources and magnitudes in axial-flow compressors, J. Eng. Gas Turb. Power, 98, 411–424, https://doi.org/10.1115/1.3446202, 1976.
Kamble, C., Girimaji, S., and Chen, H.: Partially averaged navier–stokes formulation of a two-layer turbulence model, AIAA J., 58, 174–183, https://doi.org/10.2514/1.J058742, 2020.
Li, C., Bin, G., Li, J., and Liu Z.: Study on the erosive wear of the gas-solid flow of compressor blade in an aero-turboshaft engine based on the Finnie model, Tribol. Int., 163, 107197, https://doi.org/10.1016/j.triboint.2021.107197, 2021.
Li, C., Bin, G., Li, J., Yang, P., and Wang, W.: Influence of inlet distortion on the wear of aero-compressor blades, Int. J. Mech. Sci., 230, 107551, https://doi.org/10.1016/j.ijmecsci.2022.107551, 2022.
Li, C., Bin, G., Li, J., and Yang P.: Erosion wear characteristics of the aero-compressor blades in full speed range, Powder Technol., 418, 118227, https://doi.org/10.1016/j.powtec.2023.118227, 2023.
Liu, C., Cao, Y., Ding, S., Zhang, W., Cai, Y., and Lin, A.: Effects of blade surface roughness on compressor performance and tonal noise emission in a marine diesel engine turbocharger, P. I. Mech. Eng. Part D-J. Aut., 234, 3476–3490, https://doi.org/10.1177/0954407020927637, 2020.
Liu, R., Pan, Y., Chen, A., Bin, G., and Li, H.: Study on the influence of surface roughness on the erosion characteristics of compressor blades, Powder Technol., 430, 119037, https://doi.org/10.1016/j.powtec.2023.119037, 2023.
Ma, A., Liu, D., Zhang, X., Liu, D., He, G., and Yin, X.: Solid particle erosion behavior and failure mechanism of TiZrN coatings for Ti-6Al-4V alloy, Surf. Coat. Tech., 426, 127701, https://doi.org/10.1016/J.SURFCOAT.2021.127701, 2021.
Ma, S. B., Choi, J., and Shim, H. S.: Impact of Surface Roughness on Aerodynamic Performance of Axial Compressor Blades under Various Altitude Conditions, Aerosp. Sci. Technol., 110368, https://doi.org/10.1016/j.ast.2025.110368, 2025.
Malhotra, A., Goswami, S., and Madathil, P. A.: Performance deterioration of axial compressor rotor due to uniform and non-uniform surface roughness, P. I. Mech. Eng. G-J. Aer., 236, 2687–2707, https://doi.org/10.1177/09544100211068912, 2022.
Naveed, M., Schlag, H., König, F., and Weiß, S.: Influence of the erodent shape on the erosion behavior of ductile and brittle materials, Tribol. Lett., 65, https://doi.org/10.1007/s11249-016-0800-x, 2017.
Oka, Y. I., Okamura, K., and Yoshida, T.: Practical estimation of erosion damage caused by solid particle impact: Part 1: Effects of impact parameters on a predictive equation, Wear, 259, 95–101, https://doi.org/10.1016/j.wear.2005.01.039, 2005.
Persson, B.: Surface roughness-induced stress concentration, Tribol. Lett., 71, https://doi.org/10.1007/S11249-023-01741-4, 2023.
Poursaeidi, E., Tafrishi, H., and Amani, H.: Experimental-numerical investigation for predicting erosion in the first stage of an axial compressor, Powder Technol., 306, 80–87, https://doi.org/10.1016/j.powtec.2016.10.057, 2017.
Przysowa, R., Gawron, B., Küaszka, A., and Placha-Hetman K.: Polish experience from the operation of helicopters under harsh conditions, Journal of KONBiN, 48, https://doi.org/10.2478/jok-2018-0056, 2018.
Suzuki, M. and Yamamoto, M.: Numerical simulation of sand erosion phenomena in a single-stage axial compressor, Journal of Fluid Science and Technology, 6, 98–113, https://doi.org/10.1299/jfst.6.98, 2011.
Shi, L., Guo, S., Yu, P., Zhang, X., and Xiong, J.: A review on leading-edge erosion morphology and performance degradation of aero-engine fan and compressor blades, Energies, 16, 3068, https://doi.org/10.3390/en16073068, 2023.
Shinde, S. D. and Upadhyay, S. H.: Investigation on effect of orbital debris impact on tension forces in inflatable membrane reflector, 2025 IEEE 6th India Council International Subsections Conference, https://doi.org/10.1109/INDISCON66021.2025.11253784, 2025.
Shinde, S. D., Patel, P. K., and Upadhyay, S. H.: Design of deployable canister mechanism for the spaceborne inflatable planar membrane reflector antenna, 2025 16th International Conference on Mechanical and Aerospace Engineering, https://doi.org/10.1109/ICMAE66341.2025.11277197, 2025.
Shah, S. and Jain, S.: Coiled tubing erosion during hydraulic fracturing slurry flow, Wear, 264, 279–290, https://doi.org/10.1016/j.wear.2007.03.016, 2007.
Takaffoli, M. and Papini, M.: Material deformation and removal due to single particle impacts on ductile materials using smoothed particle hydrodynamics, Wear, 274, 50–59, https://doi.org/10.1016/j.wear.2011.08.012, 2012.
Tilly, G.: A two stage mechanism of ductile erosion, Wear, 23, 87–96, https://doi.org/10.1016/0043-1648(73)90044-6, 1973.
Tarodiya, R., Khullar, S., and Levy, A.: Assessment of erosive wear performance of Pelton turbine injectors using CFD-DEM simulations, Powder Technol., 408, 117763, https://doi.org/10.1016/j.powtec.2022.117763, 2022.
Taherkhani, B., Anaraki, A. P., and Farahani, N. K.: Surface roughness effect on turbine blade erosion due to micro-sized particle impact, J. Fail. Anal. Prev., 25, 370–377, https://doi.org/10.1007/s11668-025-02113-x, 2025.
Tabakoff, W., Grant, G., and Ball, R.: An experimental investigation of certain aerodynamic effects on erosion, 8th Aerodynamic Testing Conference, 639, https://doi.org/10.2514/6.1974-639, 1974.
Tabakoff, W., Kotwal, R., and Hamed, A.: Erosion study of different materials affected by coal ash particles, Wear, 52, 161–173, https://doi.org/10.1016/0043-1648(79)90206-0, 1979.
Wang, J. and Nguyen, T.: Mechanisms and predictive models for the erosion process of super hard and brittle materials by a vibration-assisted slurry jet, Int. J. Mech. Sci., 211, 106794, https://doi.org/10.1016/j.ijmecsci.2021.106794, 2021.
Wang, X., Xu, Z., Lu, H., Zhang, M., and Wu, H.: Synergistic enhancement of tribological properties of Ti-6Al-4V alloy via combined ultrasonic shot peening and thermal oxidation treatment, Tribol. Lett., 74, https://doi.org/10.1007/s11249-025-02080-2, 2026.
Wang, Y., Zou, B., Huang, C., Qi, H., and Song, J.: Feasibility study of the Ti (C7N3)-based cermet micro-mill based on dynamic fatigue behavior and modeling of the contact stress distribution on the round cutting edge, Int. J. Mech. Sci., 155, 143–158, https://doi.org/10.1016/j.ijmecsci.2019.02.038, 2019.
Wang, Z., Cheng, H., Bensow, R. E., Peng, X., and Ji, B.: Numerical assessment of cavitation erosion risk on the Delft twisted hydrofoil using a hybrid Eulerian-Lagrangian strategy, Int. J. Mech. Sci., 259, 108618, https://doi.org/10.1016/j.ijmecsci.2023.108618, 2023.
Wedel, J., Hribersek, M., Steinmann, P., and Ravnik, J.: Coefficient of tangential restitution for non-spherical particles, Powder Technol., 437, 119526, https://doi.org/10.1016/j.powtec.2024.119526, 2024.
Yan, C., Chen, W., Zhao, Z., and Liu, L.: A probability prediction model of erosion rate for Ti-6Al-4V on high-speed sand erosion, Powder Technol., 364, 373–381, https://doi.org/10.1016/j.powtec.2020.01.058, 2020.
Yang, P., Yue, W., Chen, A., and Bin, G.: Influence of SiO2 and Al2O3 particles on erosion wear of aero-compressor blades, Wear, 530, 204992, https://doi.org/10.1016/j.wear.2023.204992, 2023a.
Yang, P., Li, C., Yue, W., Bin, G., and Chen, A.: Study on erosion wear characteristics of aero-compressor blades considering distortion degree, Tribol. Int., 189, 108895, https://doi.org/10.1016/j.triboint.2023.108895, 2023b.
Yang, P., Li, C., Bin, G., Miao, H., and Gu, F.: Erosion wear patterns of turboshaft engine compressor under different radial inlet distortion conditions, Tribol. Int., 198, 109907, https://doi.org/10.1016/j.triboint.2024.109907, 2024.
Yazik, M. H. M., Zawawi, M. H., Ahmed, A. N., Sidek, L. M., Basri, H., and Ismail, F.: One-way fluid structure interaction analysis of a static savonius hydrokinetic turbine under different velocity and surface roughness with different blade materials, Ocean Eng., 291, 116373, https://doi.org/10.1016/j.oceaneng.2023.116373, 2024.
Zhan, H., Hou, Y., Cai, L., He, J., and Li, Y.: CFD and FEM combined study on the solid particle erosion damage of multi-stage compressor blades, Powder Technol., 121257, https://doi.org/10.1016/j.powtec.2025.121257, 2025.
Zhang, L., Bin, G., Zhong, X., Yang, F., and Chen, A.: Study on carbon particle deposition distribution of turbocharger turbine blade based on the gas-solid two-phase flow theory, Tribol. Int., 178, 108019, https://doi.org/10.1016/j.triboint.2022.108019, 2023.
- Abstract
- Introduction
- Blade erosion wear theory
- Finite element modelling of the compressor
- Analysis of blade erosion wear characteristics under different surface roughness
- Conclusions
- Data availability
- Author contributions
- Competing interests
- Disclaimer
- Acknowledgements
- Financial support
- Review statement
- References
- Abstract
- Introduction
- Blade erosion wear theory
- Finite element modelling of the compressor
- Analysis of blade erosion wear characteristics under different surface roughness
- Conclusions
- Data availability
- Author contributions
- Competing interests
- Disclaimer
- Acknowledgements
- Financial support
- Review statement
- References