the Creative Commons Attribution 4.0 License.
the Creative Commons Attribution 4.0 License.
 | 03 Mar 2026
Physics- and hardware-aware frequency pair selection for deployment-ready nonlinear Lamb wave mixing
Ting You
Peijiang Li
Nonlinear Lamb wave mixing can reveal early micro-cracks through intermodulation products at , yet its deployment is often hindered by the lack of a pre-acquisition rule for selecting tone pairs that are simultaneously phase-coherent and measurable on a given instrument chain. We propose a physics- and hardware-aware ranking score, J(fa,fb), that integrates (i) normalised phase mismatch and the implied interaction length Lint, (ii) a path length term , (iii) measured receive-chain sensitivity , and (iv) a dynamic-range penalty that accounts for two-tone leakage and front-end limits. Embedded in a three-step workflow (dispersion pre-filtering, hardware screening, and top-K ranking), the score shortlists excitation pairs prior to spectral phase inversion (SPI-4) same-spectrum readout. Experiments on an aluminium plate with controlled crack growth (0–12 mm) show that low-J pairs consistently deliver higher mixed-line SNR(f+), concentrate in the low-mismatch basin, and cross a conservative detection threshold after only a few millimetres of extension, whereas higher-J pairs remain near the noise floor. The results demonstrate a transparent and reproducible route from physics and instrument constraints to deployment-ready frequency pair selection for baseline-free nonlinear guided-wave inspection.
- Article
(7778 KB) - Full-text XML
- BibTeX
- EndNote


1.1 Background and motivation
Structural health monitoring (SHM) based on guided ultrasonic waves has become a powerful tool for detecting incipient damage in plate-like structures across aerospace, civil, and mechanical engineering applications (Mardanshahi et al., 2025; Ghodousi and Lissenden, 2025; Shen et al., 2025). Conventional linear ultrasonic methods, which rely on wave scattering and mode conversion, are effective for locating and sizing relatively large defects, but they often lack the sensitivity required to detect early-stage micro-damage such as fatigue cracks, diffuse material degradation, and interfacial debonding.
Nonlinear ultrasonic techniques offer a promising route to higher sensitivity by exploiting the nonlinear interaction between guided waves and damage. Among these, frequency-mixing methods – in which two primary waves at the frequencies fa and fb generate intermodulation components at – have attracted particular interest because of their enhanced sensitivity to contact-type nonlinearities and microstructural evolution (Liang et al., 2025; Pan et al., 2025). Nevertheless, the practical deployment of nonlinear mixing techniques is still hindered by a critical bottleneck: the lack of a systematic, physics-informed criterion for selecting excitation frequency pairs that maximise detectability under real hardware constraints (Luo et al., 2026).
1.2 Problem setting
In many laboratory demonstrations, the two excitation frequencies are tuned manually along a single source–receiver (S → R) path until a clear mixed line appears in the spectrum. While this trial-and-error strategy can work for proof-of-concept studies, it is slow, not readily reproducible, and tightly coupled to one specific layout. In practical structures there are multiple interrogation paths, each with different lengths, boundary proximities, and transducer bandwidths. A tone pair that is perfectly phase-matched on the dispersion diagram may still be undetectable in practice because the piezoelectric transducer or front-end has a notch at f+ or because the two primaries already consume most of the analogue-to-digital converter (ADC) headroom.
What is currently missing is a principled way to move from the large set of all candidate frequency pairs (fa,fb) on a predefined grid to a small subset – typically three to six pairs per path – that are simultaneously (i) physically coherent for nonlinear mixing, (ii) receivable with adequate gain and noise performance, and (iii) safe for the hardware in terms of dynamic range, all before performing spectral phase inversion (SPI-4) or any other leakage-suppressed readout.
1.3 Existing work and research trends
Recent literature on nonlinear guided waves shows very active development along four closely related directions:
- i.
Phase-matching-driven nonlinear mixing. A series of papers over the last 5–6 years has emphasised that cumulative nonlinear guided-wave mixing is achieved only when the phase mismatch so that the effective interaction length is . This requirement has been analysed and demonstrated for both collinear and non-collinear Lamb waves, including Zhu's low-frequency S0–S0 mixing for fatigue damage in plates (Zhu et al., 2022), Pineda Allen's non-collinear mixing tests (Pineda Allen and Ng, 2023), and several recent feasibility studies on phase-matched Lamb wave mixing (Yin et al., 2020; Park et al., 2021; Ishii et al., 2025).
- ii.
Experimental damage detection by mixing. Multiple groups have shown experimentally that the sum frequency component is highly sensitive to contact-type and breathing-type defects, including fatigue cracks, corroded or loosened joints, and welded details (Zhang et al., 2024; Hu et al., 2025). Demonstrations now cover welded joints, turnout rails, complex plate assemblies, and even non-contact laser-based configurations. However, most of these studies still rely on empirically chosen or sparsely scanned frequency pairs (Aslam and Lee, 2024; Xu et al., 2024; Gao et al., 2012; Wu et al., 2025; Wu and Yin, 2023), and so the selection step remains largely ad hoc. Notably, the dominant nonlinear mechanisms vary across defect classes (e.g. crack–face contact, interfacial friction, or distributed corrosion), which influences the absolute mixed-component amplitude. Nevertheless, the pre-acquisition bottleneck addressed here – identifying tone pairs that are simultaneously phase-coherent and measurable under the actual channel bandwidth and headroom – is shared across defect types.
- iii.
Dispersion- and/or physics-informed selection. To make frequency selection more systematic, several works now exploit dispersion curves and Δk maps to pre-filter “promising” regions on the (fa,fb) plane or to select specific mode triplets tailored to a given defect type. Jiao et al. (2023) used a nonlinear Lamb wave mixing scheme to measure residual stress, explicitly deriving the resonant conditions (Jiao et al., 2023); Jiang et al. (2025) and Sun et al. (2023) carried out systematic investigations of frequency-mixing and phase-matching effects for different guided modes (Jiang et al., 2025; Sun et al., 2023). These studies significantly reduce blind tuning, but they still stop short of incorporating the actual receive-chain behaviour – for example, frequency-dependent gain and dynamic-range limitations – into the selection rule (Li et al., 2018a, b).
- iv.
Baseline-free and instrument-aware SHM. On the SHM side, there is a clear trend towards baseline-free nonlinear guided-wave detection that tolerates temperature and coupling variations (Giannakeas et al., 2023; Niu et al., 2023). A key motivation is that environmental drift can simultaneously shift the dispersion relation (hence k(f,T) and phase coherence) and alter the effective receive-chain transfer function through coupling and electronic changes so that both the physics terms and the hardware terms relevant to detectability evolve over time. Accordingly, recent SHM practice increasingly couples nonlinear metrics with leakage suppression strategies (phase reversal, pulse inversion, SPI-type cycling), explicit headroom management at the transducer and/or ADC, and lightweight in situ updates (e.g. temperature-indexed dispersion tables and opportunistic re-calibration of Grx(f)). Very recent works on baseline-free progressive fatigue detection, online nonlinear frameworks, and comprehensive guided-wave inspection reviews all reinforce this “physics–system” perspective (Liang et al., 2025; Pan et al., 2025; Luo et al., 2026; Abuassal et al., 2025; Cawley, 2024). However, they do not yet provide a single, path-wise score that simultaneously accounts for phase matching, receive gain, and dynamic-range headroom – which is precisely the gap targeted in this paper.
Despite this progress, two important gaps remain. First, most existing selection rules are dispersion-only: they identify which (fa,fb) pairs satisfy Δk≈0, but they do not indicate whether the piezoelectric transducer (PZT)/data acquisition (DAQ) chain can actually pass f+ with adequate signal-to-noise ratio (SNR) or whether the two primaries will overdrive the front-end. Second, almost all demonstrations are path-specific: parameters tuned for one S1 → S3 path on a 0.8 m×0.5 m plate do not immediately transfer to an orthogonal S2 → S4 path or to a slightly longer path in a different coupon. Bridging these two gaps – by unifying phase-matching physics with measured, channel-aware terms in a single ranking functional – is the specific niche of the present work.
1.4 Contributions of this work
Building on the phase mismatch, receive sensitivity, and dynamic-range analysis developed in the remainder of the paper, we make four main contributions:
- i.
We introduce a unified, interpretable scoring function J(fa,fb) that combines (a) a dispersion-derived mismatch term , (b) a path-to-path coherence term , (c) the measured receive gain Grx(f+), and (d) a dynamic-range penalty that quantifies the cost of two-tone excitation. All required quantities are either computable from the chosen mode triplet or directly measurable on the intended hardware.
- ii.
We propose a three-step, channel-aware selection workflow (physics pre-filter → short sweep to obtain Grx(f+) and a dynamic-range metric in the spirit of Li et al. (2018a) → Top-K ranking) that can be executed independently on each S → R path before SPI-4 acquisition, making the procedure reproducible and baseline-free.
- iii.
We provide experimental validation on a plate-like structure (, four PZTs, crack grown in steps), showing that low-J tone pairs indeed cluster inside the low-mismatch basin of the (fa,fb) map and deliver consistently higher mixed-line SNR values than medium- and/or high-J pairs.
- iv.
We conduct a deployment-oriented analysis (Sect. 4) that links detection probability to shortlist size and demonstrates that the same rule works, with only moderate performance degradation, across multiple interrogation paths.
1.5 Paper organisation
Section 2 formalises the physics-guided selection; derives the expressions for Δk, Lint, Grx, and the dynamic-range penalty; and defines the composite score J(fa,fb). Section 3 documents the specimen, the transducer layout, the crack growth plan, and the physics- and hardware-guided screening that generate the (fa,fb) maps. Section 4 presents the experimental results from a deployment viewpoint, including the global correlation between J and detectability, detection reliability versus shortlist size, crack growth sensitivity and repeatability, and path-to-path robustness. Section 5 concludes the paper and outlines extensions towards temperature-robust and imaging-integrated implementations.
Nonlinear Lamb wave mixing reveals early micro-cracks through intermodulation components at . In practice, however, a “good” excitation pair (fa,fb) must satisfy two conditions simultaneously: (i) it must be dispersion-coherent to enable second-order accumulation along the propagation path, and (ii) the resulting mixed line must be measurable on the intended transducer–front-end–ADC chain under the planned analogue settings. This section establishes a pre-acquisition selection rule that ranks candidate pairs using quantities that are either computable from dispersion or directly measurable on the hardware, culminating in a dimensionless score J(fa,fb) for fast top-K shortlisting.
2.1 Scope, assumptions, and notation
We consider two narrow-band tone bursts at frequencies of fa and fb that predominantly excite the guided-wave modes ma and mb in a plate. Quadratic nonlinearity generates components at , received in a target mode mt. The mode-dependent wavenumber is denoted as km(f) and is obtained from the plate dispersion relation (tabulated or numerically extracted and interpolated). For a given source–receiver path, the propagation distance is Lpath. The effective receive chain sensitivity at frequency f (transducer bandwidth, coupling, analogue front end, and digitiser settings) is Grx(f). A dynamic-range penalty DRpen(fa,fb) captures near-saturation risk under two-tone excitation.
During selection, specimen-specific nonlinearity (micro-contact state, local quadratic coefficient, etc.) is treated as an unknown multiplicative factor. Accordingly, the criterion is designed to preserve the ordering induced by the known and/or observable factors rather than to predict an absolute mixed-line amplitude.
2.2 Dispersion-coherent mixing: phase mismatch and coherence-limited accumulation
For a mode triplet , the phase mismatch is
2.2.1 Why Δk limits growth (compact “sinc law” derivation)
Under weak quadratic nonlinearity and narrow-band excitation, the mixed component accumulated over the direct-path segment can be interpreted as a coherent summation of locally generated contributions with phase factor exp (jΔkx). Let Leff denote the effective accumulation distance (for gated records, Leff is bounded by the gate that excludes strong reflections; in our experiments the gate is placed before the first back wall reflection so that Leff≈Lpath). The complex mixed-line amplitude obeys the scaling
where Γ collects unknown but slowly varying multiplicative factors (material nonlinearity level, micro-contact conditions, coupling variability, etc.). Equation (2) formalises the key point: when is small, the mixed component accumulates quasi-coherently with distance; when grows, phase walk-off causes partial cancellation, and the net build-up saturates.
2.2.2 A scale-free mismatch metric
To compare candidates across frequency and mode combinations, we use the dimensionless normalised mismatch ratio
which is invariant in relation to uniform wavenumber scaling and provides a compact “distance-to-phase-matching” measure suitable for gridded maps in the (fa,fb) plane.
2.2.3 Effective interaction length
A convenient coherence length associated with phase walk-off is
Pairs with small (equivalently small rΔk) yield long Lint and therefore a higher ceiling for coherent accumulation over a fixed Leff, as implied by Eq. (2). In practice, low-rΔk corridors in (fa,fb) serve as a physics-guided pre-filter before any hardware measurements are performed.
2.3 Channel constraints: receive sensitivity and dynamic-range headroom
Phase coherence is necessary but not sufficient: the mixed line must also fall into a frequency region that is receivable and measurable under the intended analogue settings.
2.3.1 Receive sensitivity as a multiplicative measurability factor
The measured spectral amplitude near f± is approximately
where Grx(f) captures the combined transfer behaviour of transducer bandwidth, coupling, and analogue front-end response. A short calibration sweep (or narrow-band estimate) under the same analogue gain and digitiser range planned for the nonlinear test provides Grx(f) over the relevant band. Normalising by a reference level of G0 yields , penalising receive notches and band edge operation while keeping the term dimensionless.
2.3.2 Dynamic range as a soft feasibility constraint
Two-tone excitation can saturate the front end or cause fundamental leakage to dominate the ADC, masking the mixed line. Let AFS be the usable full-scale amplitude under the selected gain or range, and let and be the leakage amplitudes of the primaries under identical settings. With a safety margin of , we define a soft penalty as follows:
Using a soft penalty (rather than hard rejection) improves robustness in relation to small calibration drift and coupling variability while still discouraging unsafe operating points.
2.3.3 Temperature variability and operational updates
In SHM deployments, temperature variability affects both (i) the dispersion relation and therefore the phase mismatch term Δk and (ii) the effective receive chain sensitivity Grx(f) through coupling changes and electronics drift. The proposed selection workflow accommodates these effects through two updateable inputs. First, the channel-dependent terms Grx(f+) and the headroom penalty DRpen are estimated using a short calibration sweep (or a narrow-band estimate) executed under the same gain and digitiser full-scale settings as the formal acquisition; repeating this sweep provides an in situ refresh of the hardware terms without relying on a baseline waveform. Second, temperature-dependent dispersion can be incorporated by evaluating k(f,T) using temperature-indexed look-up tables or elastic constants updated by a measured T so that and Lint(T) remain consistent with the current environment.
2.4 From a measurable proxy to a composite ranking score
Equation (2) implies that, up to the unknown factor Γ, the detectability ordering of candidate pairs is governed by (i) mismatch severity, (ii) whether the available coherence can be exploited by the given path length, (iii) receive sensitivity at f±, and (iv) dynamic-range headroom. We therefore define a composite, dimensionless score as follows:
Here, ϕ(⋅) is a bounded, monotone increasing function that penalises path and/or coherence mismatch without numerical blow-up. In this study we use (equivalently ) so that ϕ→0 when Leff≪Lint (coherence is not yet a limiting factor) and ϕ→1 when Leff≫Lint (cancellation dominates).
2.4.1 Interpretation and properties
The score J is (i) dimensionless, (ii) monotone in each “undesirable” direction (larger mismatch, poorer receive sensitivity, smaller headroom), and (iii) computable prior to SPI-4 acquisition. Lower J indicates a higher probability of observing a mixed line at f± under the planned hardware settings. Unless otherwise stated, we use wi=1 as a robust default; when labelled outcomes are available, {wi} can be tuned using regularised logistic regression with cross-validation while retaining the structure of Eq. (7) to preserve physical interpretability.
2.4.2 Dependence on defect class
The score J(fa,fb) is formulated as a detectability proxy: it ranks candidate pairs by phase coherence and by the measurability of f+ under the intended receive chain and headroom constraints. These ingredients are governed primarily by dispersion, path geometry, and instrumentation and therefore do not assume a specific defect mechanism. Different defect classes may, however, exhibit different nonlinear source strengths and frequency dependence; when a defect-specific prior is available, it can be incorporated by adjusting the weights ωi and/or by restricting the mode triplet to those known to be sensitive to that mechanism while preserving the structure of J.
2.4.3 Weight setting and practical tuning
Unless stated otherwise, we use uniform weights ωi=1 as a robust default. Scenario-specific tuning is possible when a small labelled set is available (e.g. detectable vs. non-detectable at f+); we use regularised logistic regression with cross-validation to mitigate overfitting but do not assume a universal optimal weight vector across thicknesses, defect classes, or layouts.
2.5 Fast three-step workflow (top K) and compatibility
The pre-acquisition selection is implemented as follows:
-
Physics pre-filter. Compute rΔk using Eq. (3) over the (fa,fb) grid and retain candidates in a low-mismatch corridor while enforcing that f± lies inside the usable receive band. A practical default is rΔk≤τ1 with (reported explicitly for traceability).
-
Hardware screening. Measure Grx(f) once over the relevant band and evaluate DRpen using Eq. (6) under the planned analogue settings; reject candidates in receive notches or with unsafe headroom (large DRpen).
-
Ranking. Evaluate J using Eq. (7) for the surviving set, sort ascending, and retain the top-K pairs (typically K=3–6) for formal SPI-4 (or other) acquisition.
The score J acts upstream of demodulation and is therefore compatible with SPI-4 phase cycling, coherent averaging, or imaging and/or beam-forming. Operationally, J reduces trial and error by concentrating acquisition on tone pairs that are simultaneously dispersion-coherent and channel-admissible.
3.1 Specimen, transducer layout, crack states, and acquisition chain
Experiments were conducted on a rolled aluminium plate with in-plane dimensions of and a thickness of h=1.6 mm. A right-handed Cartesian frame (x,y) was adopted with the origin at the lower-left corner of the plate, x along the long edge, and y along the short edge. All sensor coordinates, path lengths, and crack tip locations reported in this section are referenced to this global frame. Figure 1 shows the benchtop experimental setup.
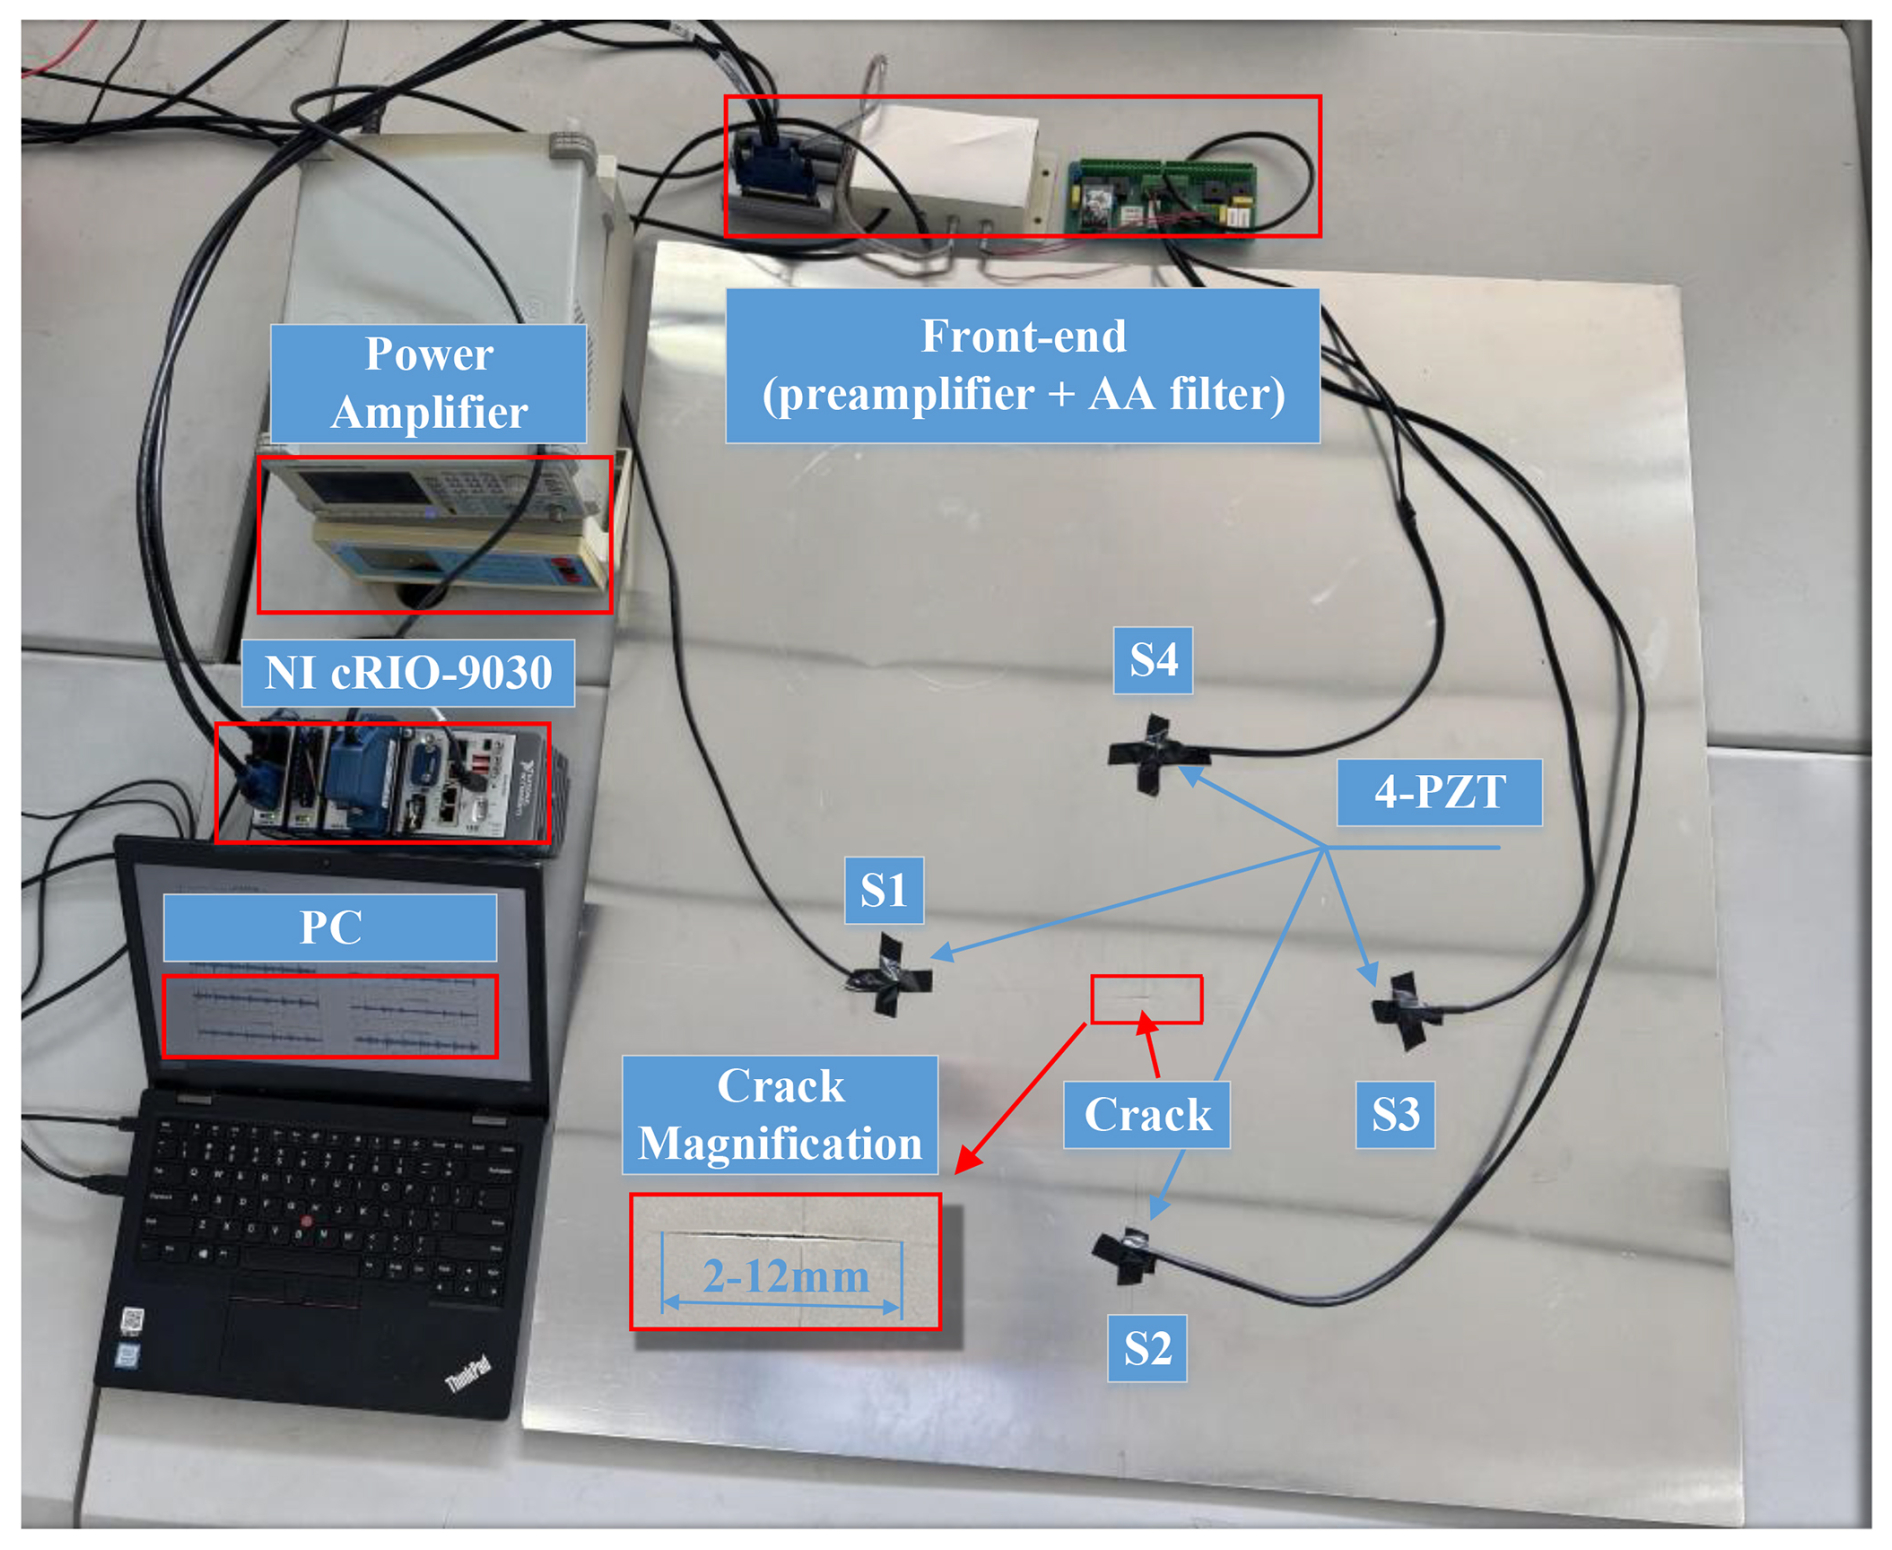
Figure 1Photograph of the experimental setup and test plate with four surface-bonded PZTs (S1–S4).
Four surface-bonded PZT wafers (S1–S4) were adhesively mounted on one surface of the plate. Each PZT could act as an actuator or receiver depending on the selected source–receiver configuration. In the global coordinate frame, the four PZTs were positioned at S1: (150,450) mm, S3: (550,450) mm, S2: (350,250) mm, and S4: (350,650) mm. These locations define an interrogation region that contains all source–receiver (S → R) paths considered here and the crack ligament to be monitored.
Table 1Transducer layout and interrogation paths on the plate. Coordinates are given in the global frame with the origin at the lower-left corner.
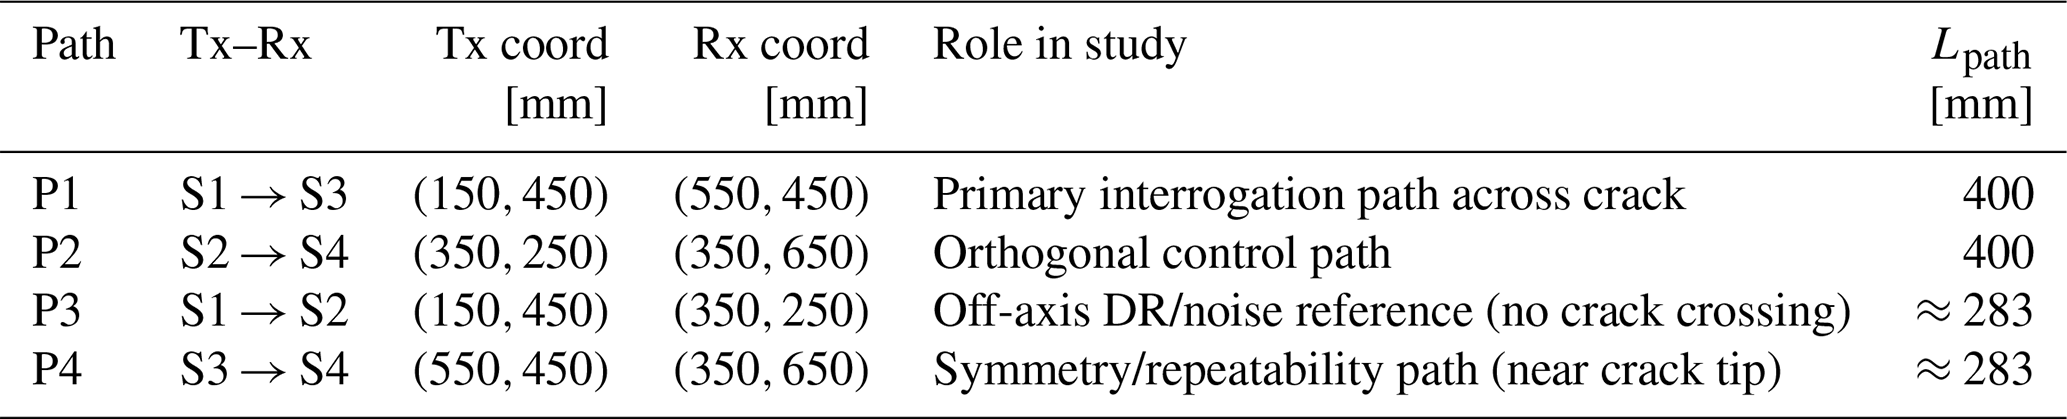
The primary interrogation path P1 (S1 → S3) crosses the crack ligament and is used for the nonlinear analyses reported in Sect. 3.2 and 3.3. Additional paths (P2–P4) serve as an orthogonal control path, an off-axis dynamic-range and/or noise-reference path, and a symmetry and/or repeatability path, respectively. The transmitter–receiver pairs, coordinates, nominal path lengths, and qualitative crack crossings are summarised in Table 1.
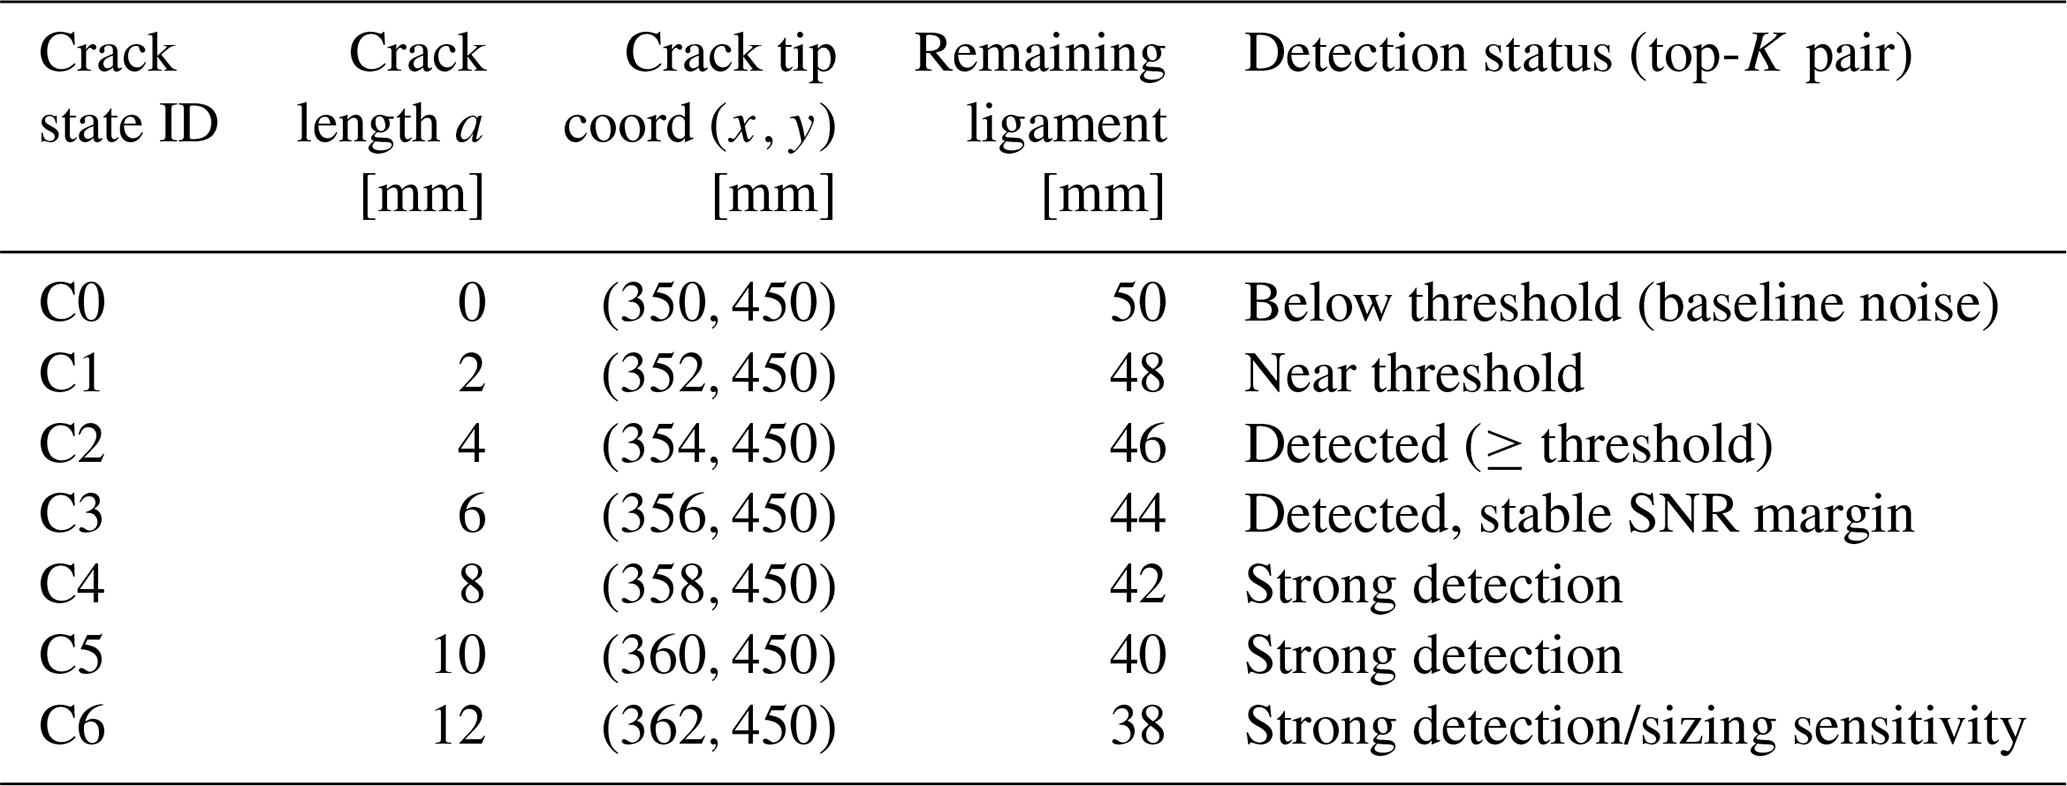
A surface-breaking crack was introduced into the ligament between S1 and S3 and then grown incrementally under controlled loading, producing crack length states C0–C6. For each state, the crack length a, crack tip coordinates, and remaining ligament distance along P1 were measured. All acquisitions were conducted under approximately constant laboratory ambient conditions. For field monitoring, the same short calibration sweep used to estimate Grx(f+) and DRpen can be executed periodically to track hardware drift (including temperature-related changes) under identical acquisition settings. The nominal sequence is reported in Table 2; these crack states form the crack length axis in the SPI-4 crack growth analysis of Sect. 3.3.
3.2 Physics- and hardware-guided frequency pair screening
All measurements used for the nonlinear analysis were acquired under fixed analogue gain, fixed gate timing, and an identical digitiser full-scale range. Two Hann-tapered narrow-band tones at fa and fb were digitally generated and uploaded to an NI cRIO-9030 (CompactRIO) system. The analogue-output module produced the summed two-tone waveform, which was then linearly amplified by a power amplifier and injected into the transmitting PZT. The received waveform was routed through a low-noise preamplifier and a front-end anti-alias filter and then was digitised by a cRIO analogue-input module at 5–10 MHz for storage and post-processing on the control PC. For each (fa,fb) pair and each crack state, at least N=16 repeats were recorded under the same time gate placed before the first significant back wall reflection.
To document the linear guided-wave behaviour under the same mounting and instrument settings, Fig. 2 shows representative time domain records on path P1. Figure 2a displays a gated time response under narrow-band excitation, and Fig. 2b compares the measured response at 145 kHz with a dispersion-based prediction for the selected Lamb mode. These records confirm that the chosen paths, gate, and sampling settings provide clean and repeatable measurements suitable for the sum frequency analysis reported on later.
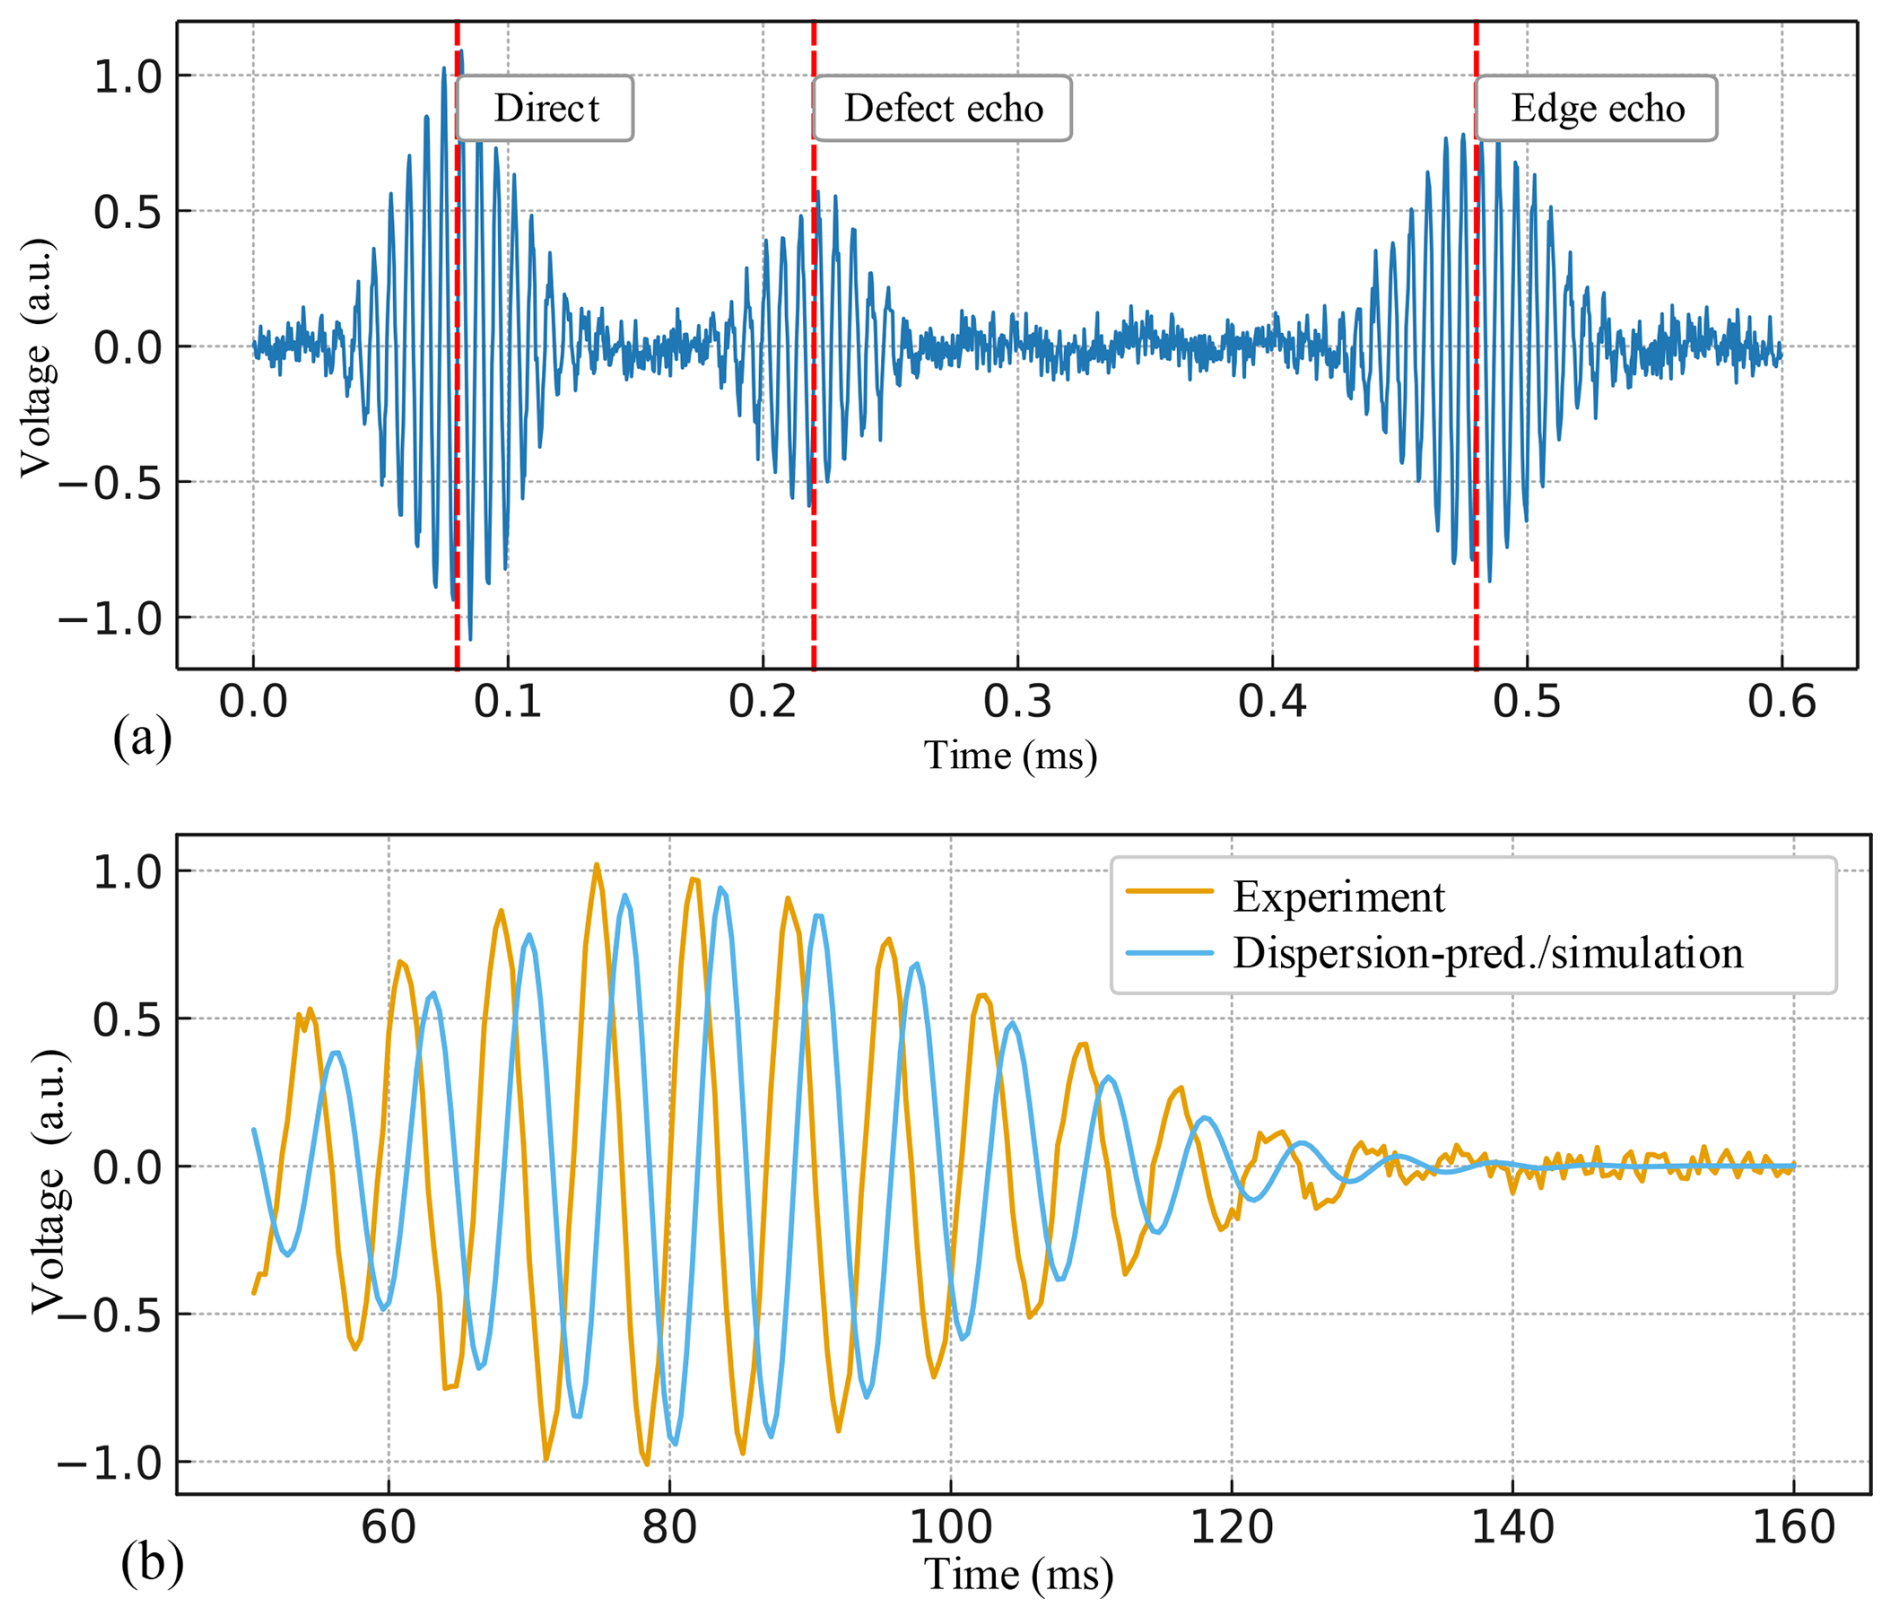
Figure 2Linear guided-wave characterisation on path P1: time domain response and 145 kHz experiment–simulation comparison. (a) Gated time domain response on path P1 under narrow-band excitation. (b) The 145 kHz experiment–dispersion and/or simulation check.
We next executed the pre-acquisition screening workflow introduced in Sect. 2.5 on path P1 using a dense grid of candidate excitation pairs (fa,fb). The goal was to retain only pairs that are (i) physically favourable for coherent nonlinear mixing (low phase mismatch) and (ii) feasible on the implemented receive chain (sufficient sensitivity and dynamic-range headroom). The screening results underpin Figs. 3 and 4.
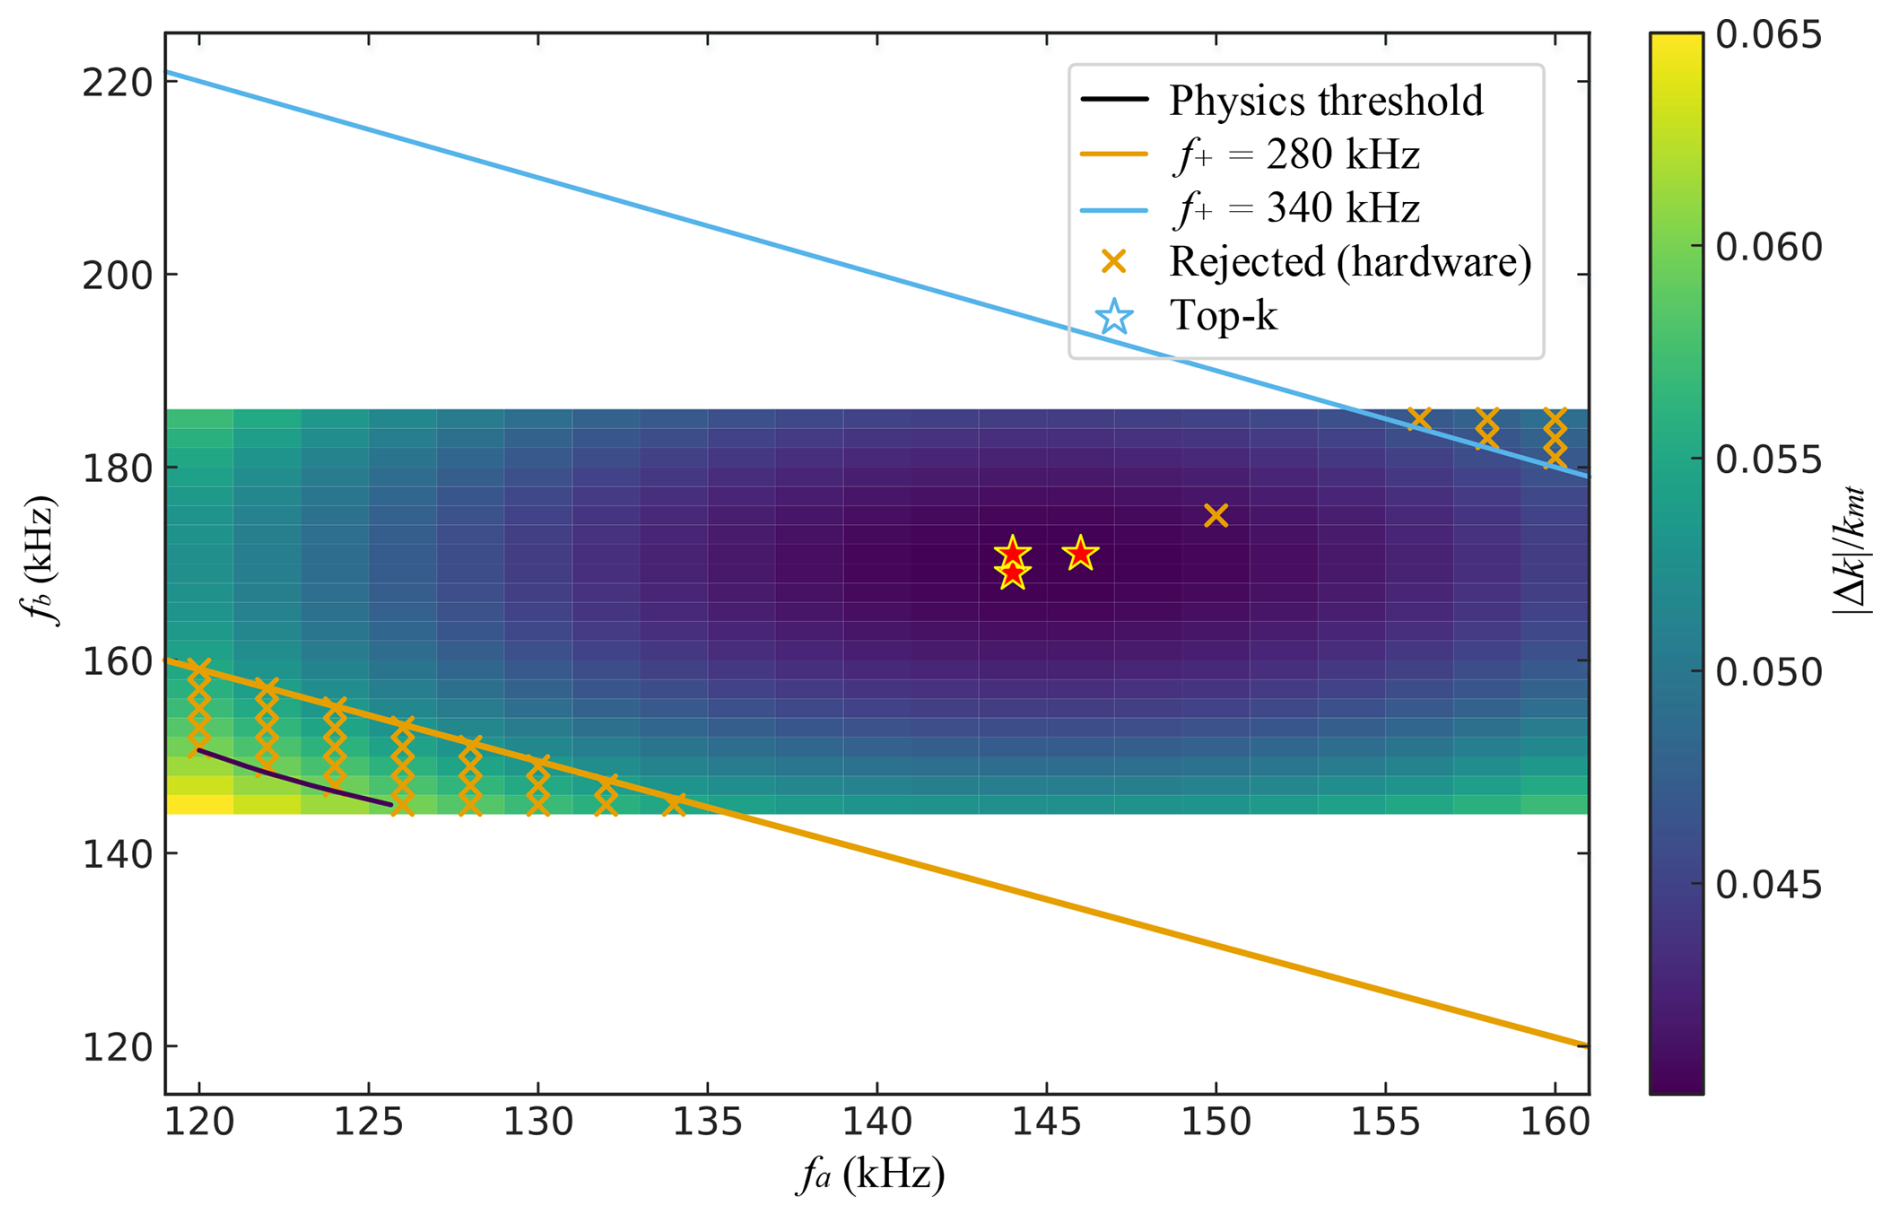
Figure 3Frequency pair screening on path P1: phase mismatch map with receive-band constraint and top-K shortlist overlay.
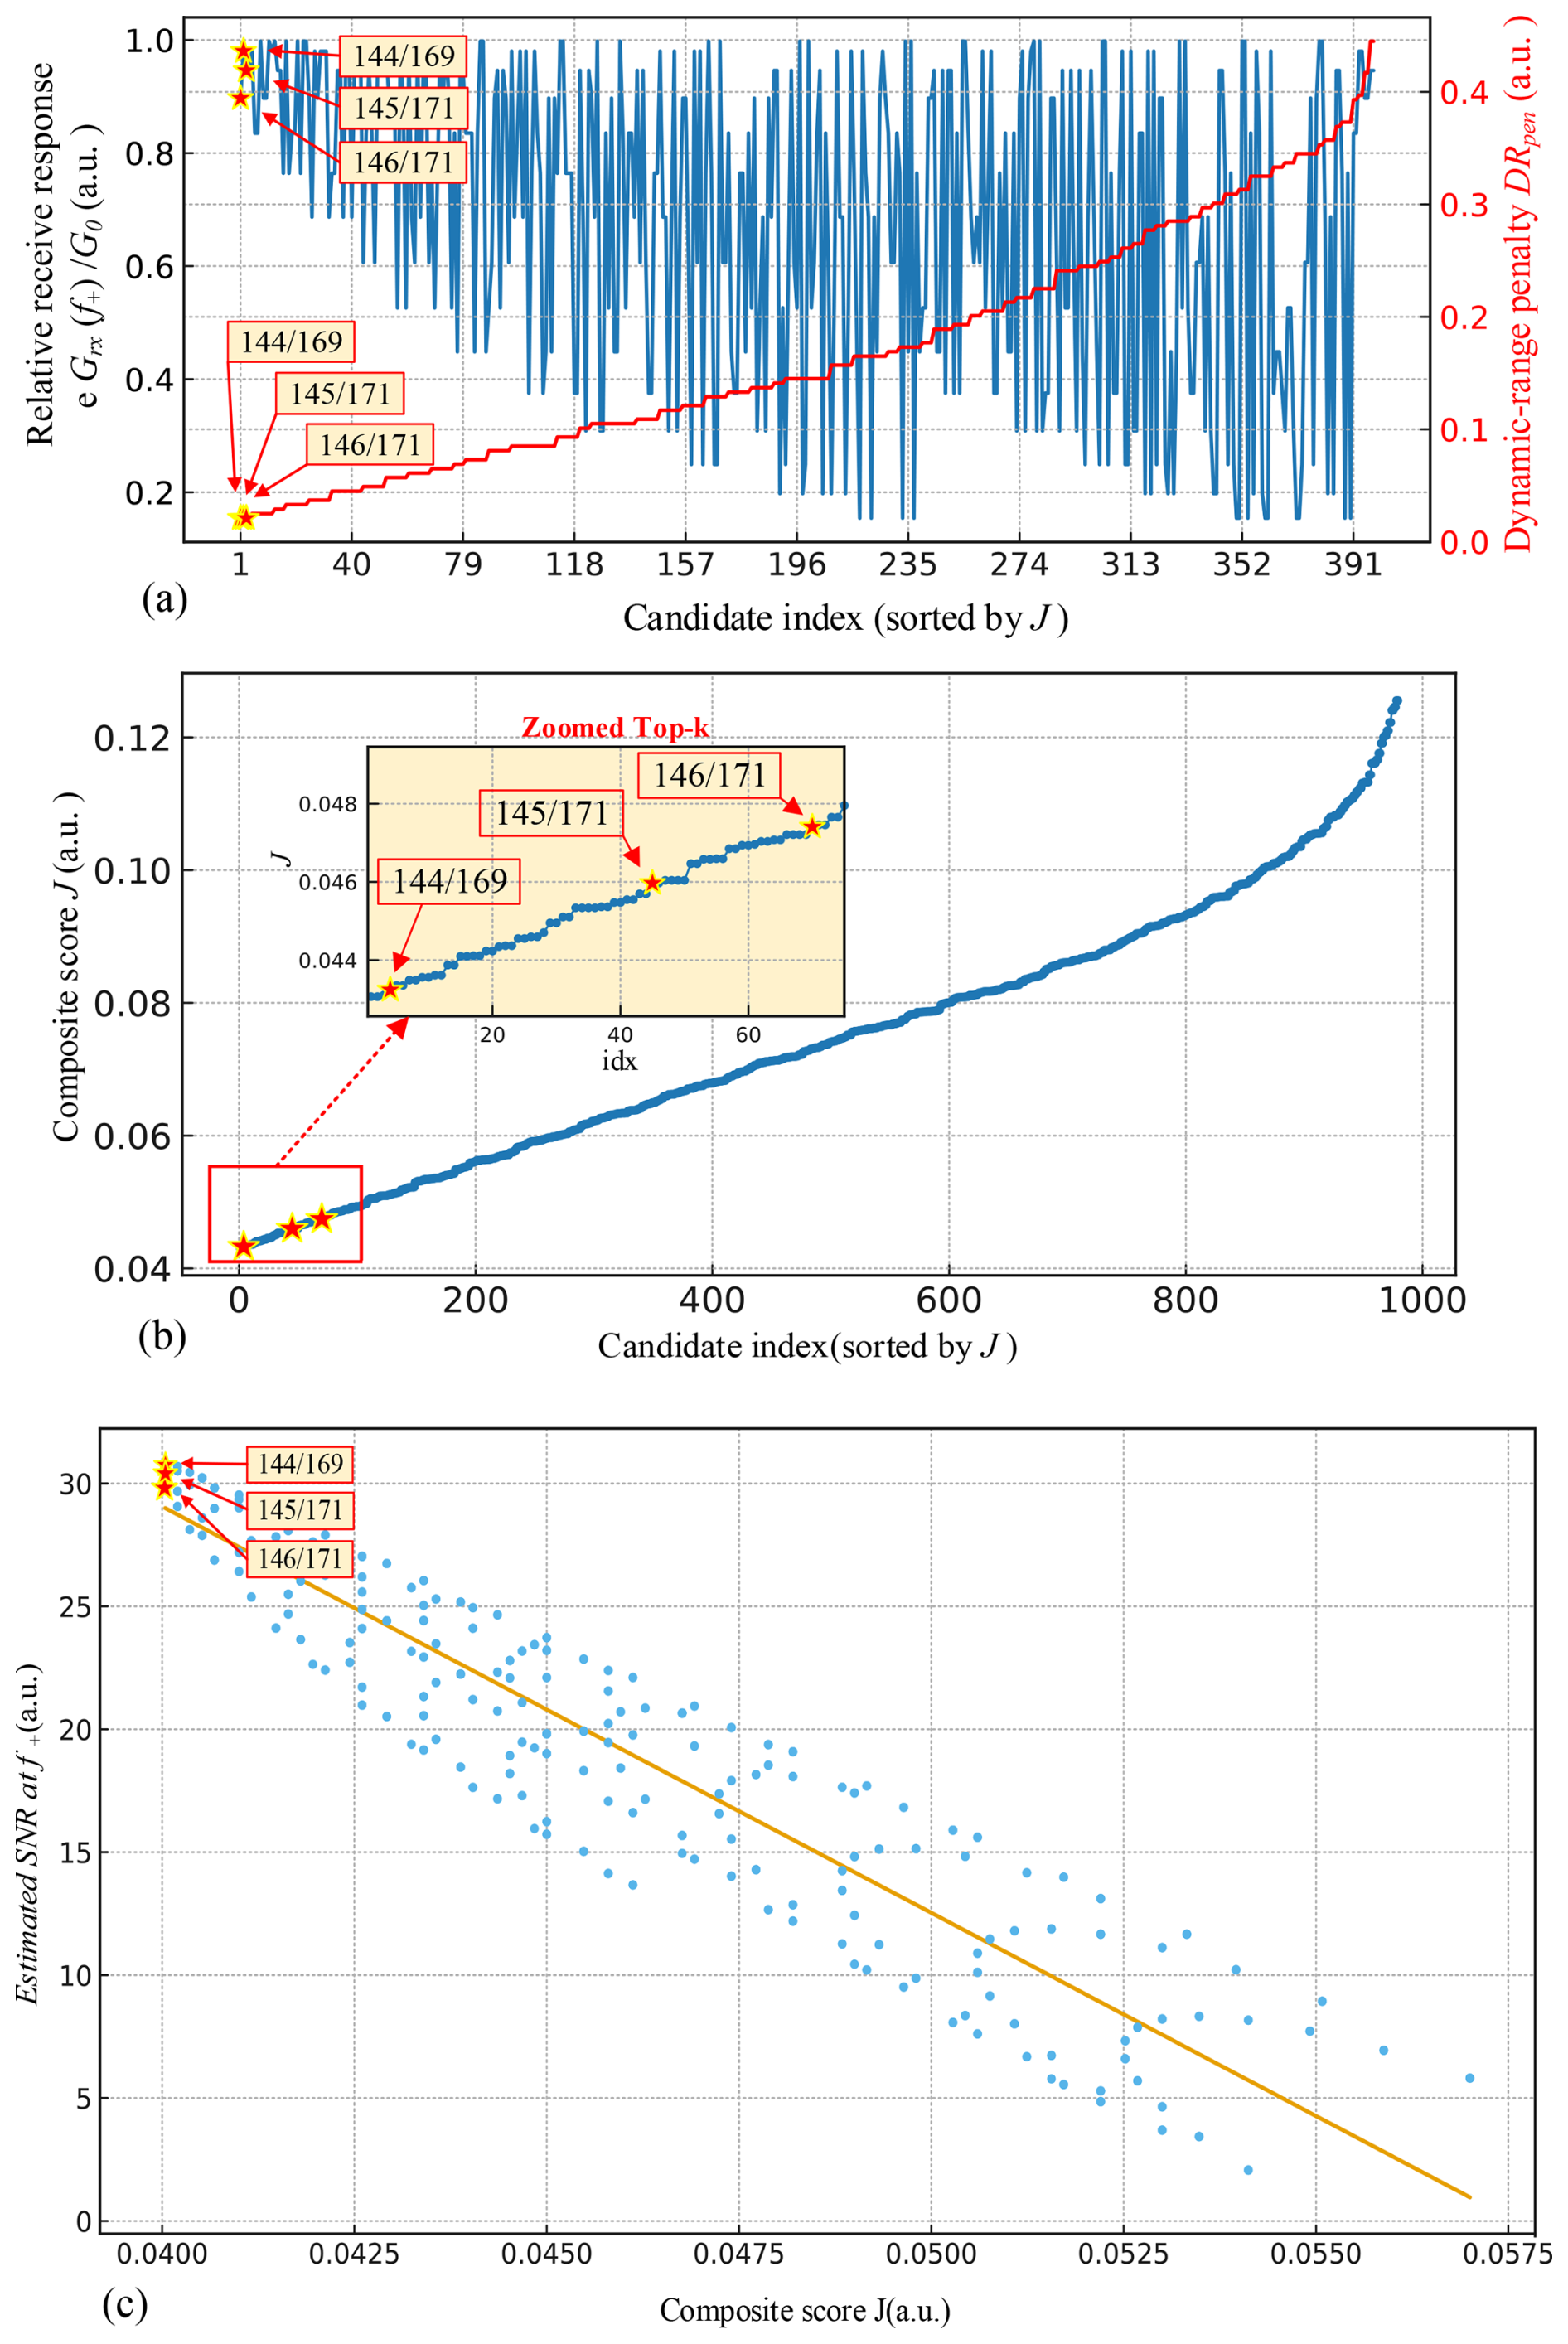
Figure 4Ranking of physics- and hardware-admissible frequency pairs using the composite score J. (a) Composite score J versus candidate index for all physics- and hardware-admissible pairs. The top-K subset occupies the low-J end. (b) Normalised receive gain and dynamic-range penalty DRpen(fa,fb) for the same ranked candidates. (c) Estimated SNR(f+) versus J, showing that lower J systematically corresponds to higher detectability.
For screening we focus on the sum frequency component , which is received predominantly in a target mode mt. Phase mismatch is quantified by Δk(fa,fb) as defined in Eq. (1), evaluated at f+, and the corresponding effective interaction length Lint is computed using Eq. (4).
Pairs with sufficiently small rΔk (and, hence, long Lint) and with f+ inside the usable receive band were classed as physics-admissible. Among these, we then imposed hardware admissibility. A short calibration sweep around f+, using analogue settings identical to those of the nonlinear experiment, provided an estimate of the normalised receive chain sensitivity . In parallel, the dynamic-range penalty DRpen(fa,fb) was evaluated using Eq. (6). Only candidates that avoided receive notches and near-saturation operating points were retained.
To prioritise viable candidates for acquisition, we evaluated the composite score J(fa,fb) defined in Eq. (7) (default weights of wi=1) for each retained pair, with all terms being specialised according to the sum frequency component f+. A low J indicates a combination of favourable phase matching, long effective mixing length relative to the available path length, high receive sensitivity at f+, and sufficient dynamic-range headroom.
All candidates were ranked in ascending J, and the lowest-J subset defines the top-K shortlist carried forward into the SPI-4 crack-monitoring measurements. Figure 4a plots the J versus candidate index (sorted by J), with the Top-K region highlighted. Figure 4b shows the corresponding receive response and the dynamic-range penalty DRpen(fa,fb), illustrating that top-K pairs combine high receive responses with a low penalty. Figure 4c connects ranking to performance by plotting the estimated SNR(f+) versus J.
3.3 SPI-4 phase cycling and nonlinear readout for crack monitoring
All nonlinear measurements used for crack growth analysis on P1 were acquired using an SPI-4 phase-cycling protocol combined with a single-shot same-spectrum readout. Four phase states were recorded by toggling the relative phase between the two drive tones at fa and fb and then were linearly combined to suppress deterministic leakage at fa and fb while coherently reinforcing the quadratic sum frequency component at . All four states were acquired under identical analogue gain, gating, and trigger conditions so that dynamic-range constraints were consistent across candidates.
For each SPI-4 combined record, a single fast Fourier transform (FFT) was computed, and the magnitudes at fa, fb, and f+ were extracted. A local noise floor was estimated from a nearby band free of deterministic lines. The detectability metric was defined as
where A(f+) is the amplitude at the sum frequency, and Anoise,rms is the root-mean-square noise level in that band.
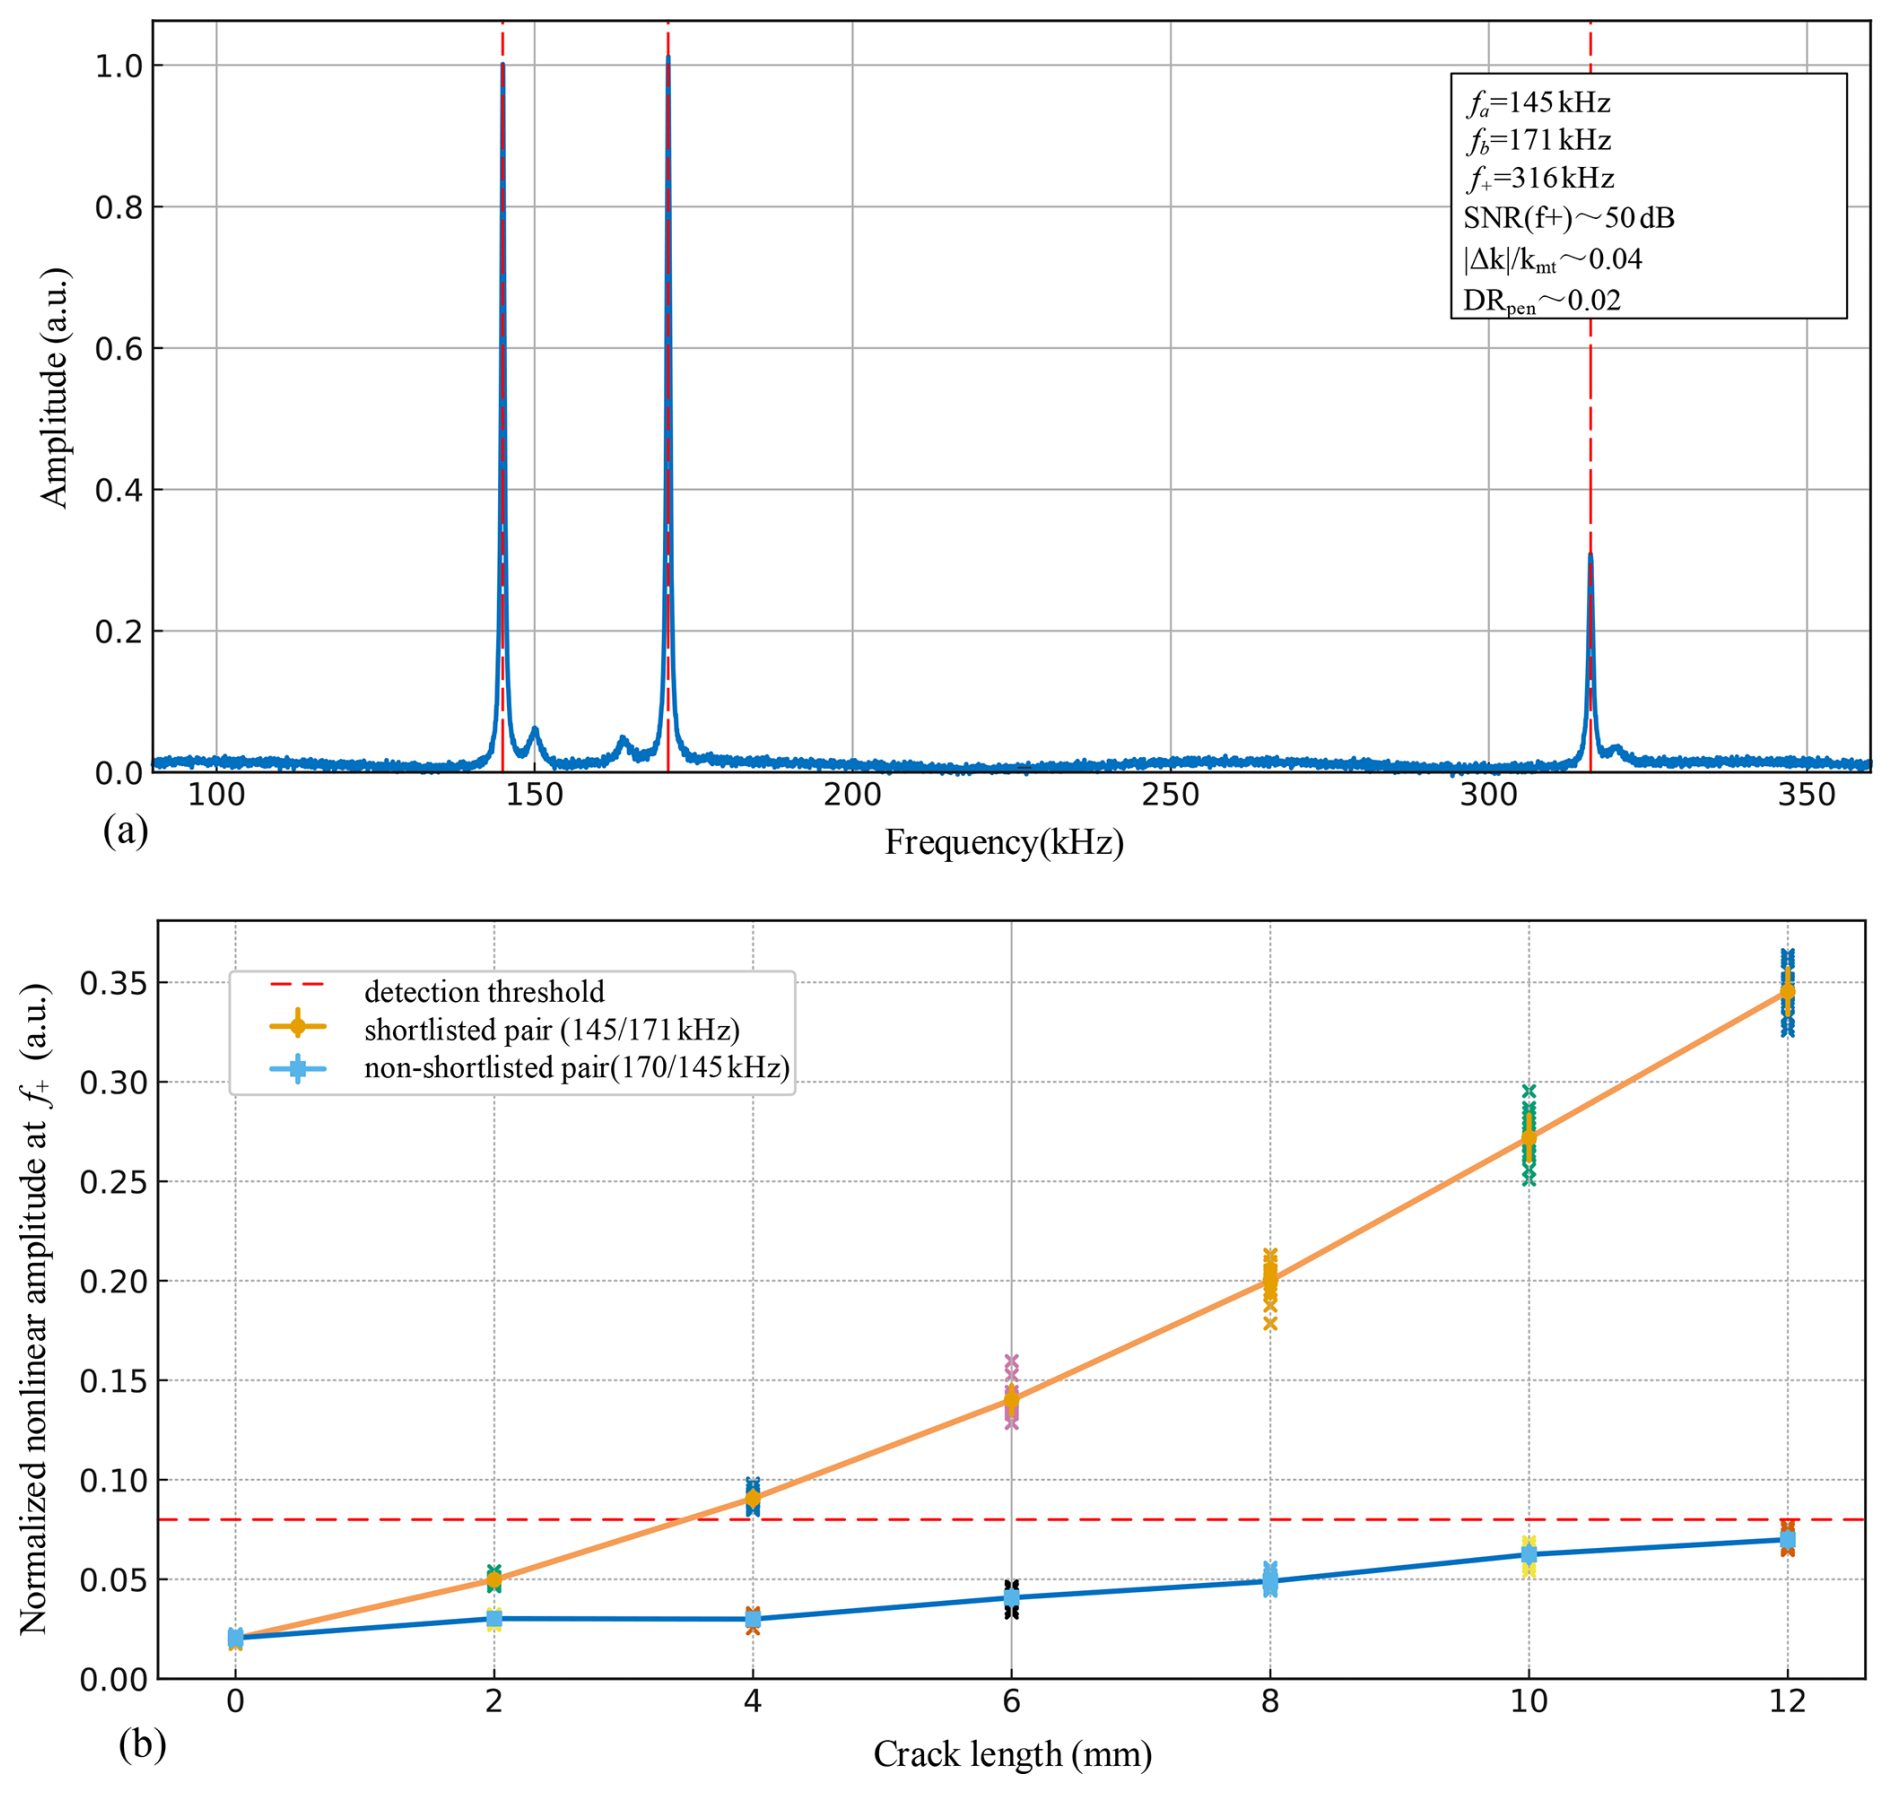
Figure 5SPI-4 nonlinear readout and crack growth sensitivity on path P1. (a) SPI-4 same-spectrum FFT for a shortlisted pair (145/171 kHz) on path P1. (b) Normalised nonlinear response at f+ versus crack length for a shortlisted (low-J) pair and a non-shortlisted (higher-J) pair on path P1.
Figure 5a illustrates leakage suppression for a shortlisted top-K pair, kHz, measured on path P1. After SPI-4 combination, leakage at fa and fb is strongly suppressed, while the quadratic component at kHz emerges as a distinct line above the local noise floor. Figure 5b tracks the mixed-frequency response versus crack growth from C0 to C6 (Table 2), showing that low-J shortlisted pairs cross the detection threshold earlier and exhibit stronger growth with crack extension than non-shortlisted, higher-J pairs.
3.4 Experimental execution and traceability
The screening workflow of Sect. 2.5 was executed, without manual retuning, on each S → R path listed in Table 1. Candidate tone pairs were first filtered by physics (phase mismatch and receive band constraints) and then were screened by hardware using the measured receive response and dynamic-range headroom and were finally ranked by the composite score J defined in Eq. (7) to produce a top-K shortlist.
Repeatability and traceability were enforced as follows. For every shortlisted pair and for every crack length state C0–C6 (Table 2), we acquired N=16 SPI-4 phase-cycled repeats under an identical time gate placed before the first back wall reflection. Along with the raw waveforms, we logged the S → R geometry (Table 1), crack metadata (Table 2), analogue gain and digitiser full-scale settings, gate timing, FFT window and zero-padding, and the noise band used for estimating Anoise,rms in Eq. (8). These metadata provide an audit trail that enables independent reconstruction of the shortlisted pairs and reproduction of the reported mixed-frequency SNR(f+) trends.
4.1 Global correlation between ranking score and detectability
This subsection evaluates whether the composite score J can be used as a global predictor of nonlinear crack detectability rather than as a path-specific tuning number. For every admissible tone pair (fa,fb) across all source–receiver paths and all crack states, we record (i) its score J, which penalises phase mismatch, short interaction length, weak receive gain at , and limited dynamic-range headroom, and (ii) the gated SPI-4 same-spectrum response level at f+, expressed as SNR(f+) in dB.
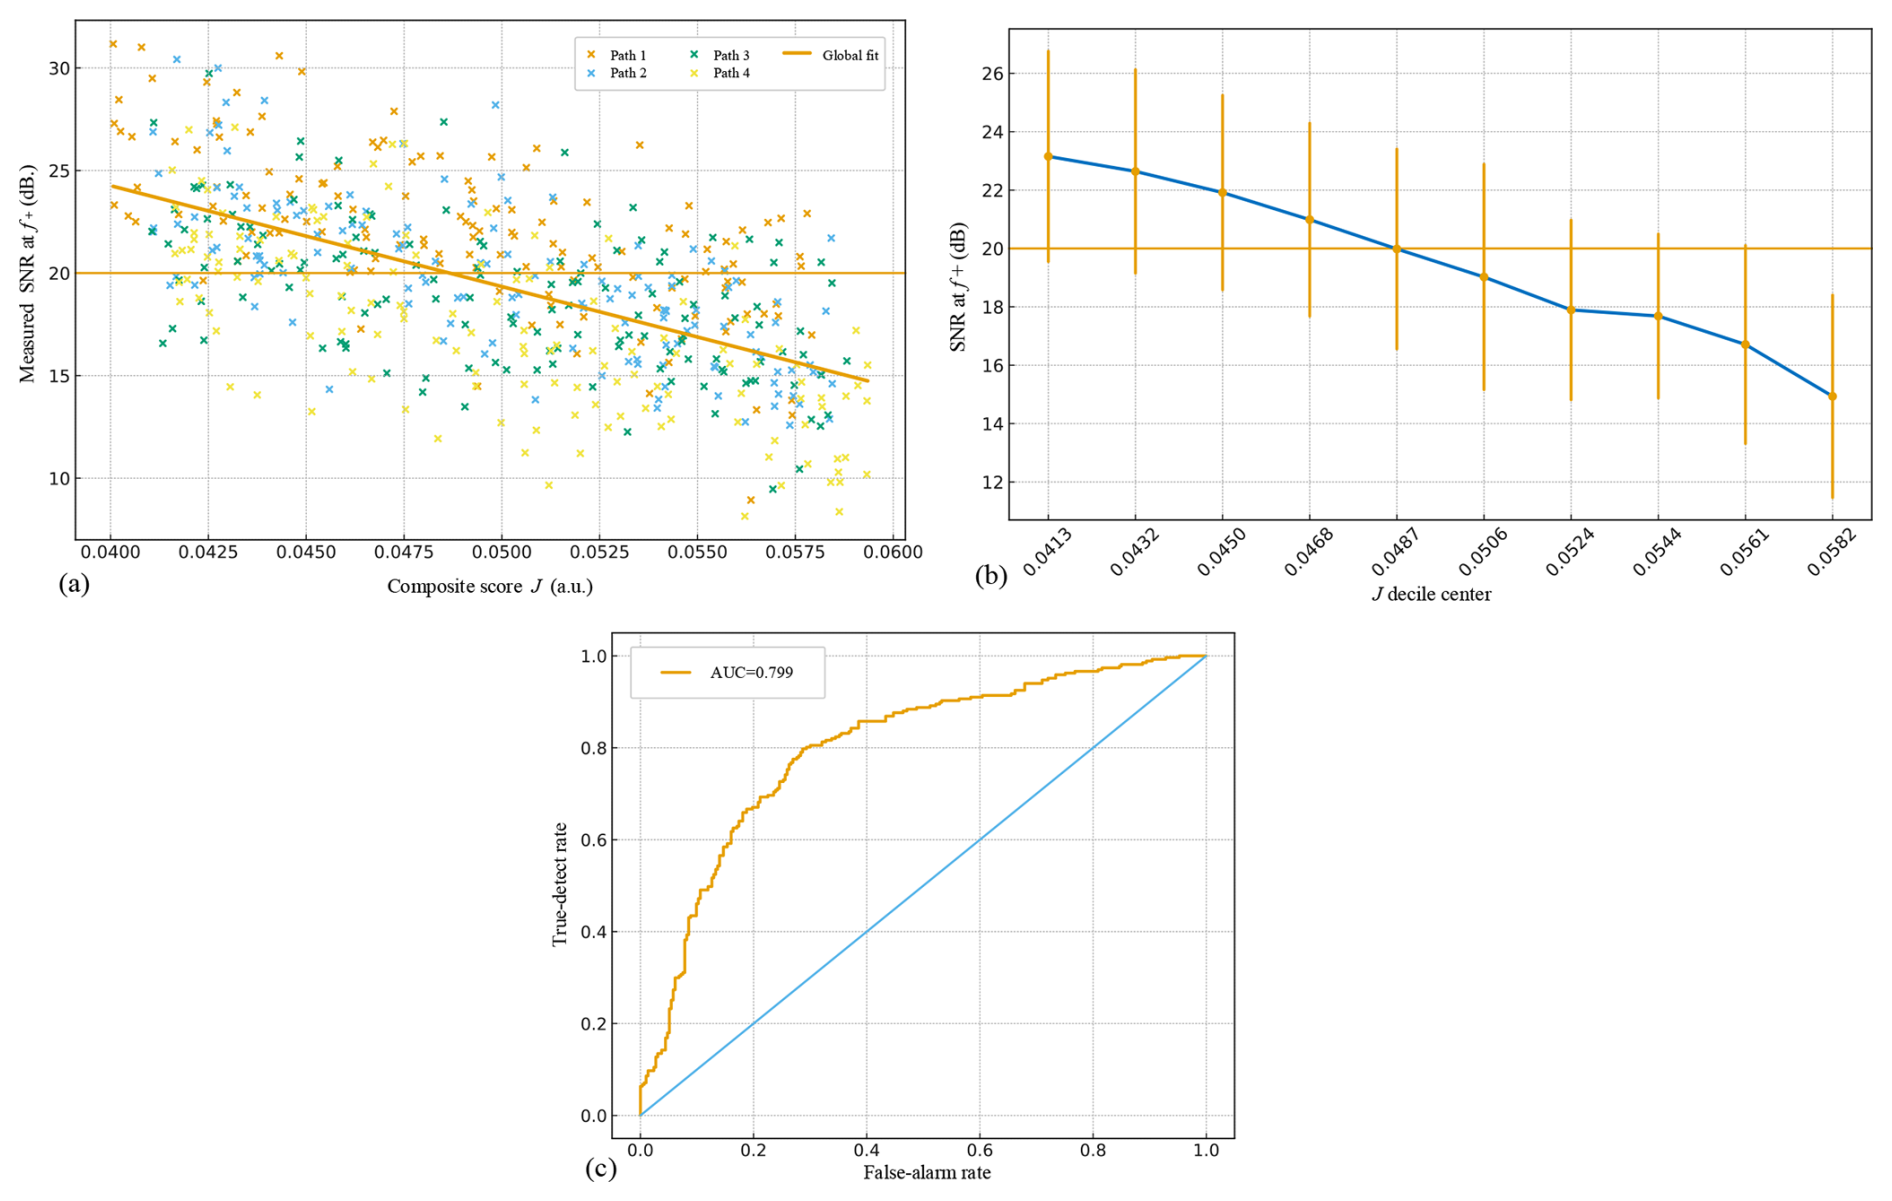
Figure 6Global relationship between composite score J and measured detectability of the nonlinear mixed-frequency component. (a) Measured SNR(f+) versus composite score J across all paths. (b) Distribution of SNR(f+) binned by J deciles. (c) ROC-like curve for detection based on a threshold Jcut.
Figure 6a plots SNR(f+) versus J for all paths, with a single global linear fit and a horizontal detection threshold (20 dB). A clear inverse trend is observed: low-J tone pairs consistently lie above the threshold, whereas high-J pairs cluster close to the noise floor. Importantly, each acquisition path follows the same trend despite differences in propagation distance and coupling. This shows that J generalises across hardware configurations and crack lengths.
To quantify robustness, the full dataset is binned by score decile (Fig. 6b). The lowest-J bins exhibit high SNR(f+) with tight spread, indicating not only a stronger average response but also repeatability. As J increases, both the mean SNR(f+) and its stability deteriorate, and many tone pairs fall on or below the detection threshold. This separation defines a practically useful “low-J regime”: if a pair falls into that regime, it is very likely to yield a clear nonlinear peak.
Finally, we treat J as a binary selector. Tone pairs whose SNR(f+) exceeds the threshold are labelled as “detectable”, and we sweep a cutoff Jcut to predict detectability. The resulting receiver operating characteristic (ROC) curve in Fig. 6c shows a high area under the curve, confirming that a single scalar threshold on J can discriminate between usable and unusable frequency pairs with a favourable true-detect/false-alarm balance.
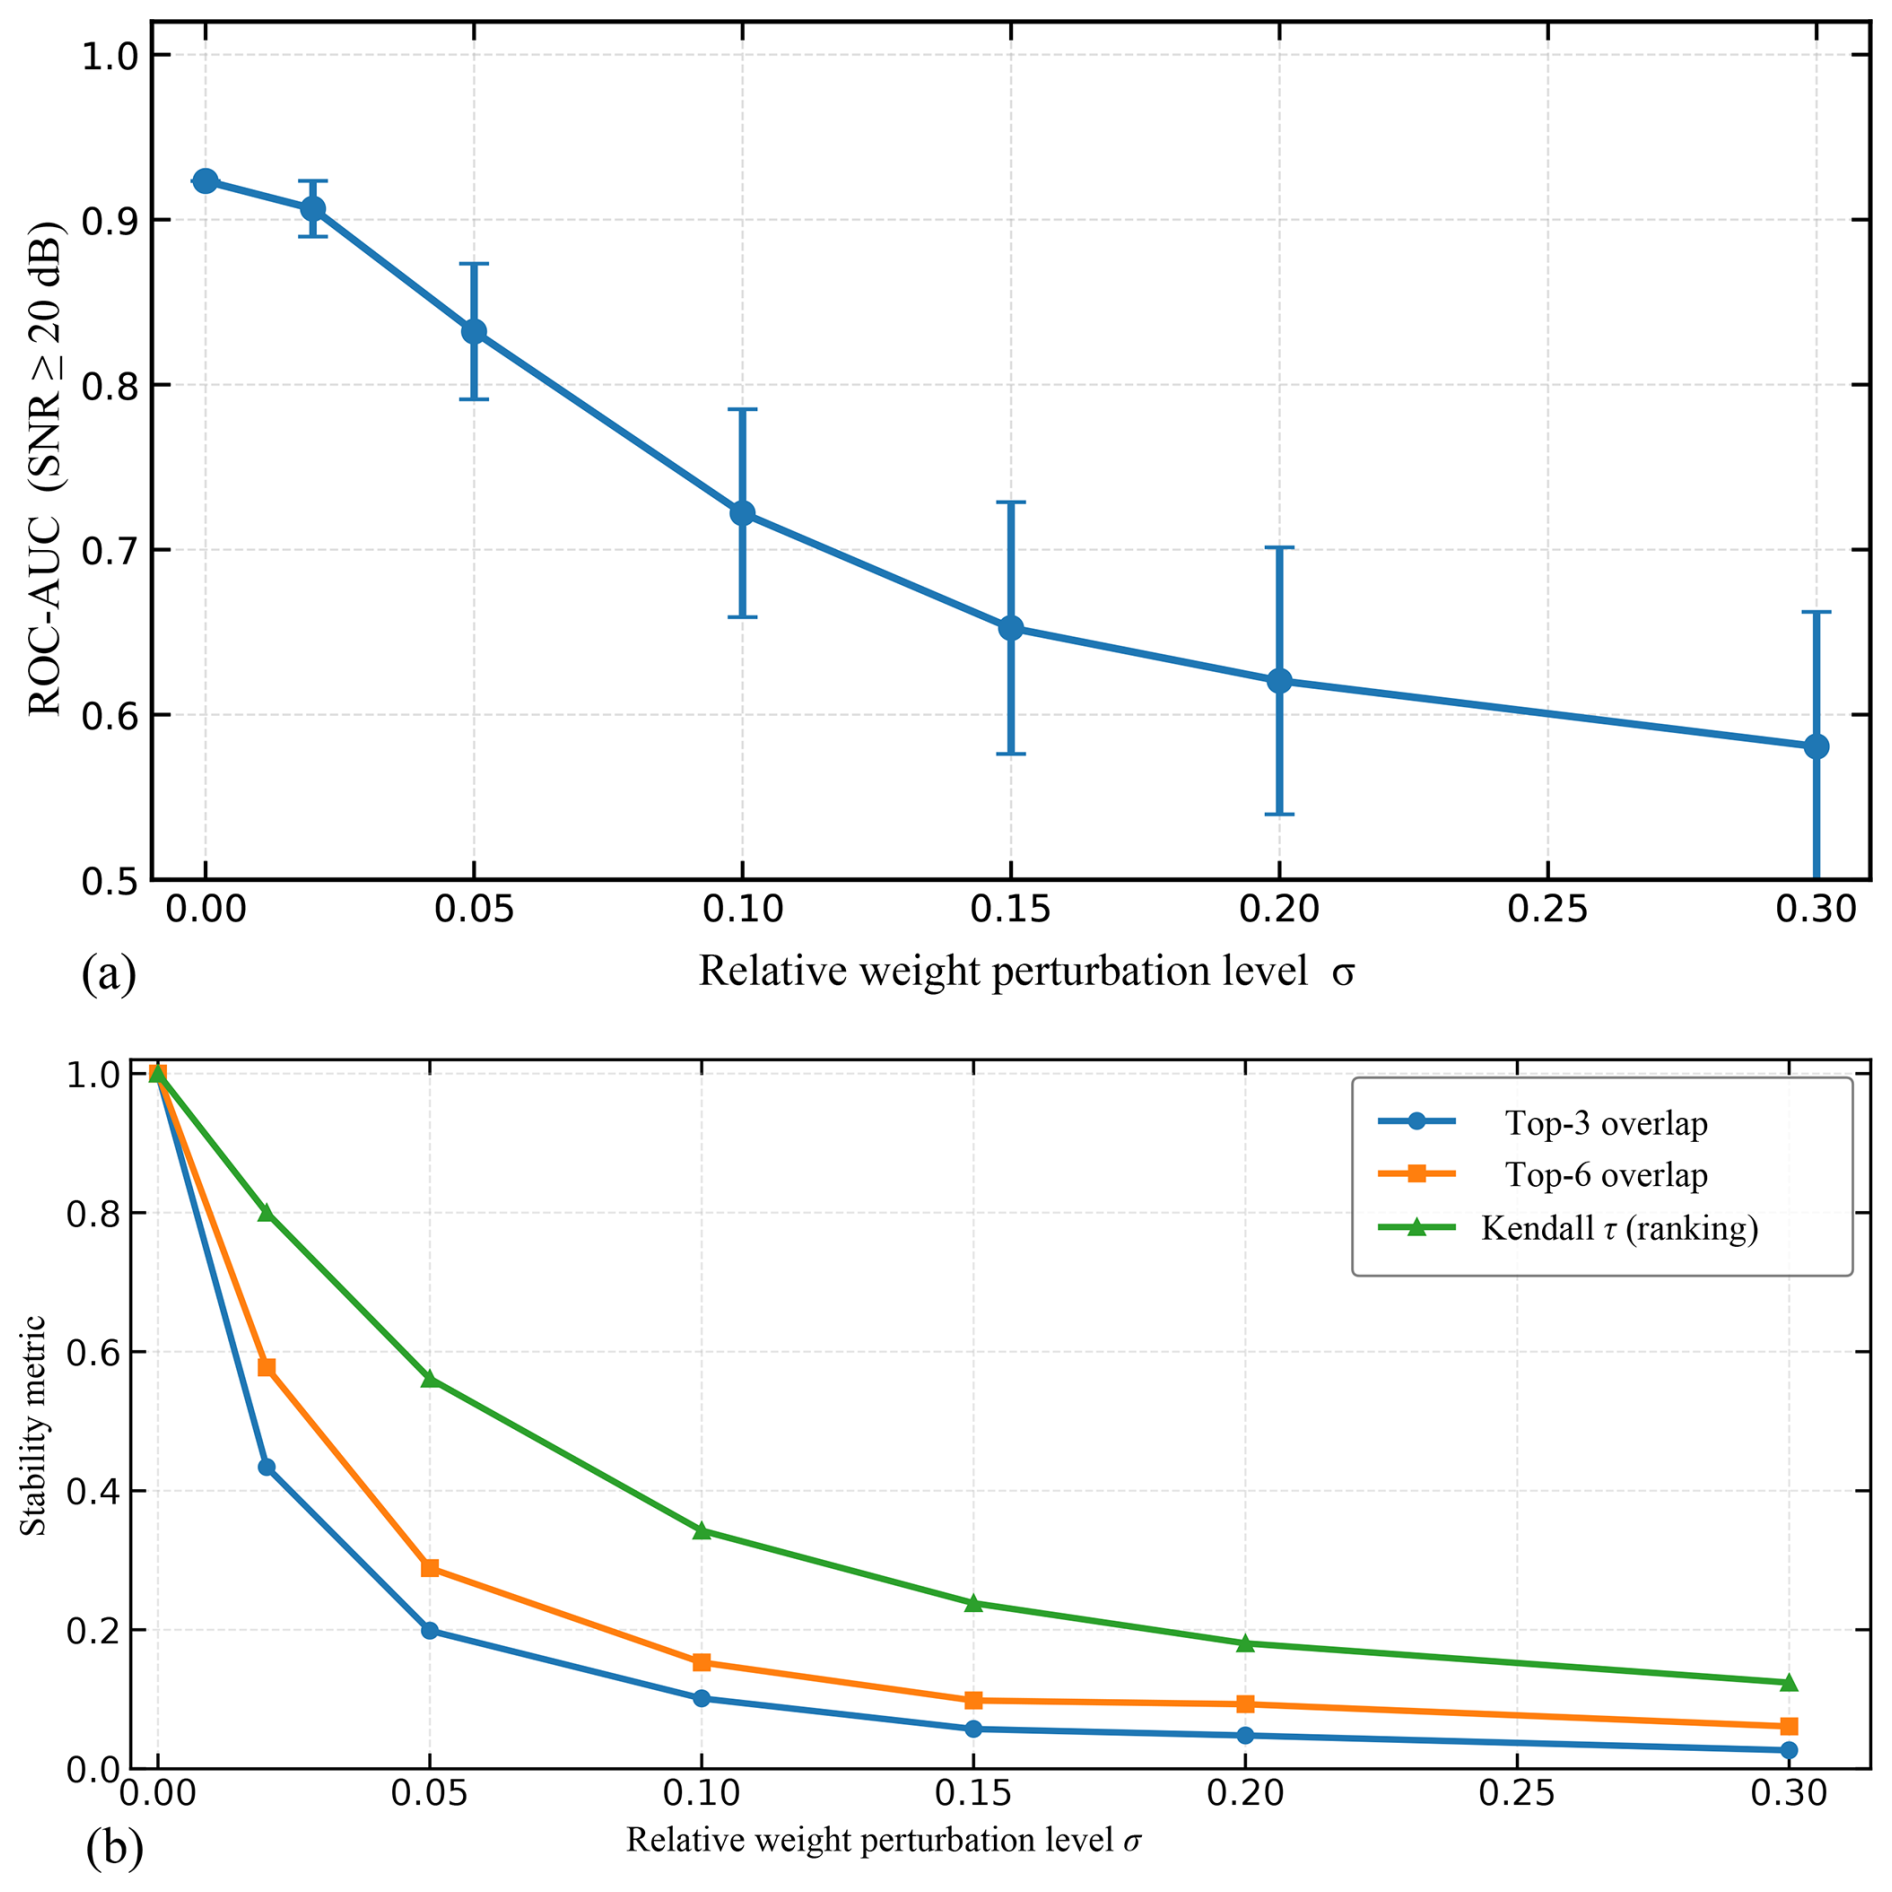
Figure 7Robustness of detectability prediction under weight perturbations. (a) ROC-AUC for dB under weight perturbations. (b) Ranking stability: top-K overlap and Kendall τ versus σ.
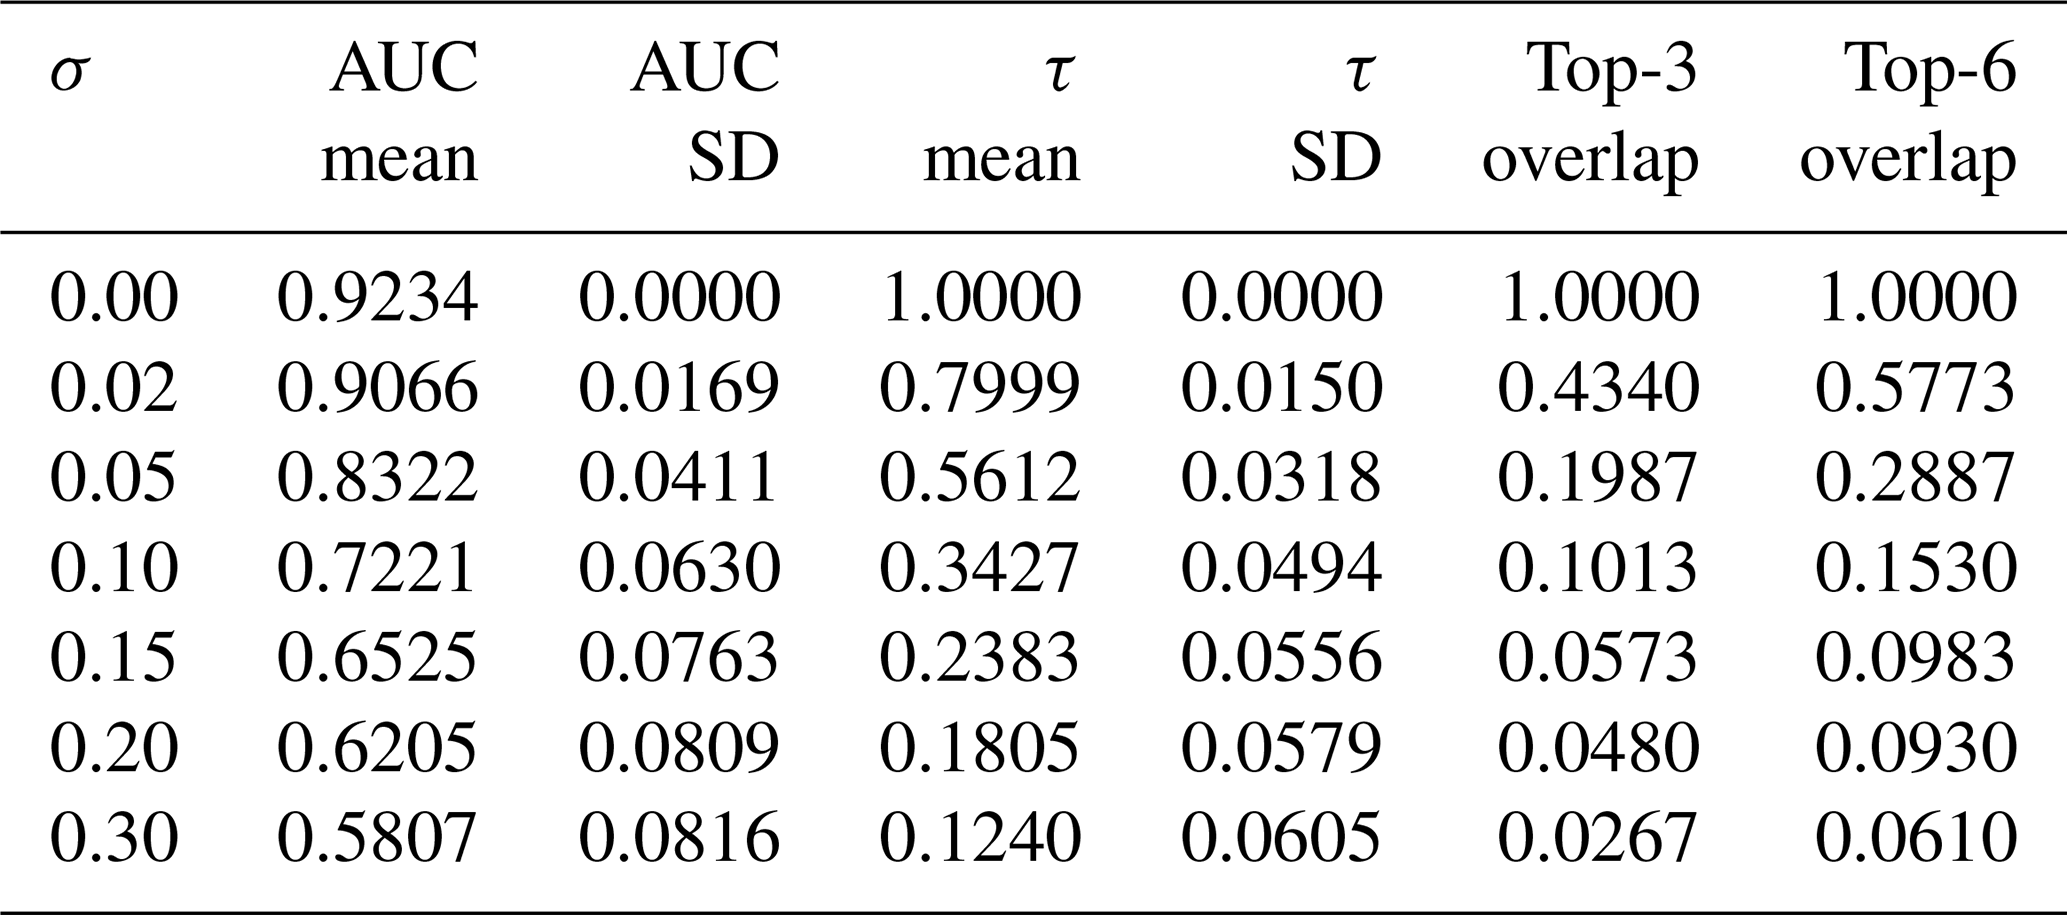
We further examine the sensitivity of this global trend to the weight vector in J. Starting from the default uniform setting ωi=1, we apply relative random perturbations with and recompute the ranking. Figure 7a shows that the detectability–prediction area under the curve (AUC) degrades gracefully with increasing σ, while Fig. 7b and Table 3 summarise shortlist and ranking stability. These results indicate that the conclusions in Fig. 6a are not driven by a finely tuned weight choice.
Table 3Performance comparison under representative weight settings (random perturbations around ωi=1).
In summary, J is not only physically interpretable; it is operationally predictive and remains stable under moderate weight perturbations. Ranking candidate tone pairs by J and keeping the lowest few provide a reliable shortlist of f+ without exhaustive brute-force scanning. This motivates the deployment-oriented analysis in Sect. 4.2.
4.2 Detection reliability vs. shortlist size N
The analysis in Sect. 4.1 shows that low-J tone pairs are, on average, measurably better. A practical question remains: how many of these low-J pairs must actually be transmitted and acquired in order to achieve a reliable detection on a given path and crack state? This is the key question for field deployment because each additional tone pair costs acquisition time and, in multiplexed systems, downlink bandwidth.
To answer this, all admissible tone pairs on all paths were first ranked in ascending J. We then constructed, for N=1, 2, etc., the following detection metric:
i.e. the probability that at least one of the first N tone pairs in the J-sorted list produces a nonlinear mixed-frequency component whose gated SPI-4 SNR exceeds the detection threshold SNRth (20 dB in this study). Figure 8 plots Phit(N) against N using all paths and crack lengths as independent trials.
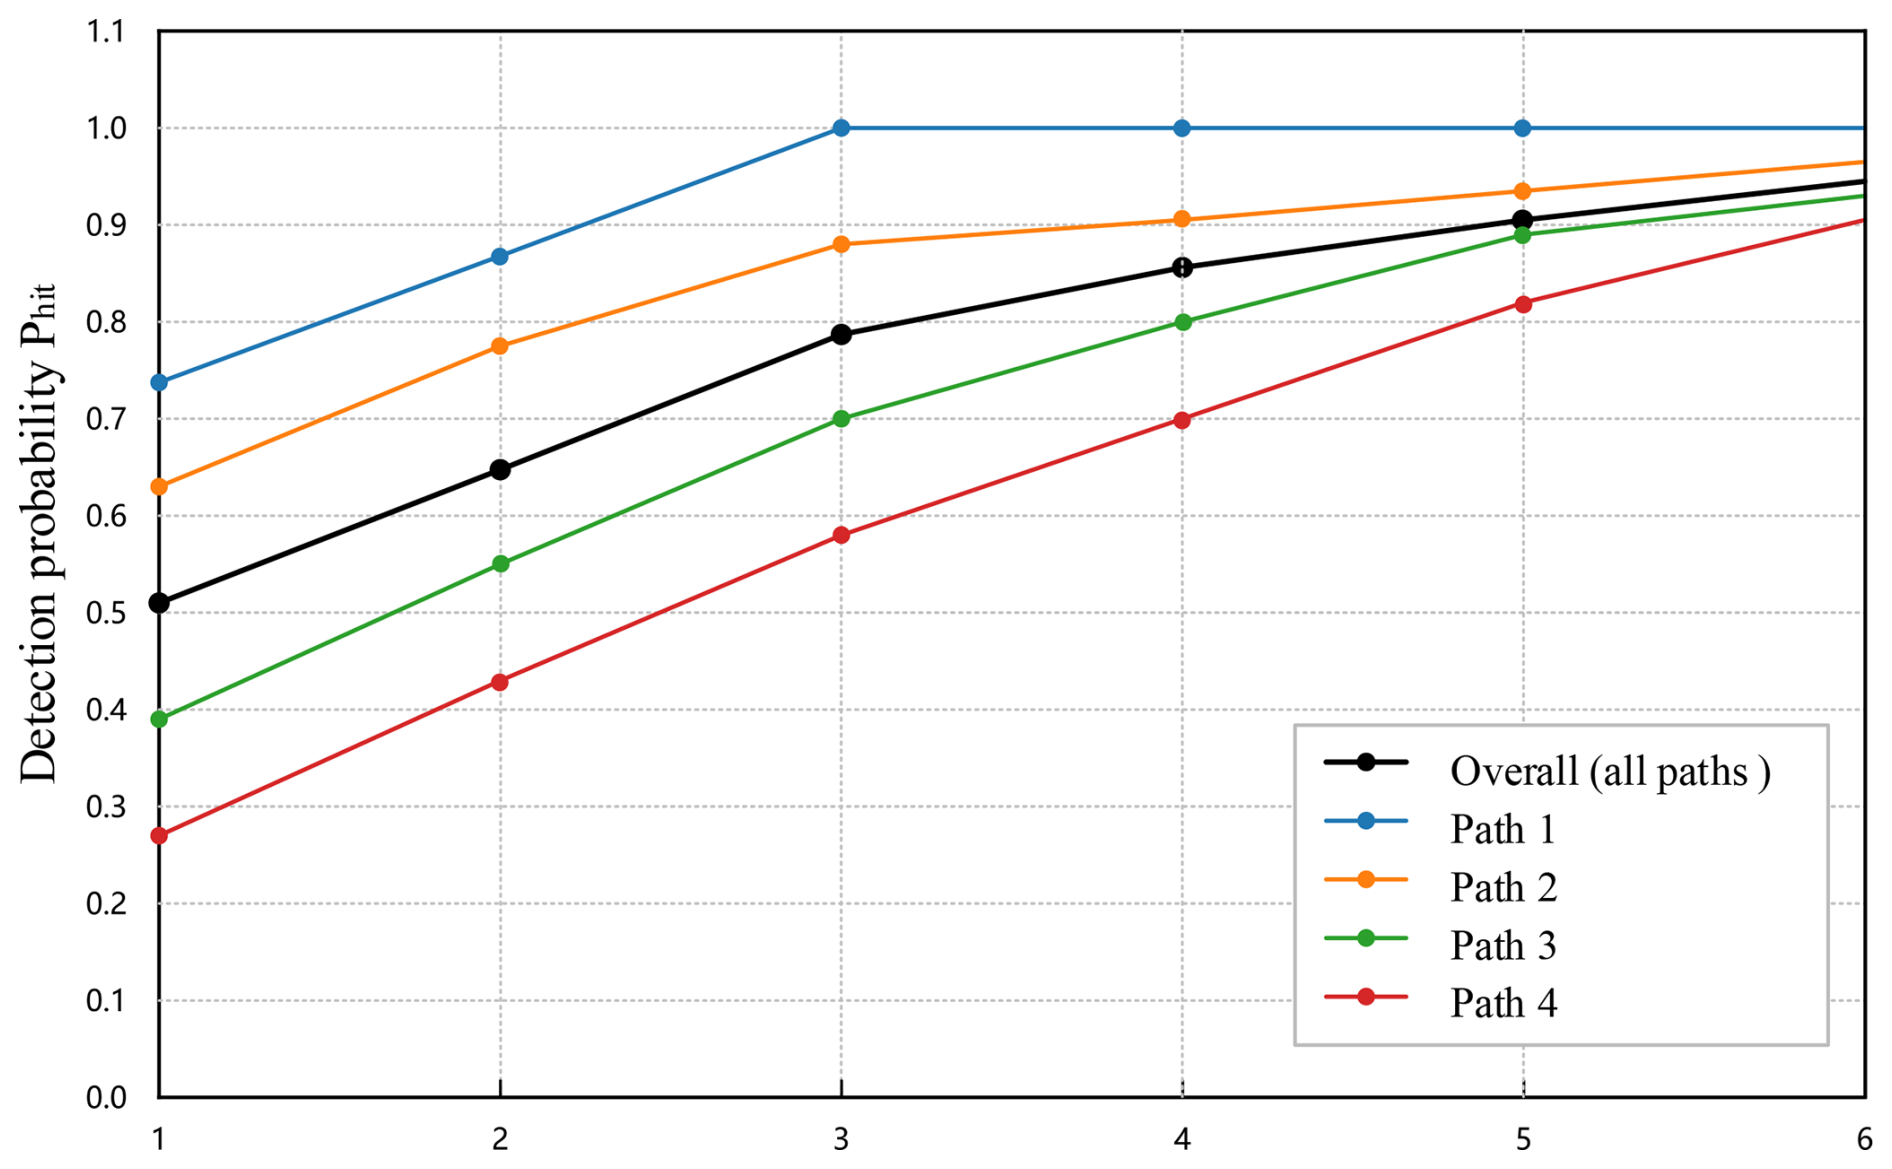
Figure 8Detection probability Phit(N) versus shortlist size N, pooled over all paths and crack states.
Three features are noteworthy. First, the curve in Fig. 8 rises steeply for small N: using only the best tone pair (N=1) already yields a non-trivial hit probability because the score places genuinely coherent, instrument-compatible pairs at the top. Second, the curve exhibits an early saturation: for this dataset, N=3–5 is sufficient to reach a plateau where adding more, progressively worse (higher-J) candidates brings only marginal benefit. Third, the saturation level remains high when trials from different paths are pooled, indicating that the ranking imposed by J is not overfitted to a single geometry.
Table 4Detection reliability versus shortlist size N (candidates ordered by increasing J), reported per path.
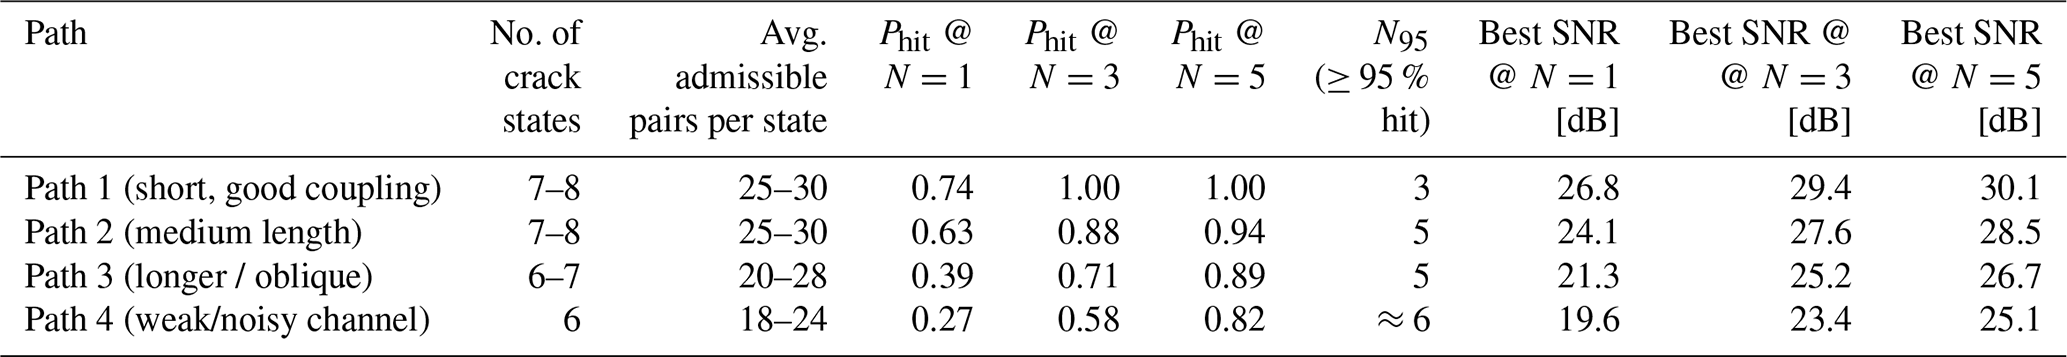
Table 4 reports the same analysis per path. Paths with longer propagation or slightly poorer coupling naturally start from a lower Phit(1), but all of them converge to high reliability once three to five of the lowest-J pairs are exercised. This path-by-path view is important for operators: it shows that a fixed shortlist size can be prescribed a priori (e.g. “always fire top 4”) without re-tuning the selection strategy for each sensor line.
Overall, this experiment confirms the deployment value of the ranking score: it not only tells us which tone pairs are promising but also tells us how many we need to test to make detection robust.
4.3 Crack growth sensitivity and repeatability
To assess whether the proposed frequency selection strategy is useful for tracking rather than merely detecting cracks, we compared a low-J (shortlisted) tone pair with a medium-J (non-shortlisted) pair on the same source–receiver path and over the same sequence of crack lengths (Table 2). For each crack state we acquired 16 gated SPI-4 records under identical windowing, and we converted the mixed component at to a normalised response SNR(f+) using the noise band defined in Sect. 3.
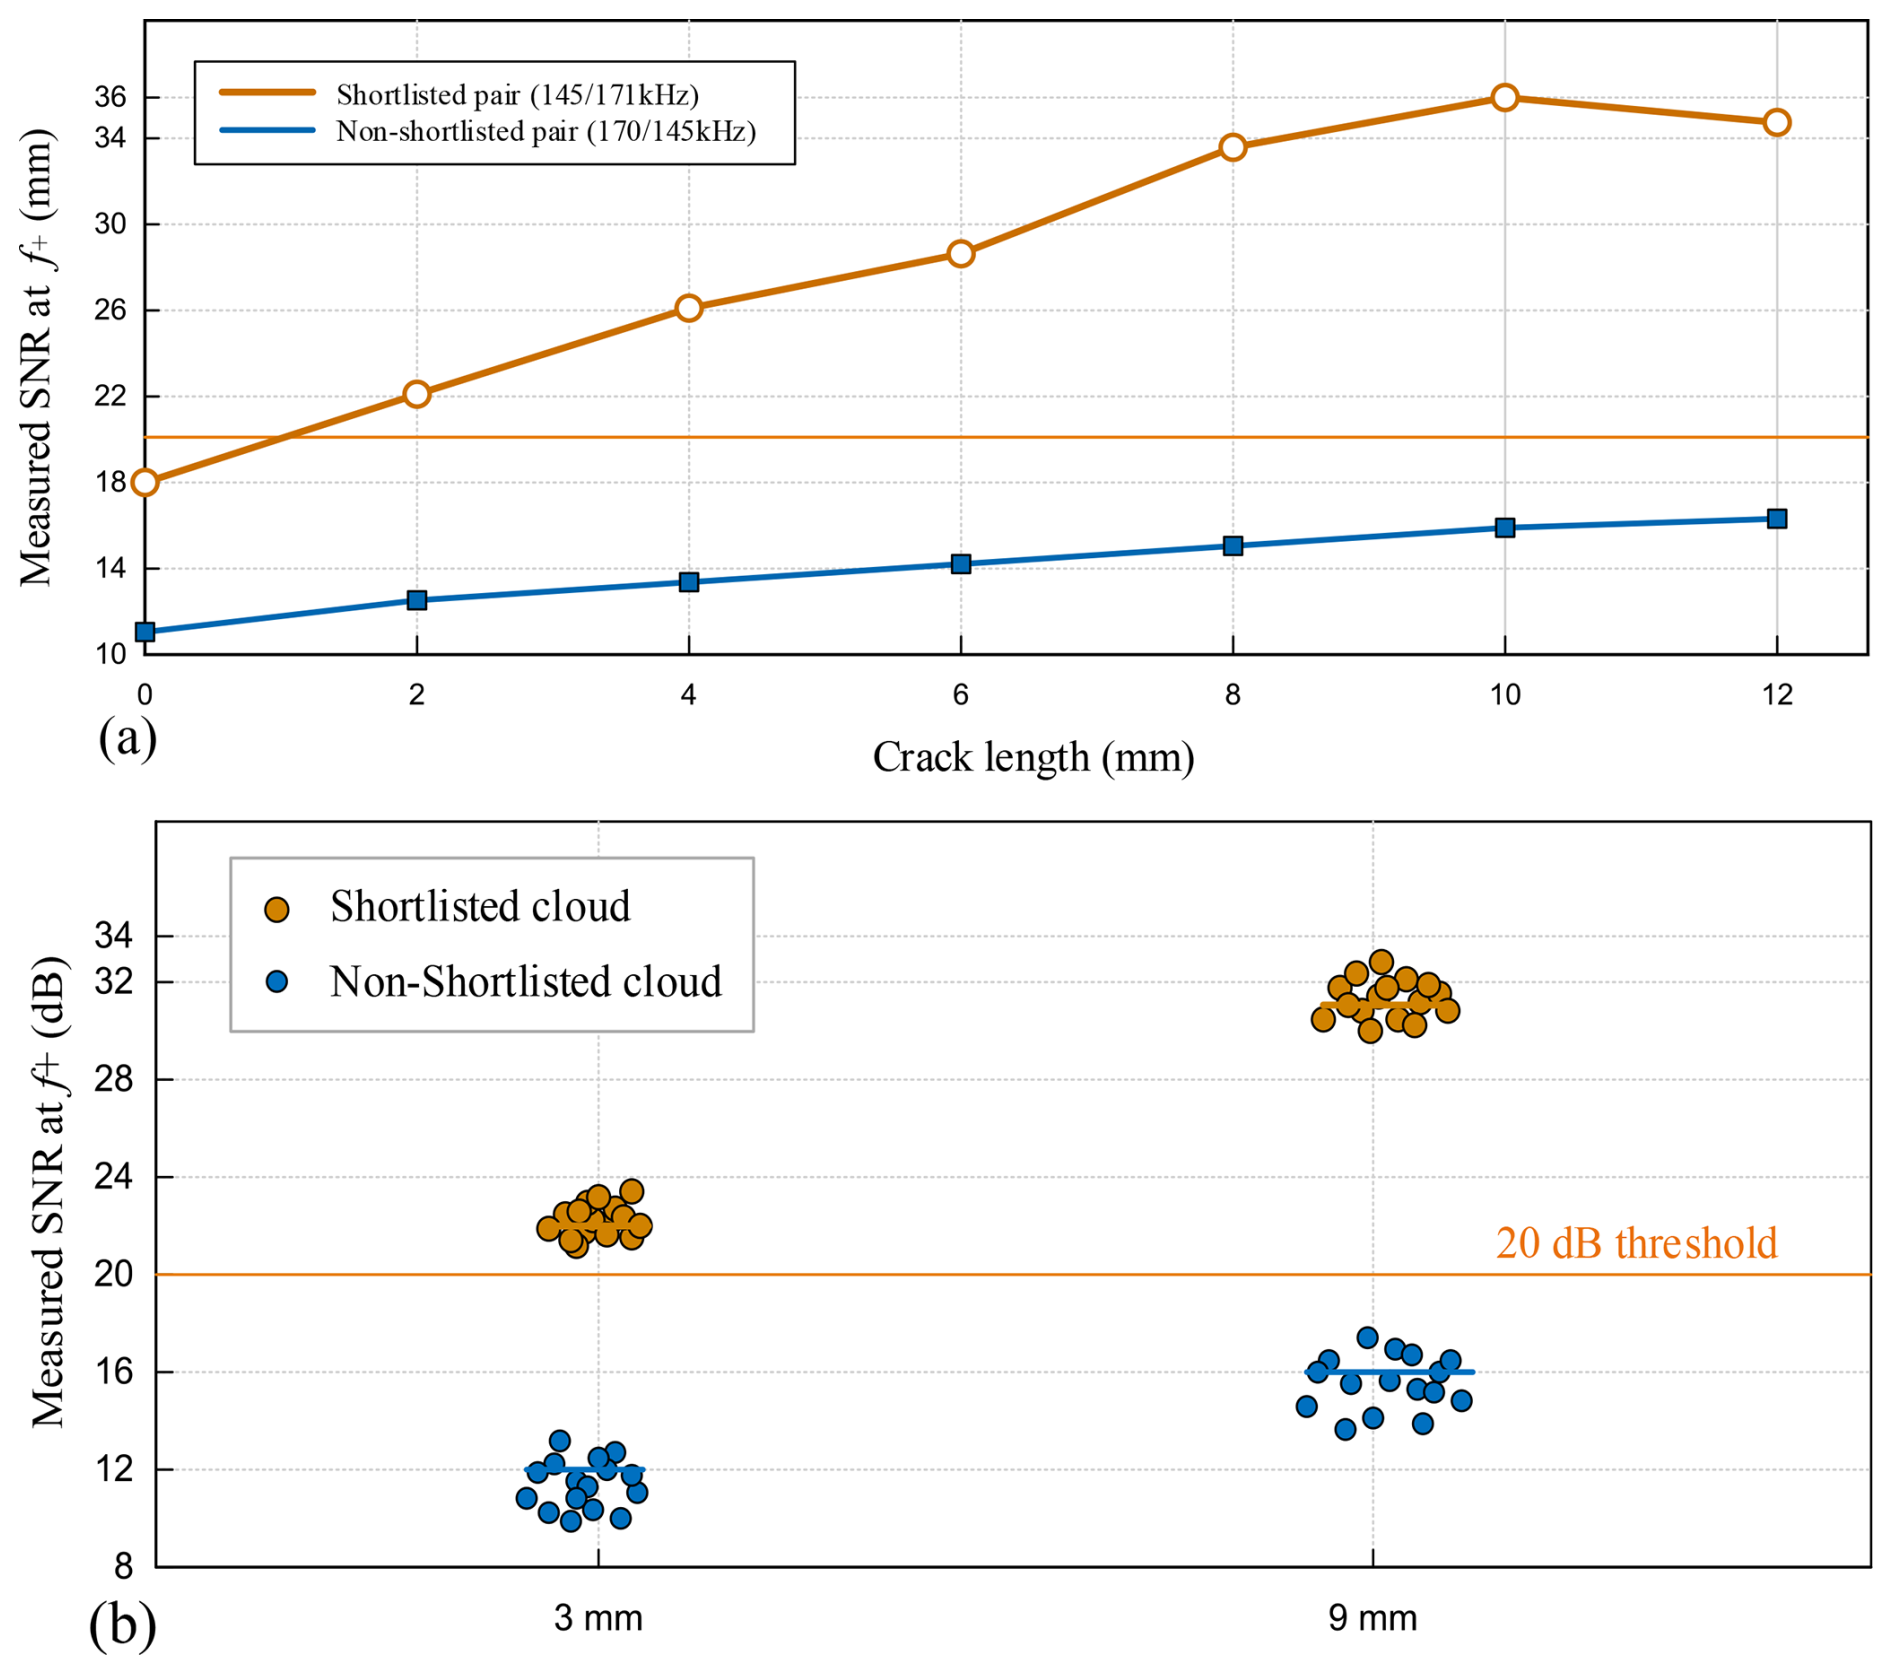
Figure 9Crack growth sensitivity and repeatability of shortlisted versus non-shortlisted tone pairs. (a) SNR(f+) versus crack length for a shortlisted (low-J) tone pair and a non-shortlisted (medium-J) pair on the same path. (b) Repeatability of SNR(f+) at two representative crack sizes (near-threshold and mid-range).
Figure 9a shows SNR(f+) versus crack length. For the shortlisted pair, the response rises monotonically and crosses the 20 dB detection line at an early crack length (typically at or one step above the second crack state). A piecewise-linear fit to the pre-saturation part of the curve gives a pooled slope of about 2–3 dB mm−1 across the inspected paths. By contrast, the non-shortlisted pair exhibits a shallower and sometimes non-monotonic trend (< 1 dB mm−1) and often hovers around the detection threshold even at the largest crack state. The practical consequence is that the ranked pair does not only “see” the nonlinearity earlier but also amplifies the contrast per millimetre of growth, which is the quantity needed for sizing or trend-based alarms.
Figure 9b summarises the 16-repeat acquisitions at two representative crack sizes (near-threshold and mid-range). For the shortlisted pair, the within-state standard deviation is ≈ 1–1.5 dB, and the coefficient of variation stays below 7 %, indicating that the amplitude scatter is much smaller than the growth-induced increment (2–3 dB mm−1). The non-shortlisted pair shows a broader spread (2–3 dB, CV 10 %–15 %), which is consistent with a response that sits closer to the noise floor and is more affected by small coupling changes. In other words, for the ranked pair, the signal change due to crack growth is larger than the measurement noise, while, for an arbitrary pair, the two are of comparable magnitude.
These results extend the conclusion of Sects. 3 and 4.1. The same low-J pairs that rank highest in detectability are also the pairs that (i) cross the detection threshold earliest, (ii) provide the steepest growth-to-response conversion, and (iii) do so with repeatability better than 2 dB under re-acquisition. This combination of early crossing, steep slope, and low scatter is what makes the selection rule usable for in-service monitoring, where operators will not be able to re-optimise tone pairs for every small crack increment.
4.4 Path-to-path robustness and practical considerations
Table 5 summarises the performance of the proposed selection scheme over all inspected S → R paths. Despite noticeable differences in path length and coupling, two features are consistent. First, the ranking generalises: for well-coupled, short paths, exciting only the top-3 lowest-J tone pairs already yields a hit probability close to 1.0; for the less favourable paths, extending the shortlist to three to five pairs restores the hit probability to above 0.8–0.9 while keeping SNR(f+) clearly above the 20 dB detection line. Second, the repeatability penalty on difficult paths is modest (only ∼1 dB larger within-state scatter than the best path), and so the growth-related increments reported in Sect. 4.3 remain observable.
Table 5Path-to-path robustness of the J-based selection rule.
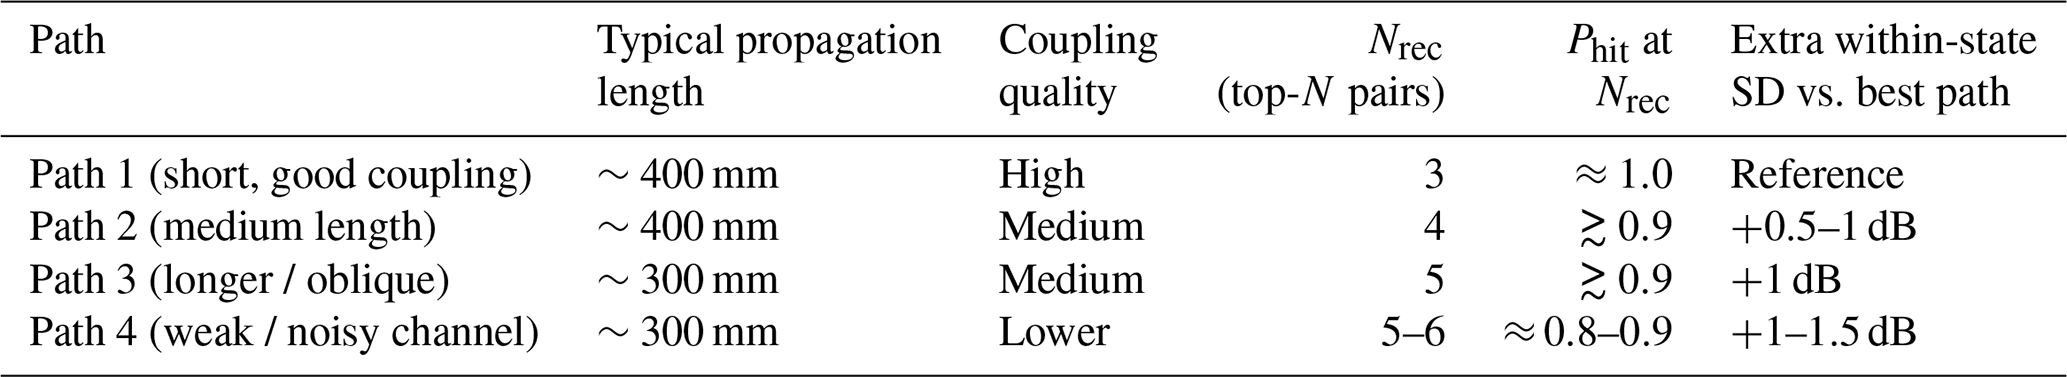
Note that Nrec is the minimum shortlist size to reach the target detection reliability (e.g. ≥ 95 %) on a path.
This cross-path consistency stems from the definition of J: the physics-driven part (phase matching, effective interaction length) keeps the preferred (fa,fb) region stable across paths, while the channel-aware part (receive band gain and dynamic-range margin) prevents obviously unusable pairs from entering the shortlist. As a result, a single system-wide policy – “fire the first three to five ranked tone pairs” – can be issued without path-specific retuning.
A practical caveat is that very long or strongly reflective paths may require a slightly larger shortlist (top 6) or a refreshed receive band estimate, but these appear as outliers in Table 5 rather than as the dominant case.
Temperature influences the ranking primarily by shifting (a) the dispersion-based terms through k(f,T) and (b) the receive chain terms through Grx(f) and available headroom. A practical deployment policy is therefore to refresh the channel terms via the short calibration sweep whenever the operating temperature changes beyond a prescribed threshold and to re-evaluate and Lint(T) using a temperature-indexed dispersion table when the expected dispersion shift is non-negligible. This preserves the interpretability of J while maintaining shortlist consistency under slowly varying environments.
The present experiments focus on surface-breaking fatigue cracks, where contact acoustic nonlinearity produces a strong mixed component. For other defect classes (internal cracks, interfacial debonding, corrosion pits), the dominant nonlinearity and the effective source strength can differ, and so the absolute SNR(f+) level and the earliest detectable size may change. However, the role of J is to pre-select tone pairs that are physically phase-coherent and practically measurable on a given path and hardware chain; these constraints remain relevant irrespective of the defect mechanism. In applications where a defect class is known a priori, mode-triplet selection and modest weight re-tuning can be used to bias the shortlist towards frequencies with higher expected nonlinear radiation efficiency for that class while retaining the same screening workflow.
This study has presented a physics-guided frequency pair selection strategy for nonlinear Lamb wave mixing that is both interpretable and deployment-oriented. By explicitly combining (i) phase matching through the wavenumber mismatch Δk and its effective interaction length Lint, (ii) channel-aware receive sensitivity via Grx(f), and (iii) a pragmatic dynamic-range penalty that reflects leakage and front-end limits, we defined a composite score J that ranks candidate tone pairs prior to data acquisition. Coupled with a compact three-step workflow and a same-spectrum SPI-4 readout, the approach yields a shortlist (top K) of tone pairs with consistently higher detectability at the sum frequency f+.
Experiments on plate-like specimens with surface-breaking cracks substantiate three main conclusions. First, J exhibits a robust global correlation with detectability (Sect. 4.1): lower J systematically predicts higher measured SNR(f+) and higher hit probability across paths. Second, when viewed from a deployment perspective (Sect. 4.2), detection reliability grows monotonically with shortlist size; in our setting, a top-3 shortlist already secures high detection rates, while a top-4 provides additional margins under coupling and gain variations. Third, shortlisted pairs show stronger crack growth sensitivity and tighter repeatability than non-shortlisted baselines (Sect. 4.3): SNR(f+) increases nearly linearly with crack length within the studied range, and within-state standard deviations remain ≲ 1–1.5 dB for shortlisted pairs compared with substantially larger spreads for non-shortlisted choices. Together, these results indicate that the proposed selection procedure does not merely identify usable tones; it systematically steers the experiment towards tone pairs that are measurably more sensitive and more stable.
From a practical standpoint, the method remains transparent at each stage: Δk and Lint bound the physical coherence length over which mixing can accumulate, Grx encapsulates instrument response, and the dynamic-range penalty guards against saturation and spurious leakage. This separation of roles helps diagnose failure modes and facilitates transfer to new hardware platforms or path geometries with minimal re-tuning. The SPI-4 same-spectrum readout further suppresses linear leakage and keeps the acquisition recipe compact and repeatable.
Several limitations suggest avenues for further work. The present validation used a limited set of paths, a single plate thickness, and controlled cracks; extensions to stiffened plates, curved shells, coatings and/or adhesives, and anisotropic laminates are required to probe generality. Future work will extend the validation to representative non-crack defects (e.g. interfacial debonding and corrosion) to quantify how defect-class-dependent nonlinear source strength affects the detection threshold under the same J-guided shortlisting.
Temperature, load, and moisture effects – known to perturb dispersion and front-end gain – call for built-in compensation (for example, opportunistic re-sweeps for Grx, temperature-aware k(f,T) tables, or co-located monitoring channels). Future work will quantify shortlist stability over representative SHM temperature ranges using temperature-indexed dispersion tables k(f,T) and periodic channel re-calibration.
While equal weights in J offer a strong default, data-driven refinement (e.g. logistic calibration or Bayesian optimisation of the weights) could further improve screening under site-specific constraints. On the physics side, a tighter linkage between J and contact-acoustic nonlinearity models may enable semi-quantitative crack sizing with uncertainty bounds. On the systems side, integrating the selection with imaging and/or beam-forming, multi-path fusion, and on-edge execution (embedded shortlist computation and SPI-4 playback) would reduce operator burden and enhance robustness. Finally, establishing absolute calibration (traceable reference tones, amplitude linearity checks) and formal uncertainty quantification across repetitions, paths, and units will be essential for qualification in safety-critical settings.
In summary, a modest amount of physics, a modest amount of channel awareness, and a simple score J suffice to make nonlinear mixing experiments predictably effective. We expect the proposed workflow to translate readily to other guided-wave configurations and to serve as a foundation for autonomous, self-adapting ultrasonic SHM in the field.
The data supporting the findings of this study are not publicly available due to confidentiality and institutional restrictions related to ongoing research projects. However, the data may be made available by the corresponding author upon reasonable request and with permission from the relevant parties. The code used for data processing and analysis is available from the corresponding author upon reasonable request.
TY: conceptualisation, methodology, software, investigation, formal analysis, visualisation, writing (original draft). PL: methodology, resources, validation, writing (review and editing), supervision. Both of the authors contributed equally to this work and approved the final paper.
The contact author has declared that neither of the authors has any competing interests.
Publisher's note: Copernicus Publications remains neutral with regard to jurisdictional claims made in the text, published maps, institutional affiliations, or any other geographical representation in this paper. The authors bear the ultimate responsibility for providing appropriate place names. Views expressed in the text are those of the authors and do not necessarily reflect the views of the publisher.
The authors thank the editor and the reviewers for their constructive comments.
This research has been supported by the Natural Science Foundation of Zhejiang Province (grant no. LTGG24F030001).
This paper was edited by Liangliang Cheng and reviewed by Qasim Atiyah and one anonymous referee.
Abuassal, A., Kang, L., Martinho, L., Kubrusly, A., Dixon, S., Smart, E., Ma, H., and Sanders, D.: A review of recent advances in unidirectional ultrasonic guided wave techniques for nondestructive testing and evaluation, Sensors, 25, 1050, https://doi.org/10.3390/s25041050, 2025. a
Aslam, M. and Lee, J.: Nonlinear guided wave mixing in weld joints for detection of material nonlinearity, Thin-Walled Structures, 205, 112428, https://doi.org/10.1016/j.tws.2024.112428, 2024. a
Cawley, P.: Guided waves in long range nondestructive testing and structural health monitoring: Principles, history of applications and prospects, NDT & E International, 142, 103026, https://doi.org/10.1016/j.ndteint.2023.103026, 2024. a
Gao, G., Li, D., Shi, D., and Dong, J.: Detection on fatigue crack of aluminum alloy plate based on modulation nonlinear Lamb waves and time reversal method, Procedia Engineering, 29, 1373–1377, https://doi.org/10.1016/j.proeng.2012.01.143, 2012. a
Ghodousi, M. and Lissenden, C.: Lamb-like wave mixing in aluminum plate to assess material degradation, in: Proc. SPIE Smart Structures + Nondestructive Evaluation, vol. 13437, SPIE, Bellingham, WA, https://doi.org/10.1117/12.3051590, 2025. a
Giannakeas, I. N., Khodaei, Z. S., and Aliabadi, M. H.: An up-scaling temperature compensation framework for guided wave-based structural health monitoring in large composite structures, Structural Health Monitoring, 22, 777–798, https://doi.org/10.1177/14759217221095415, 2023. a
Hu, C., Gao, H., Tong, F., and Zhao, W.: Crack detection of turnout straight switch rail bottom based on nonlinear ultrasonic frequency mixing technology, Urban Rail Transit, 11, 267–278, https://doi.org/10.1007/s40864-025-00250-y, 2025. a
Ishii, Y., Enoki, T., and Biwa, S.: Non-collinear interaction of Rayleigh–Lamb and shear horizontal waves in a finite region in a plate, Wave Motion, 134, 103488, https://doi.org/10.1016/j.wavemoti.2024.103488, 2025. a
Jiang, C., Li, W., and Deng, M.: Systematic investigations on frequency mixing response of ultrasonic shear horizontal and Rayleigh Lamb waves, Journal of Vibration and Control, 31, 271–283, https://doi.org/10.1177/10775463231196185, 2025. a, b
Jiao, J., Li, L., Gao, X., Cheng, Q., He, C., and Wu, B.: Application of nonlinear Lamb wave mixing method for residual stress measurement in metal plate, Chinese Journal of Mechanical Engineering, 36, 12, https://doi.org/10.1186/s10033-023-00832-6, 2023. a, b
Li, F., Zhao, Y., Cao, P., and Hu, N.: Mixing of ultrasonic Lamb waves in thin plates with quadratic nonlinearity, Ultrasonics, 87, 33–43, https://doi.org/10.1016/j.ultras.2018.02.005, 2018a. a, b
Li, W., Hu, S., and Deng, M.: Combination of phase matching and phase-reversal approaches for thermal damage assessment by second harmonic Lamb waves, Materials, 11, 1961, https://doi.org/10.3390/ma11101961, 2018b. a
Liang, H., Liu, Y., Chen, J., Yuan, S., Giglio, M., and Sbarufatti, C.: An advanced nonlinear framework for early detection and prognosis of fatigue cracks in plate-like structures, Mechanical Systems and Signal Processing, 230, 112632, https://doi.org/10.1016/j.ymssp.2025.112632, 2025. a, b
Luo, K., Li, C., Zhang, H., and Zhang, Y.: Baseline-free multimodal damage detection framework for composite plate-like structures using Mamba with guided waves, Measurement, 257, 118958, https://doi.org/10.1016/j.measurement.2025.118958, 2026. a, b
Mardanshahi, A., Sreekumar, A., Yang, X., Barman, S. K., and Chronopoulos, D.: Sensing techniques for structural health monitoring: A state-of-the-art review on performance criteria and new-generation technologies, Sensors, 25, 1424, https://doi.org/10.3390/s25051424, 2025. a
Niu, X., Zhu, L., Yang, W., Yu, Z., and Shen, H.: Temperature Effects on Nonlinear Ultrasonic Guided Waves, Materials, 16, 3548, https://doi.org/10.3390/ma16093548, 2023. a
Pan, Y., Sharif Khodaei, Z., and Aliabadi, M. H.: Baseline-free detection of progressive fatigue damage using nonlinear ultrasonic guided waves, Fatigue of Aircraft Structures, 2024, 119–130, https://doi.org/10.2478/fas-2024-0009, 2025. a, b
Park, J., Choi, J., and Lee, J.: A feasibility study for a nonlinear guided wave mixing technique, Applied Sciences, 11, 6569, https://doi.org/10.3390/app11146569, 2021. a
Pineda Allen, J. C. and Ng, C. T.: Mixing of non-collinear Lamb wave pulses in plates with material nonlinearity, Sensors, 23, 716, https://doi.org/10.3390/s23020716, 2023. a
Shen, Y., Tian, Y., Xu, H., and Fu, H.: Metamaterial-controlled nonlinear ultrasonic guided waves for structural health monitoring, in: Proc. SPIE Smart Structures + Nondestructive Evaluation, vol. 13437, SPIE, Bellingham, WA, https://doi.org/10.1117/12.3051051, 2025. a
Sun, M., Xiang, Y., Shen, W., Liu, H., Xiao, B., Zhang, Y., and Deng, M.: Evaluation of plastic deformation considering the phase-mismatching phenomenon of nonlinear Lamb wave mixing, Materials, 16, 2039, https://doi.org/10.3390/ma16052039, 2023. a, b
Wu, C., Wei, Q., Wei, Z., Shen, C., Hu, M., and Song, J.: Fatigue damage detection in welded joints using a sideband peak intensity-based nonlinear ultrasonic frequency mixing, Nondestructive Testing and Evaluation, 1–21, https://doi.org/10.1080/10589759.2025.2502149, 2025. a
Wu, W.-C. and Yin, C.-C.: Nonlinear ultrasonic characterization of joint structures using backscatter guided waves, Journal of Mechanics, 39, 245–260, https://doi.org/10.1093/jom/ufad022, 2023. a
Xu, H., Liu, L., Li, X., Xiang, Y., and Xuan, F.-Z.: Wavefield imaging of nonlinear ultrasonic Lamb waves for visualizing fatigue micro-cracks, Ultrasonics, 138, 107214, https://doi.org/10.1016/j.ultras.2023.107214, 2024. a
Yin, J., Wei, Q., Zhu, L., and Han, M.: Nonlinear frequency mixing of Lamb wave for detecting randomly distributed microcracks in thin plates, Wave Motion, 99, 102663, https://doi.org/10.1016/j.wavemoti.2020.102663, 2020. a
Zhang, S., Liu, Y., and Yuan, S.: Enhanced fatigue crack detection in complex structure with large cutout using nonlinear Lamb wave, Sensors, 24, 6872, https://doi.org/10.3390/s24216872, 2024. a
Zhu, H., Ng, C. T., and Kotousov, A.: Low-frequency Lamb wave mixing for fatigue damage evaluation using phase-reversal approach, Ultrasonics, 124, 106768, https://doi.org/10.1016/j.ultras.2022.106768, 2022. a