the Creative Commons Attribution 4.0 License.
the Creative Commons Attribution 4.0 License.
 | 25 Oct 2023
Experimental study on fingertip friction perception characteristics on ridged surfaces
Liyong Wang
Li Yang
Le Li
Jianpeng Wu
Qian Zou
Fingertip friction perception characteristics have not formed a clear and complete theory, owing to the low repeatability and accuracy of related experiments. Given this, a novel experimental method is proposed based on ridged surfaces for investigating the fingertip friction perception characteristics. In this method, based on the Universal Mechanical Tester (UMT) TriboLab, the proposed experiment makes subjects touch ridged surfaces under different ridge sizes and lubrication conditions, aiming to obtain fingertip friction and subject judgment. Subsequently, the average friction force fluctuation degree and the tactile perception accuracy are calculated to analyze the friction characteristics. For this, the relationship between friction and perception characteristics is discussed further. The results show that the adhesive and the deformation friction forces, which mainly consist of the total friction force under incomplete contact conditions, decrease due to the lubricating oil. However, the adhesive friction force increases slightly as the ridge widens. In addition, when the ridge spacing is raised, the deformation friction force increases and becomes the dominant component, while the adhesive friction force is the opposite. While analyzing the friction characteristics, it is found that the tactile perception accuracy is enhanced by raising the average friction force fluctuation. Moreover, the tactile perception accuracy can be improved by changing the surface texture and lubrication conditions, due to the changes in fingertip friction characteristics.
- Article
(2193 KB) - Full-text XML
- BibTeX
- EndNote


In the process of tactile perception, the frictional vibration between the skin and the contact surface gives mechanical stimulation to the tactile receptor in the skin and converts it into a neural potential signal to the cerebral cortex, which ultimately enables humans to make tactile feedback and judgment (Jeremy et al., 2018). Therefore, frictional vibration is the “exciter” of tactile sensation and plays a key role in the process of tactile perception (Tang et al., 2020). Compared with vision and hearing, people's perception of touch is still very limited because the factors affecting touch perception are complex and changeable (Capace et al., 2021). In the touch process, fingers will produce friction signals, vibration signals, skin deformation, and other variables to help the body identify the details of the object (Logozzo et al., 2021). Studying the generation of these variables in finger sliding touch and their influence on tactile perception from the perspective of tribology is conducive to further understanding the mechanism of tactile perception and improving human cognition of their tactile system (Hou et al., 2021; Alam et al., 2021; Bok et al., 2021). However, from the perspective of biomechanics, the skin of the finger has a complex physiological structure and mechanical properties, and there are many factors affecting the contact friction of the finger, which leads to poor stability and reliability of the finger tribological test.
The tactile texture of material is the sensory impression formed on the surface of human skin contact material (Johnson and Hsiao, 1992). At present, the research on friction tactile perception is mostly carried out for specific materials such as sandpaper, fabric, and glass. The surface morphology characteristics of materials are mainly characterized by surface roughness (Vastano et al., 2016). For example, to discuss the relationship between the sliding speed, the vibration acceleration, and the effects of the stick–slip phenomenon on perception, Zhou and Jin (2015) make subjects identify the surface roughness by sliding their fingers on sandpaper. By analyzing the tactile sensing vibration signals and friction signals of 38 different types of materials, Tang et al. (2015) extracted eight tactile sensing characterization parameters in three categories: perceived fineness, perceived roughness, and perceived smoothness. Chimata and Schwartz (2018) use sandpaper with different grinding particle sizes to explore how contact surface area reduction affects friction perception accuracy. However, the surface morphology of the material is composed of the width, height, shape, and density of the texture (Bergmann Tiest, 2010). Surface roughness is a comprehensive characterization parameter of these texture features, and it often appears that the surface roughness is the same but the texture features are different.
Therefore, it is not enough to study the formation mechanism of human tactile texture on the surface of the material. It is necessary to refine the texture features of the material surface and carry out systematic research on the influence of texture feature parameters on tactile perception (Cesini et al., 2018). Some scholars have carried out related research on the influence of texture size features on tactile sensation. and Saal (2015) make subjects perceive surface texture features through friction, aiming to identify different types of textures and eventually explaining why the actual roughness of samples is different from the roughness perceived by subjects. Liu and Zhang (2020) combine the mechanical friction method and psychophysical research method to initially reveal the influence of texture height on friction perception. It is found that skin friction perception mainly depends on the lag and interlocking effects, which are directly related to skin deformation. However, since only three male subjects participated in the perception tests, the conclusions are not persuasive enough. Texture size is one of the important characteristics of material surface morphology and an important characteristic parameter affecting tactile sensation (So et al., 2020). At present, there are few reports on the relationship between texture size characteristics and tactile sensation. The accuracy of the test method remains to be further improved, and there are few studies that combine the “feeling” of the skin with the subjective “evaluation”.
Even though the above studies have clarified the friction perception characteristics of fingertip skin from experimental and theoretical aspects, due to the random texture of touched samples and the imperfection of the test method, the fingertip exploration actions are easily interfered with by human factors; thus the reliability and repeatability of the experimental results are so low. In view of these problems, this study proposes a test method for fingertip friction perception characteristics on ridged surfaces. Firstly, flat plates with ridges are used as touch samples to explore the influence of texture size on friction perception by controlling the size and distribution of ridges. Then, based on the Universal Mechanical Tester (UMT) TriboLab, the finger fixture and test process are designed to minimize the interference of human factors. In addition, the subject's judgments on the ridge number are employed to calculate the tactile perception accuracy. Subsequently, the friction characteristics of the fingertip and the relationship between friction characteristics and tactile perception accuracy are analyzed through experimental and theoretical results.
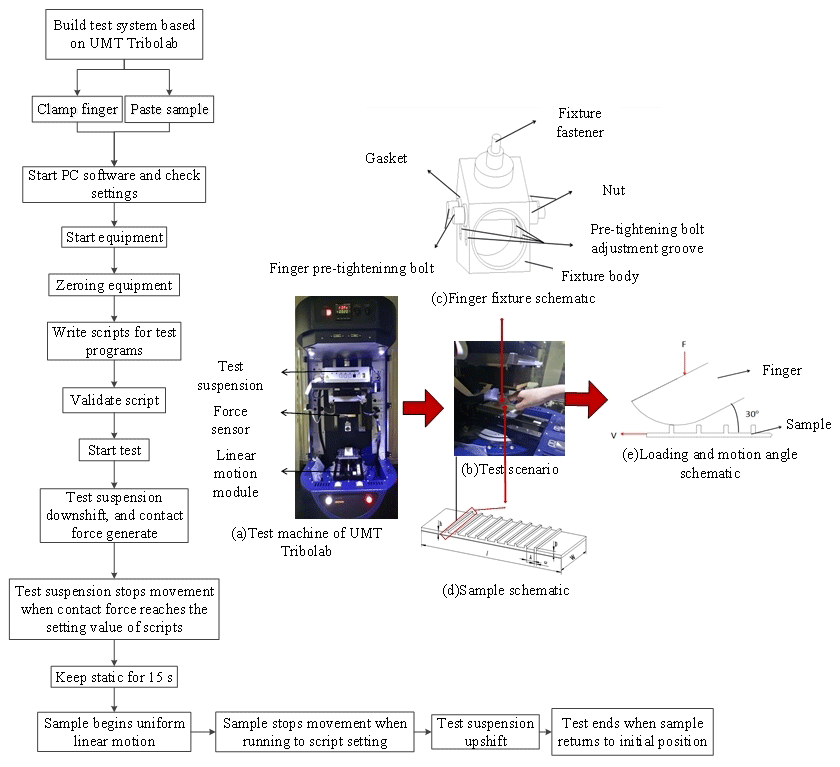
Figure 1Experimental process.
2.1 Experimental apparatus
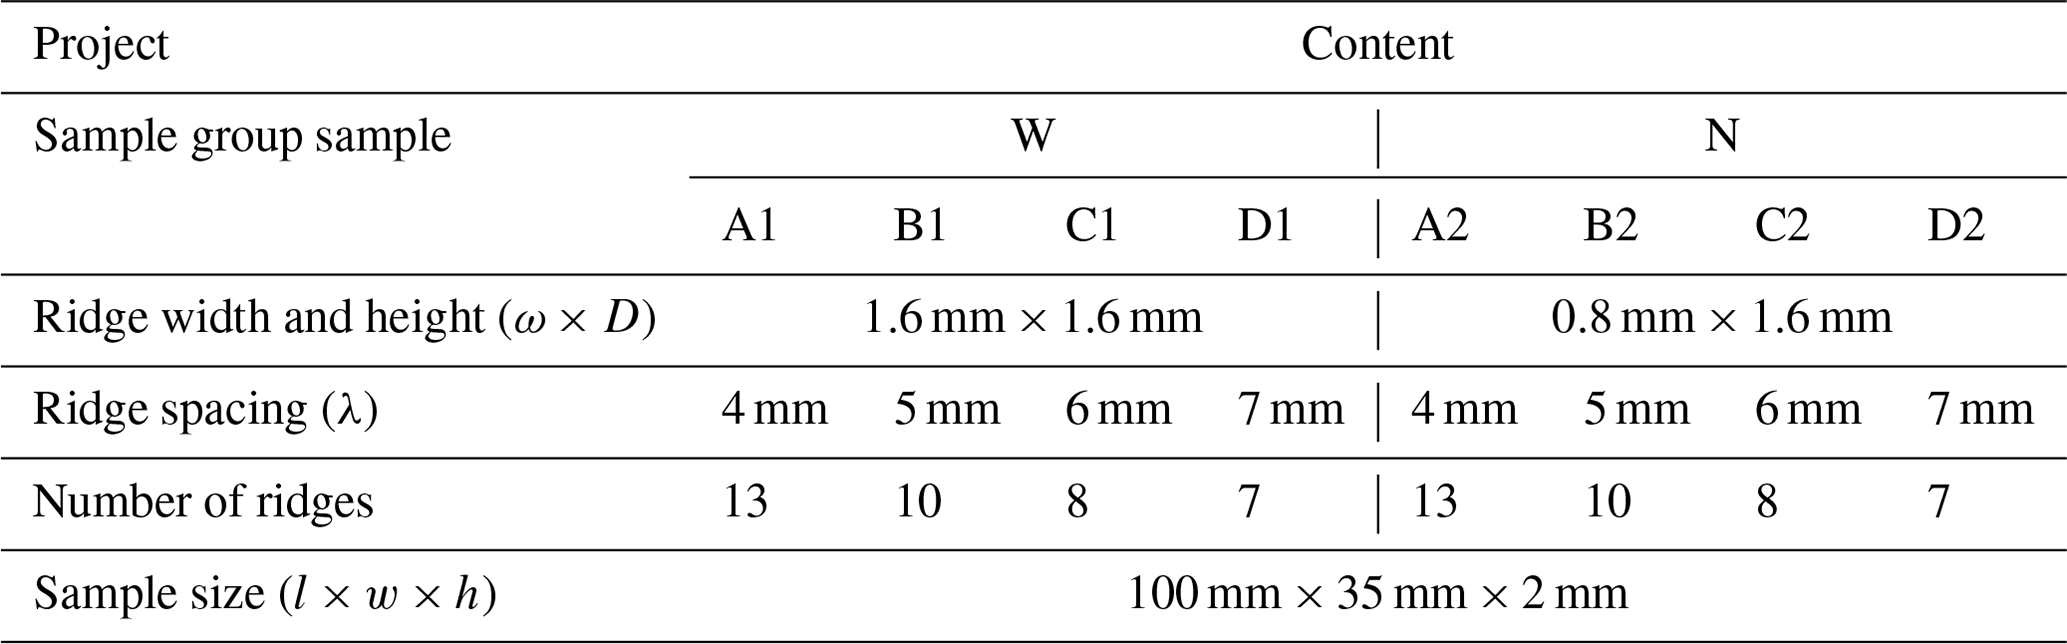
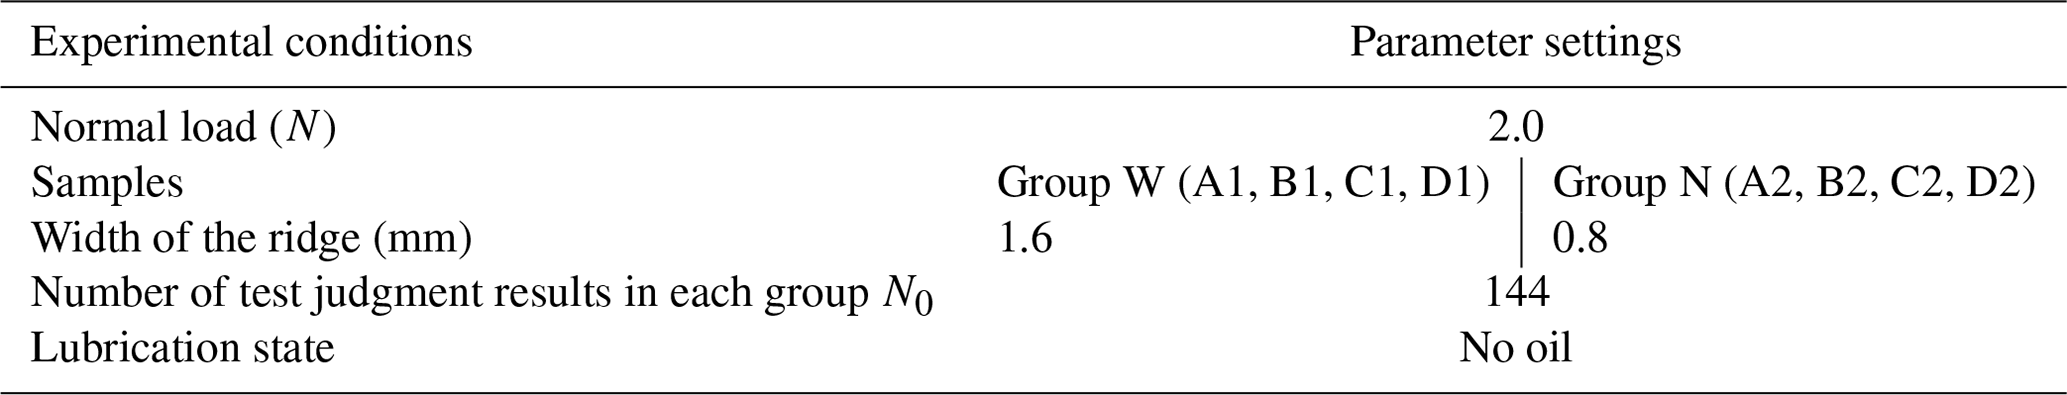
In this study, the experimental system is built based on the UMT TriboLab testing machine, as shown in Fig. 1a, which can ensure that the subjects perceive the samples under constant load and speed. As shown in Fig. 1d, the samples are resin plates with rectangular cross-section ridges evenly distributed on the surface. The surface roughness, Ra, of samples is about 0.04 µm after grinding and polishing. Table 1 exhibits the sample information. The ridge width ω in group W is twice that in group N. The fixture shown in Fig. 1c is designed to fix the right-handed index finger and further keep an angle of 30∘ between the finger and the sample surface, making the joint connect the distal knuckle and the second knuckle of the finger between the two pre-tightening bolts. The lower surface of the fingertip should be close to the lower surface of the through hole. And the pre-tightening bolts on both sides of the fixture can move up and down in the adjustment groove to limit the warping of the fingertip. The experimental process is that the fingertip is loaded by the suspension movement controlled by the upper computer, and the sample on the loading platform is driven by the linear motion module to move away from the subject along the linear guide rail. The three-dimensional force sensor (DFM-1.0) in Fig. 1a with the measurement range of 10 N is used to measure the friction force and pressure of the contact surface, which will be recorded through the computer data acquisition system. In the end, the number of ridges with a rectangular cross-section (Fig. 1b) will be reported by the subjects and further used as the tactile perception result. The finger and the three-dimensional force sensor are rigidly connected through the finger fixture. The upper computer software controls the test suspension to move down so that the finger is under pressure. So, the force sensor can feedback the pressure and friction of the finger to the upper computer software.
2.2 Experimental scheme
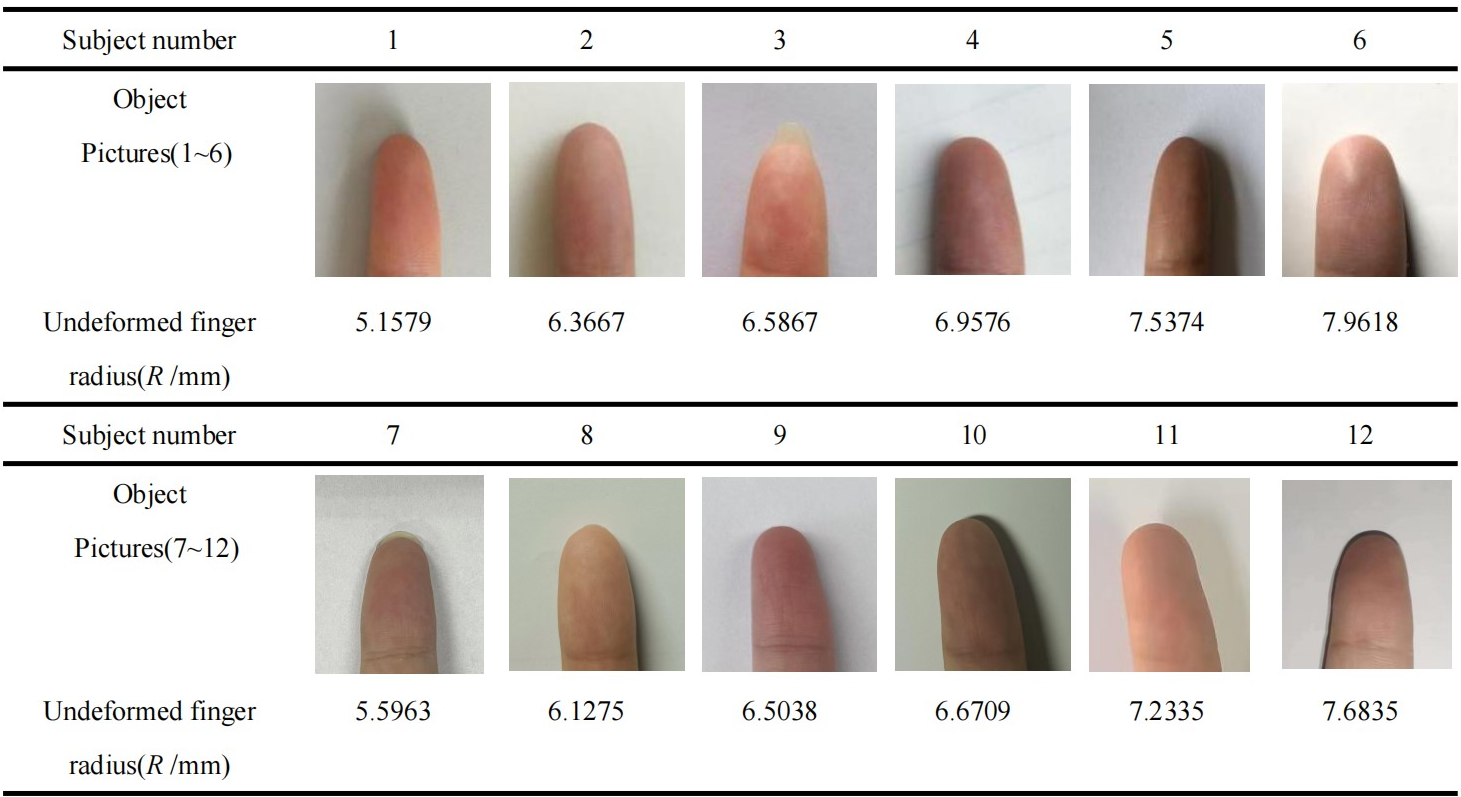
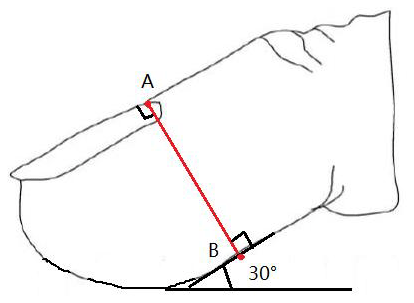
Human fingers are composed of nails, dermis, subcutaneous tissue, finger bone, and epidermis. Due to the complex and changeable physiological structure of fingers, the perception ability is closely related to the age, gender, and occupation of the subjects (Li and Zhan, 2015). Regarding the influence of individual differences on the experimental results, 12 healthy graduate students aged 24–26 years (6 males and 6 females) are selected as the subjects in this study, and their right-hand index fingers are used as the research objects. Due to the influence of fingertip radius on friction characteristics, the study proposes a method to estimate the undeformed fingertip radius. As shown in Fig. 2, point A and point B of the fingertip are found, and the fingertip section passing through these two points is compared to a circle. The circumference is measured, and the radius is calculated as the radius of the undeformed fingertip. Table 2 shows the distal fingertip radius of 12 undeformed fingers. Moreover, the experiment requires an undamaged fingertip surface and consistent environment humidity. According to the previous research results, the skin surface topological structure can cause individual differences in tactile perception, which will not be discussed in detail in this study. Because the ridge size of the samples is much larger than the fingerprint size, the texture of the contact surface will not mesh with each other. In addition, during relative sliding between the fingertip skin and the sample surface, the skin surface morphology is different from that without deformation. Hence, it is difficult to monitor the skin surface morphology in real time during sliding. It is also difficult to use the topological structure of the fingertip skin as a single experimental variable to obtain the change rule of the corresponding experimental results. However, the influence of fingertip skin surface morphology on tactile perception is real and unavoidable, which will be considered in further study.
As shown in Fig. 1e, the experiment adopts the unidirectional sliding mode and the normal constant loading mode of the UMT TriboLab testing machine, whose subsystems including the driving device, environmental controller, programming test system, real-time monitoring, and control system are monitored and controlled by its PC software. Static loading is the first stage of the experiment: the upper computer controls the test suspension to apply the normal load to the contact surface. At the same time, the installation force sensor on the test suspension is used to measure pressure. When the pressure reaches the set target load, the sample is driven to move uniformly for 15 s at the speed of 4 mm s−1. The pressure and friction are measured in real time and are fed back to the upper computer. When the sample slides to the set target stroke, it stops sliding, and the suspension moves up. The subjects report and record the ridge number of the sample.
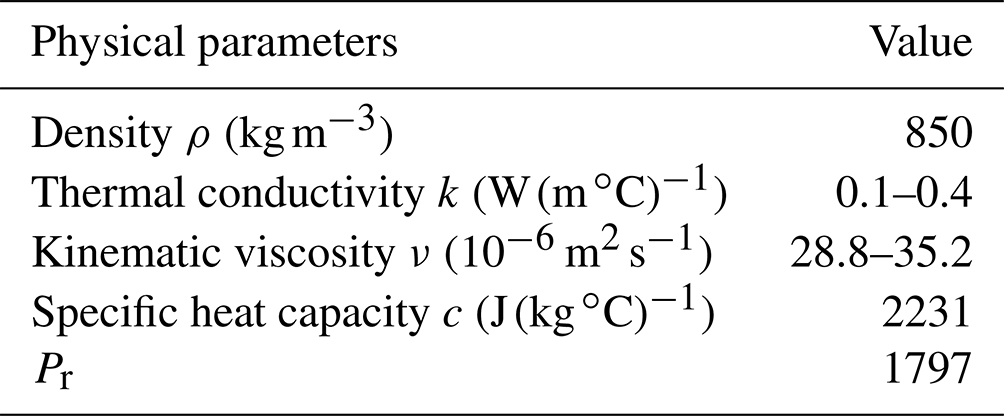
This study aims to explore the relationship between friction characteristics and tactile perception through experimental research methods. The experiment is designed with normal load, lubrication condition, ridge width, and height of the sample as variables. Through investigation, it is found that there are many kinds of media to change the contact state of fingertip skin, such as detergent, hand cream, and lubricating oil, and they all change the lubrication state by smearing quantitative media on the fingertip skin. The lubrication condition is changed by smearing different amounts of lubricating oil on the fingertip surface. The lubricant used is the advanced antiwear hydraulic oil L-AN32 with properties shown in Table 3. For the laboratory, this lubricating oil is easy to obtain, and it will not change the chemical characteristics of the skin.
The fixtures and internal fillers can strictly control the deformation and movement of the fingertip; however, there is still human interference. This paper considers that the biggest reason is that the human tissue connected to the fingertips such as the arm is not fixed. Referring to the literature (Carpenter, 2018; Johnson and Greenwood, 1985), the subjects were fully trained in the experimental preparation stage to maintain a fixed posture of 15 s in the real experimental process. After the formal test, the human interference degree was analyzed according to the pressure data collected by the sensor, and the effectiveness of the experiment was further judged. The unqualified data are eliminated, and the subjects are required to retest. Three groups of different data (the same experiment repeated three times) from 12 different subjects are selected to reduce the experimental error. Furthermore, subjects are trained repeatedly in the pretest stage. Each subject was asked to cut their nails so short as not to touch the sample before the formal experiment. Then the subjects are asked to sit in a constant environment to maintain calm, and their fingertip skin is wiped with alcohol (Carpenter, 2018). Each subject repeated three experiments under the same experimental conditions with an interval of 15 min. The friction force of the contact surface is collected, and the judgment on the ridge number of the sample is recorded. Subjects are required to carry the eye mask and randomly touch the sample to avoid the interference of external factors (Zhou and Mo, 2018). The tactile perception accuracy in this study is a probability, which was not derived from one subject but from the statistical results of all subjects. Whether the probability is credible depends on whether the number of subjects is sufficient. By investigating the literature on subjects' participation in finger friction tests, it found that there is no relevant standard for selecting the number of subjects (Xue et al., 2018). Considering the existing conditions of the laboratory and the research situation, we decided on the number of subjects.
2.3 Data processing method
The perception results of subjects are divided into two types. The result that the ridge number perceived by subjects is consistent with the actual ridge number of the sample is called a correct judgment result. Otherwise, it is called a wrong judgment result. Since one experiment of one subject corresponds to one judgment result, and one experiment will be repeated three times, there are 36 judgment results for the 12 subjects. In this study, the number of correct judgment results is denoted as N, and the total number of judgment results is denoted as N0. The calculation formula of the subject tactile perception accuracy r is as follows:
As shown, the subject tactile perception accuracy r will be higher when the number of correct judgment results N is closer to the total number of judgment results N0.
Due to the ridges on the sample surface, the fingertip skin passes through repeated cycles of peak–valley–peak successively, which makes its deformation fluctuate periodically. The deformation will be captured by mechanoreceptors inside the fingertip and converted into the action potential, which is then transmitted to the cerebral cortex through the nervous system (Ayane et al., 2021). In this way, subjects can perceive the number of ridges. Hence, the skin deformation fluctuation of the fingertip is regarded as the main factor affecting the subject tactile perception accuracy r in this study. Additionally, skin deformation has a significant effect on the friction characteristics of fingertip skin. In this study, the adhesive friction component plays a leading role in the total friction force, whose value is proportional to the contact area. The contact area is related to skin deformation. Figure 3 shows the typical curve of the total friction force changing with time when the fingertip slides on the sample surface. It can be seen that the curve has obvious periodic variation. The focus of this study is to compare the difference of experimental data under different factors, so the data of a single experiment were intercepted. At the beginning of the experiment, the fingertip is located in the part of the sample front that does not involve ridge texture. Suddenly touching or leaving the ridge will lead to irregular fluctuations in the experimental data. To solve this problem, this study removed the experimental data from the initial period. At the end of each experiment, the fingertips stayed in the ridge texture area of the sample, so the data in the middle and late stages of the experiment were retained.
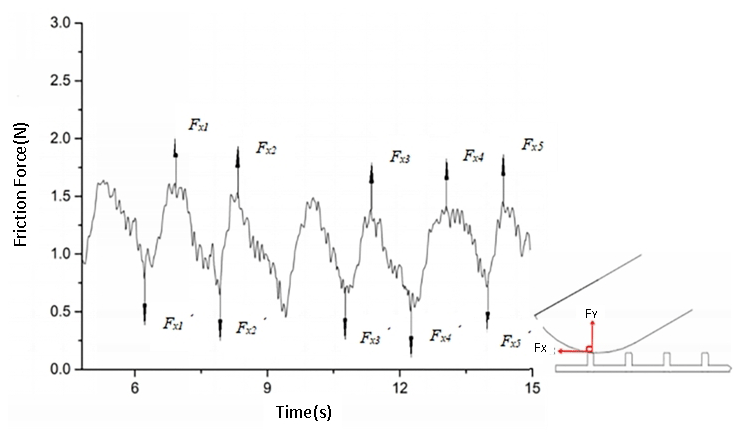
Because the sample surface itself has irregular fine textures caused by the production process, the curve in Fig. 3 has a small amplitude and high-frequency irregular fluctuations. Li and Zhan (2015) take the difference between the maximum and minimum values of the total friction force curve as the friction force fluctuation degree. Since it is too difficult to avoid the interference caused by the uncontrollable small activities of the fingertip, the method proposed in Li and Zhan (2015) is not accurate enough. To solve the problem, an improved data processing method is developed in this investigation. This method first calculates the peak-to-peak value of the total friction force in five relatively uniform periods of the curve obtained from each experiment and then calculates the average value of the previous result to obtain the friction force fluctuation degree FXM1:
The improved method increases the data coverage of calculating the friction force fluctuation degree, which can help avoid the contingency of experimental results. Since one experiment was repeated three times, the calculated result of the first test, namely the friction force fluctuation degree, was recorded as FXM1. The calculated results of the second and third tests are denoted as and . The average friction force fluctuation degree FXM2 is as follows:
According to Tomlinson and Lewis (2013), when the finger skin slides across the rectangular section ridge, the friction force Ff is mainly composed of the adhesive friction force component Fa, the plow friction force component Fp, and the lagged friction force component Fh. The formula is as follows:
The plow friction force component Fp is defined as the local force required by the skin to deform and displace in a recoverable manner when the fingertip moves on the ridge. The generation of the Fp requires energy to drive skin deformation. The viscoelasticity causes the fingertip to recover to the original shape after sliding across the ridge, which makes energy return from skin deformation. However, the energy returned is less than the energy required for the initial skin deformation. The energy difference causes the lag friction force component Fh; that is, Fh is produced from Fp. Tomlinson and Lewis (2013) consider that the sum of the lag friction force component Fh and the plow friction force component Fp is the deformation friction force component Fd, shown by the following formula:
Tomlinson and Lewis (2013) show that the plow friction force component Fp is proportional to the fingertip skin deformation. Benoit et al. (2021) find that the lag friction force component Fh is positively correlated with the fingertip skin deformation, and the change in Fh is always less than that in Fp, so the deformation friction force component Fd is positively correlated with the fingertip skin deformation.
The adhesive friction force component Fa is the main active component of the total friction force, which is defined as the force to shear the adhesion of the contact interface since the adhesion will hinder one object from sliding on another. According to Inoue and Okamoto (2020), the formula is as follows:
where τ0 is the inherent shear strength of the contact interface, and S is the actual contact area.
Equation (6) shows that the adhesive friction force component Fa is positively correlated with the actual contact area S.
Johnson and Greenwood (1985) proposed a formula for calculating the contact ratio of a half-space elastomer in contact with a rigid wavy surface:
where ω is the width of the ridge, λ is the spacing between ridges, is the actual contact stress, and p∗ is the nominal contact stress.
Menga et al. (2014) showed that Eq. (7) is also applicable to viscoelastic materials and modified it:
where a is the contact radius between the finger pad and the contact surface, FN is the applied load, R is the radius of the undeformed fingertip, D is the height of the ridge, and E∗ is the effective Young's modulus. N is the number of ridge features of finger contact, and its calculation formula is as follows:
According to Fagiani and Barbieri (2016), the value of E∗ is calculated by the following formula:
where vf is Poisson's ratio of fingertip skin, Ef is Young's modulus of fingertip skin, vs is Poisson's ratio of the contact surface, and Es is Young's modulus of the contact surface.
The contact state between the fingertip and the sample surface should be evaluated first (Johnson and Greenwood, 1985). Define x the ratio of the actual contact stress to the nominal contact stress p∗. When x<1, the contact state is called partial contact. When x≥1, the contact state is called complete contact. The formula is as follows:
Owing to the multilayer skin tissues of fingertip skin, the elastic modulus and Poisson's ratio of each layer are significantly different (Fagiani and Barbieri, 2016). In particular, the stratum corneum outermost on the skin surface is much harder than the inner shin layers (Messaoud et al., 2016), which will influence the skin material parameters in Eq. (12). Liang and Boppart (2010) successfully measured Young's modulus of the inner epidermis through dynamic optical coherence elastography. It can be assumed that Young's modulus of the epidermis is 101.2 KPa, and Poisson's ratio is 0.5.
In this study, the fingertip size of subjects and the ridge size of samples are selected to ensure that the x in Eq. (12) is always less than 1, for which the contact state is always partial contact. According to Carpenter (2018), the formula of the actual contact area S under the partial contact state is as follows:
From Eq. (14) it can be seen that under the partial contact state, the adhesive friction component Fa increases with the increase in the fingertip radius, the normal load applied to the fingertip, and the ridge width of the sample, and it will decrease with the increase in the ridge spacing of sample.
4.1 Effect of normal load on friction characteristics
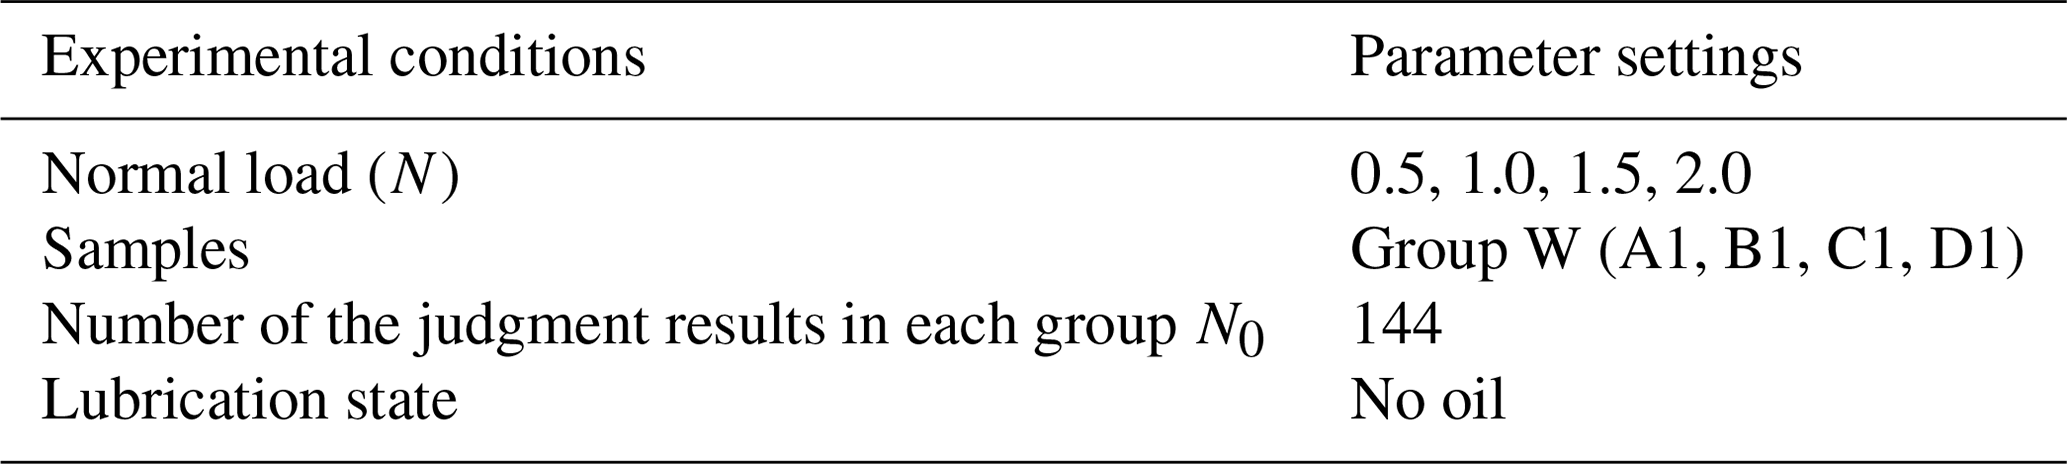
In this study, the friction characteristics of fingertip skin refer to the average friction force fluctuation degree between the fingertip skin and the sample surface. There is no uniform standard for the selection of normal force in the finger friction test. Based on the range of normal force obtained from literature research (Xue et al., 2018), combined with the range of test equipment, the level of the normal force is selected. This section presents the experimental cases based on samples of group W under normal loads of 0.5, 1.0, 1.5, and 2.0 N. The experimental conditions are shown in Table 4.
For the effect of normal load on friction force, the results of different subjects touching different samples are consistent, such as the results of sample A1 touched by subject 1 shown in Fig. 4. The curves of the friction force vs. time have obvious periodicity with significantly different periodic fluctuation degrees. The calculated FXM2 is shown in Fig. 5. It can be seen that the friction force fluctuation degree increases when the normal load increases, and the results of other subjects shown in Fig. 6 also follow the same trend. There are also consistent results when subjects touch samples B1, C1, and D1, respectively. The interference of human factors can only be minimized in the design of the test but cannot be eliminated. In addition, the difference in subjects will inevitably affect the test results. The phenomenon of curve crossing in Fig. 6 is caused by these two influencing factors. The focus of this study is to find commonalities in the results of each subject, so the analysis of the friction perception characteristics is based on the results of all subjects without discussing the differences between the subjects' results. However, the influence of subject difference on tactile perception is important and extremely complex, which will be considered in further study.
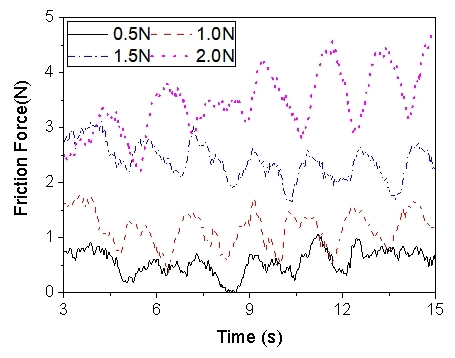
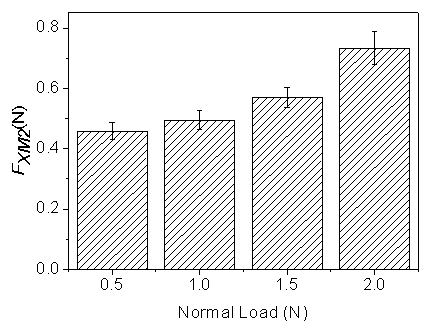
Figure 5Comparison of average friction force fluctuation degree of subject 1 under different normal loads.
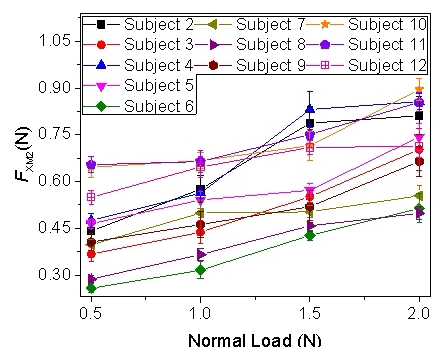
Figure 6Comparison of average friction force fluctuation degree of other subjects under different normal loads.
Experimental results are compared with the analytical results. The actual contact area S of sample A1 touched by subject 1 under different normal loads is shown in Fig. 7. The larger the normal load, the larger the actual contact area S and, further, the larger adhesive friction force component Fa. The analytical results of other subjects shown in Fig. 8 are consistent with Fig. 7. The analytical results of other samples also have consistency with those of sample A1.

Figure 7Comparison of actual contact area under four groups of different normal loads of subject 1.
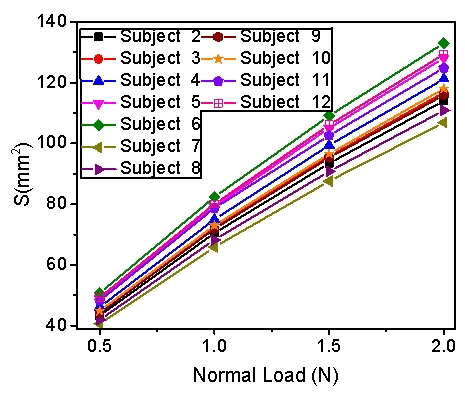
Figure 8Comparison of actual contact area under four groups of different normal loads of other subjects.
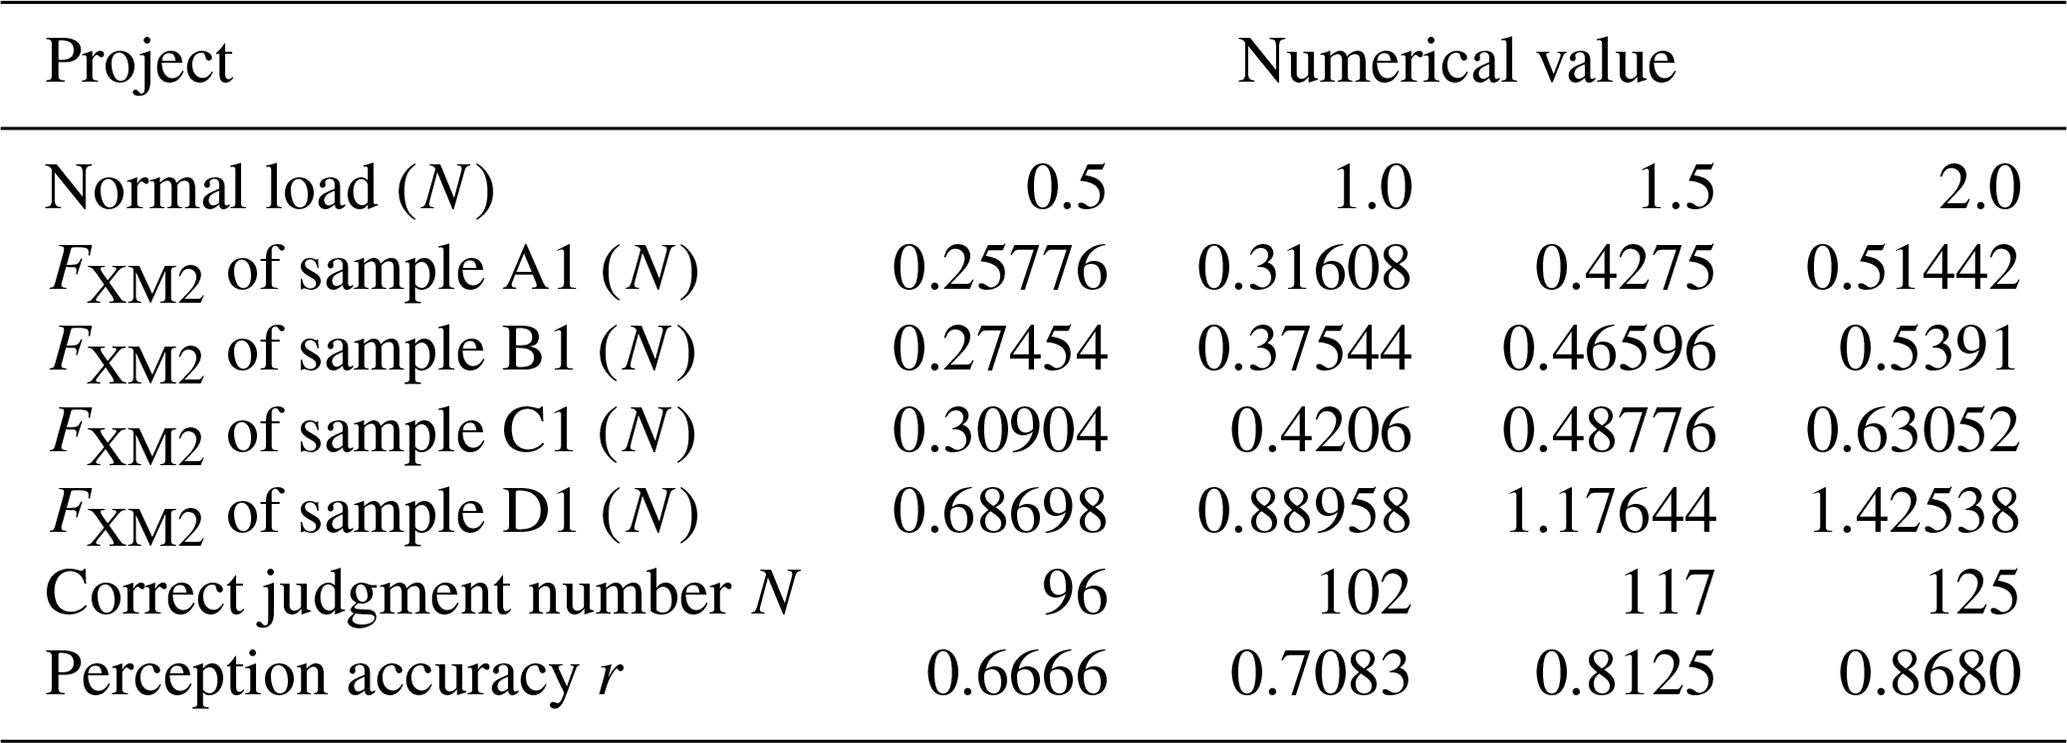
The relationship between friction characteristics and subject tactile perception accuracy is investigated by analyzing the judgment results corresponding to the average friction force fluctuation degree. To avoid the contingency caused by a single sample and single subject, 12 subjects touch four samples A1, B1, C1, and D1, which have different ridge spacing. Since the experiment is repeated three times under the same conditions, each sample is judged 18 times by all subjects, and there will be 144 judgment results in the four samples. The subject tactile perception accuracy corresponding to the average friction force fluctuation degree FXM2 in each group is shown in Table 5. The subject tactile perception accuracy r increases when the normal load increases. Moreover, it can be seen that the greater the average friction force fluctuation degree FXM2, the higher the subject's tactile perception accuracy r.
The fingertip skin will produce different mechanical deformation when touching the ridge surface under different normal loads. According to the previous research results (Liang and Boppart, 2010), the contact force is positively correlated with mechanical deformation. Combined with the analytical results, the adhesive friction force component Fa, which plays a leading role in the total friction force, will increase by enhancing the normal load. In addition, the deformation friction force component Fd will also be raised because it is positively correlated with mechanical deformation. The increase in the two components will eventually lead to an increase in the average friction force fluctuation degree FXM2. Furthermore, the subject tactile perception accuracy r will be improved.
4.2 Effect of ridge size on friction characteristics
4.2.1 Effect of ridge width
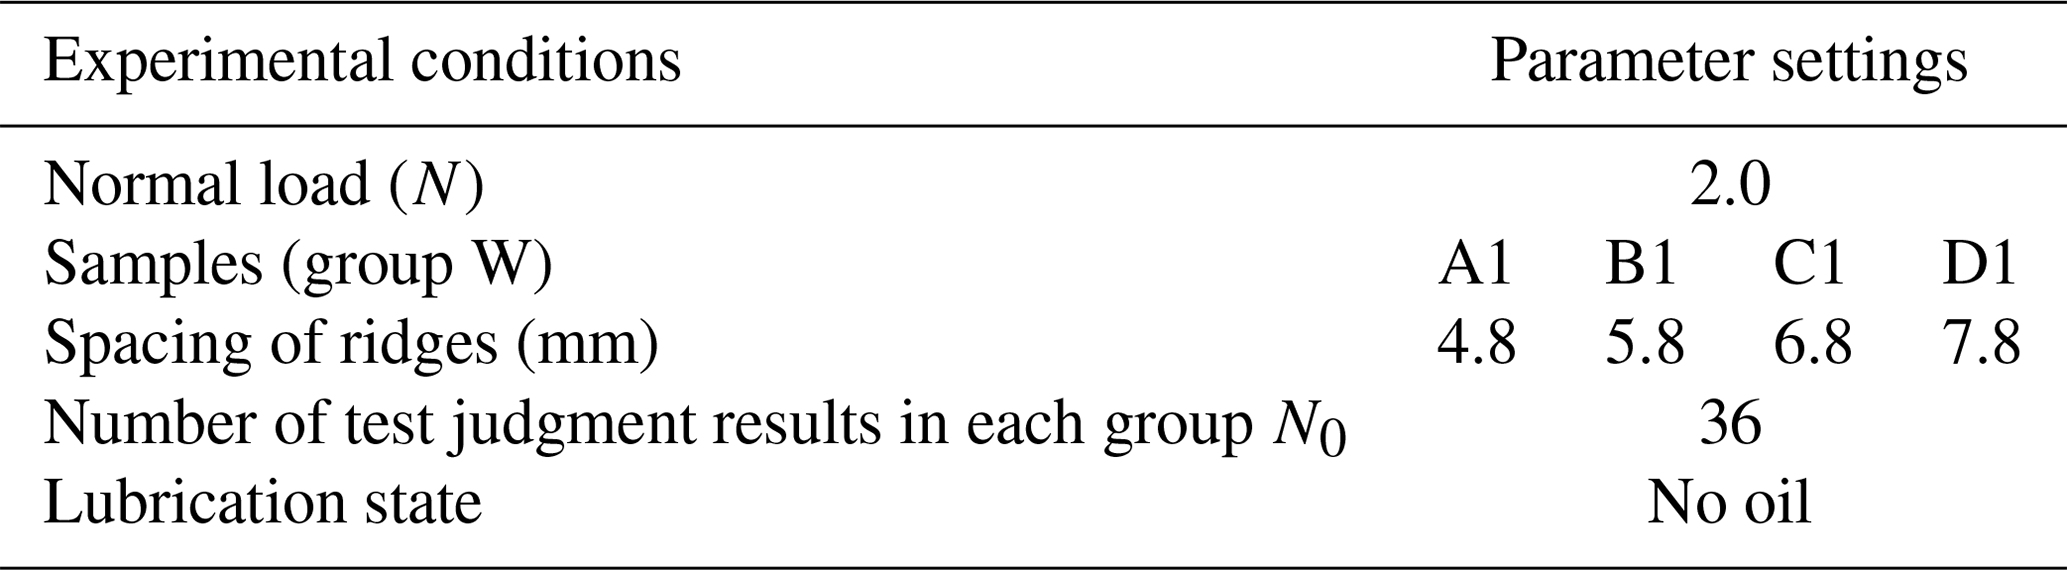
This section uses two experimental cases which select samples of groups W and N with different ridge widths of 0.8 and 1.6 mm, to study the effect of ridge width on friction characteristics. The experimental conditions are shown in Table 6. Two groups of samples are divided into four pairs, respectively, A1 and A2, B1 and B2, C1 and C2, and D1 and D2, to avoid contingency.
The curves of friction force vs. time in Fig. 9 for samples A1 and A2 touched by subject 1 under the normal load of 2N. They have different fluctuation degrees due to different ridge widths, which is consistent with other pairs of samples and other subjects. Based on the experimental data of subject 1, the FXM2 values shown in Fig. 10 of all samples are further calculated. Since the ridge width of the W group is twice that of the N group, the comparison result reveals that the average friction force fluctuation degree is larger when the ridge width is larger, and this phenomenon still exists when extended to all subjects as shown in Fig. 11.
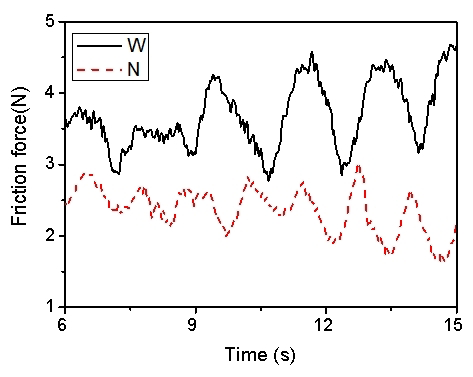
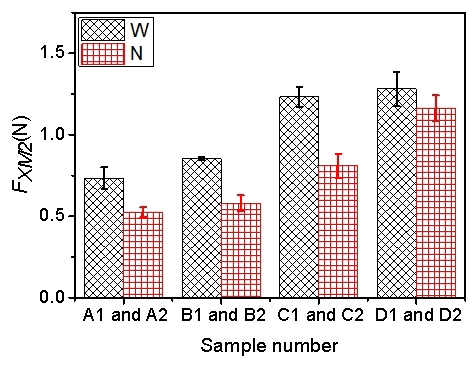
Figure 10Comparison of average friction force fluctuation degree between two groups of different ridge width tests of subject 1.
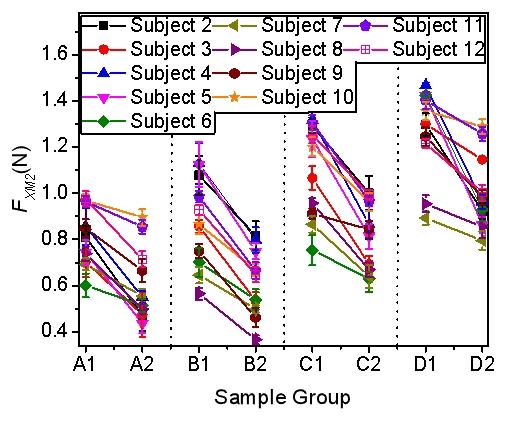
Figure 11Comparison of average friction force fluctuation degree between two groups of different ridge width tests of other subjects.
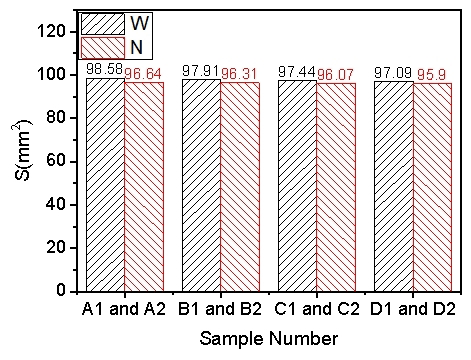
Figure 12Comparison of actual contact area between two groups of different ridge width tests of subject 1.
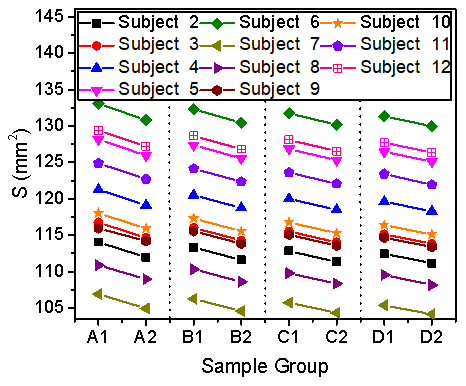
Figure 13Comparison of actual contact area between two groups of different ridge width tests of other subjects.
Compare with the analytical results to explore the causes of the phenomenon. The actual contact area S of samples A1 and A2 touched by subject 1 under the normal load of 2N is calculated and shown in Fig. 12. Actual contact area S of group W is slightly higher than that of group N, which means that the adhesive friction component Fa of group W is slightly higher than that of group N. The results shown in Fig. 13 of other subjects have consistent variation.
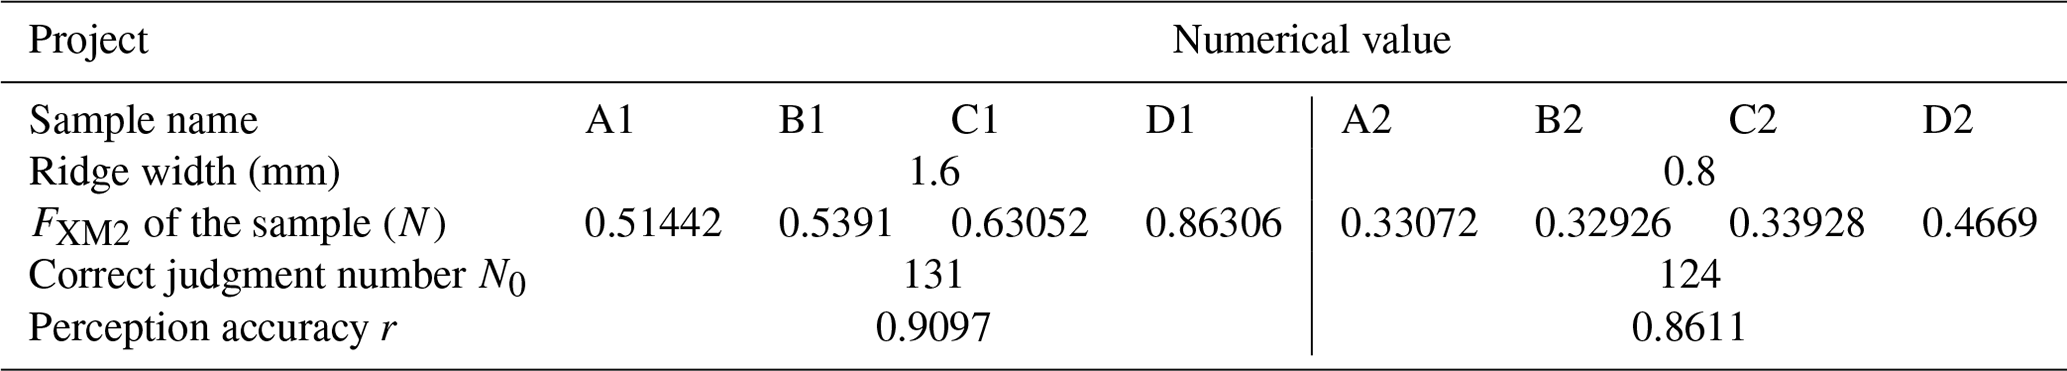
As shown in Table 7, the subject tactile perception accuracy r is calculated to study its relationship with the average friction force fluctuation degree FXM2. It can be seen that the subject tactile perception accuracy r of group W (A1, B1, C1, and D1) is a little higher than that of group N (A2, B2, C2, and D2), which has consistence variation with average friction force fluctuation degree FXM2.
Larger ridge width of the sample surface will lead to smaller mechanical deformation of the fingertip skin, which is an important factor influencing the friction characteristics. Smaller skin deformation leads to smaller deformation friction Fd, but as shown in Figs. 12 and 13, a larger ridge width increases the real contact area S. Adhesive friction Fa is proportional to the real contact area S. Hence, the analytical results illustrate that the adhesive friction force component Fa increases when subjects touch samples with larger ridge widths. Adhesive friction plays a leading role in total friction. As a result, the average friction force fluctuation degree increases, which eventually enhances the subject's tactile perception accuracy r. The influence of ridge width on deformation friction force is complex. According to the literature, increasing the ridge width within a certain range will lead to an increase in the friction perception ability of the fingertip, and the friction perception ability of the fingertip will decrease after exceeding the certain range. This study focuses on the discussion of the influence of ridge width on fingertip friction perception ability within a certain range. As shown in Fig. 10, even if the two groups of ridge width parameters designed in this study are doubled, the change in adhesive friction is still not obvious. With comprehensive consideration, the design of such two groups of ridge width tests is reasonable. In future research, the amount of data will be increased to break through this range to further explore the influence of ridge width on friction perception.
4.2.2 Effect of ridge spacing
In addition to the ridge width of the sample, the effect of ridge spacing on friction characteristics is also researched using samples of group W with different ridge spacing of 4.8, 5.8, 6.8, and 7.8 mm. The experimental conditions are shown in Table 8.
Figure 14 shows the curves of friction force vs. time for samples of group W touched by subject 1 under the normal load of 2N. It can be seen that four different ridge widths correspond to four different fluctuation degrees, which is consistent with the results of other subjects. Figure 10 shows the average friction force fluctuation degree FXM2 corresponding to the curves, from which it can be easily found that the average friction force fluctuation degree increases with the increase in the ridge spacing. The results shown in Fig. 15 of other subjects also indicate this phenomenon.
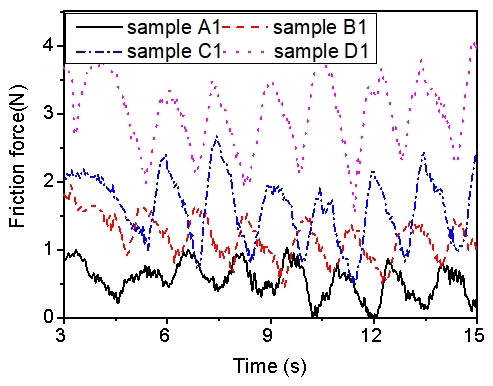
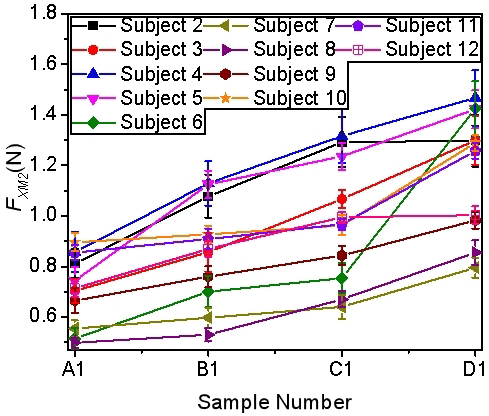
Figure 15Comparison of the average friction force fluctuation degree of other subjects under different ridge spacing.
Meanwhile, the actual contact area S for samples of group W touched by subject 1 under the normal load of 2N is shown in Fig. 12. The difference in the actual contact area S between four different ridge spacing is not obvious. However, specific to the numerical results, it can be found that the actual contact area S decreases with the increase in the ridge spacing, which is also revealed in the calculation results of other subjects, as shown in Fig. 16.
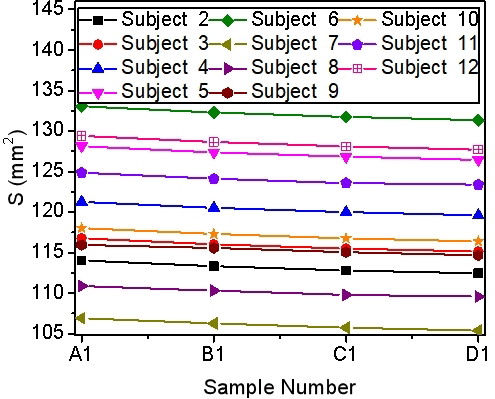
Figure 16Comparison of the actual contact area of other subjects under different ridge spacing.
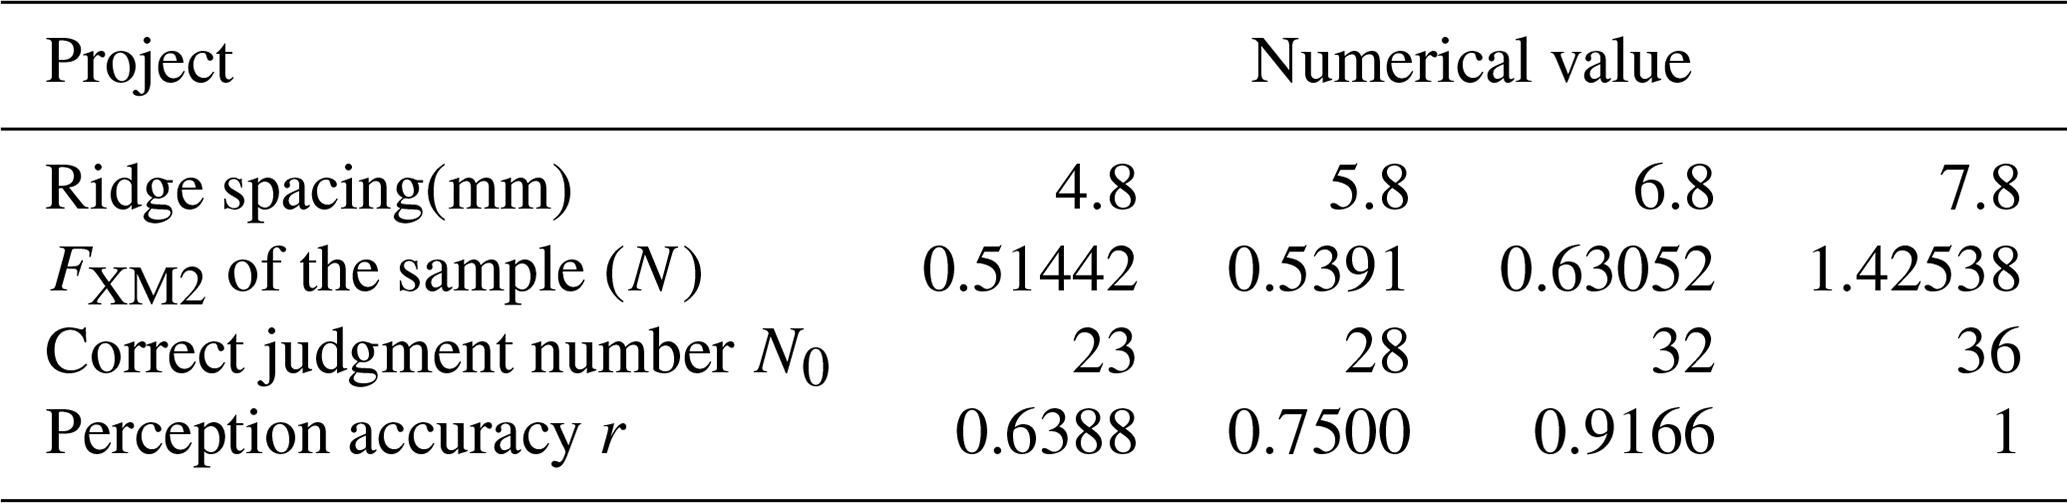
The subject tactile perception accuracy r corresponding to the experiments is calculated and shown in Table 9. Comparing the data in the table, it can be concluded that the larger average friction force fluctuation degree FXM2 will improve the subject tactile perception accuracy r.
There is no doubt that larger ridge spacing of samples can cause larger mechanical deformations of the fingertip skin within a certain range. However, according to the analytical results, the adhesive friction force component Fa decreases with the increase in ridge spacing. At this time, the deformation friction force component Fd increases with the increase in ridge spacing and plays a leading role instead of the adhesive friction force component Fa. Thus, the average friction force fluctuation degree is raised and eventually leads to an increase in the subject tactile perception accuracy r.
4.3 Effect of lubrication state on friction characteristics
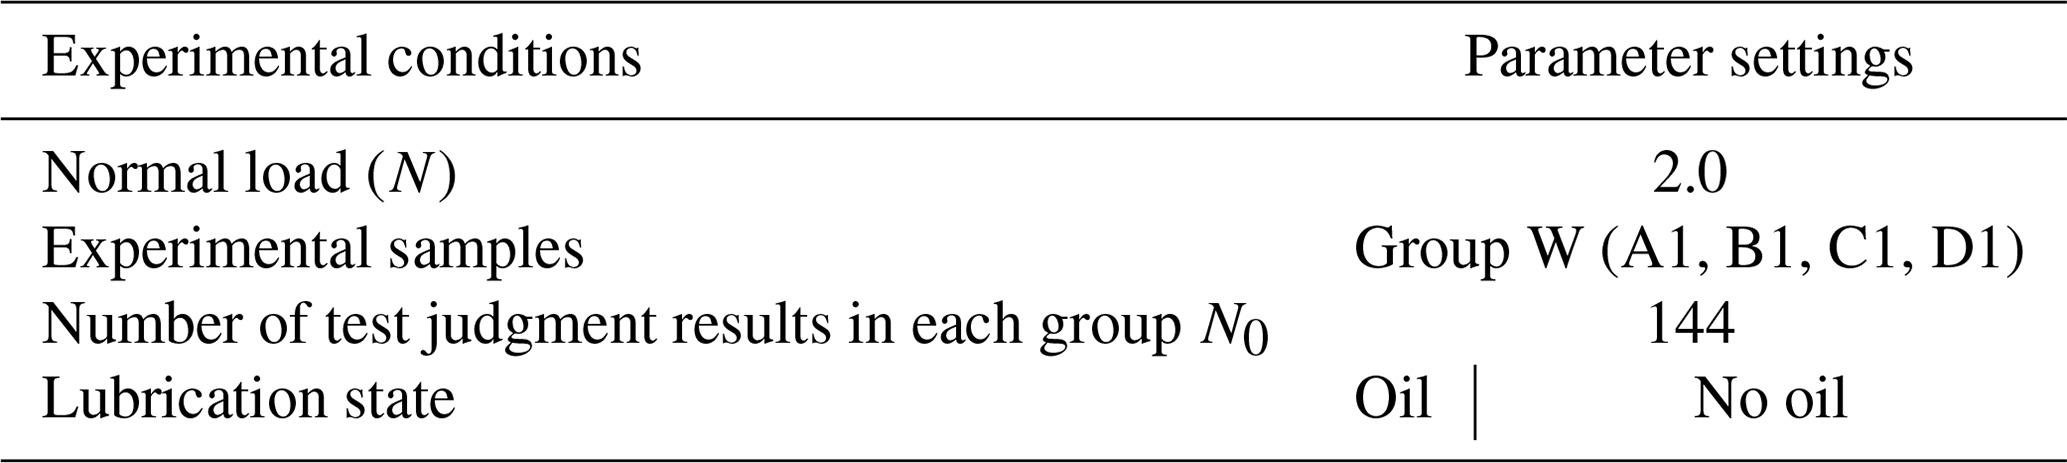
The lubrication state of the contact surface is an essential factor in exploring the friction perception characteristics, which is the motivation for this section to study the effect of the lubrication state on the friction characteristics for samples of group W. The experimental conditions are shown in Table 10. The experimental conditions are shown in Table 10. It is necessary to add that the difference in lubrication state is whether the quantitative lubricating oil is smeared on the fingertips.
Figure 17 shows the friction force of sample A1 touched by subject 1 with two different lubrication states. Other samples are consistent with this phenomenon; that is, the friction force without oil lubrication fluctuates more with time. The average friction force fluctuation degree FXM2 is calculated as shown in Fig. 18, and the results without oil lubrication are indeed larger. The experimental results of other subjects are also consistent, as shown in Fig. 19.
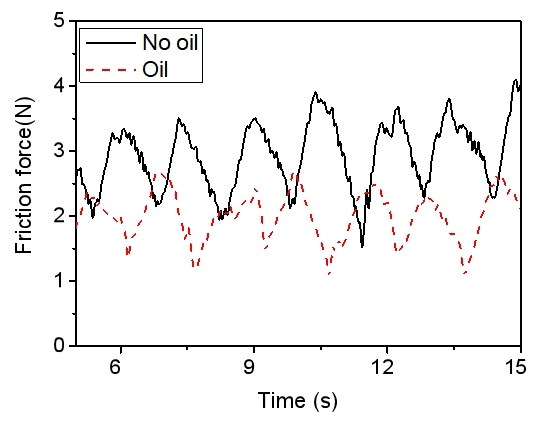
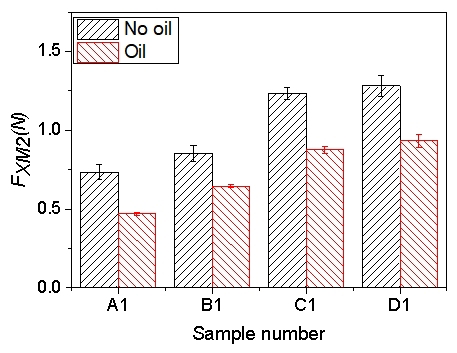
Figure 18Comparison of average friction force fluctuation degree of subject 1 under different lubrication states.
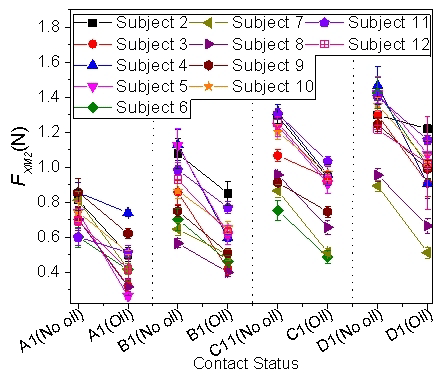
Figure 19Comparison of the average friction force fluctuation degree of other subjects under different lubrication states.
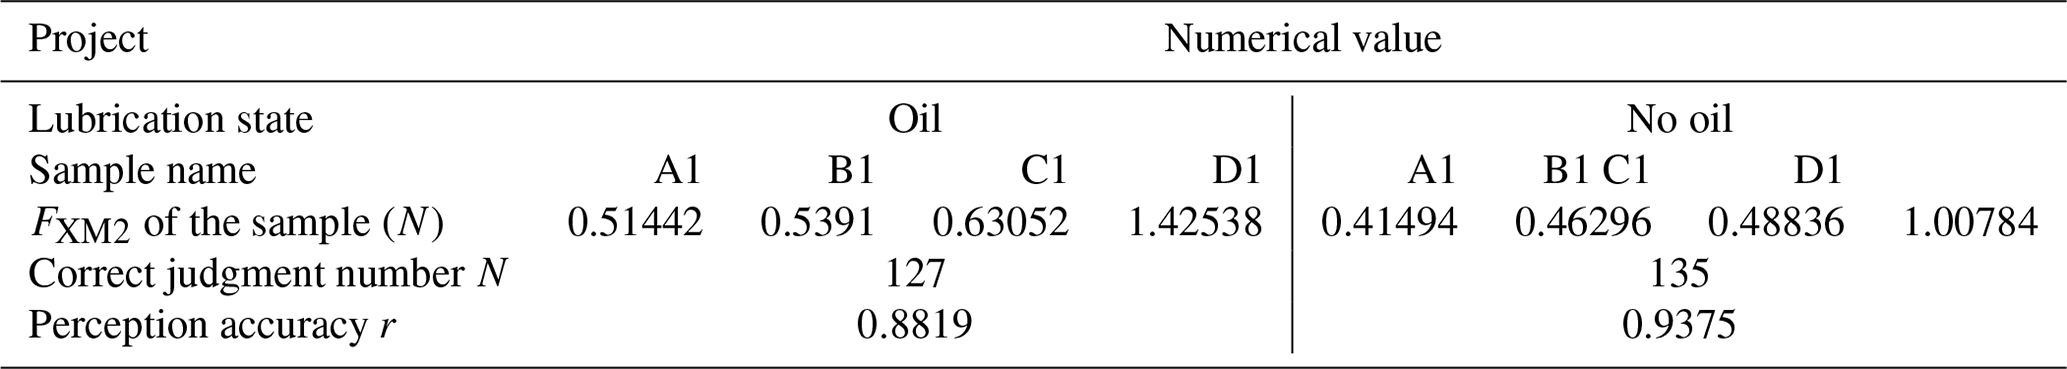
The fluidity of lubricating oil can fill the unevenness between contact surfaces through free flow, to reduce the roughness between contact surfaces and achieve the effect of reducing friction. Equation (14) does not directly and quantitatively study the effect of the lubrication state on the actual contact area S. This study does not carry out a theoretical analysis of this problem but focuses on whether the change of lubrication state can influence the friction perception characteristics of the subjects. Table 11 shows the result that the addition of lubricating oil reduces the subject tactile perception accuracy r. More importantly, it can be seen that the lower the average friction force fluctuation degree FXM2, the lower the subject's tactile perception accuracy r.
Although the effect of the lubrication state on the actual contact area is not quantitatively calculated, according to the experience, we know that the addition of lubricating oil medium will reduce the direct contact area between the sample surface and the fingertip skin, which will further cause the adhesive friction force component Fa to decrease. Meanwhile, according to research (Zhou and Mo, 2018), the addition of a lubricating oil medium will reduce the mechanical deformation of the skin, so that the deformation friction force component Fd will also decrease. Given this, adding a lubricating oil medium will reduce the average friction force fluctuation degree FXM2, resulting in lower subject tactile perception accuracy r.
In this paper, a novel experimental method to investigate fingertip friction perception characteristics is proposed. To improve the accuracy and repeatability of the experiment, many detailed processing methods are embodied in experiments and data processing. The ridged surface is selected as the deterministic texture to avoid the influence of texture randomness. The interference of human factors could be limited to a lesser extent by selecting the linear module of the UMT TriboLab testing machine and the self-made finger fixture. The data processing method proposed could avoid the contingency caused by single data. This study explored the friction perception characteristics by discussing the relationship between friction force and tactile perception accuracy, which could provide theoretical support for the research and development of humanoid robot bionic skin. However, due to the limitations of experimental conditions and the researchers' level, this study does not discuss the influence of fingertip skin surface morphology on fingertip friction characteristics. Next, research work will be carried out around this issue. Combined with the analytical methods, the friction characteristics of fingertip skin and its relationship with the subject tactile perception accuracy are discussed under different influencing factors. The conclusions are now given.
In the partial contact state of fingertip skin with ridged surfaces, the friction force consists of two components. One is the adhesive friction force component, and the theoretical analysis of the test shows that it will be increased by raising the normal load and the ridge width of samples and will be slightly reduced by decreasing the ridge spacing of samples. Another is the deformation friction force component, which is closely related to the deformation of fingertip skin.
The test results show that the average friction force fluctuation degree increases with increasing normal load, sample ridge width, and sample spacing. Additionally, the addition of a lubricating oil medium leads to a decrease in the average friction force fluctuation degree.
The test shows that the subject tactile perception accuracy can be improved by increasing the normal load, the ridge width, and the spacing of samples and can be reduced by adding the lubricating oil. It also shows that the average friction force fluctuation degree can be changed by controlling the normal load, the texture size, and the contact medium. Furthermore, we hypothesize that the subject tactile perception accuracy can be improved by increasing the average friction force fluctuation degree.
The data that support the findings of this study are available from the corresponding author upon reasonable request.
LW and LY conceived the idea. LY wrote the experimental code and finalized the paper. LY provided financial and project support for the experiment. LL, JW, and QZ provided the research direction of this paper and collected the research literature.
The contact author has declared that none of the authors has any competing interests.
Publisher’s note: Copernicus Publications remains neutral with regard to jurisdictional claims made in the text, published maps, institutional affiliations, or any other geographical representation in this paper. While Copernicus Publications makes every effort to include appropriate place names, the final responsibility lies with the authors.
The authors are grateful to the anonymous reviewers and the editor for their comments and suggestions on improving our manuscript.
This research has been supported by the National Natural Science Foundation of China (grant no. 52175074).
This paper was edited by Haiyang Li and reviewed by four anonymous referees.
Alam, M. M., Islam, M. T., and Rahman, S. M. M.: Unified learning approach for egocentric hand gesture recognition and fingertip detection, Pattern Recogn., 121, 108200, https://doi.org/10.1016/j.patcog.2021.108200, 2021.
Benoit, P. D., Ewa, J., Allan, B., Thonnard, J. L., Edin, B., and Lefevre, P.: High-resolution imaging of skin deformation shows that afferents from human fingertips signal slip onset, eLife, 10, e64679, https://doi.org/10.7554/eLife.64679, 2021.
Bergmann Tiest, W. M.: Tactual perception of material properties, Vision Res., 50, 2775–2782, https://doi.org/10.1016/j.visres.2010.10.005, 2010.
Bok, B. G., Jang, J. S., and Kim, M. S.: Texture identification of objects using a robot fingertip module with multimodal tactile sensing capability, Appl. Sci.-Basel, 11, 5256, https://doi.org/10.3390/app11115256, 2021.
Callier, T. and Saal, H. P.: Kinematics of unconstrained tactile texture exploration, J. Neurophysiol., 113, 3013–3020, https://doi.org/10.1152/jn.00703.2014, 2015.
Capace, A., Cosentino, C., Abidi, H., Cannella, F., Amato, F., Dogramadzi, S., and Merola, A.: Modelling and identification of the asymmetric hysteresis in the viscoelastic response of the fingertip under indentation, Mechatronics, 77, 102578, https://doi.org/10.1016/j.mechatronics.2021.102578, 2021.
Carpenter, C. W.: Human ability to discriminate surface chemistry by touch, Mater. Horizons, 5, 70–77, https://doi.org/10.1039/c7mh00800g, 2018.
Cesini, I., Ndengue, J. D., Chatelet, E., Faucheuet, J., and Massi, F.: Correlation between friction-induced vibrations and tactile perception during exploration tasks of isotropic and periodic textures, Tribol. Int., 120, 330–339, https://doi.org/10.1016/j.triboint.2017.12.041, 2018.
Chimata, G. P. and Schwartz, C. J.: Investigation of the role of diminishing surface area on friction-based tactile discrimination of textures, Biotribology, 15, 1–8, https://doi.org/10.1016/j.biotri.2018.07.001, 2018.
Fagiani, R. and Barbieri, M.: A contact mechanics interpretation of the duplex theory of tactile texture perception, Tribol. Int., 101, 49–58, https://doi.org/10.1016/j.triboint.2016.03.031, 2016.
Hou, Y., Zhang, M., and Nie, H.: Analysis of sensitive parameters affecting unlocking force of finger lock in landing gear, Int. J. Aerospace Eng., 2021, 6652056, https://doi.org/10.1155/2021/6652056, 2021.
Inoue, K. and Okamoto, S.: Effect of material hardness on friction between a bare finger and dry and lubricated artificial skin, IEEE T. Haptics, 13, 123–129, https://doi.org/10.1109/TOH.2020.2966704, 2020.
Jeremy, D., Sonia, D., and Xavier, M.: Simplified versus real geometry fingertip models: a finite element study to predict force displacement response under flat contact compression, J. Mech. Med. Biol., 18, 1850048, https://doi.org/10.1142/S0219519418500483, 2018.
Johnson, K. L. and Greenwood, J. A.: The contact of elastic regular wavy surfaces, Int. J. Mech. Sci., 27, 383–396, https://doi.org/10.1016/0020-7403(85)90029-3, 1985.
Johnson, K. O. and Hsiao, S. S.: Neural mechanisms of actual form and texture perception, Annu. Rev. Neurosci., 15, 001303, https://doi.org/10.1146/annurev.ne.15.030192.001303, 1992.
Kumagai, A., Obata, Y., Yabuki, Y., Jiang, Y. L., Yokoi, H., and Togo, S.: Asymmetric shape of distal phalanx of human finger improves precision grasping, Sci. Rep.-UK, 11, 10402, https://doi.org/10.1038/s41598-021-89791-3, 2021.
Li, W. and Zhan, M. L.: Quantitative assessment of friction perception for fingertip touching with different roughness surface, Biosurf. Biotribol., 1, 278–286, https://doi.org/10.1016/j.bsbt.2015.11.004, 2015.
Liang, X. and Boppart, S. A.: Biomechanical properties of in vivo human skin from dynamic optical coherence elastography, IEEE T. Bio-Med. Eng., 57, 953–959, https://doi.org/10.1109/TBME.2009.2033464, 2010.
Liu, G. and Zhang, C.: Tri-modal tactile display and its application into tactile perception of visualized surfaces, IEEE T. Haptics, 13, 733–744, https://doi.org/10.1109/TOH.2020.2979182, 2020.
Logozzo, S., Maria, C. V., and Monica, M.: Modelling the human touch: A basic study for haptic technology, Tribol. Int., 166, 107352, https://doi.org/10.1016/j.triboint.2021.107352, 2021.
Menga, N., Putignano, C., Carbone, G., and Demelio, G. P.: The sliding contact of a rigid wavy surface with a viscoelastic half-space, P. Roy. Soc. A-Math. Phy., 470, 20140392, https://doi.org/10.1098/rspa.2014.0392, 2014.
Messaoud, W. B., Bueno, M. A., and Betty, L. S.: Relation between human perceived friction and finger friction characteristics, Tribol. Int., 98, 261–269, https://doi.org/10.1016/j.triboint.2016.02.031, 2016.
So, Y., Kim, S. P., and Kim, J.: Perception of surface stickiness in different sensory modalities: an functional MRI study, NeuroReport, 31, 411–415, https://doi.org/10.1097/wnr.0000000000001419, 2020.
Tang, W., Chen, N. X., Zhang, J. K., Chen, S., Ge, S. R., Zhu, H., Zhang, H. Z., and Yang, H. F.: Characterization of tactile perception and optimal exploration movement, Tribol. Lett., 58, 1–14, https://doi.org/10.1007/s11249-015-0507-4, 2015.
Tang, W., Lu, X. Y., Chen, S., Ge, S. R., Jing, X. H., Wang, X. Y., Liu, R., and Zhu, H.: Tactile perception of skin: research on late positive component of event-related potentials evoked by friction, J. Text. I., 111, 1661067, https://doi.org/10.1080/00405000.2019.1661067, 2020.
Tomlinson, S. E. and Lewis, R.: Human finger friction in contacts with ridged surfaces, Wear, 301, 330–337, https://doi.org/10.1016/j.wear.2012.12.039, 2013.
Vastano, R., Inuggi, A., Vargas, C. D., Baud-Bovy, G., Jacono, M., and Pozzo, T.: Tactile perception during action observation, Exp. Brain Res., 234, 2585–2594, https://doi.org/10.1007/s00221-016-4663-z, 2016.
Xue, Z., Ji, L. M., and Zhong, M. J.: Overview of finger friction and tactile perception, Biosurf. Biotribol., 4, 99–111, https://doi.org/10.1049/bsbt.2018.0032, 2018.
Zhou, X. and Mo, J.: Correlation between tactile perception and tribological and dynamical properties for human finger under different sliding speeds, Tribol. Int., 123, 286–295, https://doi.org/10.1016/j.triboint.2018.03.012, 2018.
Zhou, Z. R. and Jin, Z. M.: Biotribology: recent progress and future perspectives, Biosurf. Biotribol., 1, 3–24, https://doi.org/10.1016/j.bsbt.2015.03.001, 2015.