the Creative Commons Attribution 4.0 License.
the Creative Commons Attribution 4.0 License.
 | 28 Aug 2023
Noise analysis and optimization of the gear transmission system for two-speed automatic transmission of pure electric vehicles
Shi Zhaoyao
Liu Shikai
Yue Huijun
Wu Xiaoxiao
In this study, the noise of the gear transmission system for two-speed automatic transmission (2EAT) of pure electric vehicles was analyzed and optimized. Firstly, through vehicle noise tests, poor working conditions and noise contribution of each gear pair were determined with the order analysis method. Secondly, a dynamics calculation model and a simulation model of the gear transmission system were established and the poor meshing state of the main reducer gear pair under specific conditions was determined as the main cause of noise. Finally, a genetic algorithm combined the weight method was used for gear modification. After gear modifications, the fluctuation range of transmission error was reduced and the contact condition of the tooth surface was significantly improved.
- Article
(5357 KB) - Full-text XML
- BibTeX
- EndNote


In recent years, pure electric vehicles have become a focus of research due to resource and environmental factors, and the multi-gear transmission system has been widely applied because it can improve the endurance mileage and power performance of pure electric vehicles.
Due to the improvements in living standards, the demands for the comfort of vehicles are increasing and the vibration, and this frequently concerns the noise levels of the transmission. The noise level of a motor is generally lower than that of an engine, thus resulting in more prominent transmission noise in electric vehicles. The transmission is subjected to more complex external excitation due to the high rotation speed and excellent acceleration characteristics of the motor. Therefore, it is significant to optimize the vibration and noise levels of the gear transmission system for multi-speed automatic transmission of pure electric vehicles (He, 2016; Holehouse et al., 2019)
The source, transmission path and optimization of the vibration and noise of the gear transmission system of automobile transmission have been extensively explored by scholars in China and internationally. Through modal analysis and transfer matrix analysis, Choy et al. (1992) comprehensively analyzed the vibration problems in the transmission system. Hou et al. (2020) established a rigid–flexible coupled dynamic model of an electric drive system considering shaft elasticity, bearing stiffness and housing flexibility. Finally, a changed gear web and gear rim thickness can significantly reduce the dynamic meshing force and the dynamic response. With the CATIA and ADAMS software, Li et al. (2015) developed a multi-body dynamics model of a gear transmission system and analyzed the influences of input speed and gear selection on transmission rattle noise. Xiang and Zuo (2013) determined the noise of the manual transmission and analyzed the noise signals of the transmission under multiple working conditions. Choi et al. (2021) optimized the gear macro-geometry of a tractor transmission through a genetic algorithm to minimize peak-to-peak static transmission errors. The overall noise level in the transmission operating range was found to reduce by 3.1 dBA, and all the noise levels of the gear harmonic components were reduced effectively (Choi et al., 2021). The HEAD acoustics and LMS Test.Lab, respectively, developed by the Head company of Germany and LMS company of Belgium, can accurately test and analyze the vibration and noise of transmission. They have the functions of order tracking, spectrum analysis and modulation analysis and define the sound quality parameters of noise for the psychoacoustic analysis of noise signals and the characterization of the auditory perception of human ears to different noise levels (Ando et al., 2005; Abe et al., 2003). Yang (2022) established a nonlinear dynamics model of the torsion-coupled gear transmission. The influence of nonlinear factors such as time-varying meshing stiffness, transmission error and torsional deformation of the transmission shaft on the gear meshing vibration is analyzed, thereby greatly reducing the noise generated by the gear transmission system vibration. Singh and Sai (2015) reduced the noise level of transmission by optimizing the stress distribution of the tooth surface. Zhang (2018) established the rigid–flexible coupling model of transmission and reduced the noise of transmission by optimizing parameters such as gear pressure angle and helix angle. Shu et al. (2020) established the gear transmission system model of two-speed transmission in the Romax Designer software, optimized the system through the combination of tooth profile modification and tooth lead modification, and improved the vibration and noise levels of the gear transmission system. Lee and Park (2023) developed a prediction model using machine learning to predict gear whine noise using the inspection data of gear tooth and noise bench test data in semi-anechoic chambers. The obtained results demonstrated that the machine-learning-based prediction model can be used to predict gear whine noise with a higher accuracy than ordinary least squares. Mao (2023) used the latest nonlinear finite-element technique to achieve real rolling and sliding contact simulation. The contact position, surface contact pressure and transmission error in helical gears are studied.
Existing studies on the vibration and noise of transmission are mainly focused on the traditional transmission, and the theory and engineering application of automatic transmission of pure electric vehicles have seldom been explored. According to the characteristics of motor drive, the vibration and noise optimization of pure electric vehicle multi-speed transmission under actual working conditions was carried out and the optimization results met the technical requirements of the electric vehicle industry.
In order to solve the noise problem of two-speed automatic transmission (2EAT), in the study, the vehicle noise test was performed and then test results were analyzed. Then, based on the analysis results, the main reducer gear pair in the gear transmission system was determined as the main noise source with the order tracking method. The dynamic equation of the gear transmission system was established and analyzed theoretically. In addition, the rigid–flexible coupling simulation model of transmission shaft, gear and shell was developed with the Romax software and the Hyper-Mesh software to explore the transmission state in poor transmission conditions. Taking the small fluctuation in gear transmission error and the regular contact load distribution of the tooth surface as the optimization objectives, the gear micro-modification method was used for optimization. The gear micro-modification not only improved the gear transmission state but also optimized the dynamic response of the bearing position in some frequency bands. Through the gear modification, the fluctuation in gear transmission error is reduced to improve the meshing state of the tooth surface and decrease the excitation to the bearing position. In this way, the noise problem of the gear transmission system is solved. In a word, gear modification can largely reduce the vibration noise of the gear transmission system and improve the driving experience of users.
2.1 2EAT structure and parameters
The transmission is automatic transmission (AT), with the motor as power input. The gear transmission system is composed of G1 (first-gear pair), G2 (second-gear pair), G3 (main reducer gear pair) and D (differential mechanism). The shift structure is composed of clutch C1 and clutch C2. The 2EAT structure is shown in Fig. 1.
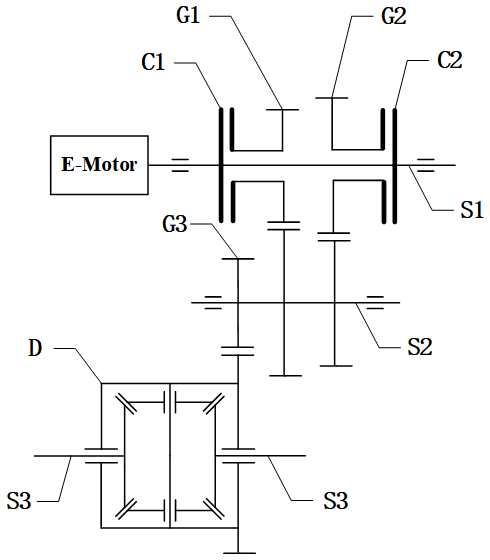
Figure 12EAT structure. G1: first-gear pair; G2: second-gear pair; G3: main reducer gear pair; S1: input shaft; S2: middle shaft; S3: half-shaft; C1: clutch in first gear; C2: clutch in second gear; D: differential mechanism.
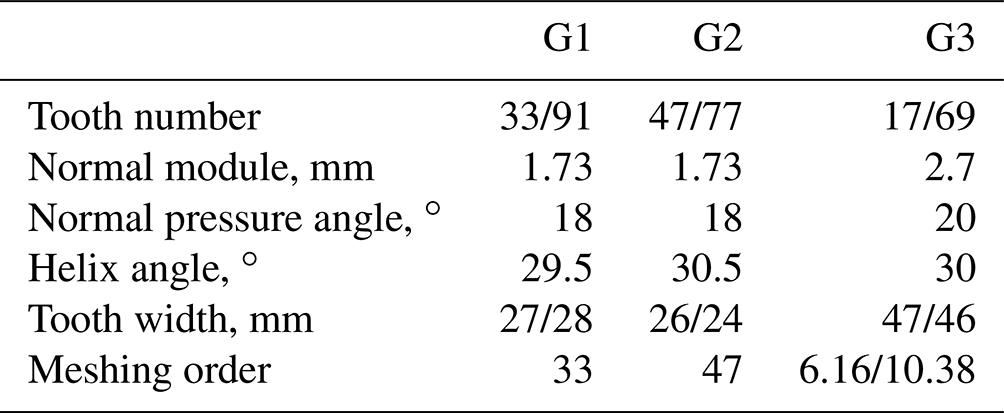
The main parameters of the three groups of constant meshing gears in the transmission system are shown in Table 1.
2.2 Vehicle noise test
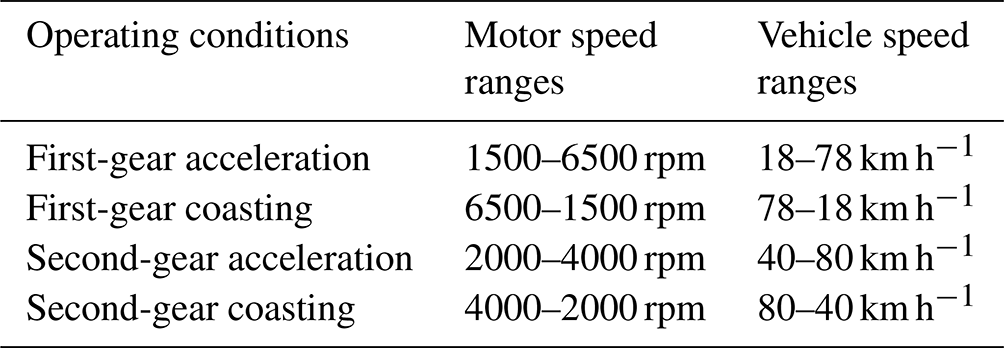
The vehicle noise test was carried out on a straight asphalt road on a sunny day with a breeze. The interior noise of the pure electric vehicle with 2EAT was determined. The testing device used was the Siemens LMS Test.Lab vibration and noise test system, which combines a high-speed multi-channel data acquisition function with a set of integrated testing, analysis and reporting tools to provide an integrated vibration and noise testing environment. The LMS test system is mainly composed of three parts: front-end sensors, data acquisition equipment and software analysis platform. The front-end sensor, a microphone, was used to collect the vehicle noise signal (Fig. 2). As shown in Fig. 3, the data acquisition device is composed of 24 data acquisition channels. Through the Controller Area Network (CAN) channel, vehicle motor speed, torque and throttle opening can be collected in real time. The software analysis platform is shown in Fig. 4. The collected time-domain noise signal can be converted into the frequency-domain signal by Fourier transform to obtain the spectrum of the signal. Through the order analysis of the spectrum, the specific noise amplitude of the corresponding order can be obtained. Test conditions are shown in Table 2.

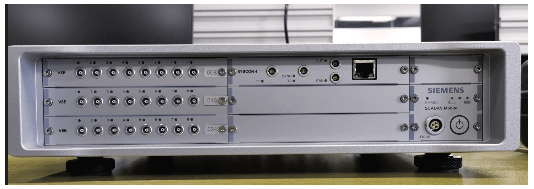
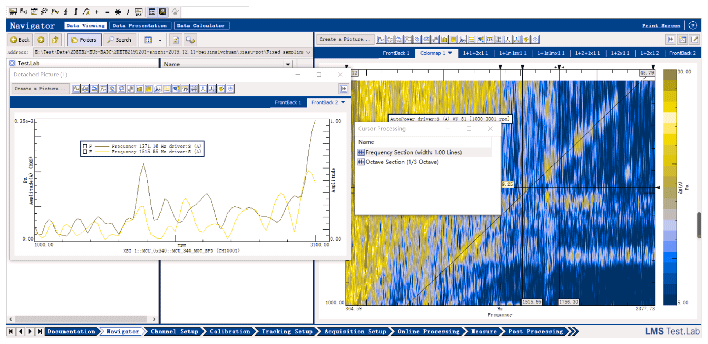
Figure 4The software analysis platform (adapted from LMS Test.Lab).
2.3 Analysis of test results
The test results are shown in Figs. 5 and 6. Low-frequency resonance bands below 400 Hz were determined in acceleration and coasting conditions of the first and second gears. The bands are generally considered to be the main frequency range of vehicle road noise, and the cavity resonance noise with a high amplitude of 200 to 300 Hz is generated by wheels in the range (Yu, 2009). This study mainly focused on the vibration and noise of the gear transmission system, so the low-frequency resonance noise was not considered. There were no obvious gear meshing order characteristics in first-gear acceleration conditions (Fig. 5). In first-gear coasting conditions (motor speed range of 5260 to 6000 rpm and noise frequency range of 540 to 610 Hz), the 6.16th-order noise was obvious. There was no obvious order characteristic in second-gear acceleration conditions (Fig. 6). In second-gear coasting conditions (motor speed range of 3110 to 3450 rpm and noise frequency range of 540 to 590 Hz), the 10.38th-order noise was obvious. In summary, the order noise was not obvious under acceleration conditions and the 6.16th- and 10.38th-order noise was obvious under coasting conditions.
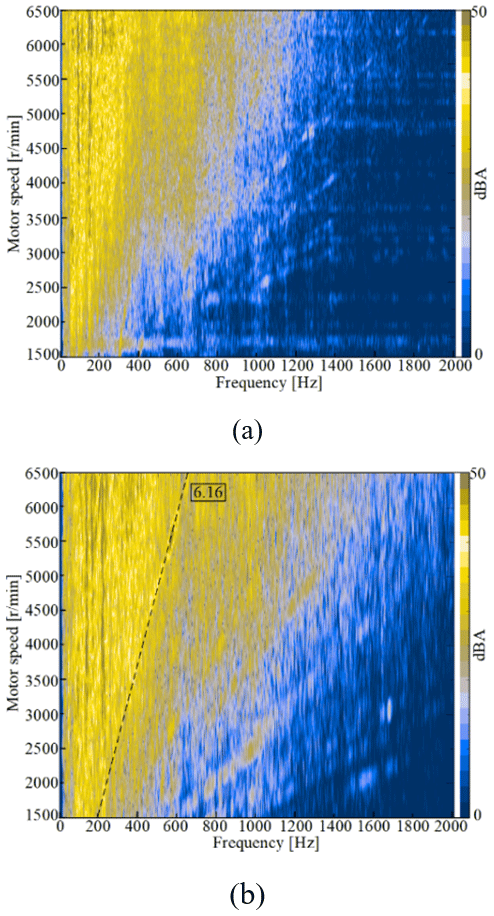
Figure 5Noise spectrum in first-gear conditions. (a) First-gear acceleration. (b) First-gear coasting.
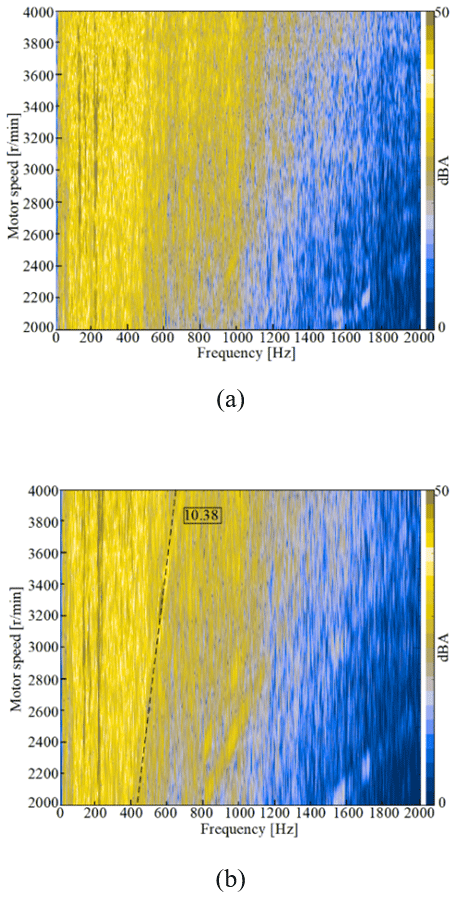
Figure 6Noise spectrum in second-gear conditions. (a) Second-gear acceleration. (b) Second-gear coasting.
To further analyze the contribution of 6.16th- and 10.38th-order noise components to total noise, the 6.16th- and 10.38th-order noise components and total noise under coasting conditions were compared (Fig. 7). The difference between the overall sound pressure level and the sound pressure level of each order component under the same working conditions is usually used as the noise risk index. When the difference is greater than 15 dB, it is generally believed that the risk of unacceptable noise is small. Therefore, the total noise pressure level minus 15 dB was used as the risk identification index in the study. The difference between the overall sound pressure level and the sound pressure level of each order component fluctuated by around 15 dB under coasting conditions (Fig. 7). In first-gear coasting conditions (motor speed range of 5260 to 6000 rpm), the sound pressure level of the 6.16th-order noise was larger and its maximum value was 7 dB larger than the risk index point. In second-gear coasting conditions (motor speed range of 3110 to 3450 rpm), the sound pressure level of the 10.38th-order noise was larger and its maximum value was 10 dB larger than the risk index point.
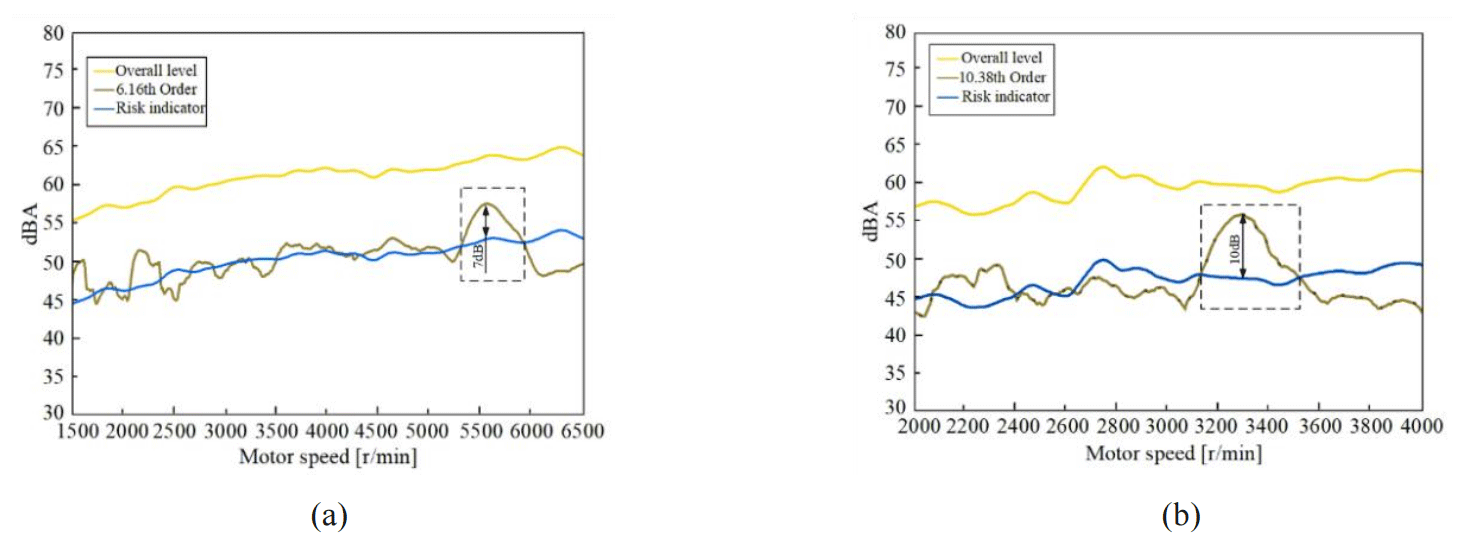
Figure 7Noise risk judgment. (a) First-gear coasting conditions. (b) Second-gear coasting conditions.
According to the calculation results of the meshing order of the 2EAT gear pair in Table 1, the 6.16th order and 10.38th order are the meshing order of the main reducer gear pair under working conditions of the first gear and the second gear, respectively. It could be determined that the meshing noise of the main reducer gear pair mainly contributed to the total noise in poor conditions. Therefore, the main reducer gear pair was determined as the object to be optimized.
3.1 A simplified model of the gear transmission system
The transmission drive system is a complex rotating structure composed of gear pairs, transmission shafts, supporting bearings and other components. With the lumped parameter method, we simplified the gear transmission system model based on the following assumptions. (1) The gear is a rigid mass with moment of inertia. (2) The meshing between gears can be regarded as a spring without mass. (3) Considering the torsional deformation of the shaft, this can also be regarded as a spring without mass. In the analysis, its mass is replaced by the moment of inertia and the spring is replaced by the stiffness coefficient. In many studies, a gear transmission system is generally simplified into a mass–spring system and the influence of shafting stiffness on the system is ignored. In the starting stage of 2EAT, the influence of shafting stiffness is large (Harris, 1958). In this study, based on the consideration of the torsional deformation of the shaft, a simplified model of the gear transmission system in first-gear conditions is shown in Fig. 8.
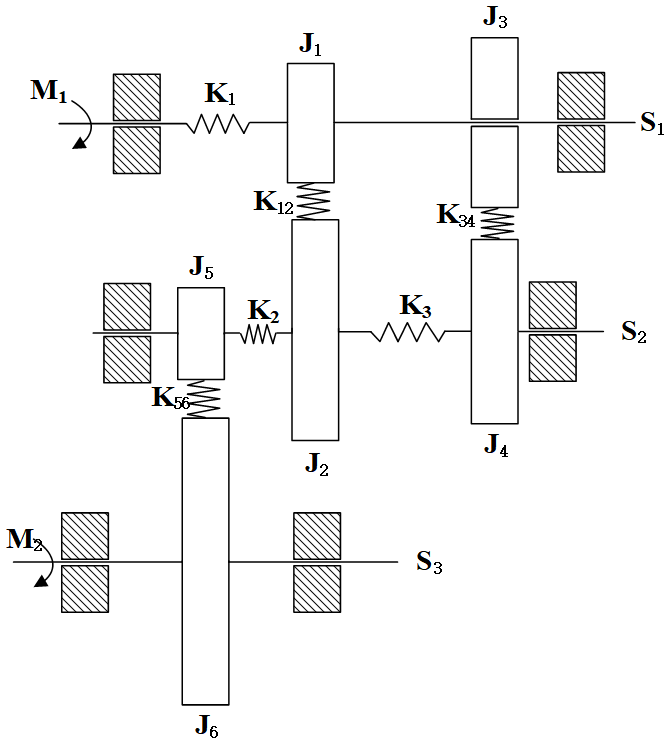
Figure 8A simplified model of the gear transmission system. J1, J2, J3, J4, J5 and J6: gear rotational inertia; K1, K2 and K3: torsional stiffness of each axis; K12, K34 and K56: meshing stiffness of each gear pair; M1: input torque; M2: output torque; S1: input shaft; S2: middle shaft; S3: output shaft.
3.2 Vibration model of the gear transmission system
The Lagrange equation of the vibration is expressed as
where is the generalized coordinate of the system and function L represents the difference between kinetic energy (T) and potential energy (V) of the system:
where
where θ0 is the initial angle for the input shaft, is the angle of each gear, and β12, β34 and β56 are the spiral angles for a gear pair. After substituting Eqs. (2), (3) and (4) into Eq. (1), the matrix equation is obtained as
where
The theoretical model of the 2EAT gear transmission system was developed to provide the theoretical basis for the subsequent analysis and optimization.
4.1 2EAT simulation model
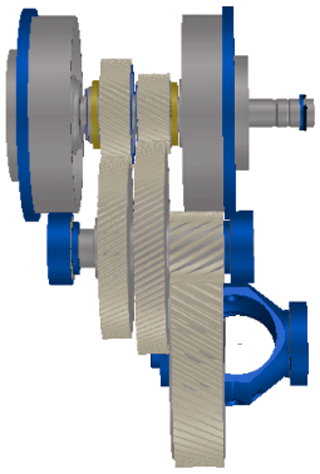
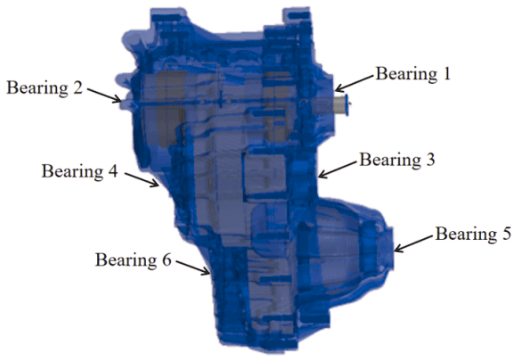
We used the Romax software for dynamic modeling. The Romax software belongs to HEXAGON and can be used to establish a virtual prototype model of the gear transmission system. The software has the functions of detailed component strength and reliability analysis and vibration and noise analysis of the transmission system and can greatly accelerate the design and development process of the transmission system. The parametric model of the 2EAT transmission system composed of clutch, shaft, bearing and gear (Fig. 9) is established in the Romax software. In the modeling process, the shaft of the transmission is firstly established and then the gears, bearings and clutches are assembled to the shaft in turn. Next, in the finite-element analysis software HyperMesh, the automatic transmission shell is divided into tetrahedral meshes and the Rigid Body Element 3 (RBE3) connection is set at the bearing hole to establish the finite-element model of the transmission shell. By compressing the finite-element model, the transmission shell is imported into the Romax model and the surface nodes at the connection between the shell and the mount are completely constrained. Finally, the 2EAT rigid–flexible coupling simulation model (Fig. 10) is obtained.
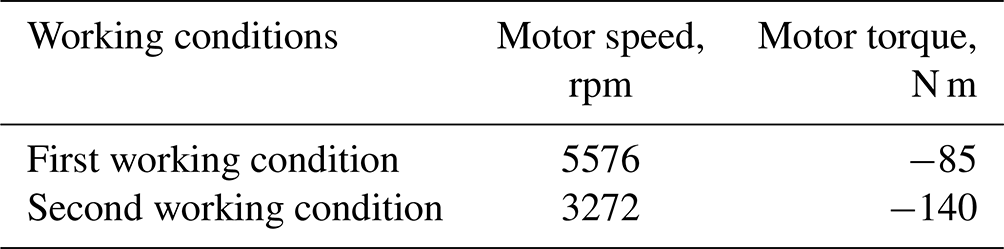
In the simulation model, based on the working conditions shown in Table 3, the simulation results can be obtained after the dynamic analysis. The simulation results mainly include transmission error, the tooth surface load distribution and the bearing dynamic response (Figs. 11 to 16).
4.2 Transmission error analysis
Transmission error (TE) refers to the difference between the actual meshing position and the theoretical meshing position of the driven wheel on the meshing line and is an important indicator to weigh the vibration and noise of gear transmission (Wang et al., 2016).
The peak value of order noise in coasting conditions is simulated. The simulation results of G1 TE and the main reducer gear pair TE under the first working condition are shown in Fig. 11. The simulation results of G2 TE and the main reducer gear pair TE under the second working condition are shown in Fig. 12.
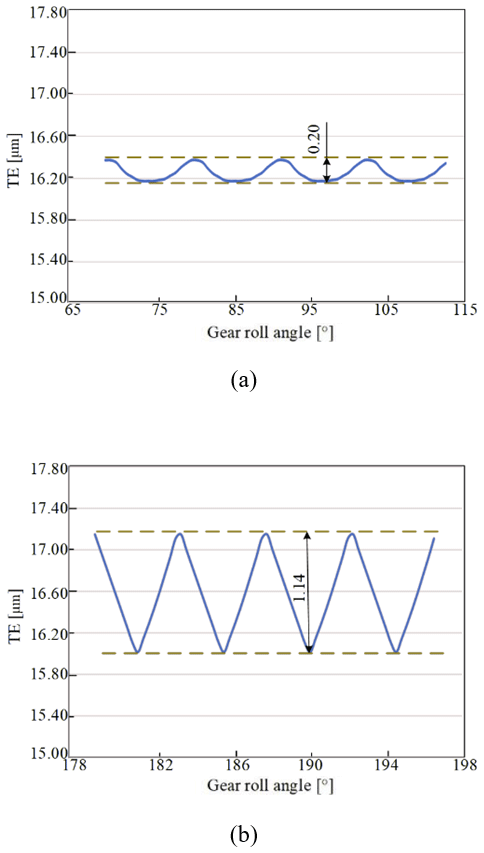
Figure 11TE of each gear pair under the first working condition. (a) G1 TE. (b) Main reducer gear pair TE.
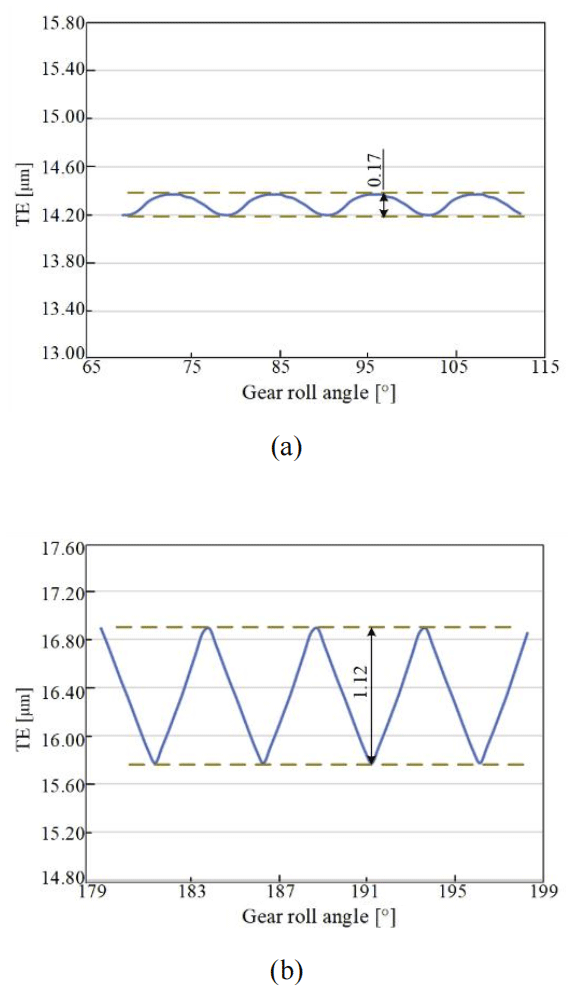
Figure 12TE of each gear pair under the second working condition. (a) G2 TE. (b) Main reducer gear pair TE.
The peak-to-peak value of TE is generally used as an important basis for weighing the gear transmission state. The peak-to-peak values of TE under different working conditions are shown in Table 4.
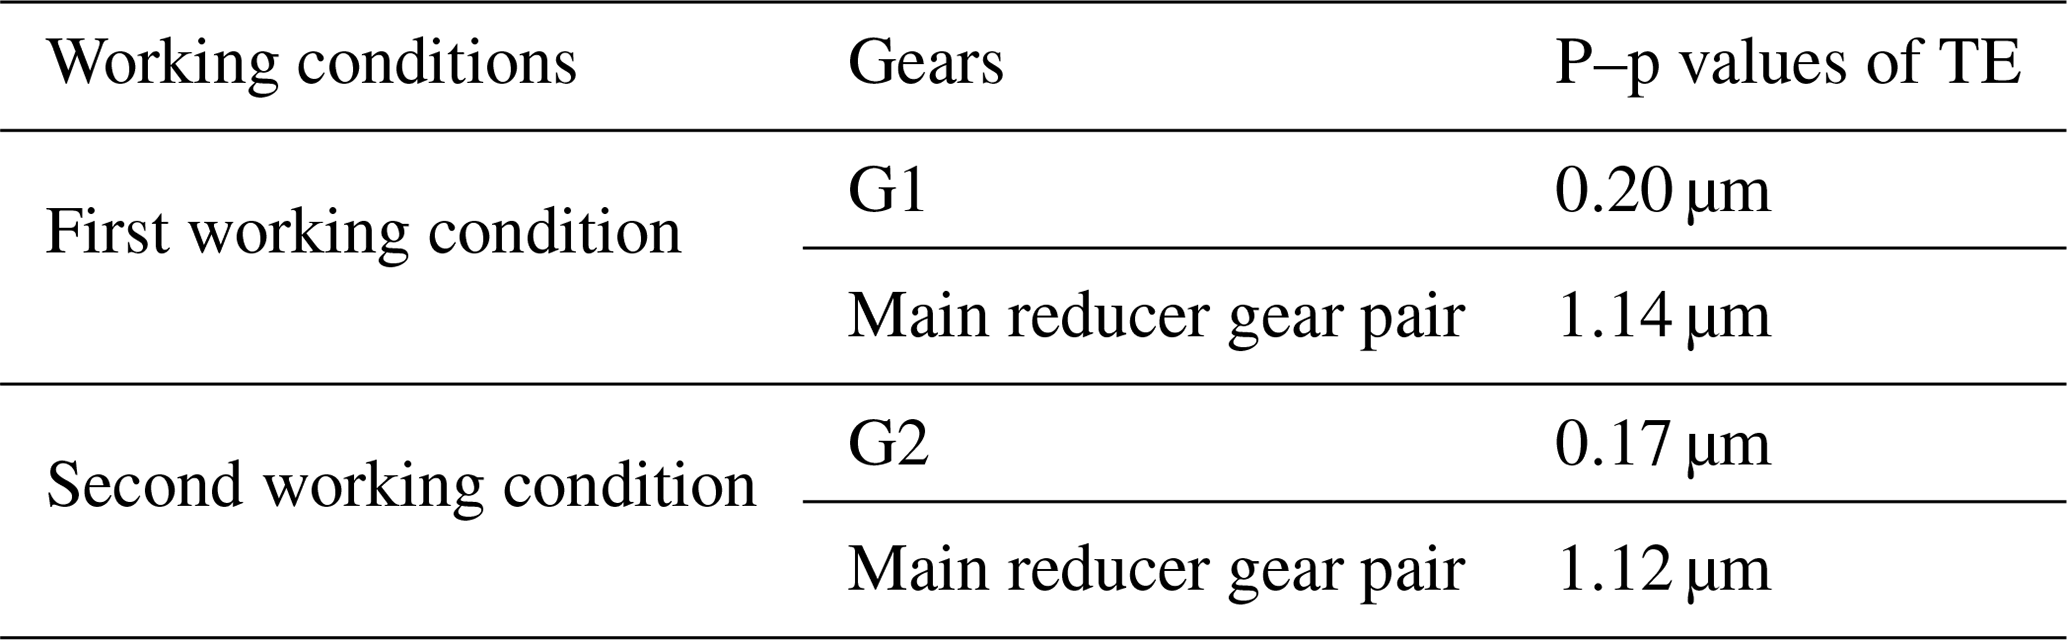
The peak-to-peak values of G1 TE and G2 TE were all less than 0.2 µm, and the peak-to-peak values of the main reducer gear pair's TE under two working conditions were, respectively, 1.14 and 1.12 µm (Table 4). Therefore, the transmission state of the main reducer gear pair was slightly worse than that of G1 and G2.
4.3 Analysis of the tooth contact state
The tooth surface load distribution is an important index to evaluate the gear meshing quality. Taking the driving tooth in each gear pair as an example, the simulation results of unit meshing length load distribution of each gear pair under the first and second working conditions are shown in Figs. 13 and 14. Under the first working condition, the maximum load per unit length of G1-driven tooth surface was 141 N mm−1 and the load distribution on the gear tooth surfaces of G1 was regular. The maximum contact stress of the gear tooth surface was concentrated on the gear center, and the stress was uniform with respect to the surrounding surface. The maximum load per unit length of the main reducer-gear-pair-driven tooth surface was 212 N mm−1. The contact stress distribution on the tooth surface of the main reducer gear pair was irregular and unconcentrated on the center of the tooth surface, and the tooth surface stress was larger than that of G1.
Under the second working condition, the maximum load per unit length of the G2-driven tooth surface was 140 N mm−1, and the load distribution on the gear tooth surfaces of G2 was regular. The maximum contact stress of the gear tooth surface was still concentrated on the gear center, and the stress was uniform with respect to the surrounding surface. The maximum load per unit length of the main reducer-gear-pair-driven tooth surface was 208 N mm−1. The contact stress distribution on the tooth surface of the main reducer gear pair was the same as the first working condition.
Under the two working conditions, the load distribution on the gear tooth surfaces of G1 and G2 was regular. The maximum contact stress of the gear tooth surface was concentrated on the gear center, and the stress was uniform with respect to the surrounding surface. The contact stress distribution on the tooth surface of the main reducer gear pair was irregular and unconcentrated on the center of the tooth surface, and the tooth surface stress was larger than that of G1 and G2. Therefore, the contact state of the main reducer gear pair was poor in the gear transmission process.
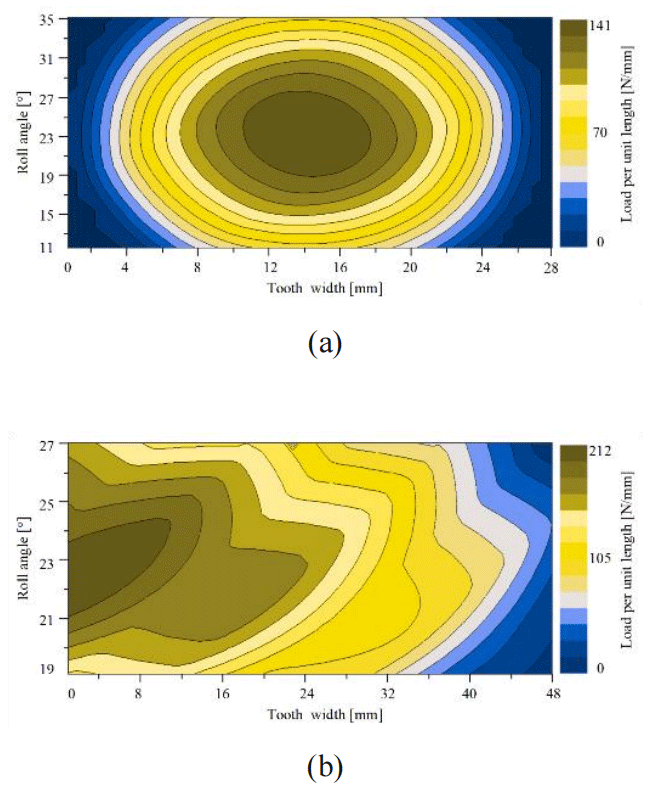
Figure 13Load distribution on the tooth surface under the first working condition. (a) G1 load distribution. (b) Main reducer gear pair load distribution.
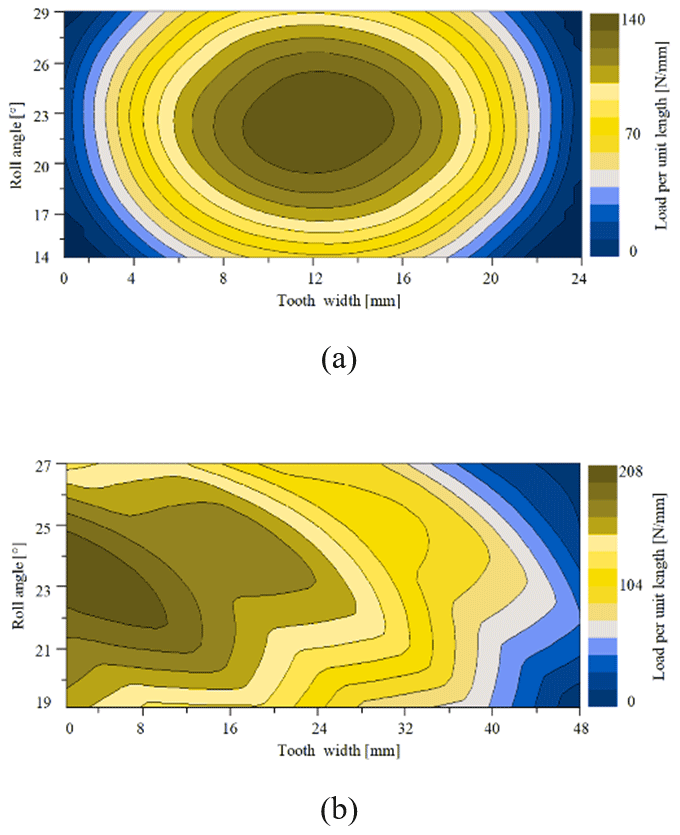
Figure 14Load distribution on the tooth surface under the second working condition. (a) G2 load distribution. (b) Main reducer gear pair load distribution.
4.4 Dynamic response analysis
The vibration of the gear is transmitted to the bearing via the shaft and then to the shell via the bearing and finally radiated outside of the shell. Therefore, it is necessary to analyze the dynamic response of the bearing under the excitation of gear transmission error. Taking the transmission errors in the main reducer gear pair under the above two working conditions as the excitation, their influence on the dynamic response of the transmission-bearing position is analyzed. The installation positions of bearings are shown in Fig. 10, and the vibration response results of each bearing are shown in Figs. 15 and 16.
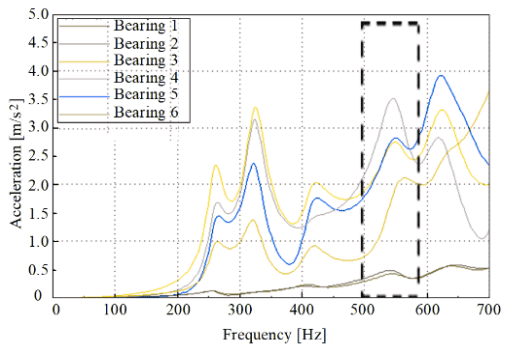
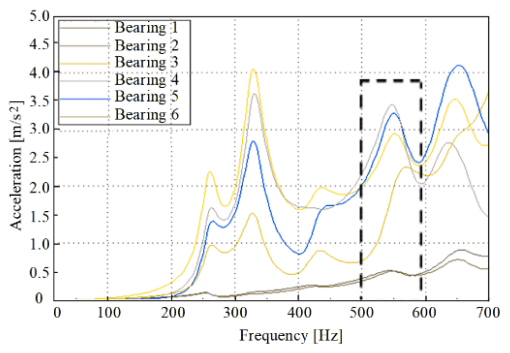
Under the two working conditions, the amplitudes at bearings 4, 5 and 6 were higher and the response peak of each bearing position appeared in the frequency range of 500 to 600 Hz. Under the first working condition, in the frequency range of 500 to 600 Hz, the peak accelerations of bearings 4, 5 and 6 were, respectively, 3.4, 3.2 and 3.3 m s−2. Under the second working condition, in the frequency range of 500 to 600 Hz, the peak accelerations of bearings 4, 5 and 6 were, respectively, 3.5, 2.8 and 2.7 m s−2. Under the excitation of the transmission error in the main reducer gear pair, the frequency range of the peak vibration acceleration of the bearings corresponded to the noise frequency range of 540 to 610 Hz obtained by the test, thus verifying the simulation results.
The above analysis of transmission error, the meshing state of the tooth surface and the dynamic response of the bearings of the gear transmission system indicated that the meshing state of the G1 and G2 gear pairs was good. In coasting conditions, the peak-to-peak value of transmission error in the main reducer gear pair was large and the tooth surface showed the partial load phenomenon and contact stress concentration. The frequency range of the higher-response amplitude of the bearing position corresponded to the frequency range of noise measured by testing. Therefore, the main reducer gear pair was determined as the object to be optimized. The state of the transmission could be improved by microscopic modifications of the gear in order to reduce the fluctuation in gear transmission error and improve the load distribution on the tooth surface.
5.1 Selection of the modification scheme
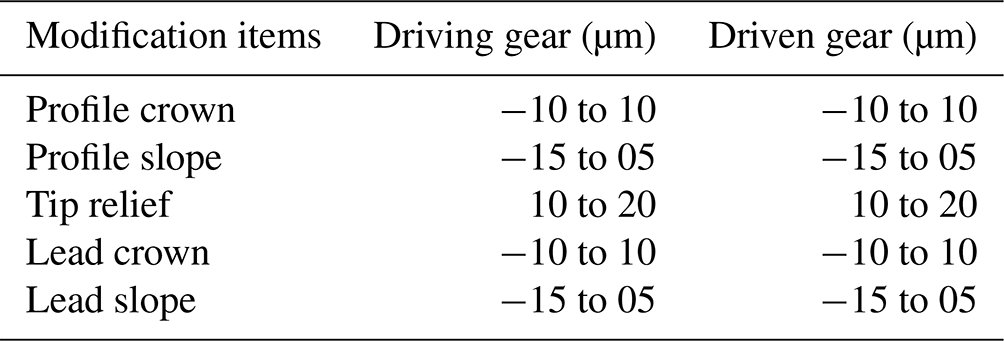
In this paper, a genetic algorithm was used for gear modification and many design variables were optimized. Based on the empirical formula of modification, the ranges of the tooth surface modification parameters of the main reducer gear pair were preliminarily determined (Table 5).
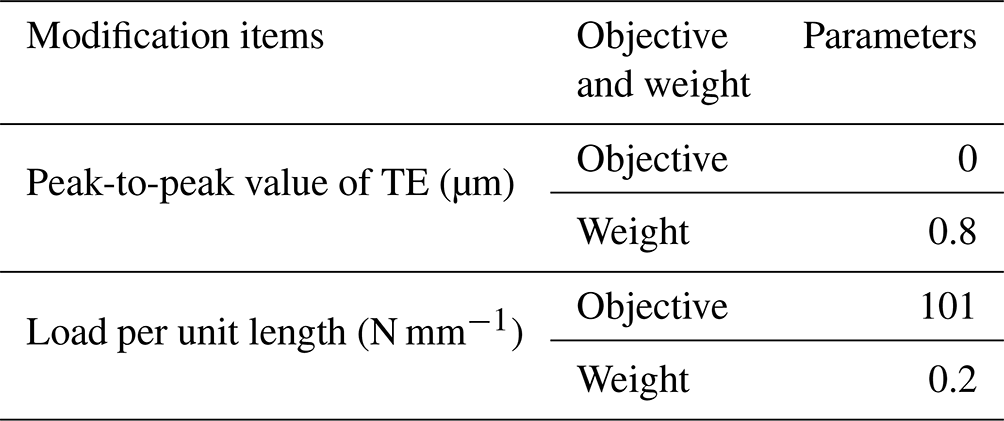
The peak-to-peak value of transmission error and the load per unit length were, respectively, determined as the main optimization objective and the secondary optimization objective. Table 6 shows the weight parameters for the optimization objectives.
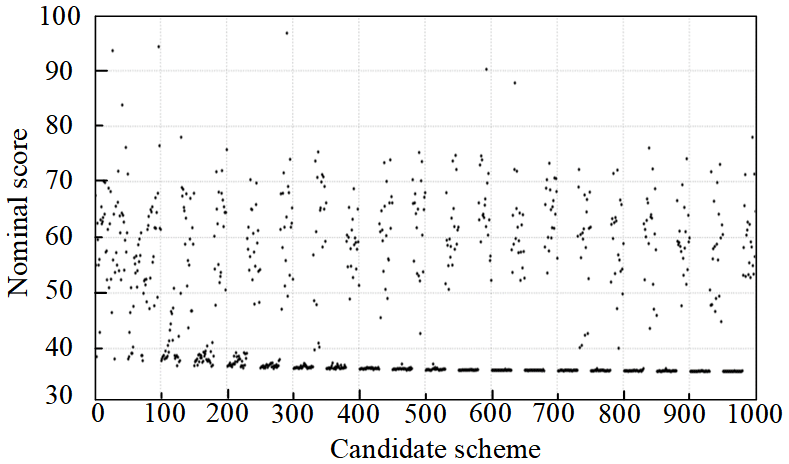
The genetic algorithm was performed after 20 genetic iterations with a crossover operator of 0.2 and a mutation operator of 0.3 under the working conditions in Table 3. Figure 17 shows the results of the nominal score and candidate schemes. The nominal score is the penalty score. In other words, the lower score corresponds to the better optimization effect. The scores of most of the 1000 schemes were between 30 and 80 points. With the increase in the number of schemes, the nominal score gradually converged.
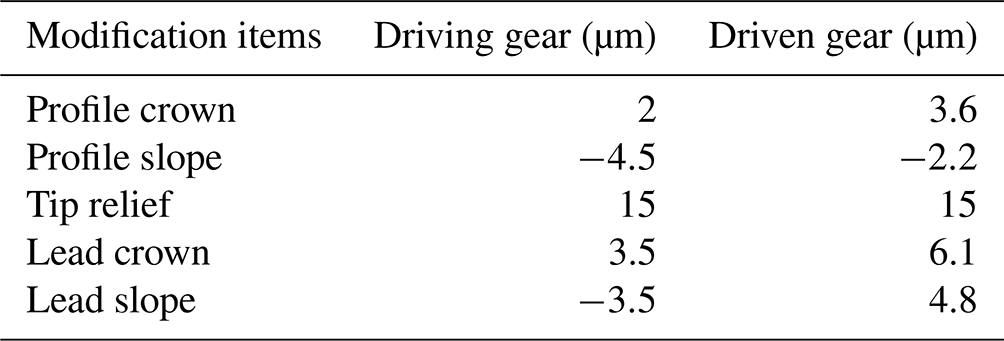
Based on the consideration of the peak-to-peak values of transmission error and load per unit length of the main gear pair under the first and second working conditions, the optimal modification scheme was obtained by genetic algorithm analysis (Table 7).
5.2 Data comparison before and after modifications
The peak-to-peak values of transmission error, the load per unit length of the tooth surface, and the bearing position response of G1, G2 and the main reducing gear pair under different working conditions before and after modifications are compared and analyzed (Figs. 18, 19, 20, 21 and 22).
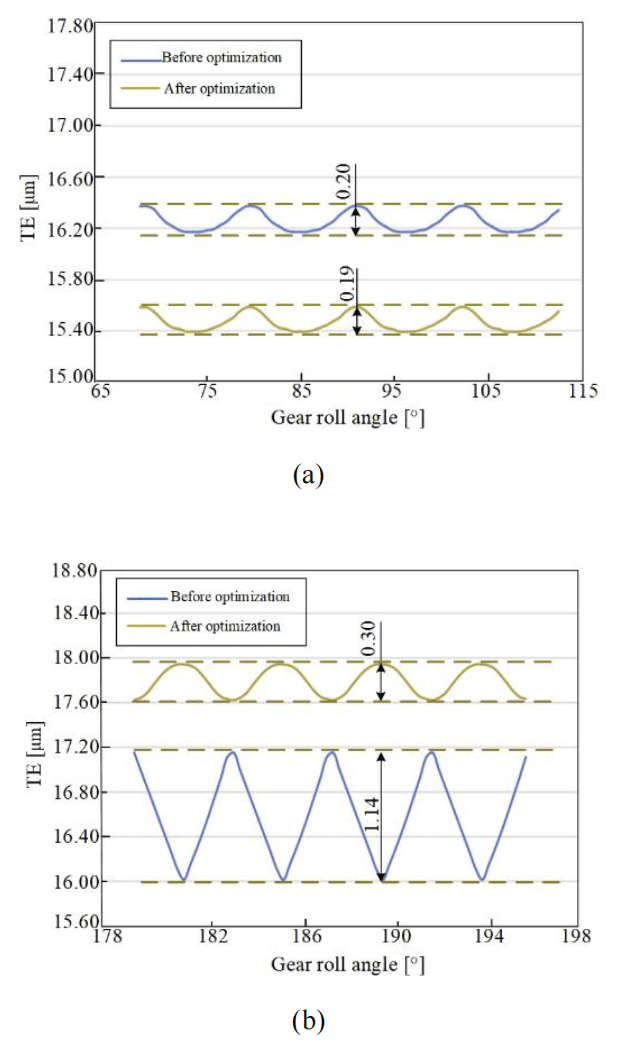
Figure 18TE under the first working condition after modifications. (a) G1 TE. (b) Main reducer gear pair TE.
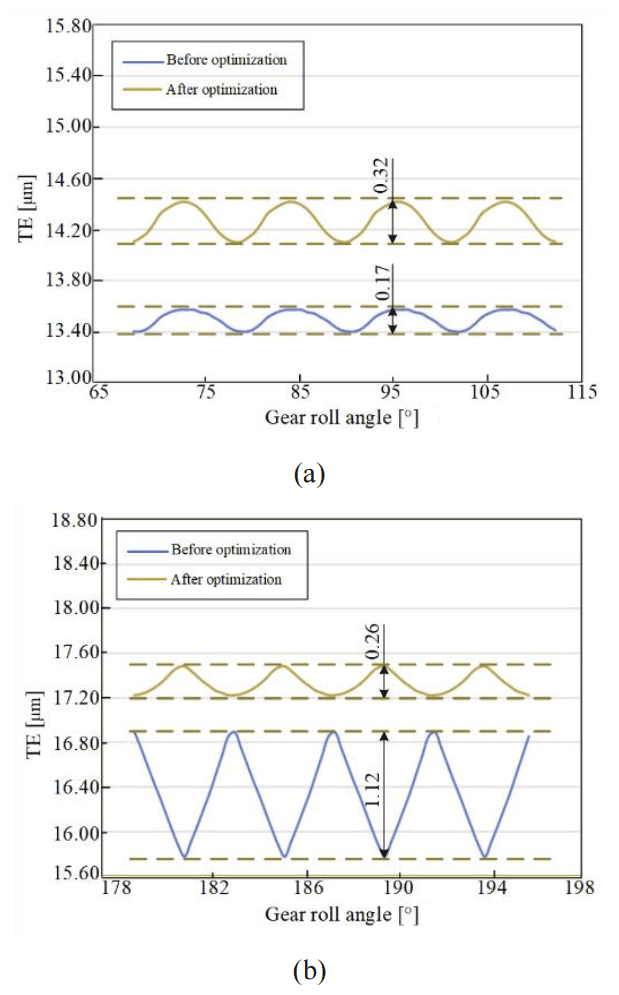
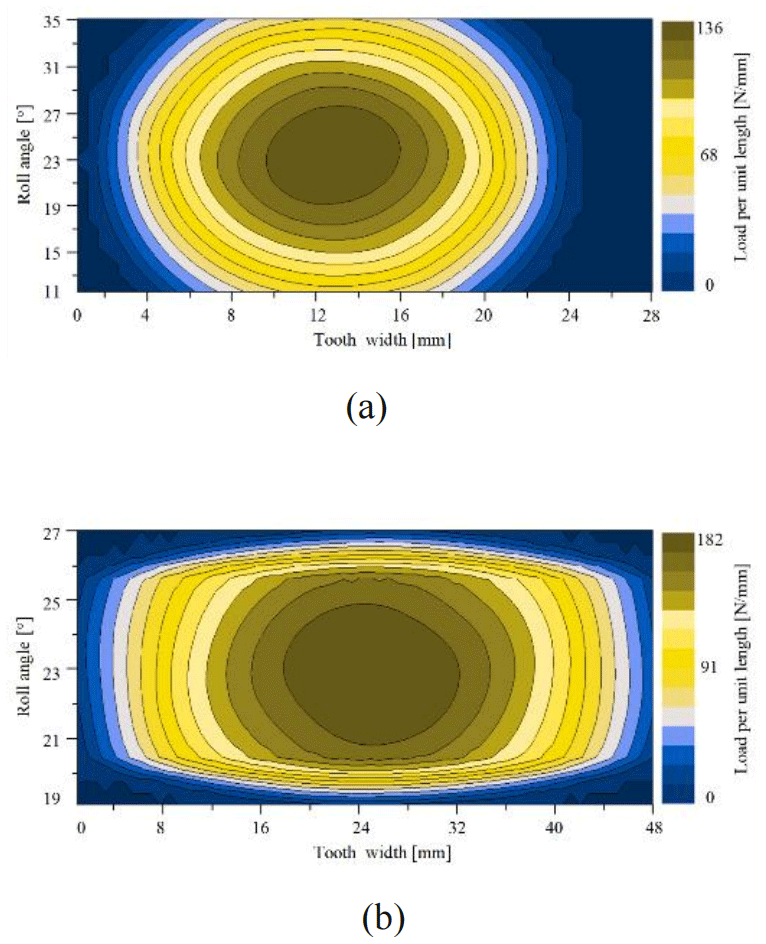
Figure 20Load distribution on the tooth surface under the first working condition after modifications. (a) G1 load distribution. (b) Main reducer gear pair load distribution.
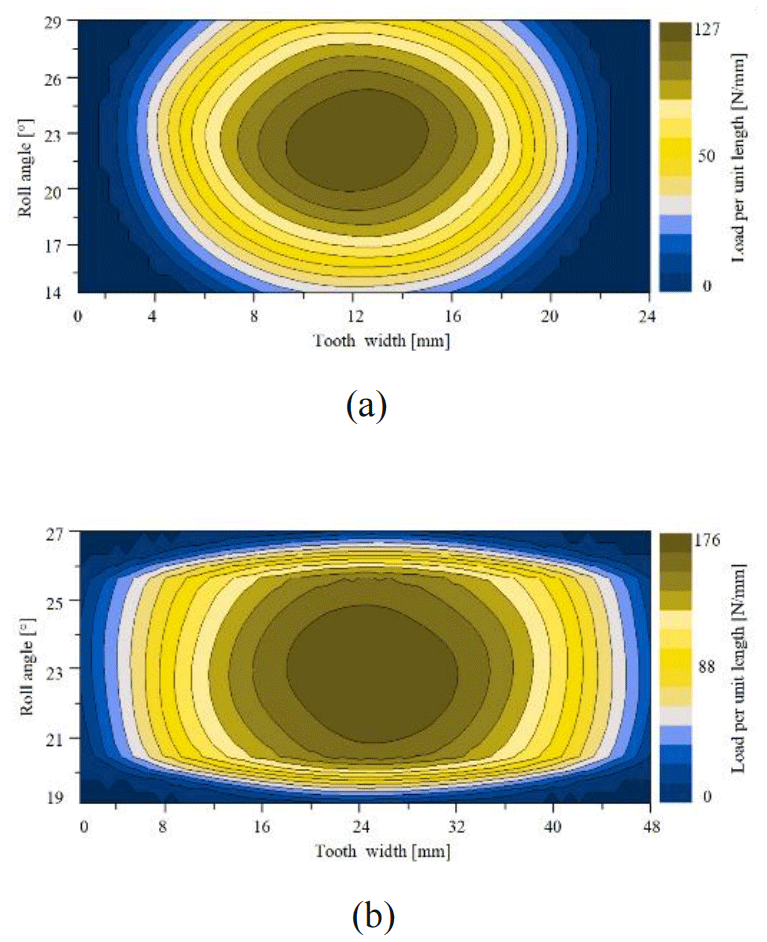
Figure 21Load distribution on the tooth surface under the second working condition after modifications. (a) G2 load distribution. (b) Main reducer gear pair load distribution.
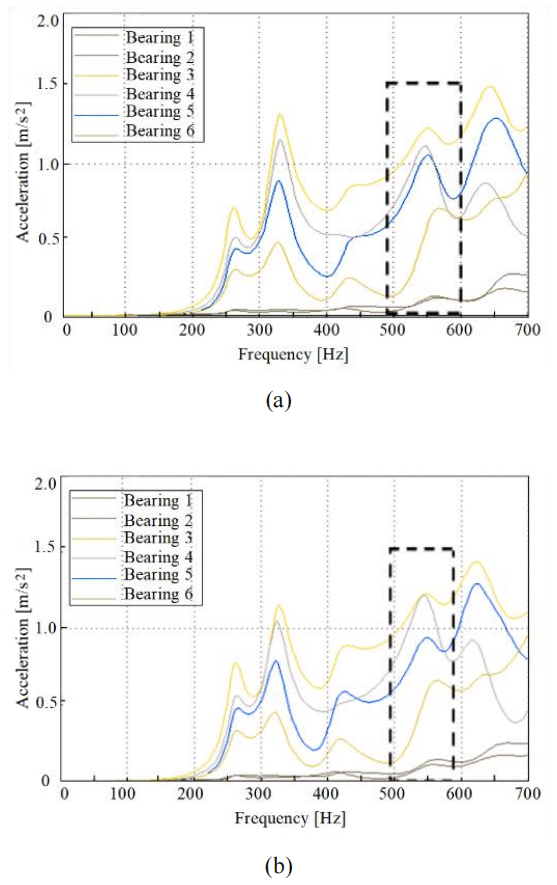
Figure 22Bearing position response after modifications. (a) First working condition. (b) Second working condition.
After modifications, the peak-to-peak value of TE of the main reducer gear pair under the first working condition was reduced by 73.68 % from 1.14 to 0.30 µm and the TE of G1 was slightly decreased from 0.20 to 0.19 µm. After modifications, the peak-to-peak value of TE of the main reducer gear pair under the second working condition was reduced by 76.78 % from 1.12 to 0.26 µm and the TE of G2 was increased from 0.17 to 0.32 µm. Although G2 TE was increased, its absolute value was not large. In summary, the TE of the main reducer gear pair had been greatly improved after modifications. In addition, the TE of the G1 or G2 gear pair did not fluctuate greatly after modifications.
After modifications, the load per unit length of the main reducer gear pair under the first working condition was decreased by 14.15 % from 212 to 182 N mm−1. The load per unit length of G1 was decreased by 3.5 % from 141 to 136 N mm−1. After modifications, the load per unit length of the main reducer gear pair under the second condition was decreased by 15.38 % from 208 to 176 N mm−1. The load per unit length of G2 was decreased by 9.28 % from 140 to 127 N mm−1. The tooth surface contact state of G1 and G2 was little changed after modifications and the load per unit length in poor conditions was reduced. The load distribution of the main reducer gear pair was changed from the original tooth surface edge to the center of the tooth surface, and the distribution became uniformly diffused. The tooth surface contact state had been greatly improved.
After optimization, the acceleration amplitude of each bearing position was averagely decreased by 56.7 % (1.7 m s−2). In the frequency range of 500 to 600 Hz corresponding to the noise working condition of the three bearings with large acceleration amplitude, under the first working condition, the peak accelerations of bearings 4, 5 and 6 were, respectively, decreased from 3.4, 3.2 and 3.3 to 1.2, 1.1 and 1.3 m s−2. Under the second working condition, the peak accelerations of bearings 4, 5 and 6 were, respectively, decreased from 3.5, 2.8 and 2.7 to 1.2, 0.9 and 1.2 m s−2. The results showed that gear modifications could effectively improve the dynamic response of the bearing position during the gear meshing process.
In summary, the gear modification optimization method can effectively reduce the fluctuation in gear TE and the excitation at bearing position and improve the meshing state of gear and the noise, vibration and harshness (NVH) performance of transmission.
Aiming to address the noise reduction problem of two-speed automatic transmission of a pure electric vehicle, in the study, through the vehicle noise test, the noise source and noise cause were analyzed and the gear modification optimization method and the gear modification effect were explored.
Firstly, the vehicle noise test was carried out and then test results were analyzed to identify the main source of noise. The sound pressure level of order noise was analyzed in detail to identify the working condition corresponding to the noise problem.
Secondly, the gear transmission system of the transmission was explored theoretically. The transmission simulation analysis model was developed to obtain the TE, load per unit length and the dynamic response of the bearing position of each gear pair. The main reducer gear pair was further determined as the main cause of the noise problem.
Thirdly, taking the main reducer gear pair as the optimization object, gear modification was carried out with a genetic algorithm. The simulation results before and after modifications were compared. The comparison results showed that the optimization effects of gear modifications on the TE, the gear meshing state and the dynamic excitation of the bearing position were significant.
The study provides the basis for the optimization of the vibration and noise of the transmission system of pure electric vehicles. Due to the limited study period, the optimized transmission is still at the production stage. A vehicle noise test and subjective assessment will be performed in the future.
All code included in this study is available upon request by contacting the corresponding author.
The data used in this study did not originate from the internet but rather from the author's simulation and experimental results. If necessary, please feel free to contact the corresponding author.
SZ was responsible for organizing the paper structure. LS performed all of the experiments and finalized the paper. YH and WX provided the research direction of this paper and collected the research literature.
The contact author has declared that none of the authors has any competing interests.
Publisher’s note: Copernicus Publications remains neutral with regard to jurisdictional claims in published maps and institutional affiliations.
The authors wish to thank Beijing University of Technology for its support.
This paper was edited by Daniel Condurache and reviewed by three anonymous referees.
Abe, T., Bonhard, B., Cheng, M. T., Bosca, M., and Na, L.: High Frequency Gear Whine Control by Driveshaft Design Optimization, SAE 2003 Noise & Vibration Conference and Exhibition, Traverse City, Michigan, United States, 5 May 2003, https://doi.org/10.4271/2003-01-1478, 2003.
Ando, K., Kanda, Y., Fujita, Y., Hamdi, M. A., and Mrkholt, J.: Analysis of High Frequency Gear Whine Noise by Using an Inverse Boundary Element Method, SAE 2005 Noise and Vibration Conference and Exhibition, Traverse City, Michigan, United States, 16 May 2005, https://doi.org/10.4271/2005-01-2304, 2005.
Choi, C., Ahn, H., Yu, J., Han, J.-S., Kim, S.-C., and Park, Y.-J.: Optimization of Gear Macro-geometry for Reducing Gear Whine Noise in Agricultural Tractor Transmission, Comput. Electron. Agr., 188, 106358, https://doi.org/10.1016/j.compag.2021.106358, 2021.
Choy, F. K., Ruan, Y. F., Tu, Y. K., Zakrajsek, J. J., and Townsend, D. P.: Modal Analysis of Multistage Gear Systems Coupled With Gearbox Vibrations, J. Mech. Design, 114, 486–497, https://doi.org/10.1115/1.2926577, 1992.
Harris, S. L.: Dynamic Loads on the Teeth of Spur Gears, P. I. Mech. Eng., 172, 87–112, https://doi.org/10.1243/PIME_PROC_1958_172_017_02, 1958.
He, H.: Dynamic and Economy Analysis and Simulation for Energy Vehicles, Automobile Parts, 3, 18–22, https://doi.org/10.3969/j.issn.1674-1986.2016.03.005, 2016.
Holehouse, R., Shahaj, A., Michon, M., and James, B.: Integrated Approach to NVH Analysis in Electric Vehicle Drivetrains, The Journal of Engineering, 2019, 3842–3847, https://doi.org/10.1049/joe.2018.8247, 2019.
Hou, L., Lei, Y., Fu, Y., and Hu, J.: Effects of Lightweight Gear Blank on Noise, Vibration and Harshness for Electric Drive System in Electric Vehicles, P. I. Mech. Eng., 234, 447–464, https://doi.org/10.1177/1464419320915006, 2020.
Lee, S.-H. and Park, K.-P.: Development of a Prediction Model for the Gear Whine Noise of Transmission Using Machine Learning, Int. J. Precis. Eng. Man., https://doi.org/10.1007/s12541-023-00845-0, 2023.
Li, D., Wu, G., and Wu, H.: Multi-body Dynamics Modeling and Analysis of Transmission Gear Rattle, Journal of Mechanical Transmission, 39, 64–68, https://doi.org/10.16578/j.issn.1004.2539.2015.12.013, 2015.
Mao, K.: Helical Gear Contact Simulations and Their Applications in Automotive Transmission Systems, Mech. Mach. Sci., 124, 371–381, https://doi.org/10.1007/978-3-031-29815-8_36, 2023.
Shu, Y., Liu, Z., Sun, X., Zhang, Y., and He, W.: Micro Modification Analysis of Two - speed Transmission Based on Romax, Journal of Dalian Jiaotong University, 41, 5 pp., https://doi.org/10.13291/j.cnki.djdxac.2020.01.012, 2020.
Singh, P. K. and Sai, A.: Study of Effect of Variation in Micro-Geometry of Gear Pair on Noise Level at Transmission, in: Symposium on International Automotive Technology 2015, Pune, India, 14 January 2015, https://doi.org/10.4271/2015-26-0130, 2015.
Wang, H., Wu, X., and Zhang, Y.: Contact Analysis and Modification Optimization of Helical Gear, Journal of Mechanical Transmission, 40, 73–77, https://doi.org/10.16578/j.issn.1004.2539.2016.12.016, 2016.
Xiang, L. and Zuo, S.: Experimental Study on Vibration and Noise Characteristics of Automobile Manual Transmission, Manufacturing Automation, 35, 4, https://doi.org/10.3969/j.issn.1009-0134.2013.06.15, 2013.
Yang, S.: Nonlinear Dynamic Model of Gear Transmission System Under the Influence of Vibration and Noise, Nanotechnology for Environmental Engineering, 7, 759–763, https://doi.org/10.1007/s41204-021-00210-4, 2022.
Yu, X.: Improved Method of Tire Cavity Resonance Noise, Journal of South China University of Technology, 37, 5, https://doi.org/10.3321/j.issn:1000-565X.2009.07.018, 2009.
Zhang, S.: Parameter Study and Improvement of Gearbox Whine Noise in Electric Vehicle, Automotive Innovation, 1, 272–280, https://doi.org/10.1007/s42154-018-0029-5, 2018.
- Abstract
- Introduction
- Vehicle noise test and result analysis
- Vibration analysis of the gear transmission system
- Simulation model and simulation result analysis
- Optimal design and comparison
- Conclusion and outlook
- Code availability
- Data availability
- Author contributions
- Competing interests
- Disclaimer
- Acknowledgements
- Review statement
- References