the Creative Commons Attribution 4.0 License.
the Creative Commons Attribution 4.0 License.
 | 09 Aug 2023
Gait analysis algorithm for lower limb rehabilitation robot applications
Li Zheng
Tao Song
When patients with lower limb dyskinesia use robots for rehabilitation training, gait parameters are of great significance for disease diagnosis and rehabilitation evaluation. Gait measurement is usually carried out by using optical motion capture systems, pressure plates and so on. However, it is difficult to apply these systems to lower limb rehabilitation robots due to their high price, limited scope and wearing requirements. At the same time, most of the current applications in robots focus on the basic gait parameters (such as step length and step speed) for robot control or user intention recognition. Therefore, this paper proposes an online gait analysis algorithm for lower limb rehabilitation robots, which uses a lidar sensor as the gait data acquisition sensor. The device is installed on the lower limb rehabilitation robot, which not only avoids the problems of decline in the detection accuracy and failure of leg tracking caused by lidar placement on the ground, but it also calculates seven gait parameters, such as step length, stride length, gait cycle and stance time, with high precision in real time. At the same time, the walking track of the patient may not be straight, and the lidar coordinate system is also changed due to the movement of the lower limb rehabilitation robot when the patient moves forward. In order to overcome this situation, a spatial parameter-splicing algorithm based on a time series is proposed to effectively reduce the error impact on gait spatiotemporal parameters. The experimental results show that the gait analysis algorithm proposed in this paper can measure the gait parameters effectively and accurately. Except for the swing time and double support time, which are calculated with large relative errors due to their small values, the relative errors of the remaining gait parameters are kept below 8 %, meeting the requirements of clinical applications.
- Article
(13569 KB) - Full-text XML
- BibTeX
- EndNote


In recent years, lower limb rehabilitation robots have been widely used in rehabilitation training due to their advantages of task repeatability, motion controllability, measurement reliability and high feedback (Qian and Bi, 2015). They mainly helps patients with lower limb dyskinesia from conditions such as stroke, Parkinson's disease, spinal cord injury and so on to carry out dependent ambulation and gradually improve their gait. In addition, the analysis of patients' gait under the lower limb rehabilitation robot can provide objective and accurate evaluation parameters for rehabilitation doctors. The study has shown that quantitative gait analysis is helpful in the early diagnosis of disease and detection of the patients' rehabilitation status in clinical applications. Quantitative data will also enhance their confidence in recovery (Prakash et al., 2018). Traditionally, most hospitals adopt the visual observation method, in which doctors directly observe the walking state of patients and make a subjective judgment of the patient's condition according to their experience. Compared with quantitative analysis based on instruments, this is subjective and has low retest reliability.
With the development of sensor technology, quantitative gait analysis has gradually attracted extensive attention and research. At present, methods of gait feature extraction are mainly divided into several categories: collecting image data of human movement for detection and tracking, feature extraction identification and the establishment of human models (Ahmed et al., 2015; Hynes et al., 2021; Wagner et al., 2023); attaching external markers captured by optical systems (Hutchison et al., 2015; Matjačić et al., 2017; Ziegler et al., 2020) and capturing gait information such as ground reaction force through force plates with dense and high-frequency pressure sensor arrays (Costilla-Reyes et al., 2019; Singh et al., 2017; Vera-Rodriguez et al., 2011). However, the devices used in these methods are often not easily applied to the general public due to their high costs, high hardware requirements, large space requirements and limited scope. Instead, some scholars use wearable sensors of relatively small size to analyze gait, for instance, integrating and attaching inertial sensors (accelerometers, gyroscopes, etc.) to the body surface (thighs, back or feet, etc.) and measuring acceleration and angular velocity changes during walking (Buckley et al., 2020; Gurchiek et al., 2020; Q. Ji et al., 2018; Li et al., 2020); embedding sensors (pressure sensors, accelerometers or gyroscopes) into shoes, socks or insoles (Amitrano et al., 2020; Eizentals et al., 2018; Wang et al., 2019) and integrating sensor systems to construct three-dimensional human joint motion (Baghdadi et al., 2018; Li et al., 2018; Liu et al., 2011). Nevertheless, compared with problems such as poor universality, high wearing requirements and complex operation of wearable sensors, recently, some researchers have put forward the method of measuring gait parameters with lidar sensors as they are low cost and easy to set up and move (Duong and Suh, 2020; Iwai et al., 2019; Yorozu et al., 2015a, b).
Gait analysis has been widely used in assisting robotic control strategies (Cifuentes and Frizera, 2016; Shi et al., 2020; Ye et al., 2020), detecting abnormal gait and assisting machines to ameliorate patients' gait (Lim et al., 2016). Among them, regarding the aspect of gait analysis using lidar, because the sensor itself is characterized by small size and non-contact measurement, it is very suitable for installation on mobile devices. At the moment, there is much research on lidar in mobile robots (Piezzo et al., 2017; Yorozu and Takahashi, 2016, 2020) and intelligent walkers (Bayón et al., 2017; Xu et al., 2018).
In Yorozu and Takahashi (2020), the lidar sensor is mounted on the service robot to track the gait and estimate the pedestrian's body direction, such as forward, backward, U-turn and other movements, namely position, speed and leg state. In Yorozu and Takahashi (2016), the proposed leg detection method can effectively identify the cross steps, reduce the possibility of losing track of legs and better serve the safety collision avoidance of autonomous mobile robots. It realizes leg detection through leg pattern recognition and data association analysis. In Piezzo et al. (2017), a service robot for monitoring and encouraging the elderly to walk is proposed, and the step length of the elderly is measured by lidar. In Xu et al. (2018), a walking-aid robot system is proposed that uses a force-sensing resistor and a laser ranging finder to detect the intended human motion expressed by the user's upper and lower limbs so as to detect if the user is going to fall. A rehabilitation robotic platform for patients with cerebral palsy is proposed in Bayón et al. (2017). Among them, the system is based on the motion control of detecting the user's leg position and motor movement to control the linear speed of the platform, so as to improve the dependence of patients in the rehabilitation process.
In summary, most of the cases applied to robots are focused on gait serving robot control, user intention recognition and gait cycle identification based on offline models. However, the current gait analysis method is rarely applied to lower limb rehabilitation robots. Traditional detection methods also have a variety of problems: due to the complexity of the lower limb rehabilitation robot structure, there is usually an occlusion problem. At the same time, the test subjects need to wear external markers and ensure that the markers will not loosen or fall off easily during the test, which is not suitable for daily walking training of patients. As walking training with rehabilitation robots usually requires long distances, some sensors (such as inertial sensors and floor pressure sensors) cannot meet the measurement requirements well. Based on this, this paper selects a non-contact lidar sensor to collect data, which is installed on the lower limb rehabilitation robot. Without affecting daily rehabilitation training, it can also avoid the problems of decreased detection accuracy and leg tracking failure caused by the lidar sensor being placed on the ground.
Although sensors for measuring gait parameters have been proposed and evaluated in many studies, all literature on measuring gait parameters with lidar has adopted an offline model. In addition, in several algorithms based on other sensors, the fixed threshold (Li et al., 2021) and adaptive threshold methods (Bejarano et al., 2015) have been proposed.
In this paper, an online gait analysis algorithm applied to lower limb rehabilitation robot is designed. Based on the gait point cloud data collected by lidar, seven gait parameters including step length, stride length, gait cycle, stance time, step time, swing time and double support time are calculated with high accuracy in real time through four core algorithms: adaptive classification based on a sliding threshold, leg contour extraction, gait phase division and gait parameter calculation. Meanwhile, compared with the previous gait algorithm, which calculated the difference between the left and right legs in the y axis direction as the approximate spatial parameter, a spatial parameter-splicing algorithm based on a time series is proposed to effectively reduce the error influence of lidar coordinate changes and oblique walking trajectory on the gait spatiotemporal parameters. Based on the above gait algorithm, a dynamic window method is proposed, with 100 data points as the dynamic window. In addition, the method can identify the gait in real time at a sampling frequency of 10 Hz and calculate the gait parameters online. Finally, the optical motion capture system is used as a reference system to verify the feasibility and accuracy of the proposed gait analysis algorithm.
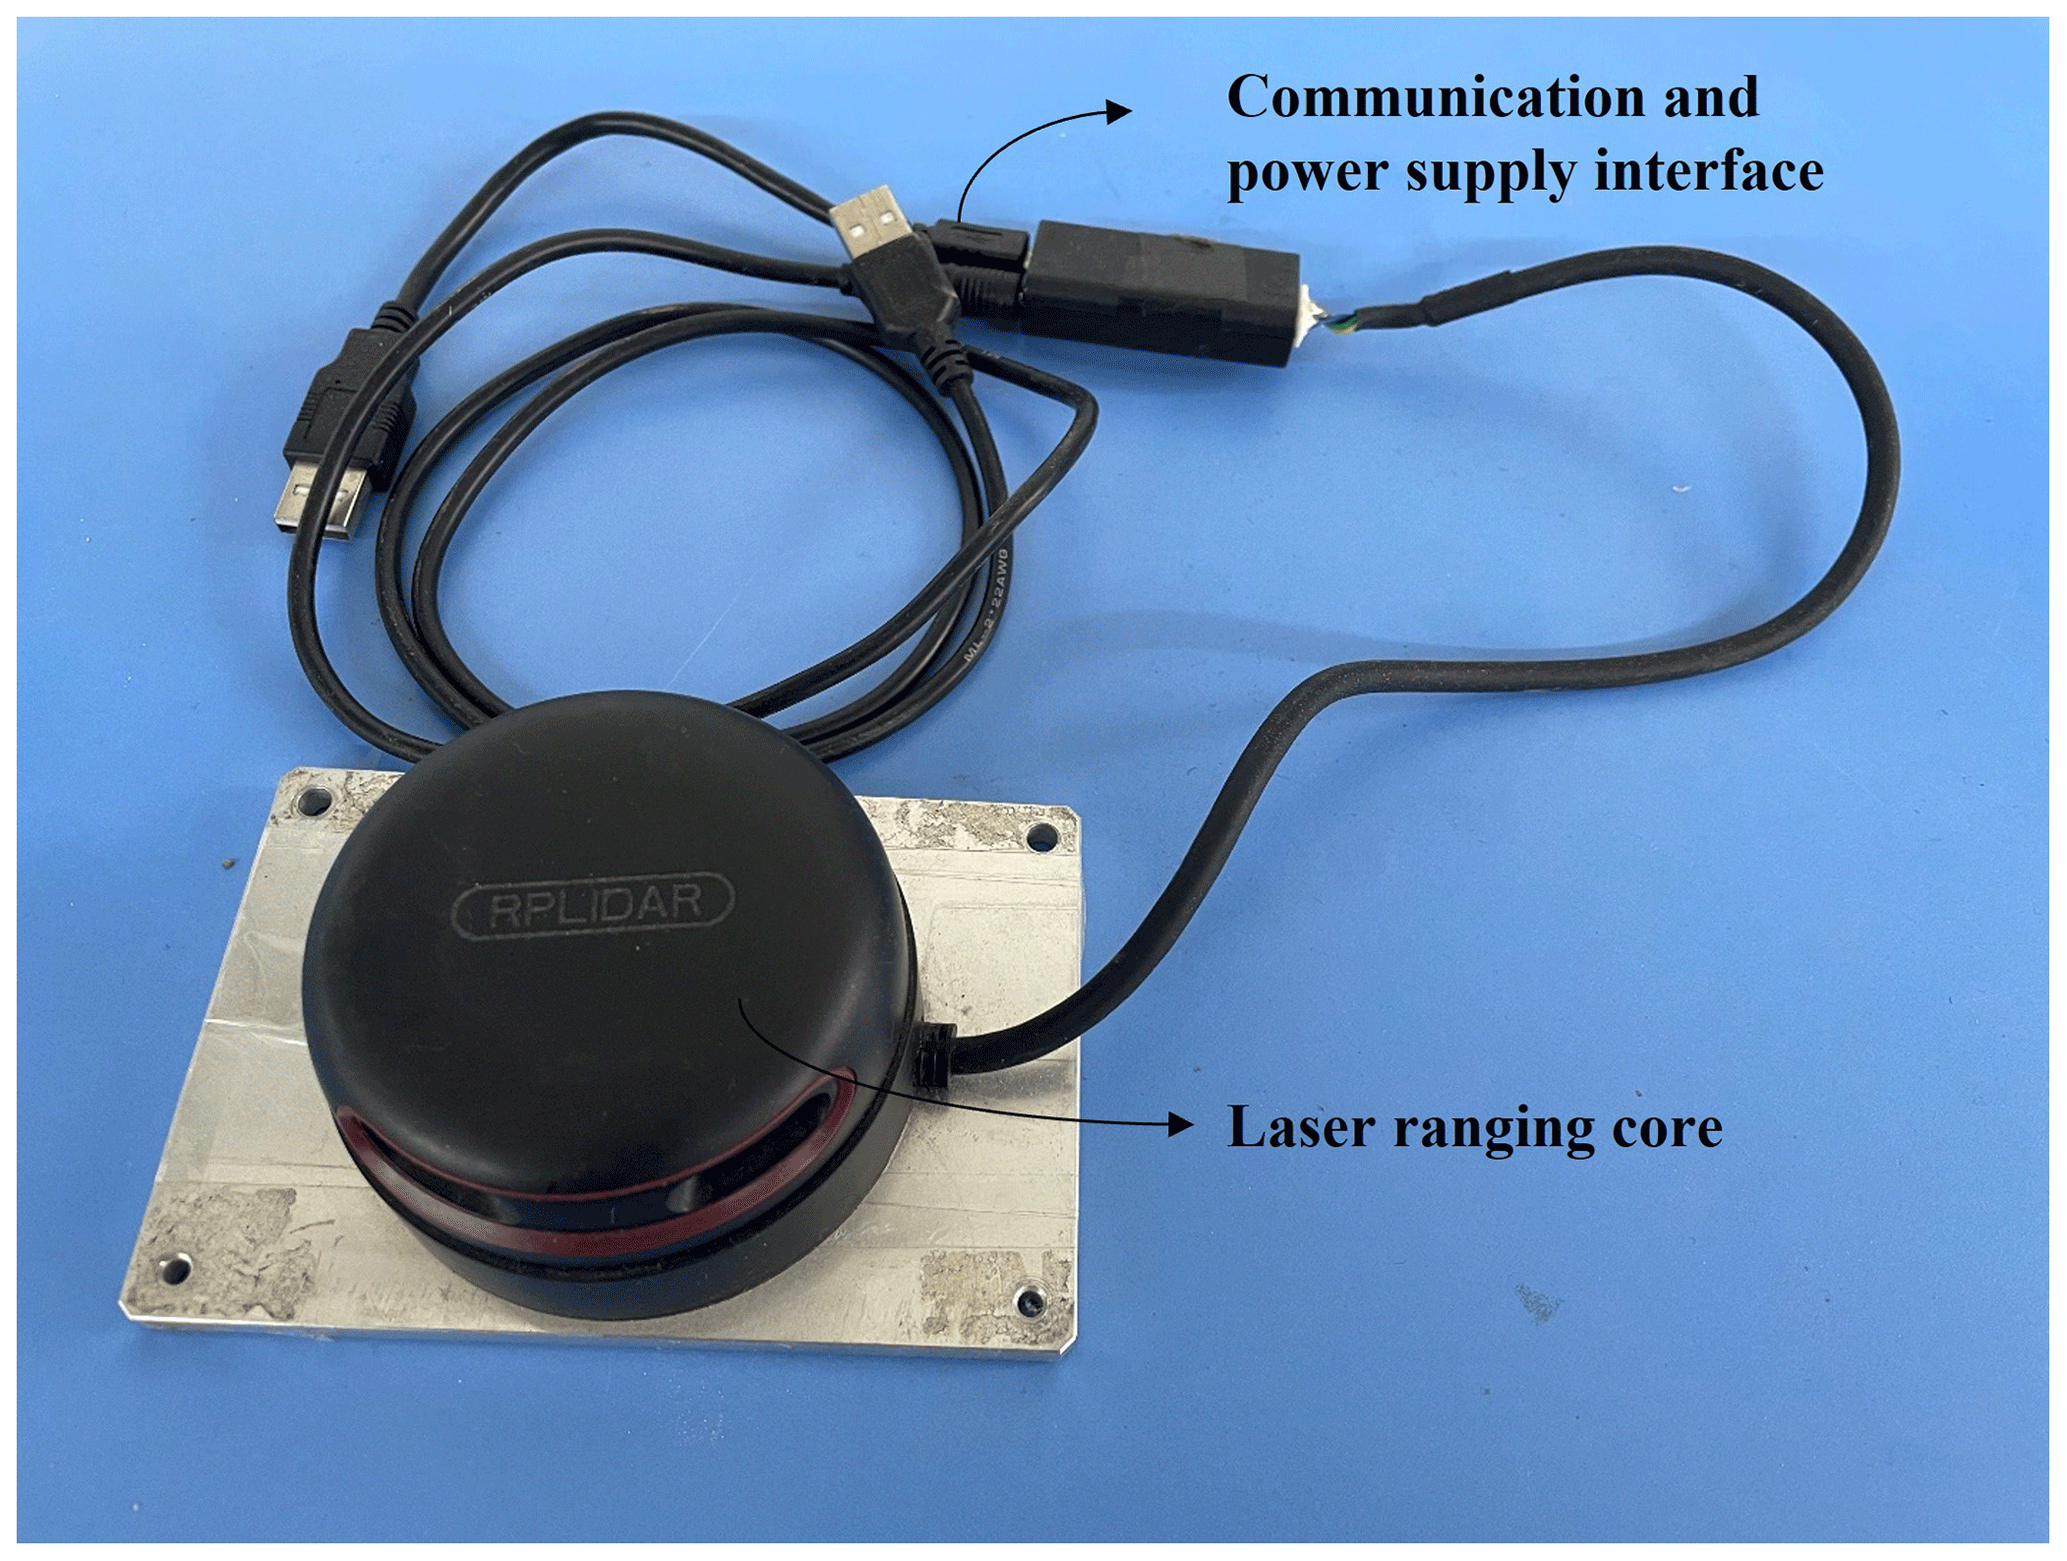
In this paper, a two-dimensional lidar sensor (RPLIDAR A2M8, Shanghai Silan Technology Co., LTD., Shanghai, China) with a scanning frequency of 5–15 Hz (typical value is 10 Hz) selected. The lidar sensor is connected with a driving board. External devices power and transmit data through two USB interfaces of the driving board, as shown in Fig. 1.
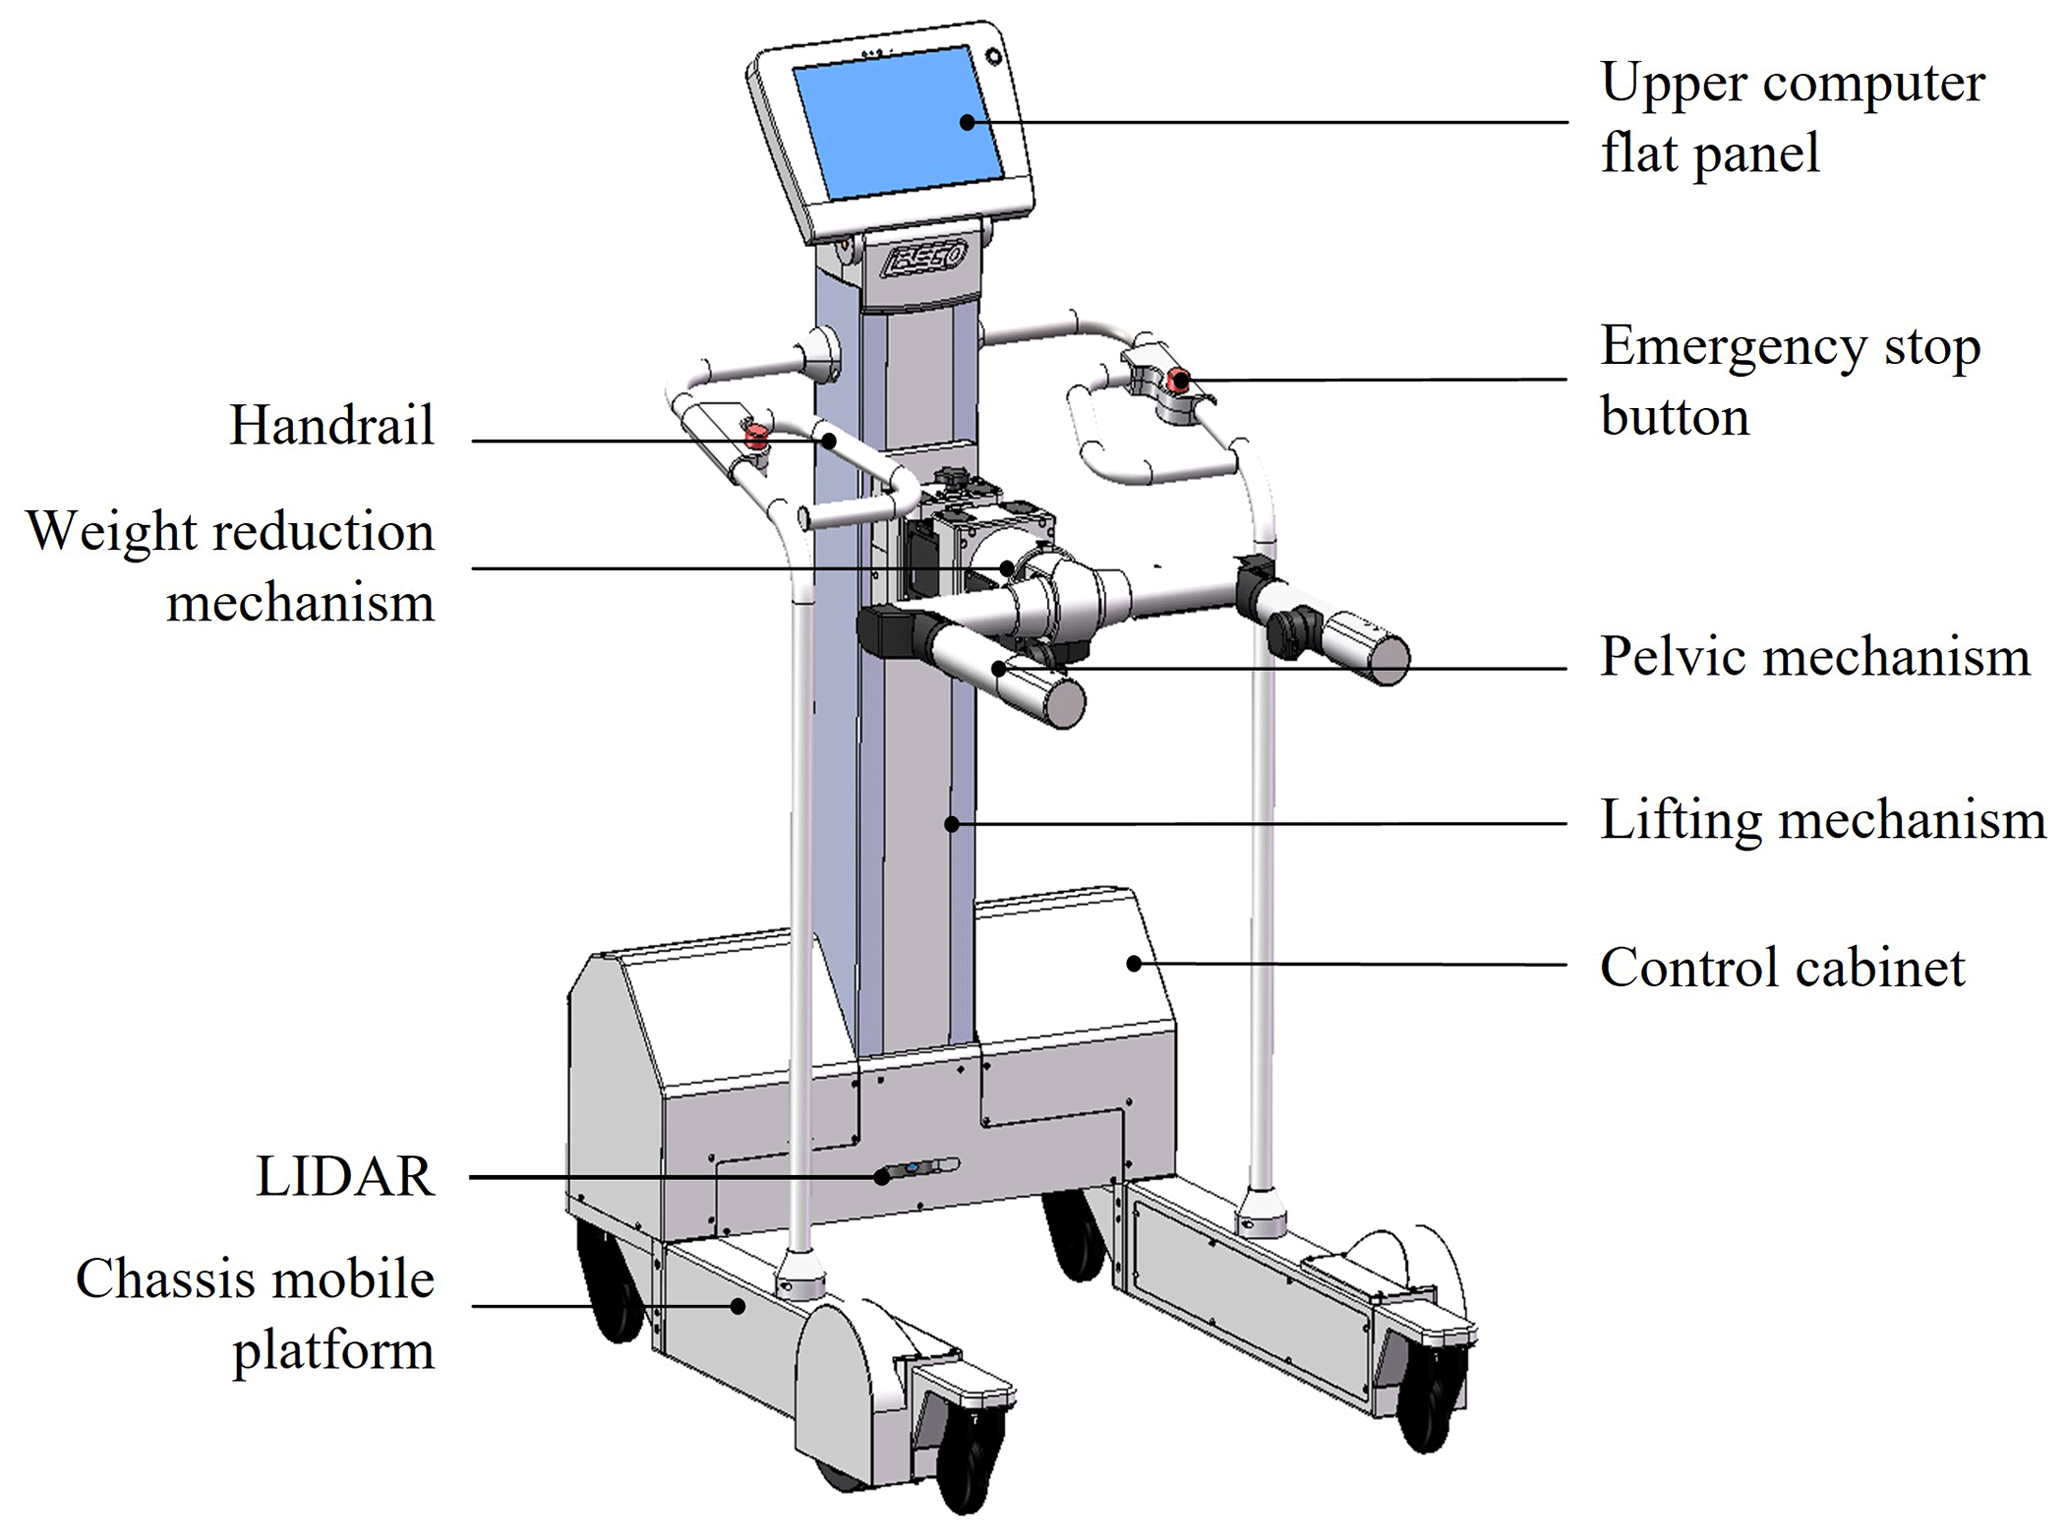
The robot used in this paper is the iReGo lower limb rehabilitation robot independently developed by our research group (J. C. Ji et al., 2018). The gait analysis system is divided into three parts: lidar, lower computer and upper computer of the lower limb rehabilitation robot. In order to more clearly describe the lower limb rehabilitation robot in this paper, Fig. 2 shows a 3D model drawing.
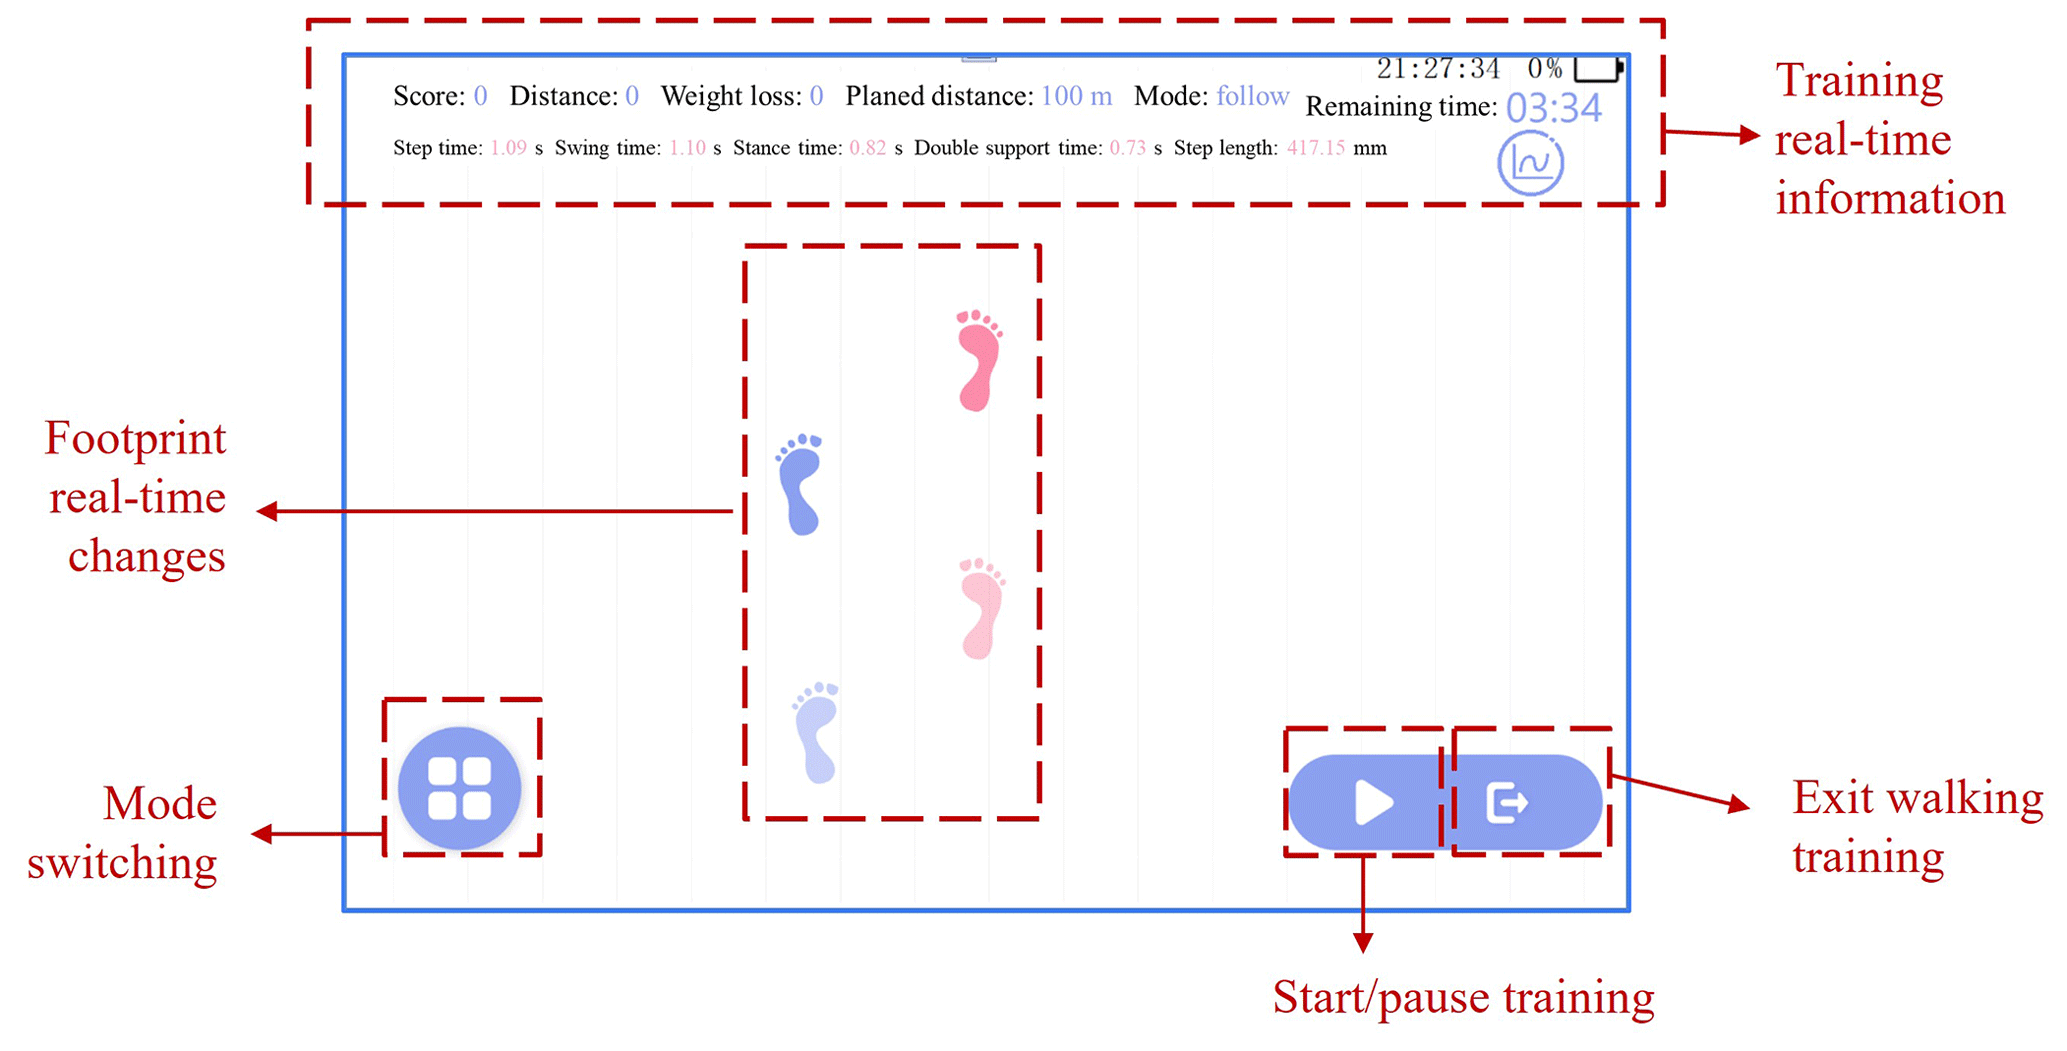
Lidar is used for the collection of leg data, and the data are transmitted to the upper computer of the lower limb rehabilitation robot through a USB cable. At the same time, the lidar sensor is powered by the terminal module of the lower computer system. The upper computer sends control instructions to the lidar sensor through the software interactive interface, so as to start and stop the sensor and stop the data transmission. In the meantime, the gait data from the lidar sensor are received for visual display and the real-time data and gait parameters are stored in the database for persistent management. The software interface is shown in Fig. 3.
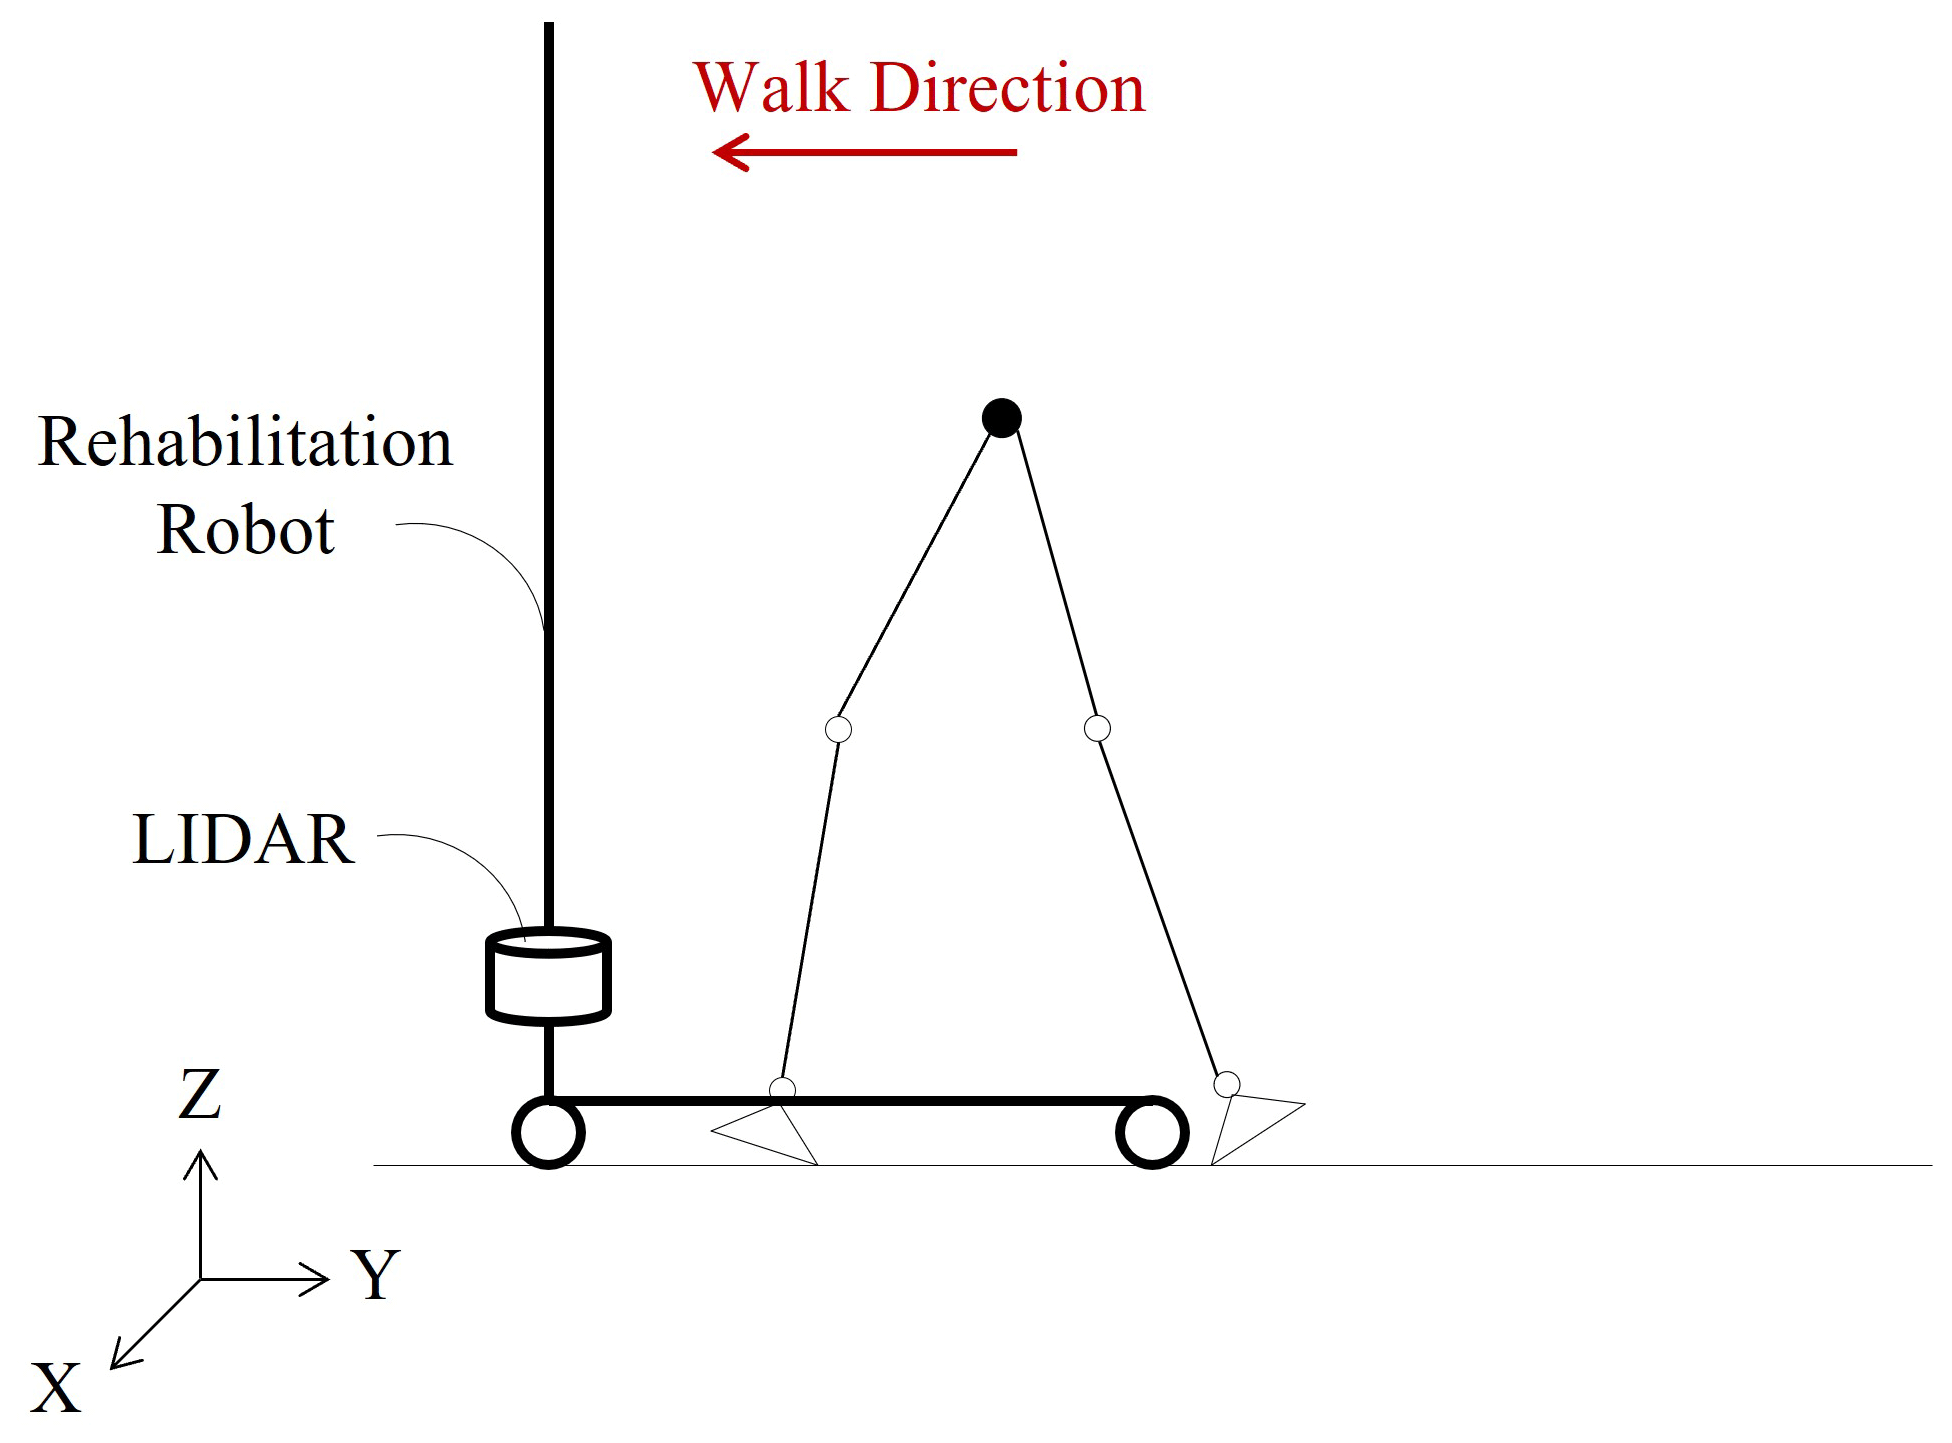
Users need to wear a belt when using the robot for training. Figure 4 shows a scene of actually using the lower limb rehabilitation robot. Among them, the lidar sensor is installed in the control cabinet, which is sealed with a steel plate, and the control cabinet is slotted at the height of the laser emission light source so that the laser beam can be emitted from the control cabinet to obtain the user's gait information. Similarly, the relationship between the Cartesian coordinate system established by lidar and the human body can be clearly seen in Fig. 4. The opposite direction of human body walking is the positive direction of the y axis, and the measured angle of 0∘ under polar coordinates is the positive direction of the x axis (i.e., the left direction of human body).
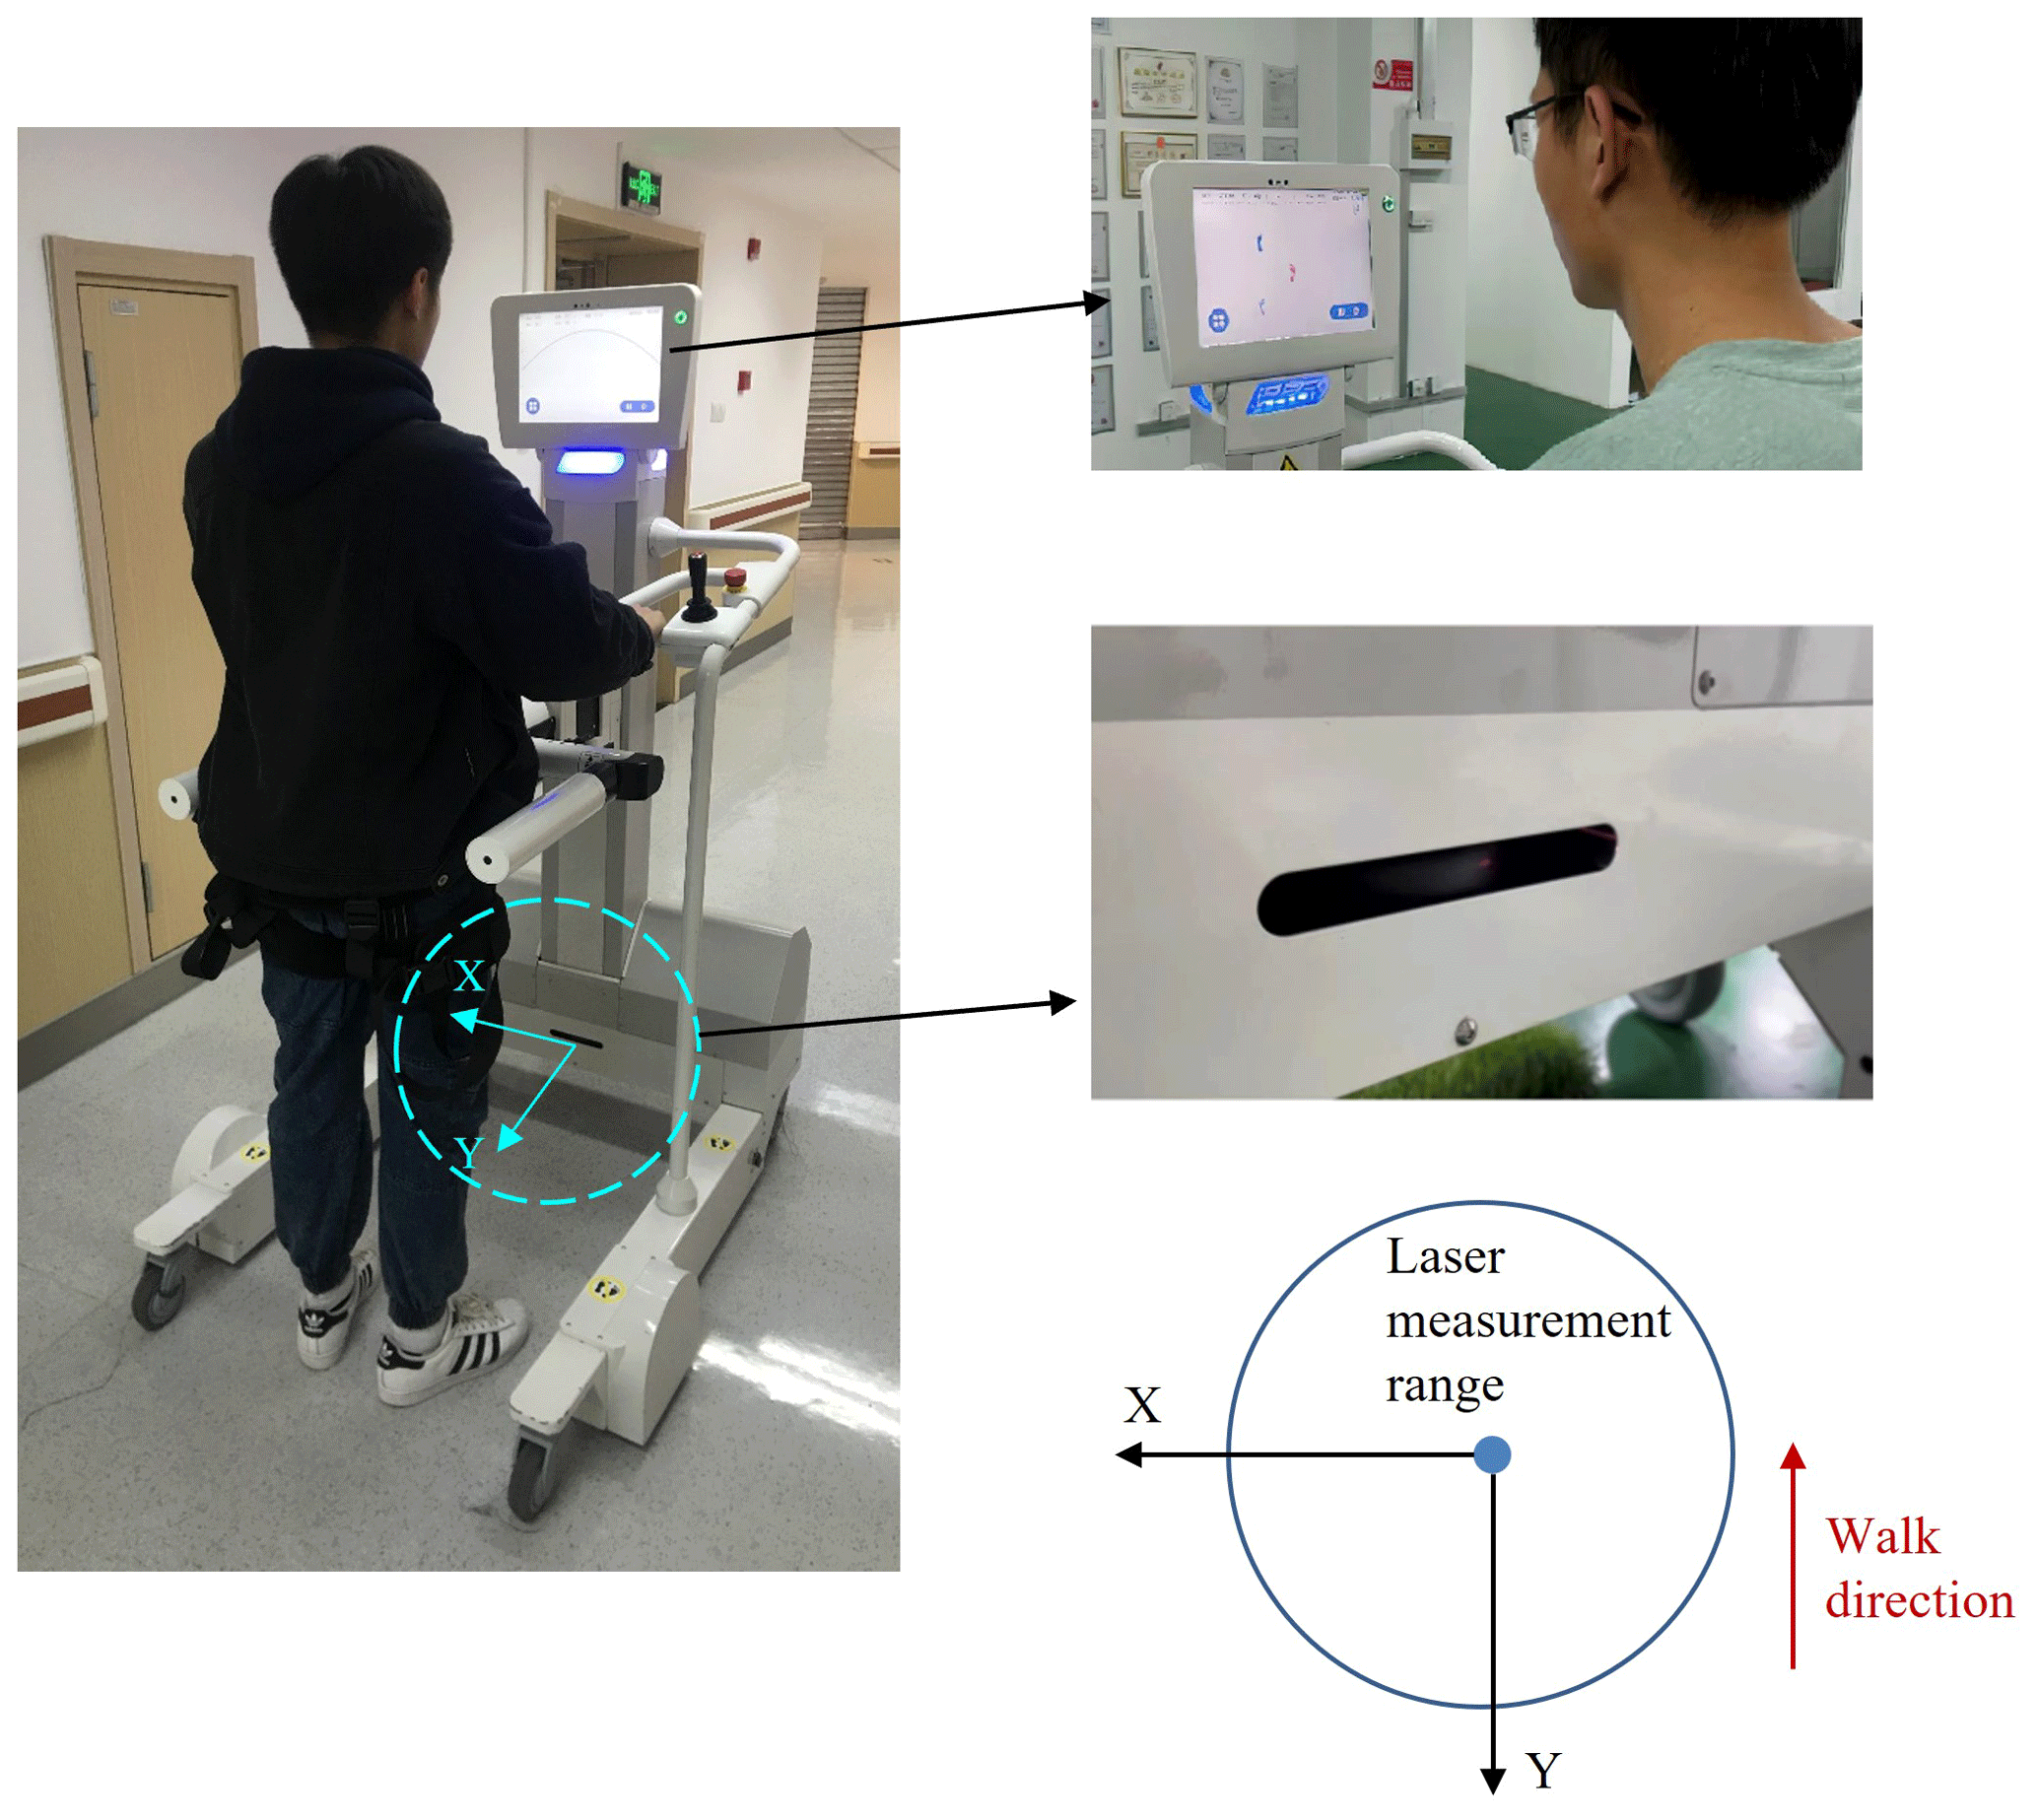
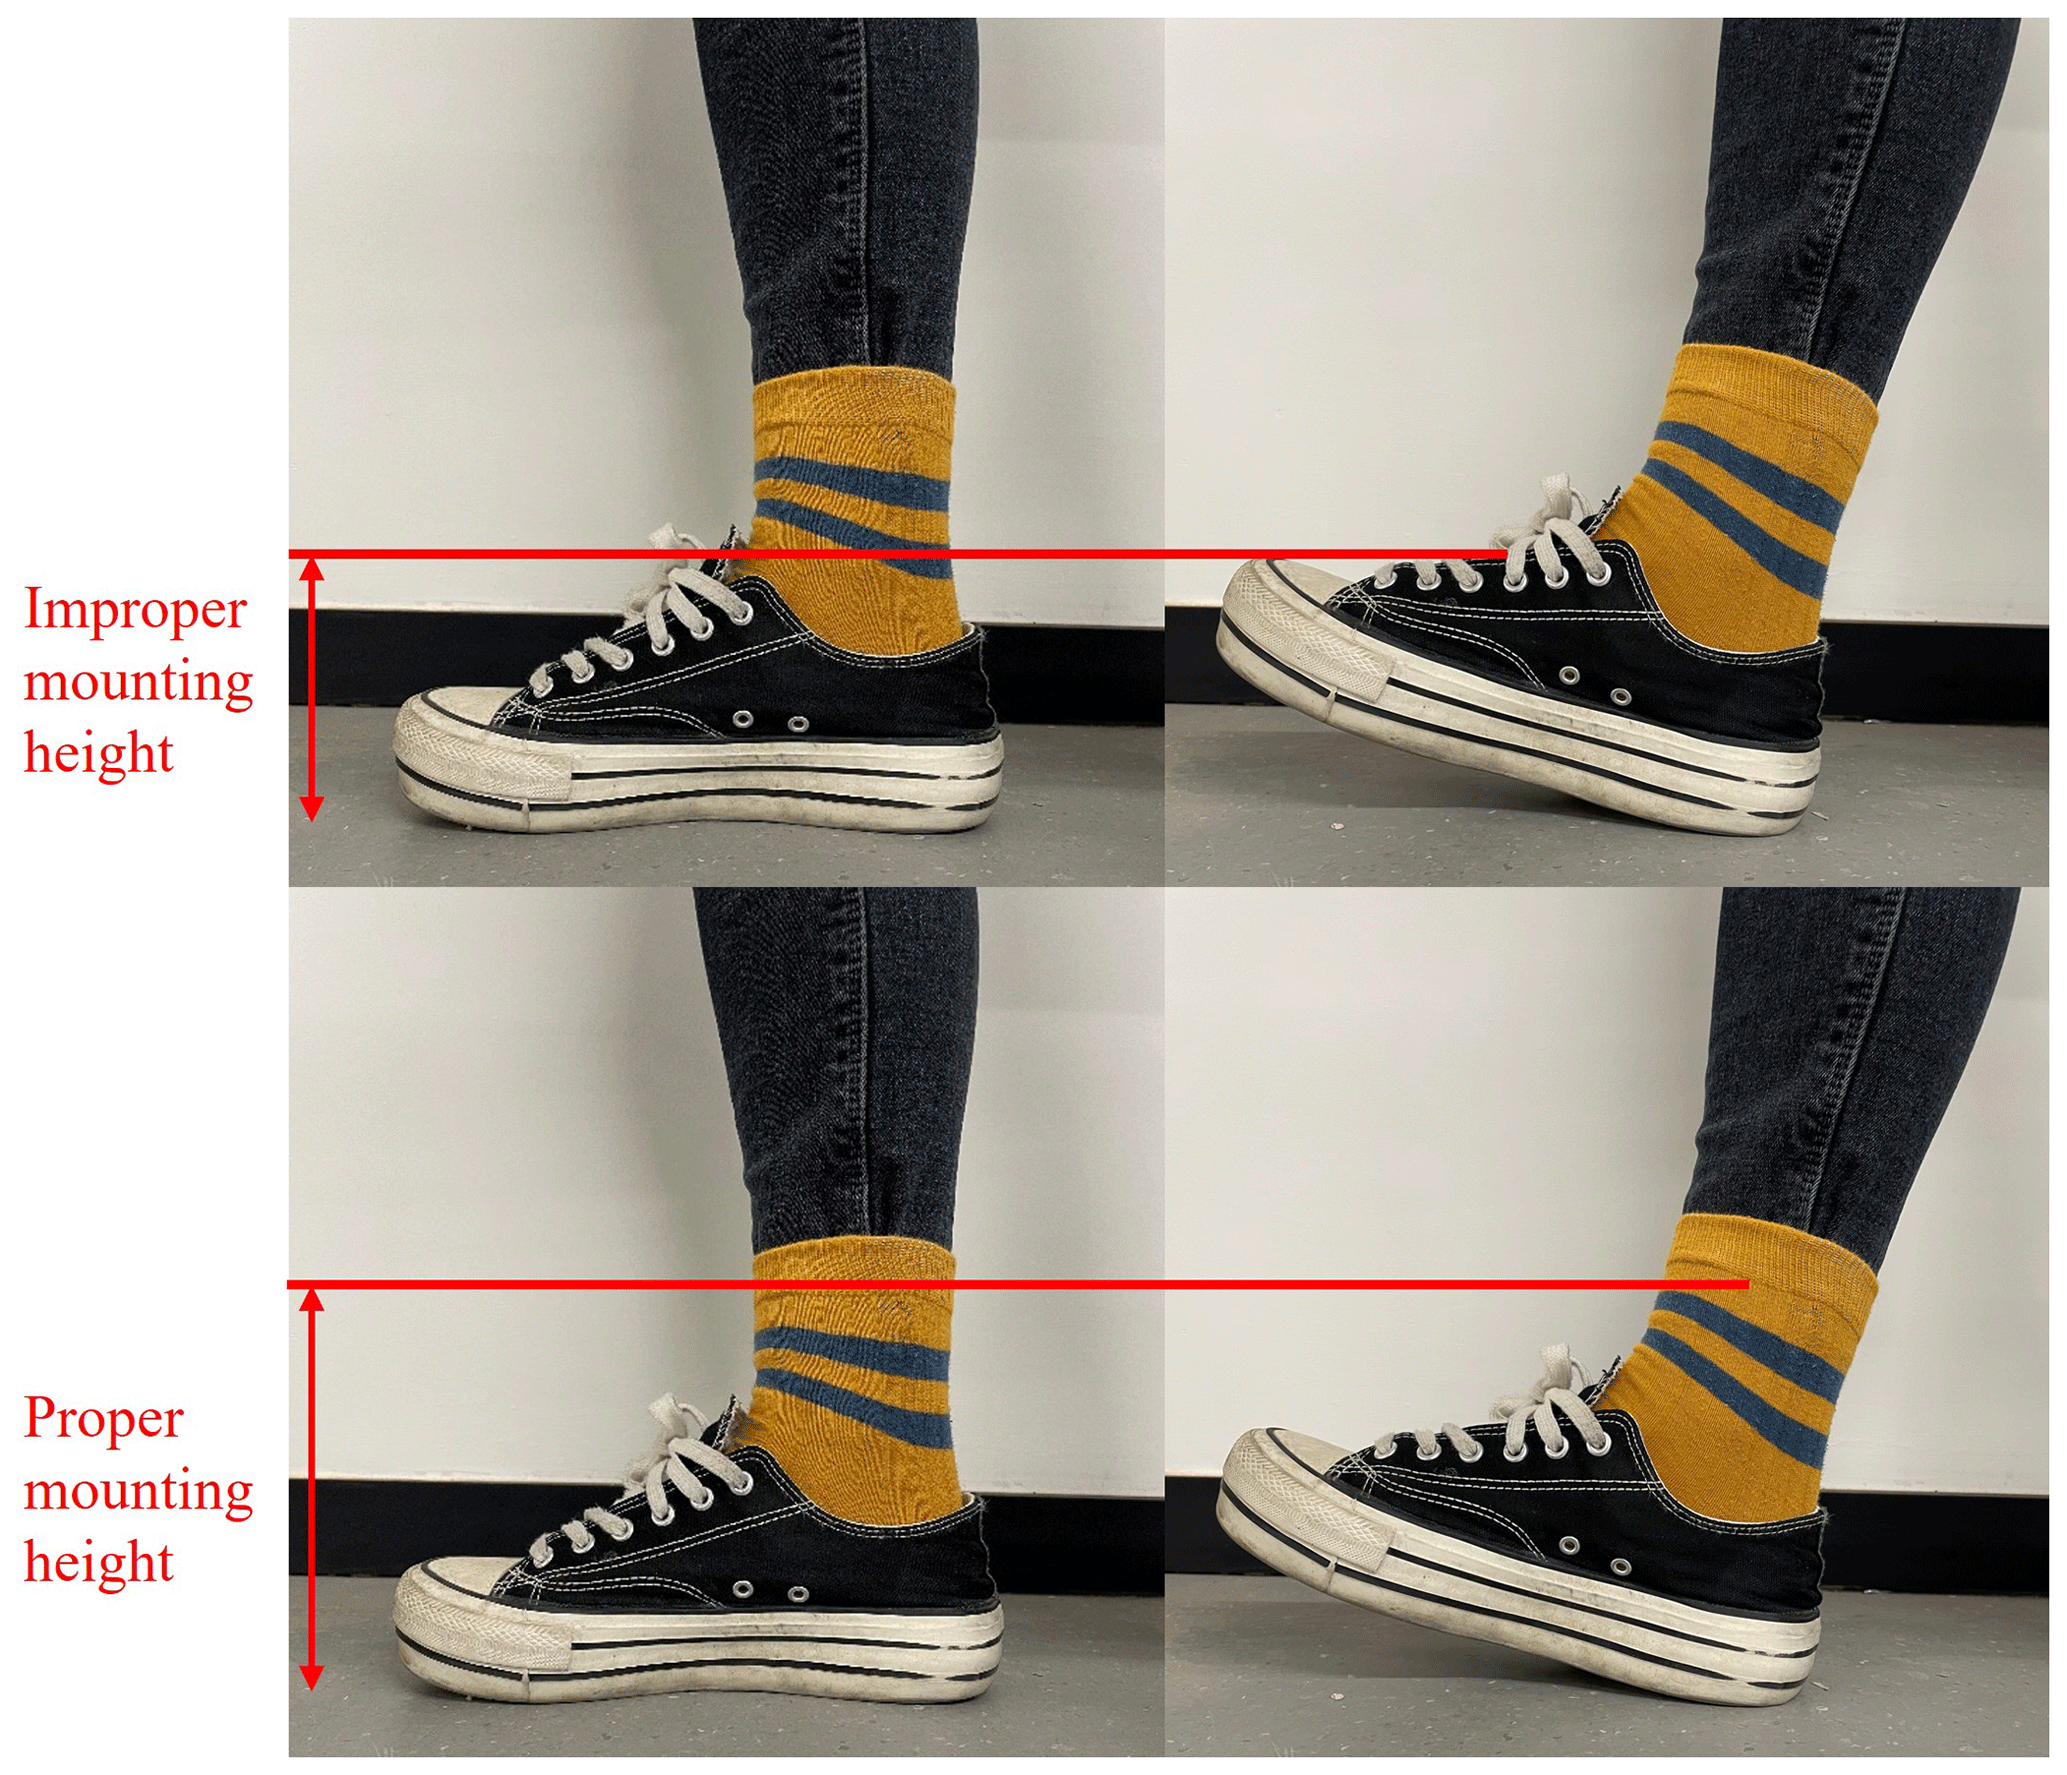
Since lidar can only detect a two-dimensional spatial plane, the installation height of the lidar sensor is adjusted to the height above the ground plane, and the distance between the tester's calf and the sensor is detected as the data basis of the gait parameter algorithm (see Fig. 5). Multiple tests in this paper have shown that the installation height should be 280 mm, which is designed to ensure that no shoes are detected during walking.
3.1 Algorithm
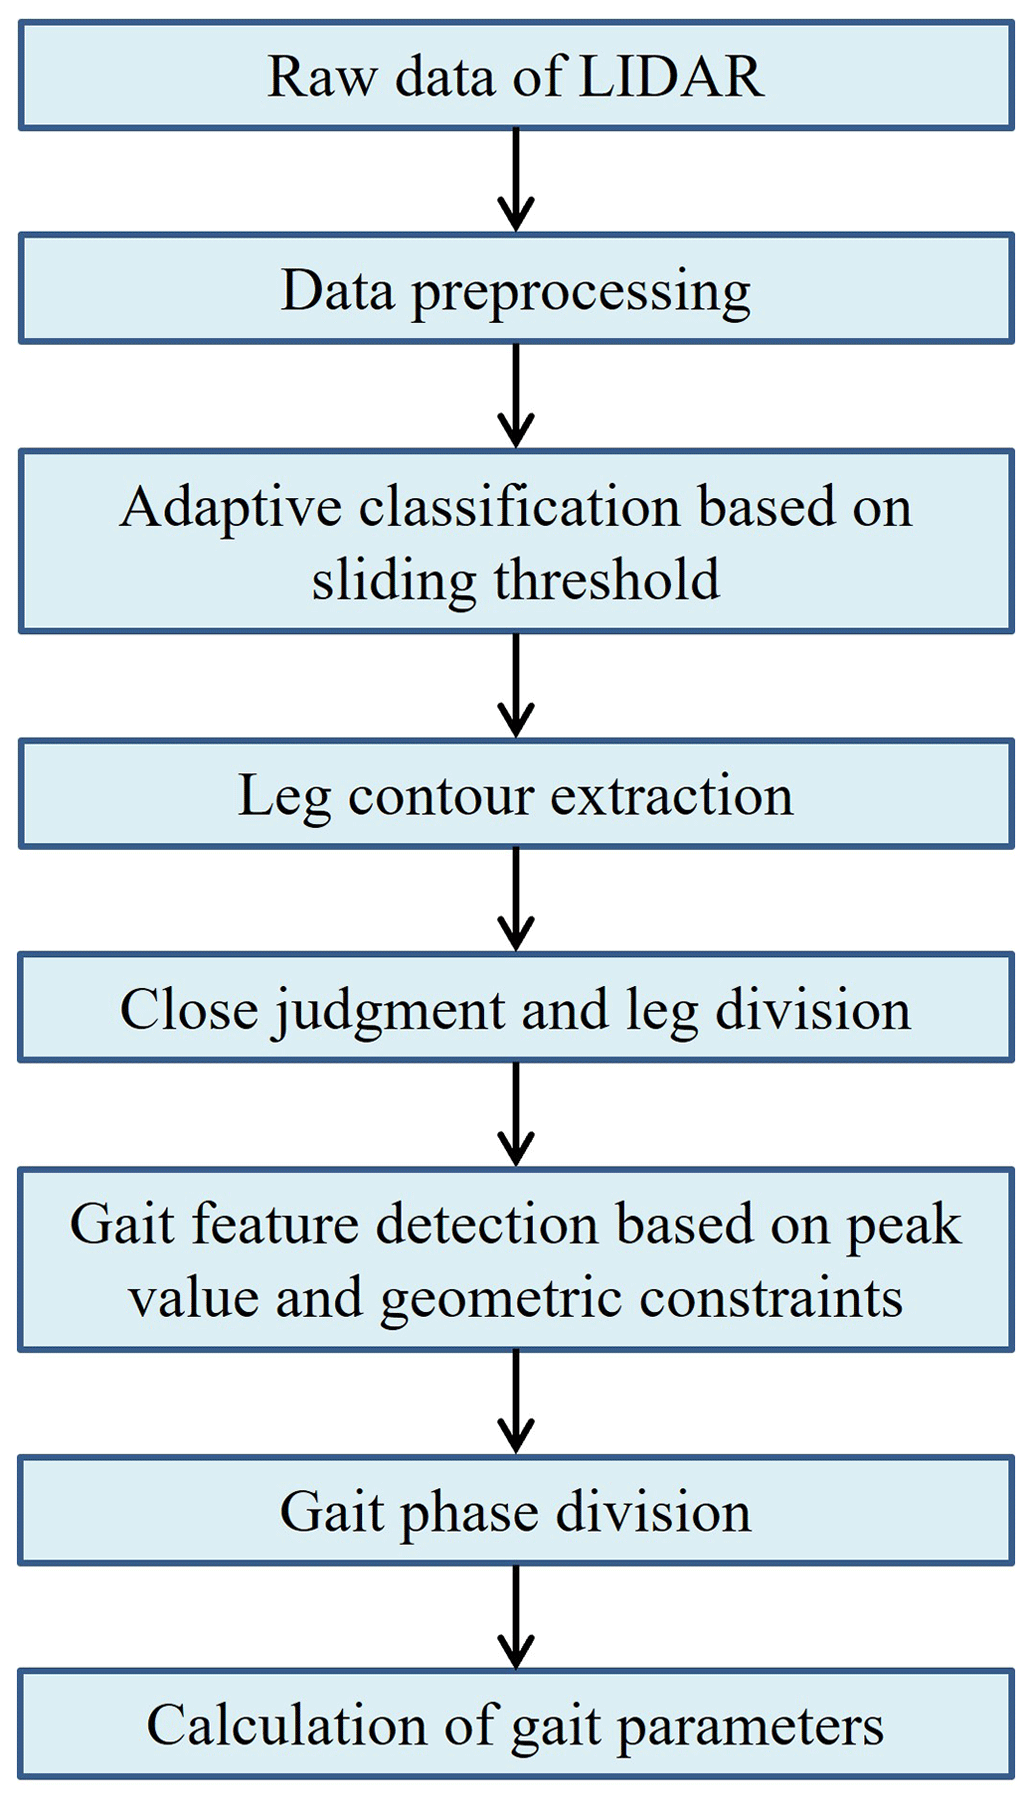
As shown in Fig. 6, the core of the gait analysis algorithm is to convert the original data collected by lidar into gait parameters, which is mainly composed of the following processes. Firstly, the point cloud data obtained from lidar scanning is preprocessed, and the range of data points is selected to eliminate the interference of miscellaneous points on the subsequent algorithm. Secondly, adaptive classification of selected data points, leg contour extraction and determination of left and right leg positions are carried out, in which the possible state of legs together is considered. In addition, according to the time series of the left and right leg positions in the walking process, the peak and trough points (namely toe off the ground, TO, and heel strike on the ground, HS) are identified. Finally, on the basis of gait phase division, the gait spatial parameter-splicing algorithm based on the time series is proposed to calculate the gait spatiotemporal parameters. The algorithm takes into account the variability of the lidar coordinate system applied to the robot, which can reduce the influence of its error on the gait spatiotemporal parameters. Based on the above gait analysis algorithm, 100 data points are used as the dynamic window to calculate the gait parameters of each frame and realize the real-time performance of gait analysis.
3.2 Preprocessing
Define the arbitrary measurement data point pij obtained in the ith scan as
where j is the index of the data points from each scan, ti is the relative time at which the scan begins, θij is the relative angle of the jth point in the ith scan, dij is the Euclidean distance between the jth point and the origin defined by lidar, and (xijyij) is the Cartesian coordinate converted from the original polar coordinate of the jth point.
Assume that the lidar scanning plane is parallel to the ground, its position with respect to the rehabilitation robot remains unchanged and the x axis is defined as the measured angle of 0 ∘. The established Cartesian coordinate system is shown in Fig. 4, and the specific formula is
Then the set of all laser points obtained in the ith scan is defined as follows:
where n is the number of points at the ith scan (namely 800 for RPLIDAR A2M8).
Since the position of the lidar sensor remains unchanged relative to the rehabilitation robot, in order to extract the data points corresponding to the leg contour, a rectangular measurement area is defined with a certain range of effectiveness. In this case, the set of laser points is defined as follows:
where Xmin, Xmax, Ymin and Ymax are the limits of the measurement area in Cartesian coordinates, in this paper taken as .
3.3 Leg recognition
3.3.1 Adaptive classification based on sliding threshold
In order to detect leg position, clustering of discrete data points obtained by lidar is a key step in leg recognition. In this paper, an adaptive clustering algorithm based on a sliding threshold is adopted. When the distance between the current point pij and the previous point is less than a threshold value Dij_max, it can be roughly classified as the same class of data points. Conversely, pij and are in different categories: pij is the first point of the new category while is the last point of the old category. It is specifically expressed as
where Dij_max is the threshold calculated of the jth laser point in the ith scan, Δθ is the scanning angle resolution of the lidar sensor, σ is the measurement distance error and λ is the adjustment constant parameter. Since the angle resolution and measuring distance error of the lidar sensor itself are 0.7∘ and 10 mm, after multiple experimental adjustments and verifications, in this paper, we take σ=0.01 m, λ=10∘.
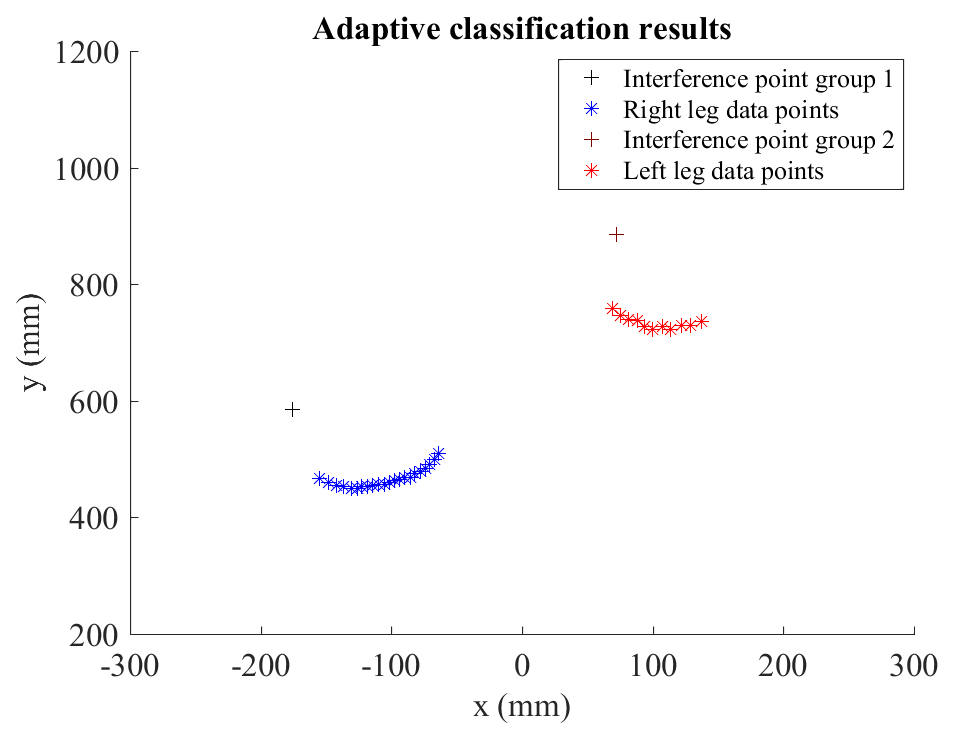
As shown in Fig. 7, the process of the proposed adaptive clustering method based on a sliding threshold can be clearly represented, where Δθ is amplified to simplify the visualization process. Figure 8 shows the classification results.

According to experimental experience, at least three points on each leg are required for leg circle fitting. If the number of data points in the category obtained after adaptive clustering is less than 3, such as some outliers, these data points will be excluded as environmental noise. There is also the possibility that the lidar sensor itself scans for less laser points.
Meanwhile, the distance between the jth laser point and the previous laser point in the ith scan is defined as
Then the clustering condition is
where Qi is the number of categories of data points scanned at the ith time.
3.3.2 Leg contour extraction
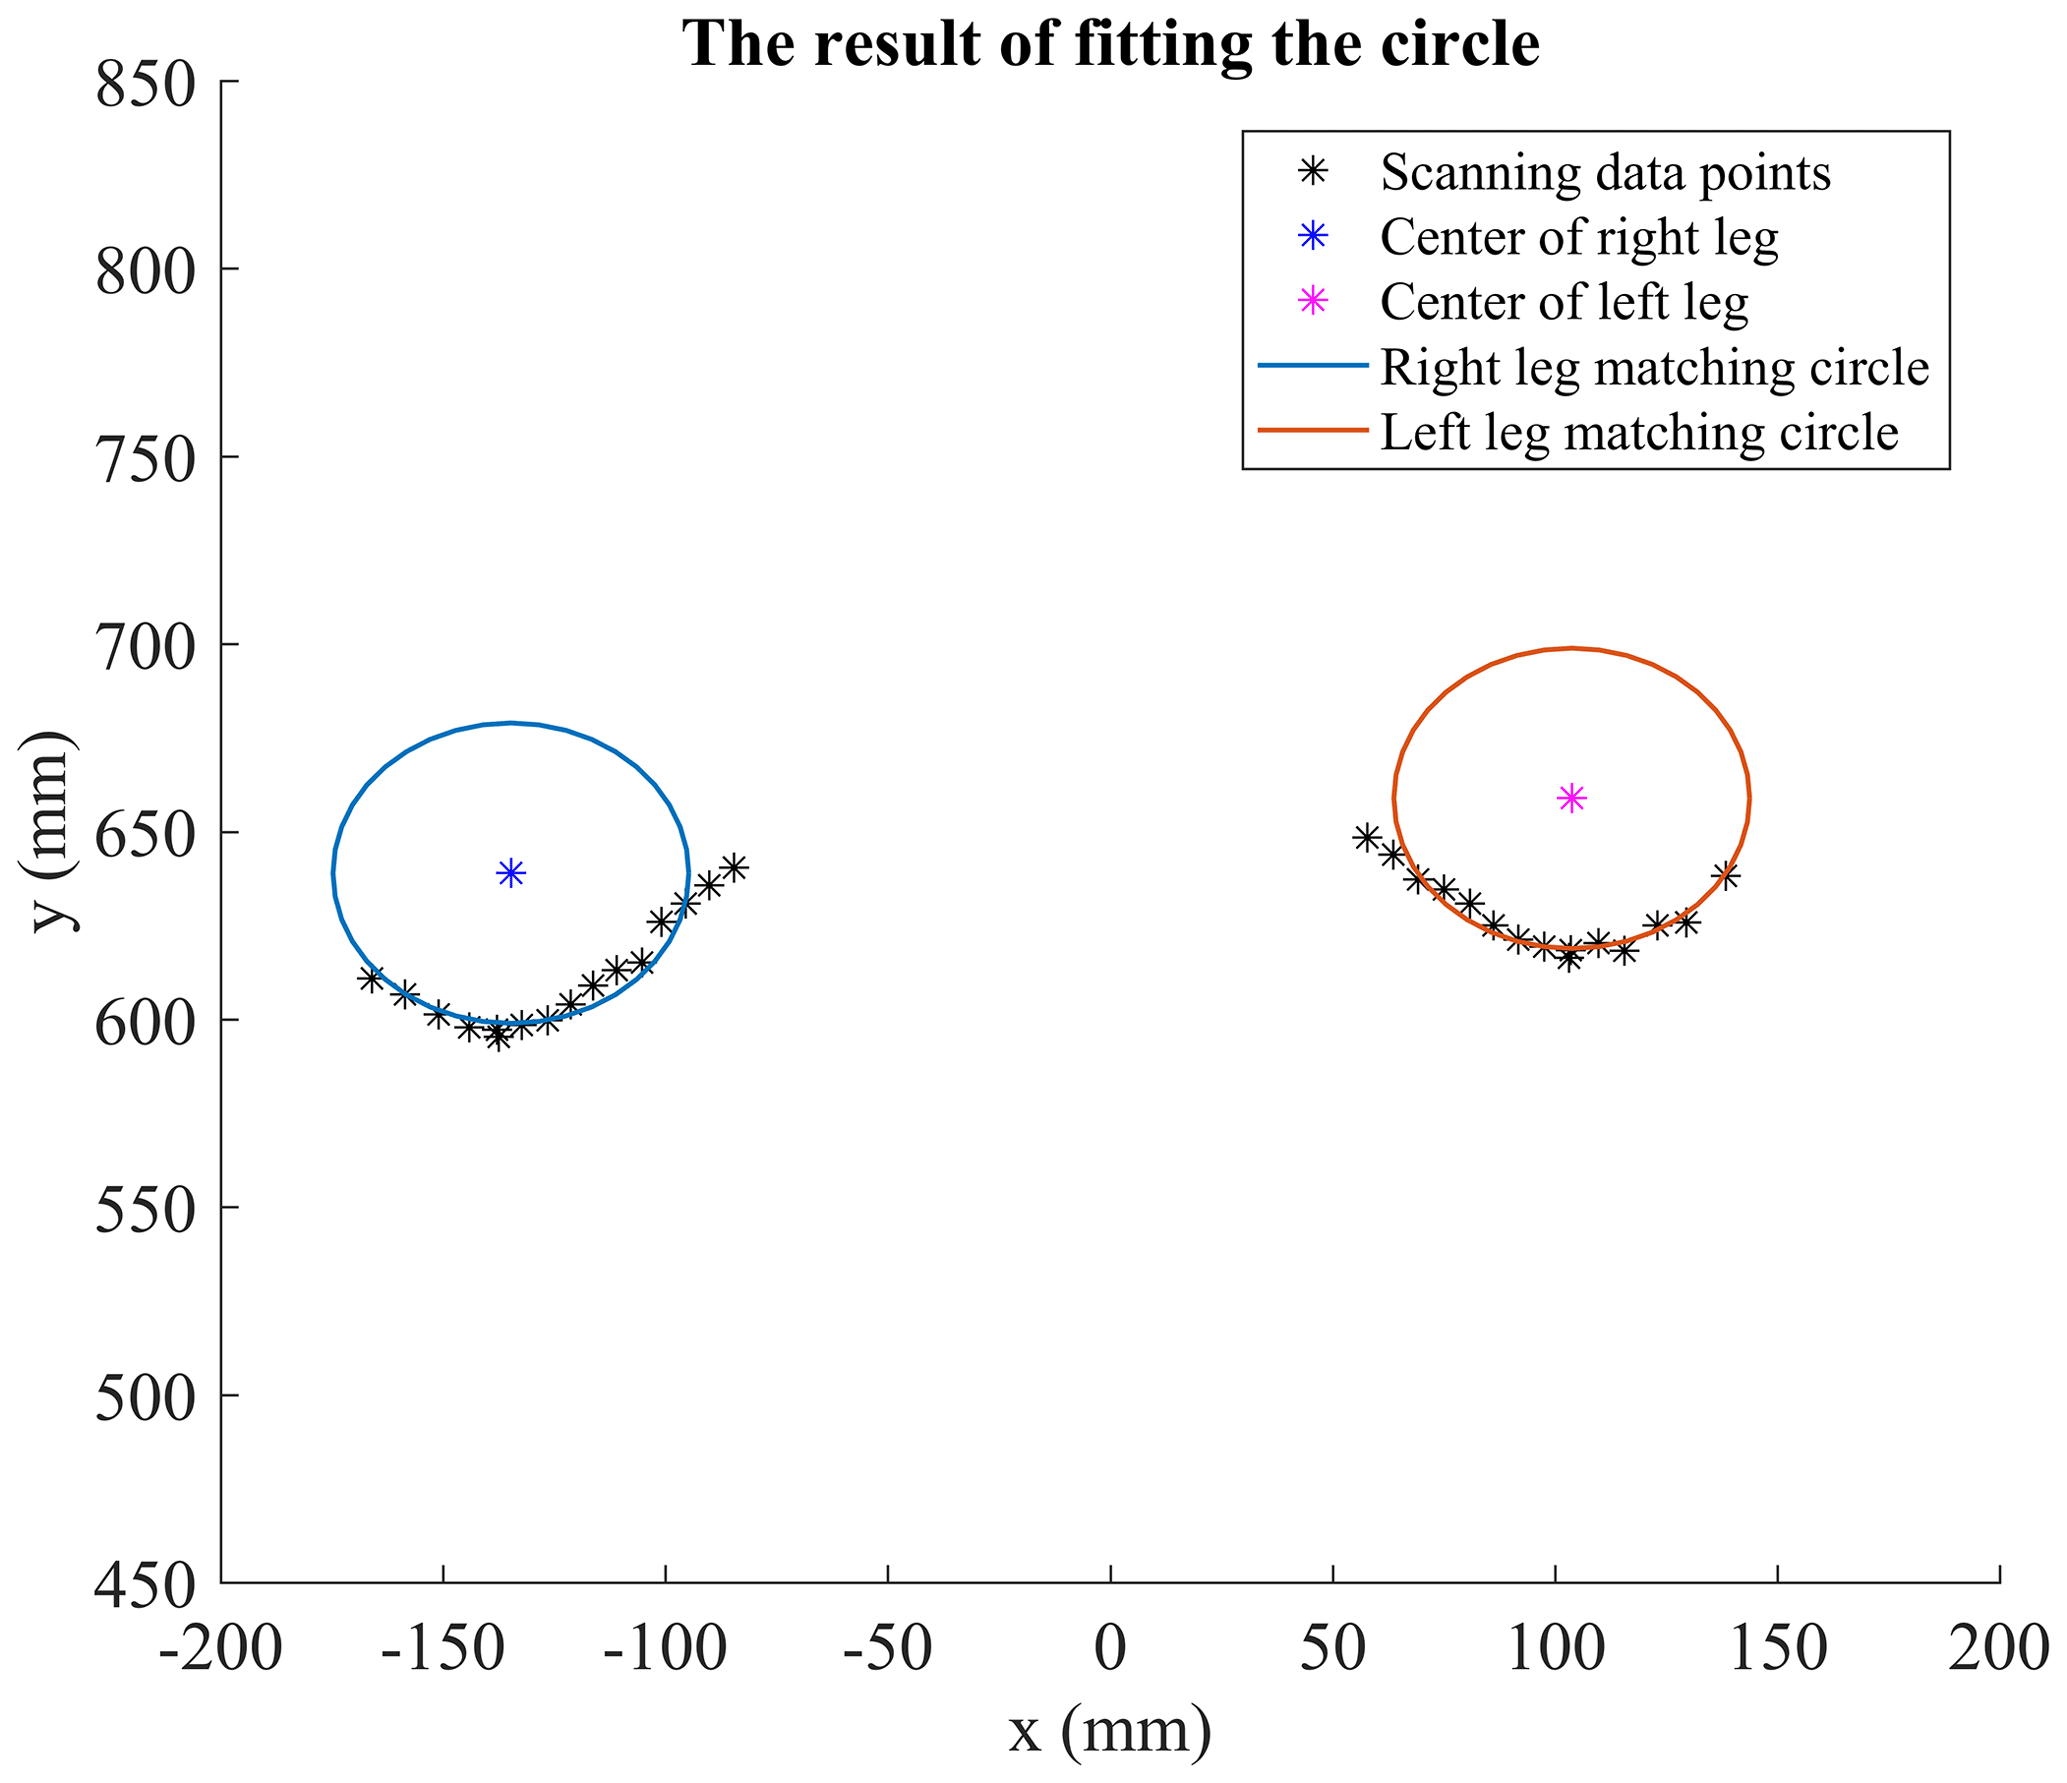
The cross section between the laser scanning plane and the human leg can be approximated as a circle. Since the lidar sensor can only scan the contour of the calf from a certain angle range, the obtained point cloud data set is an approximately circular arc and the complete contour of the calf cannot be obtained, as shown in Fig. 8. Therefore, it is necessary to fit the circle as the approximate contour of the calf.
In order to take stability into consideration, this paper first uses a geometric method to calculate the matching circle, and determines the matching circle parameters according to the least square method, as follows:
Then the center and radius of the matching circle of laser data points in each frame can be obtained. However, through experimental tests, it is found that the real-time performance of this method cannot meet the predetermined requirements in the case of real-time data acquisition, so this paper simplifies it.
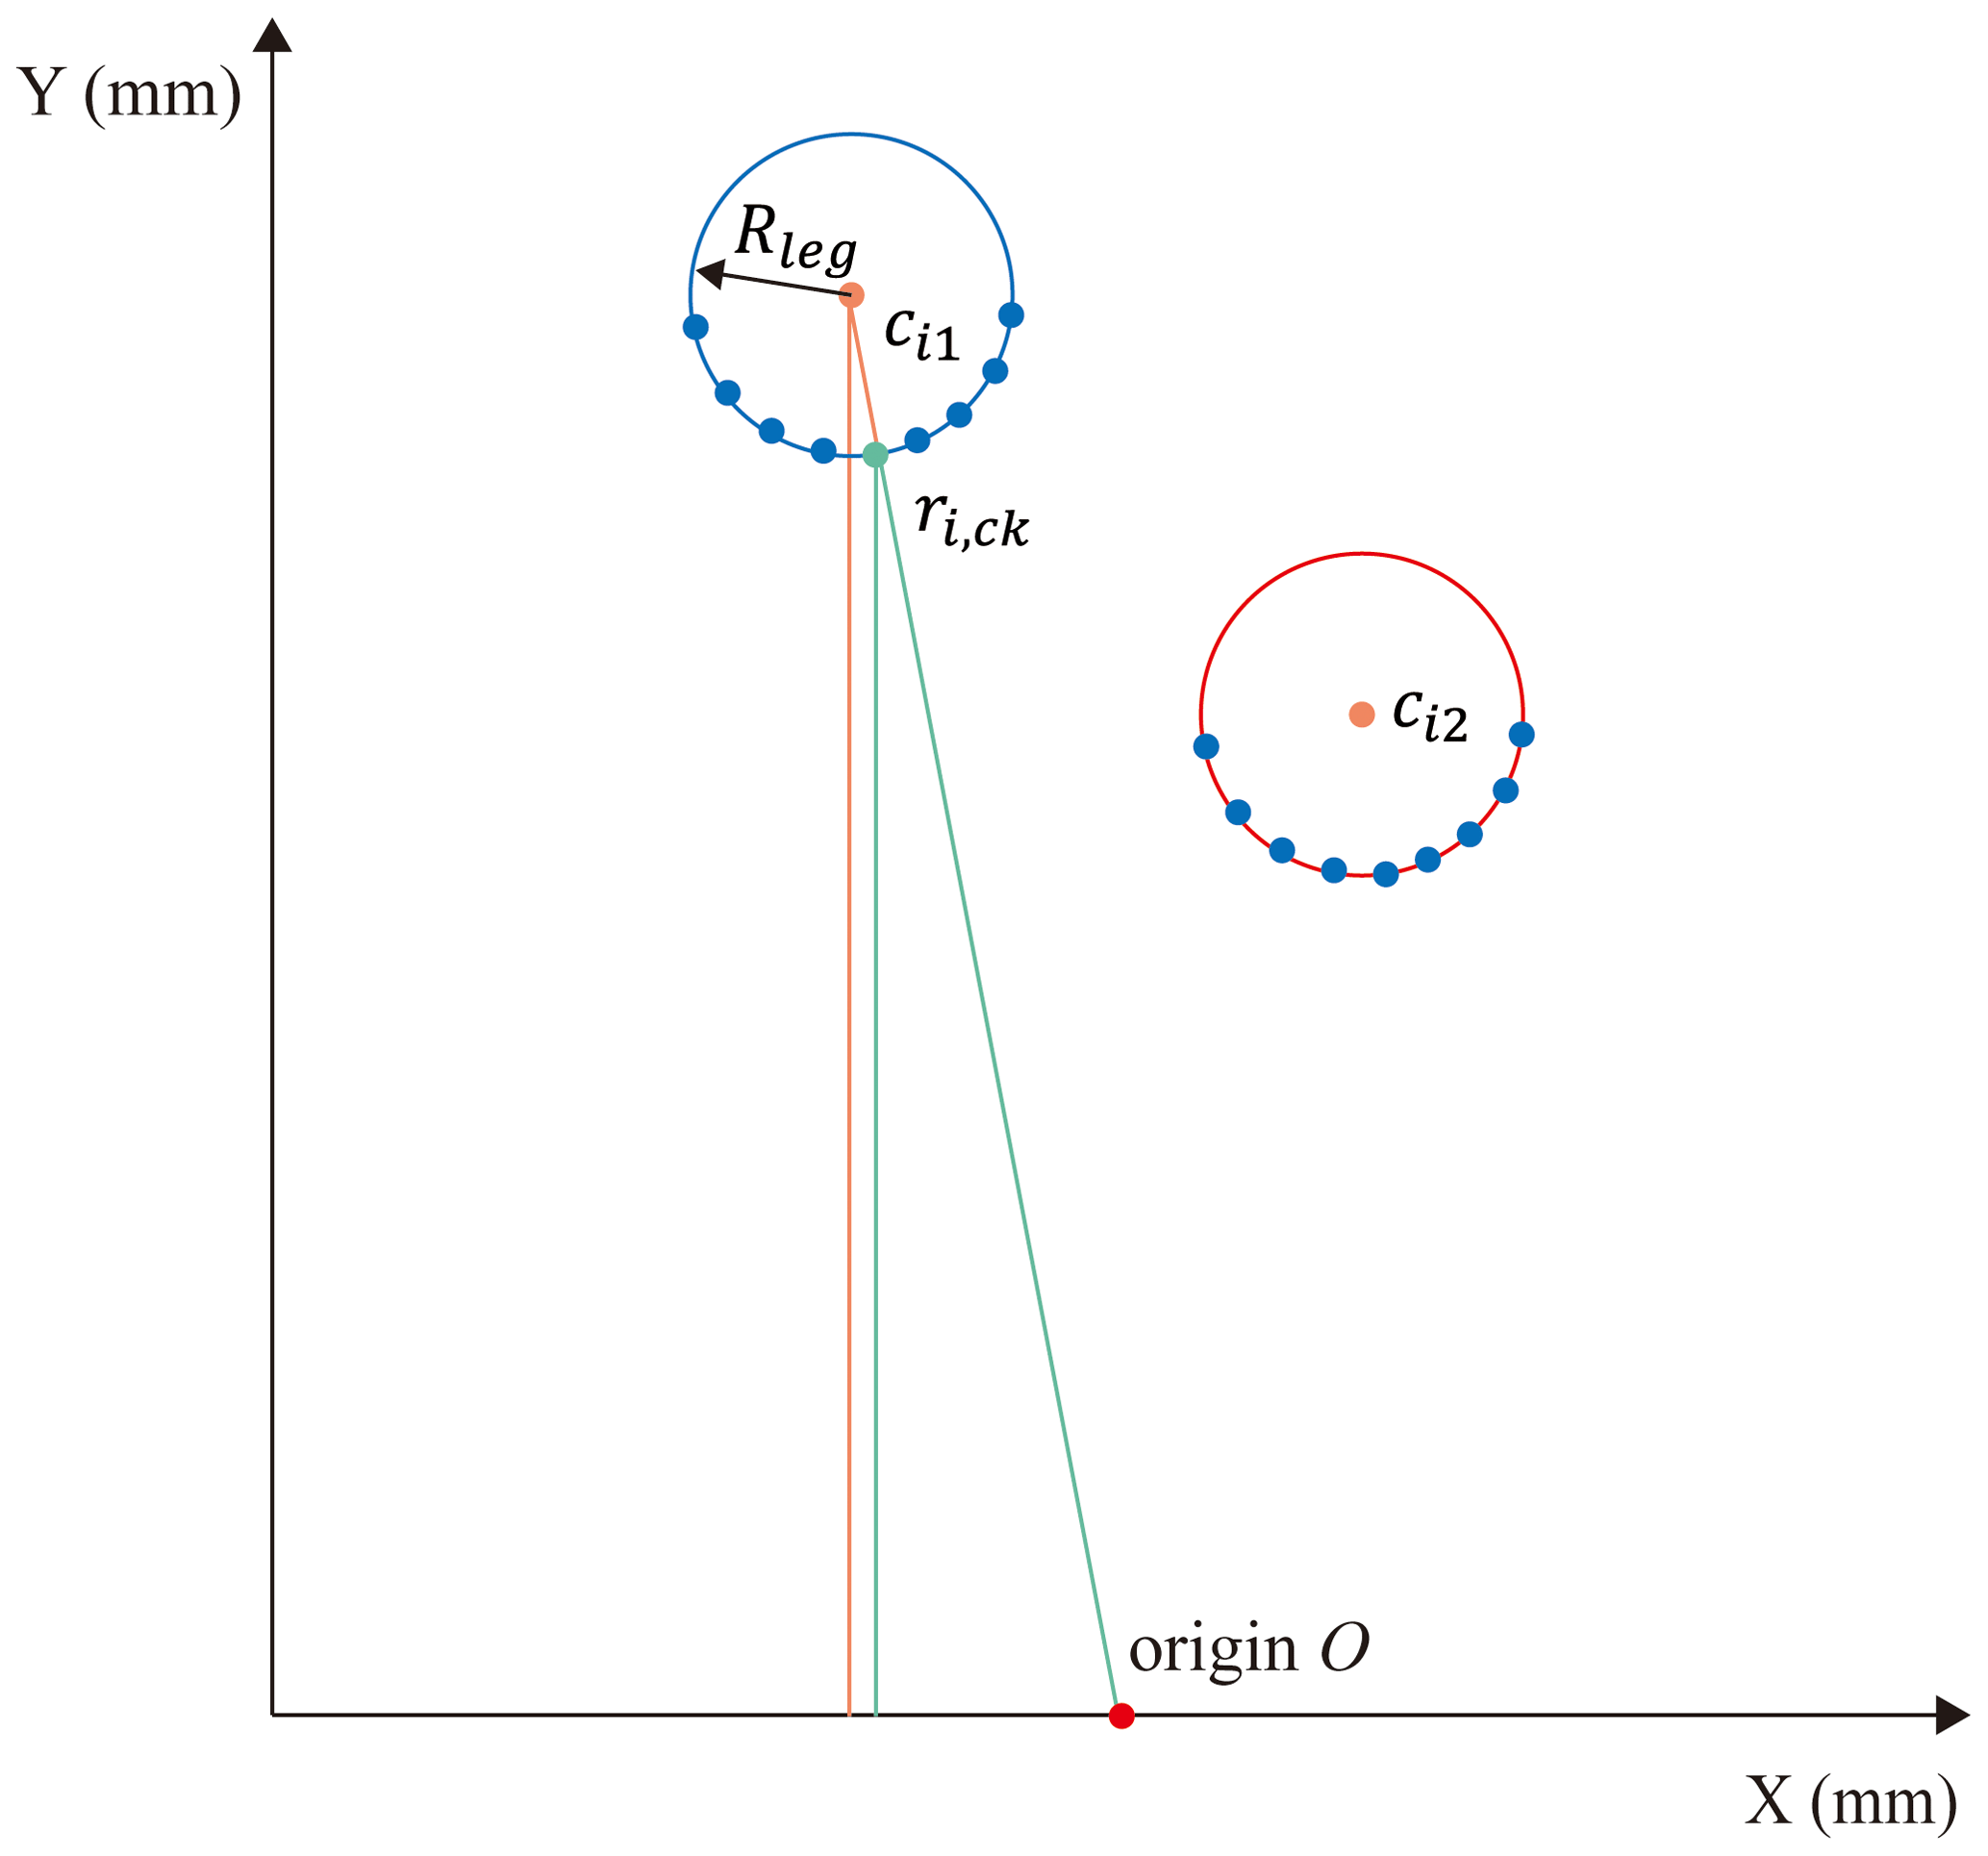
In the case of ideal clustering results (i.e., after adopting an adaptive clustering algorithm based on a sliding threshold, there are two classes of data points and the number of each class of data points reaches above the required number of center fitting), we assume a cluster m of ith scan, defining each data point in the cluster as , . Based on experimental experience, the circle with a fixed radius of Rleg was initially defined as the model for leg recognition. Estimate the location of the center point of each cluster based on geometric constraints:
where ck is the intermediate value of the index of the data points contained in the various clusters.
where Rleg is the fixed radius for fitting the center of the leg circle, which is taken as 40 mm in this paper considering the user's calf radius at the height of lidar scanning. is the estimated position of the center point of the cluster in the ith scan. β is the angle between the origin and the central point of each cluster.
In this mathematical geometry model, the estimated center points of each cluster and the center points of the data point index are considered to be numerically approximate in the angle formed by the origin when the aspect ratio difference is large. Figure 9 shows a schematic diagram of leg center estimation in one scan, where the blue curve in the figure represents the right foot of the tester and the red curve represents the left foot of the tester. Figure 10 shows the actual fitting circle results.
3.3.3 Leg tracking and differentiation
When the clustering result is ideal, let represent the left leg data point cluster and represent the right leg data point cluster. On the premise that the center position of the two clusters is estimated, is defined as the Euclidean distance between the center point position of the category ci,m obtained by the ith scan and the center point position of the previous scan .
Thus, let the distance of the left leg cluster and the distance of the right leg cluster be defined as follows:
Before left and right leg judgment, left and right leg cluster initialization is performed. According to the coordinate system and the fixed gait law, the position of the left and right legs corresponding to the two clusters are determined for the first time through the abscissa size of the center in the first frame, that is, the center point cluster with the smaller abscissa value is the right foot cluster.
From this, the following model can be obtained:
However, in the actual situation, clustering is often not ideal, as there may be more than two clusters that also meet the number of leg center fitting requirements. In this case, a judgment factor is proposed to select the first two categories with a larger value as data point clusters for leg fitting. The factor is defined as follows:
where nm is the number of data points within cluster m obtained in the ith scan.
Considering the situation that legs may be together in the actual walking process, the threshold L is set when only one cluster exists after adaptive clustering. In this paper, L is 150 mm. When the distance between the first and the end points in the cluster is greater than the threshold value, it is considered that there are two types of clusters; otherwise, there is only one type of clusters. The results can be obtained according to the above model.
3.4 Gait feature detection based on peak values and geometric constraints
Human walking is a periodic process. It can be concluded that the leg coordinate time series of walking presents a curve similar to a sine function. In the actual process of walking, due to the influence of noise factors, the curve is prone to a tiny jitter phenomenon, which leads to pseudo-peaks and pseudo-troughs. This situation has great interference for the recognition of two gait key points: HS and TO. Based on this, a gait feature detection method based on peak values and geometric constraints is adopted in this paper. If the following two conditions are met, the feature point is considered effective.
-
Condition 1. Perform first-order curve fitting on the current gait data, excluding pseudo-troughs above the curve and pseudo-peaks below the curve.
-
Condition 2. For the same side, there is only one trough between adjacent peaks. For the opposite side, there is only one peak between adjacent peaks.
3.5 Calculation of gait parameters
After detecting the gait features of the point cloud data, it is represented by the smooth leg coordinate time series. The actual curve is shown in Fig. 11, which roughly presents a periodic law, but it is not as smooth as the ideal curve, with pseudo-troughs and pseudo-peaks.
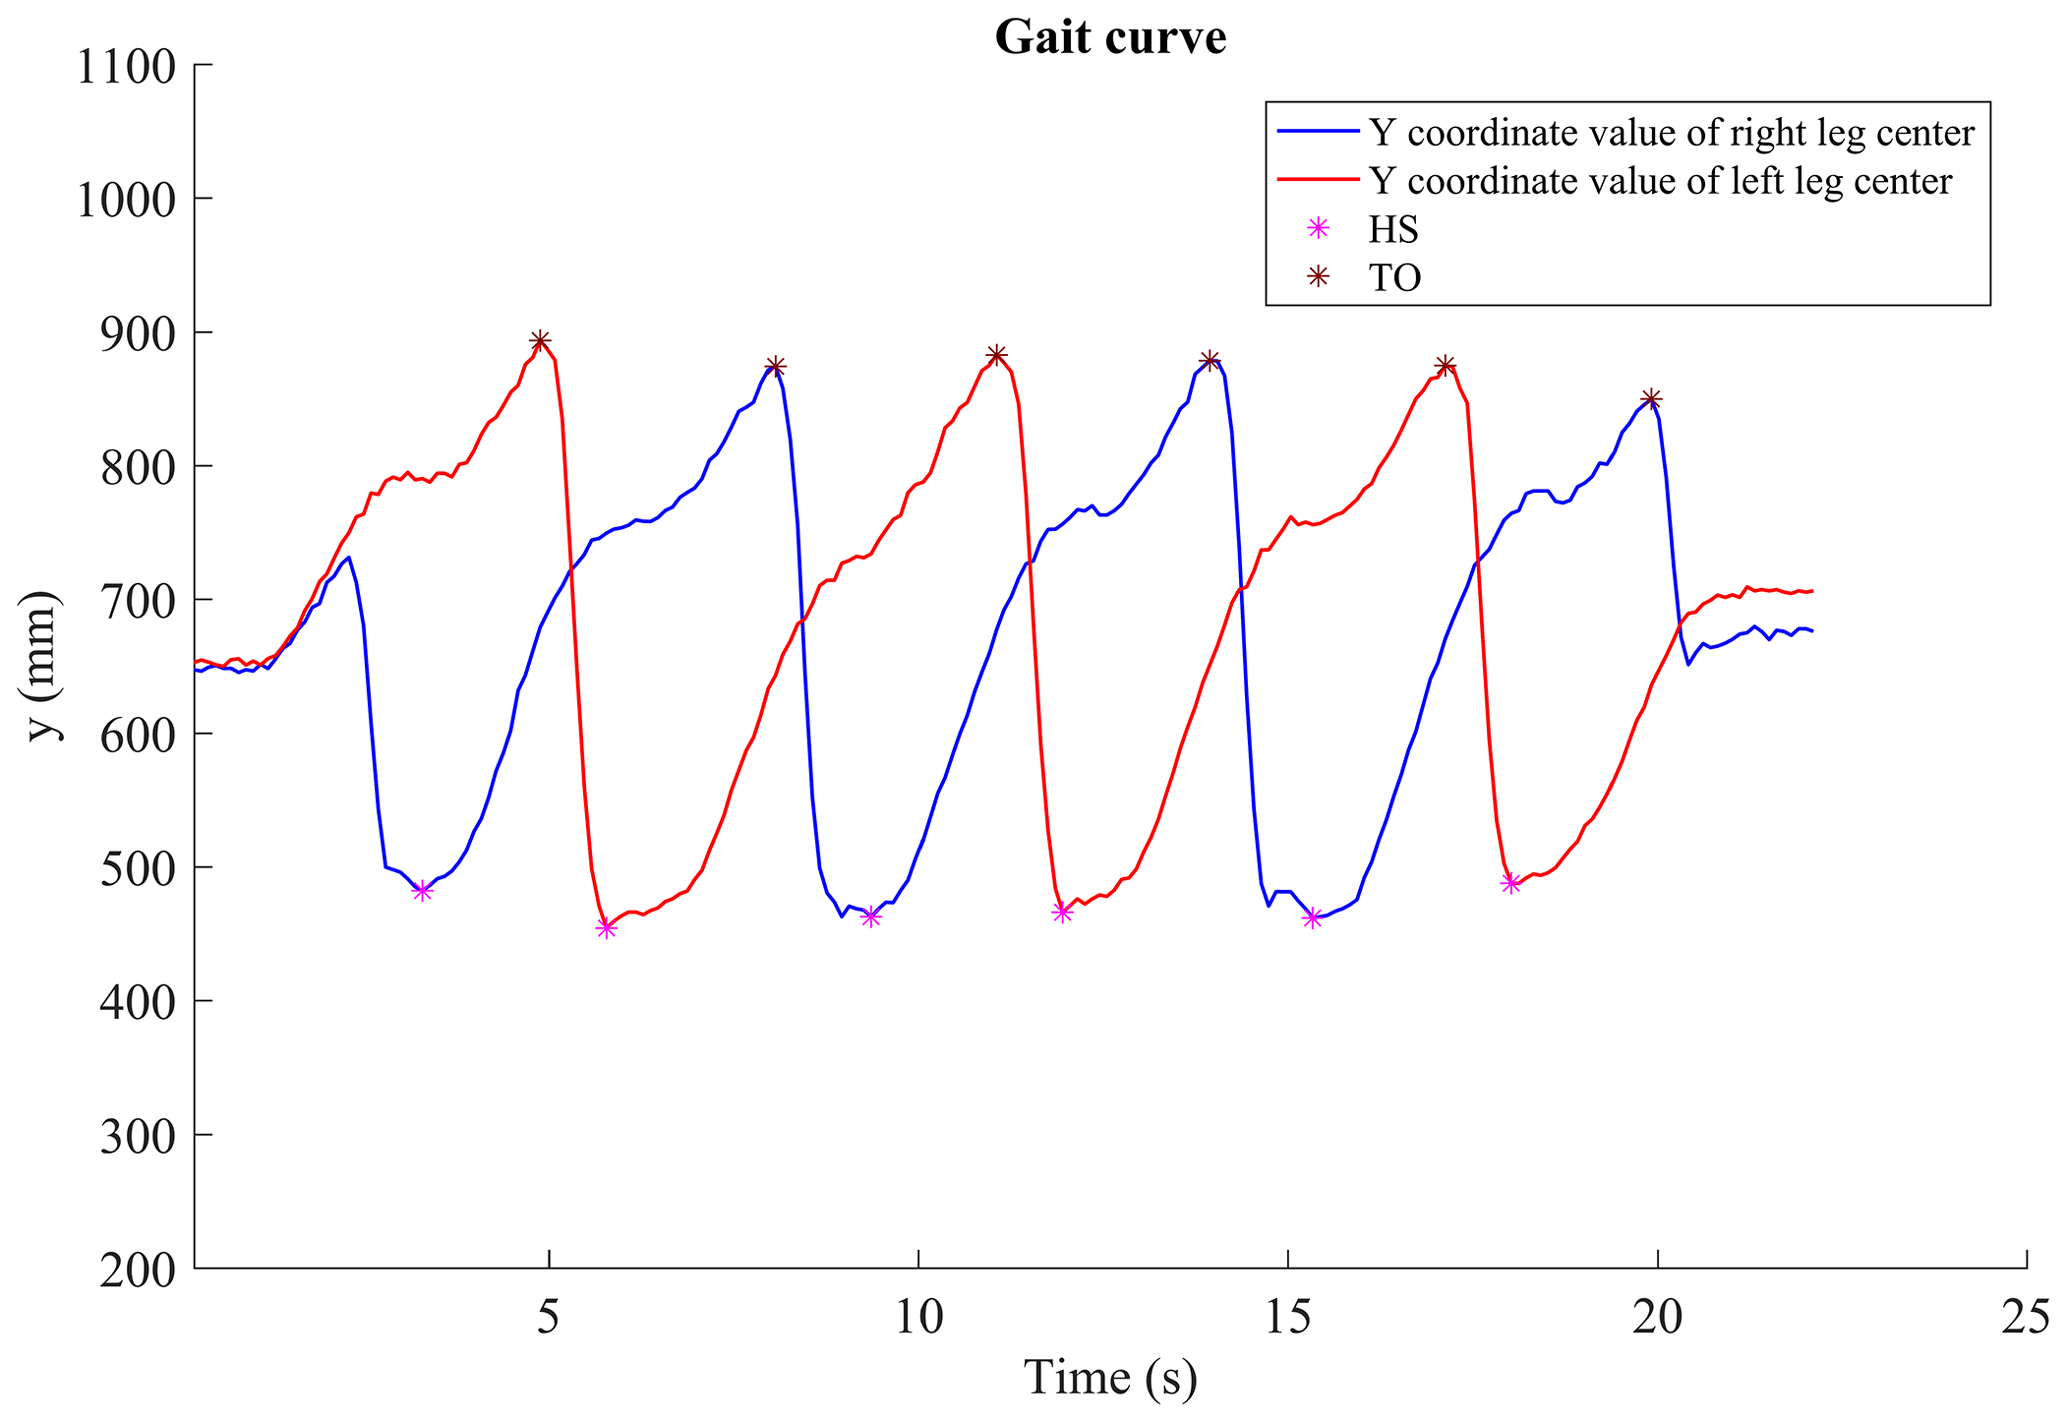
According to the gait curve obtained, the peak value (TO) and trough value (HS) in the figure are extracted as eigenvalues. In this paper, HS time is defined as the time point at which the heel touches the ground, which is approximately the discrete time corresponding to the minimum value in the smooth time series. TO time is defined as the time point when the toe leaves the ground, which is approximately the discrete time corresponding to the maximum value in the smooth time series. HS and TO positions are defined as the distance from the lidar sensor in the forward and backward directions.
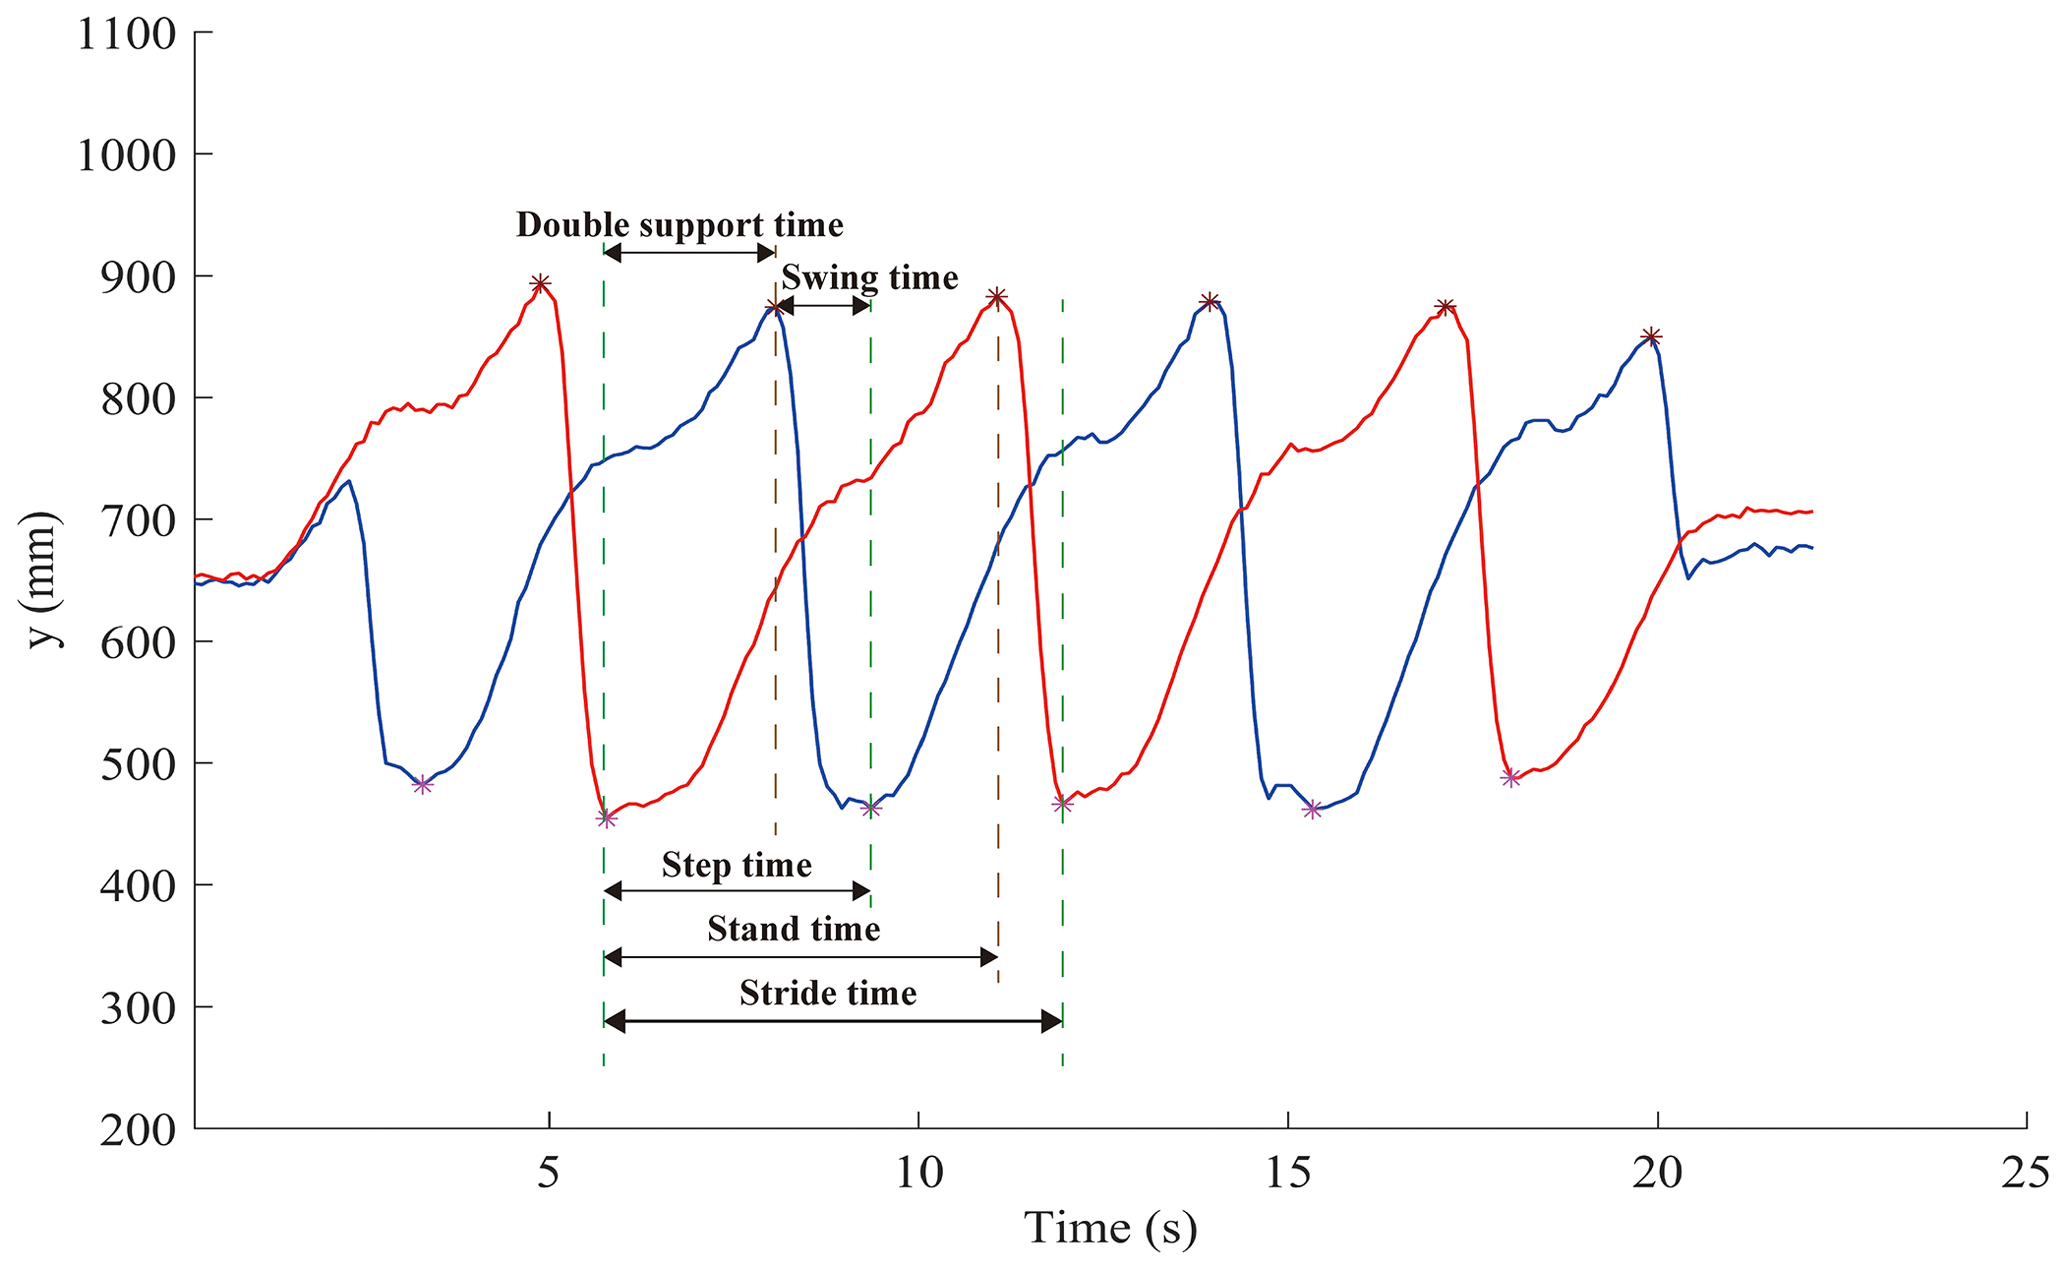
In this paper, seven spatiotemporal parameters are calculated (i.e., stance time, swing time, double support time, stride time, step time, stride length and step length). A diagram of gait time parameters is shown in Fig. 12. The formula is as follows:
In the kth gait cycle, THS(k) and TTO(k) are assumed to be the corresponding moments of HS and TO, and is assumed to be the moment that the opposite toe leaves the ground.
Taking the heel striking the ground as the starting point of a cycle, then gait cycle T is the time from one heel striking to the next heel striking on the same side, which can be expressed as
Swing time Tsw is the time from the TO to the heel striking on the same side, expressed as
Stance time Tst is the time from heel striking to the toe off on the same side, expressed as
Double support time Tds is the time from heel striking to the opposite toe off, expressed as
In the kth gait cycle, YHS(k) and are assumed to be the position coordinates when one heel strikes and the opposite heel strikes. The calculation method of standard gait spatial parameters is as follows:
Stride length is the longitudinal straight distance from one heel striking to the next heel striking on the same side, expressed as
Since the measurement height of the lidar sensor is above the ankle height of the tester, and the shoe height worn by different people during the test also has an impact on the data measured by lidar. A height factor G is introduced based on the analysis of the human body model, as shown in Figs. 13 and 14.
According to the figure, the following two relationships can be obtained:
where Lc is the step length in a gait cycle and HR and HP are the height of the lidar sensor and the human hip joint from the ground, respectively. D1 and D2 are the distances from the tester's right and left legs to the origin, and Lt is the tester's leg length.
From this, the height factor can be obtained:
Most previous research on lidar is based on the sensor being fixed to the ground plane to calculate the gait parameters. In this paper, the lidar sensor is applied to the rehabilitation robot. When calculating the gait parameters, especially the step length parameter with a different frame, the direction of the rehabilitation robot may not be straight forward during the walking process, and the walking trajectory of the tester may not be a straight line. Therefore, a spatial parameter-splicing algorithm based on a time series is proposed, as shown in Fig. 15.
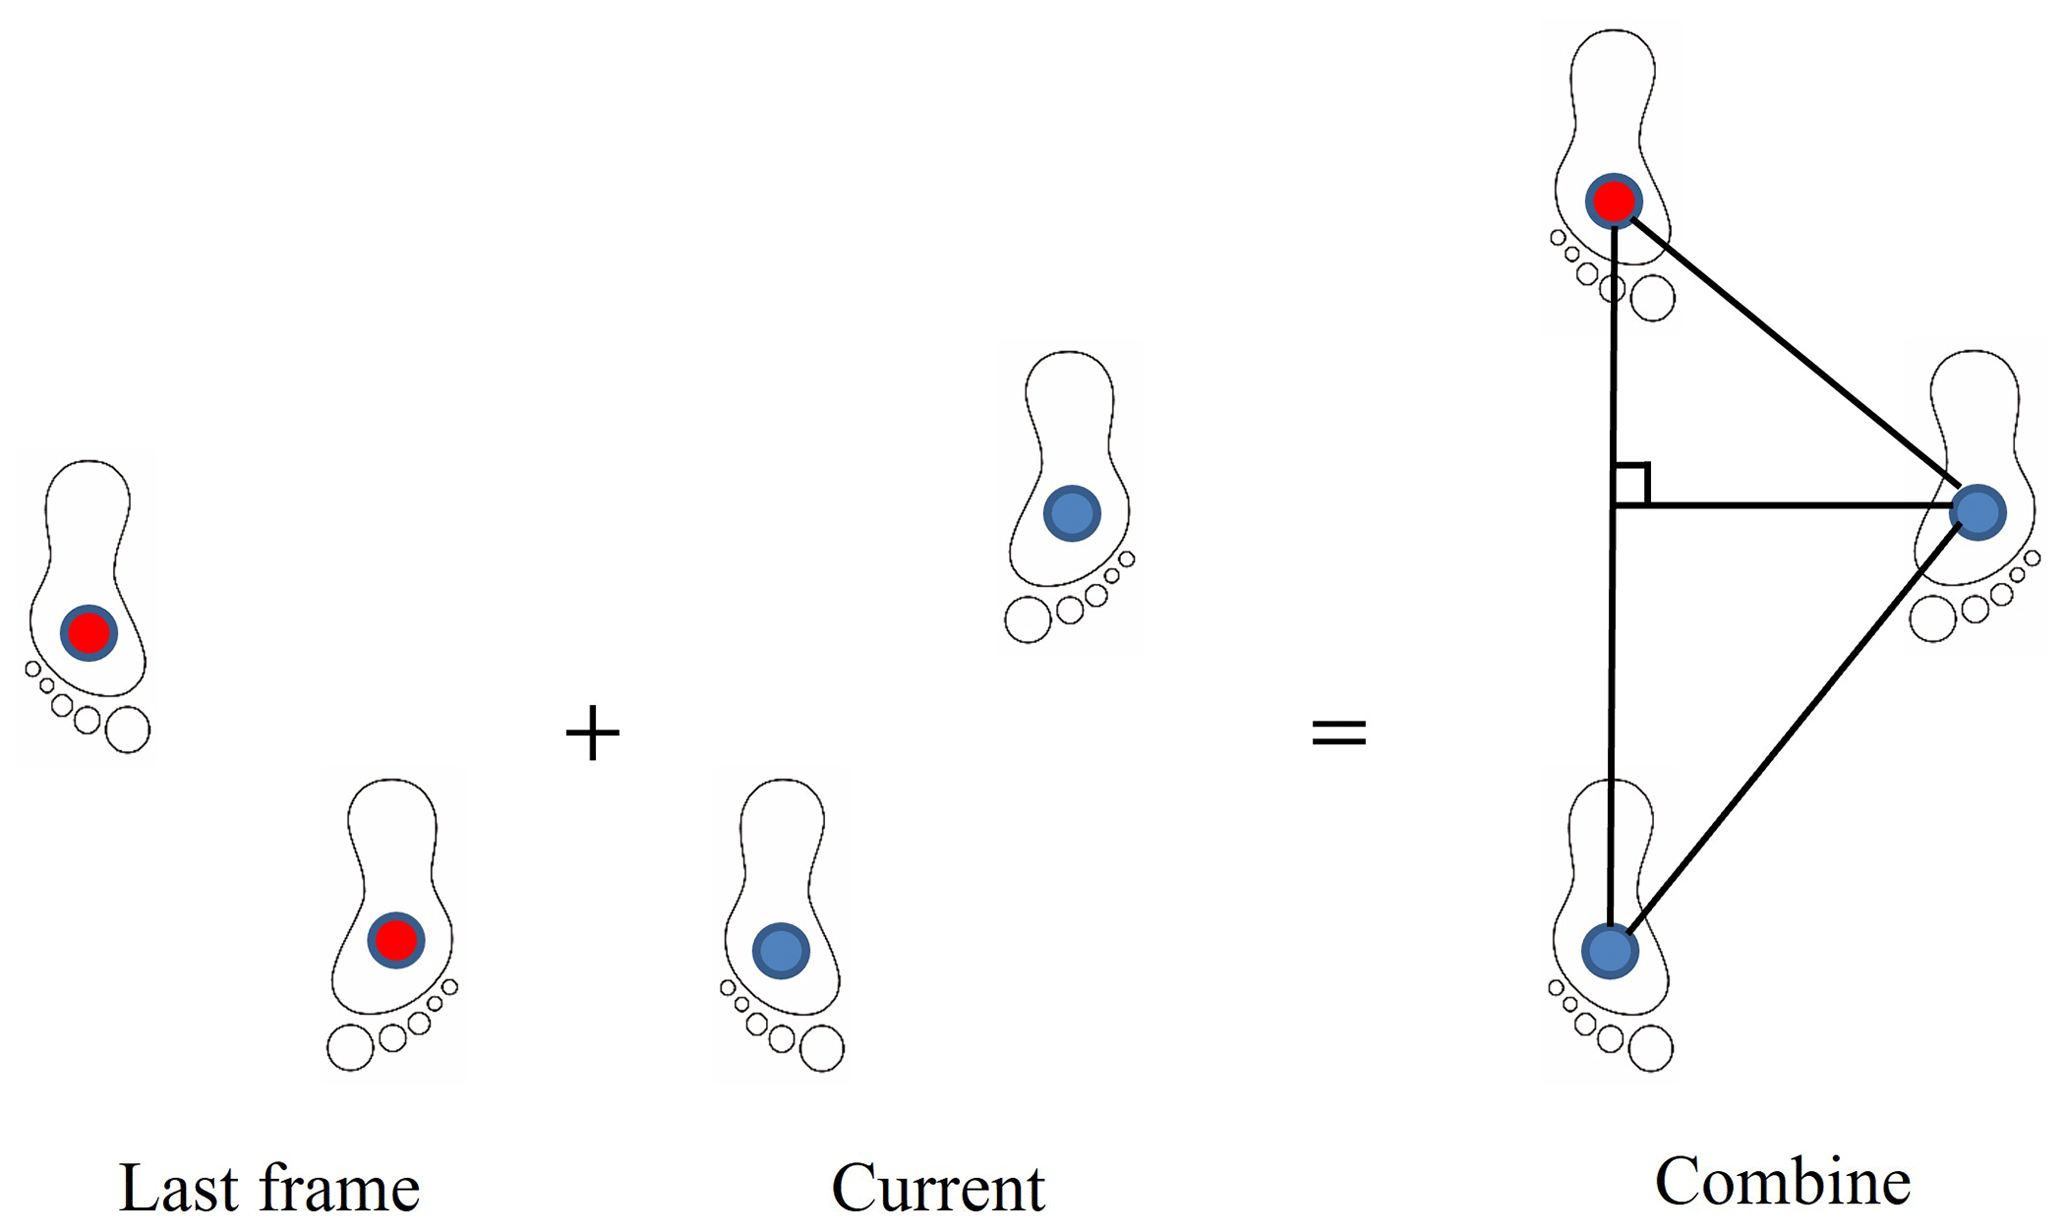
Define the new center point of the leg position formed by splicing as in the ith scan, where ; then, the formulas for calculating the step length is as follows:
where a vertical line is drawn from the support foot to the track of the swing foot and the vertical point is defined as , . The Euclidean distance between and is defined as the step length.
Through this algorithm, the errors of gait space parameters measured in mobile robots (such as the following two cases) can be reduced, as shown in Figs. 16 and 17. In the difference algorithm (Sakdarakse and Somboon, 2020), the step length is the distance in the y direction between the legs at the HS point. Figure 16 shows a case where the walking track is oblique and the lidar coordinate system remains unchanged. sl and sw are the step length and step width calculated by the difference algorithm, and sl′ and sw′ are the step length and step width calculated by the algorithm proposed in this paper. Similarly, the stride length is the distance on the diagonal line.
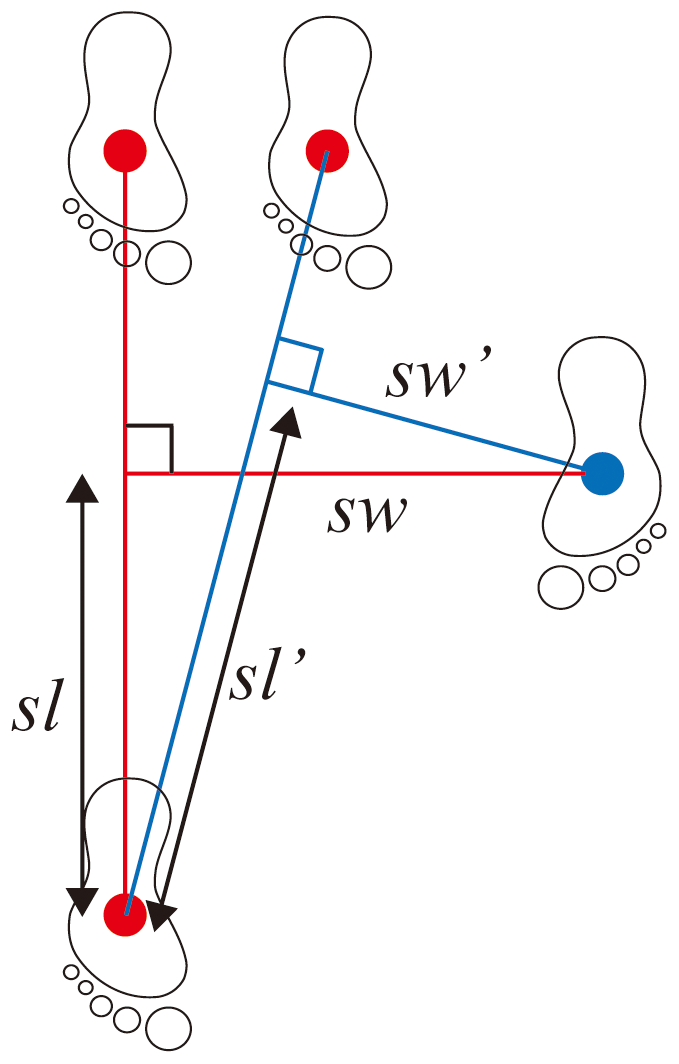
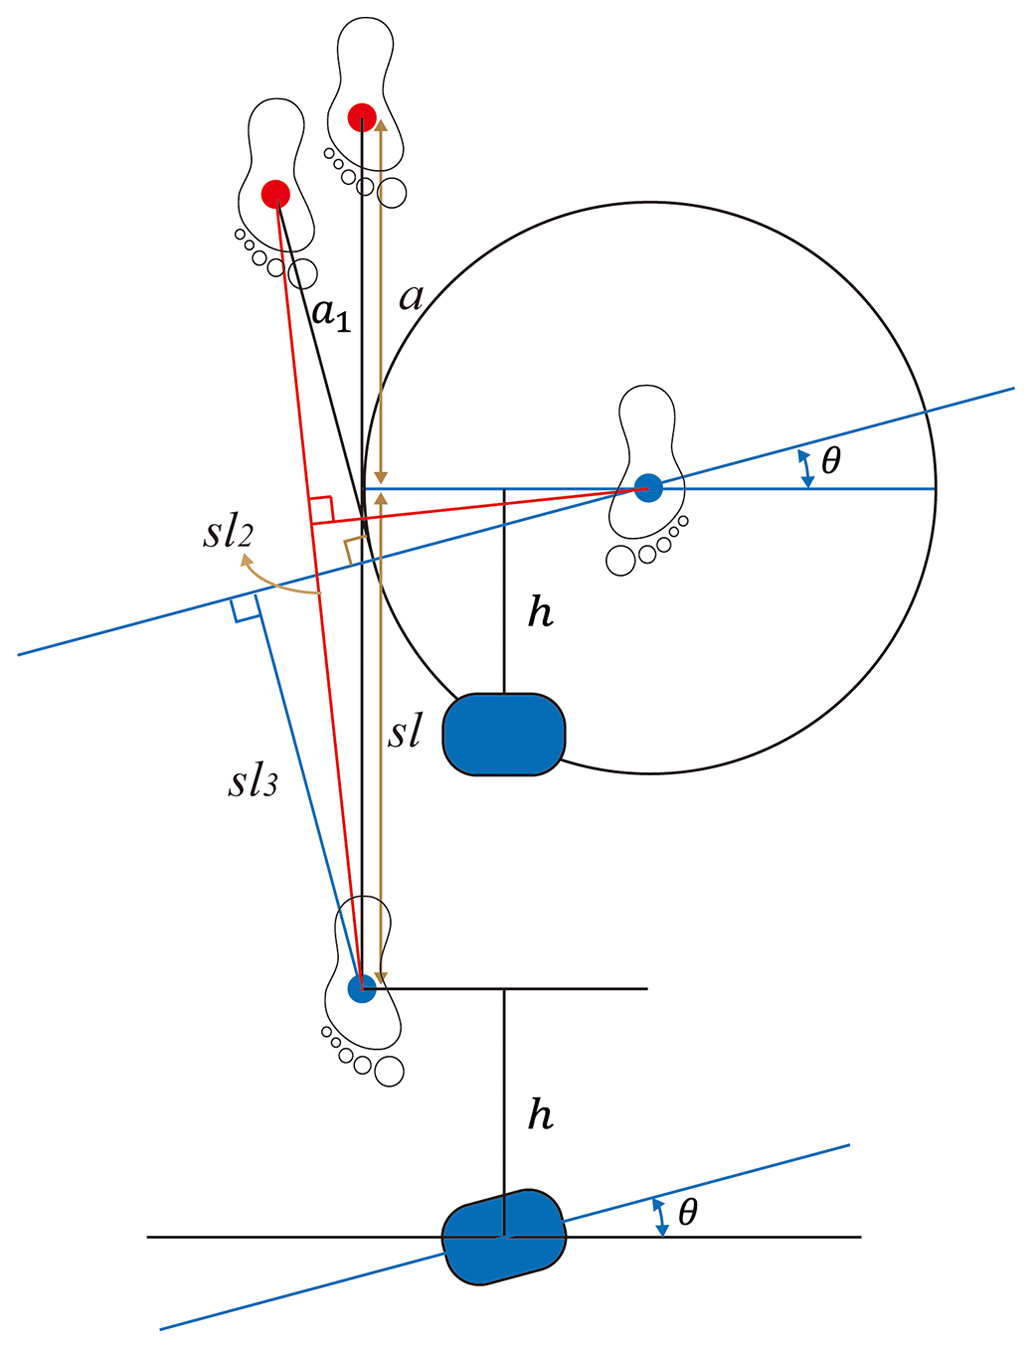
Figure 17 shows a situation when the track is straight and the lidar coordinate system changes. For the angle change of the lidar sensor θ, a=a1, sl, sl2 and sl3 are the actual step length, the step length calculated by the proposed algorithm and the step length calculated by the difference algorithm, respectively. As can be seen from the figure, the parameters calculated by the proposed algorithm in this paper are closer to the actual parameters, and as θ increases and the spatial parameters in actual walking are larger, the error can be effectively reduced by this algorithm.
3.6 Online real-time analysis algorithm
Based on the above gait analysis algorithm, the post-calculation of each gait parameter can be realized in the case of data sets. However, the real-time ability of the algorithm to recognize heel striking should be good. In this paper, 100 data points are taken as a dynamic window and 10 Hz is taken as a sampling frequency. In addition, on the basis of the 100 data points, whether the 99th data point is a trough (that is, whether the leg heel strikes the ground) is identified. Through this dynamic window, the function of real-time recognition of gait and calculation of gait parameters is realized.
Finally, through the communication between the upper and lower computers, the gait of the patient is collected in real time and presented on the interface of the rehabilitation robot, which brings the fun of walking training to the patient. It also provides gait parameter data for doctors to evaluate patients' recovery status, and the data are synchronously saved to the cloud database so that doctors can remotely view patient reports at any time.
4.1 Experimental setup
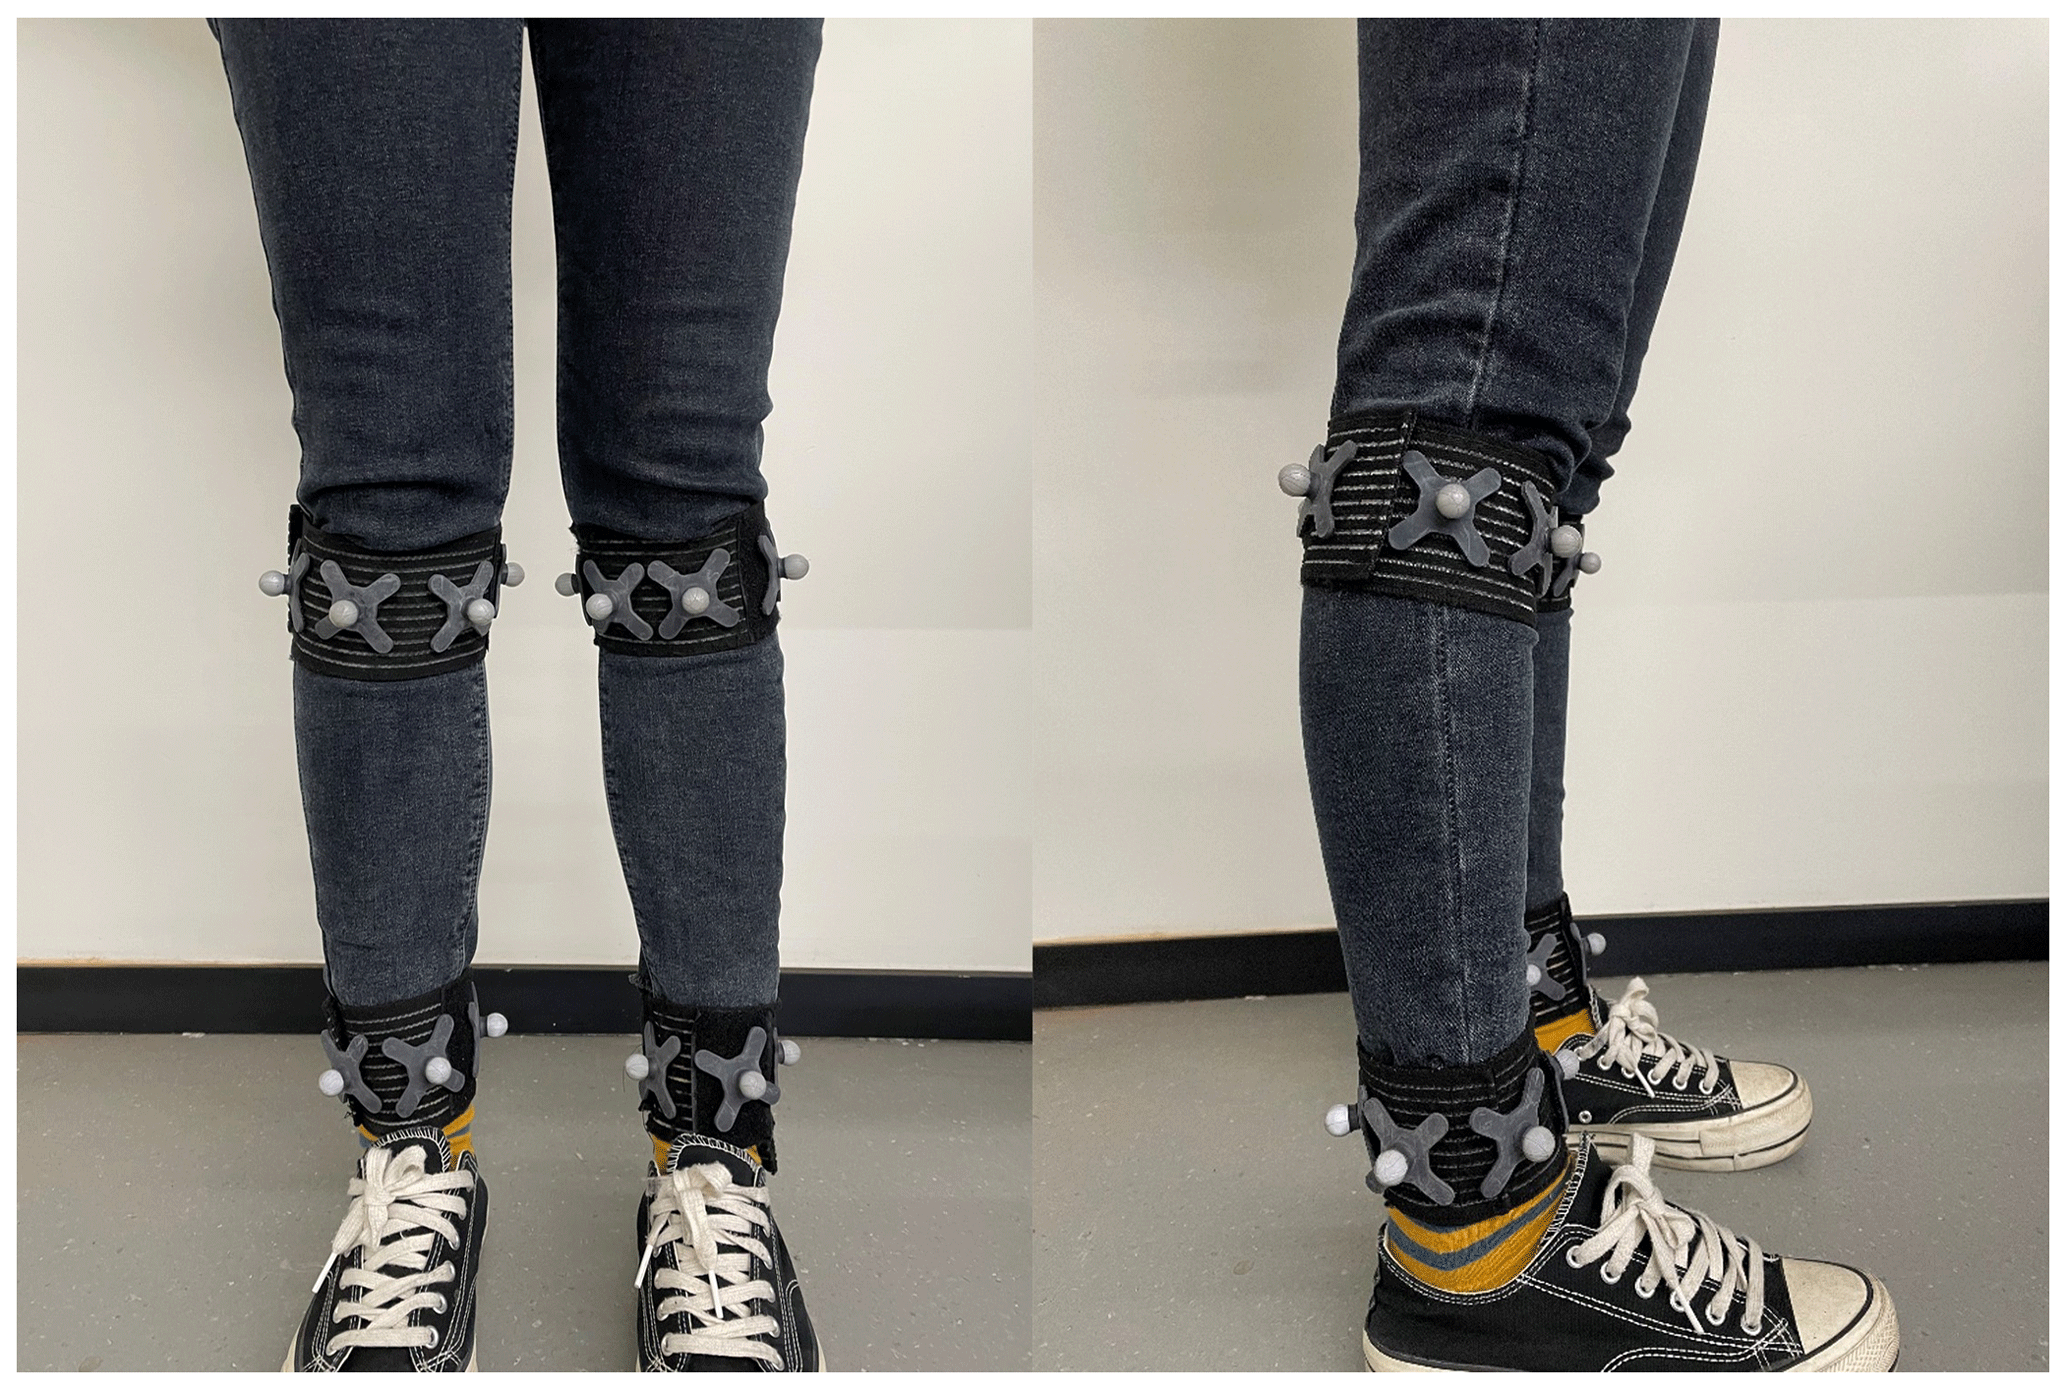
The optical motion capture system (OptiTrack, NaturalPoint, Inc, Corvallis, USA) is used as the reference system. In order to determine the joint location, optical markers are placed on the testers' knee joints and lateral ankles. A total of 22 markers are attached to each tester's lower limbs (see Fig. 18 for detailed marker locations). HS time (heel strike time) and TO time (toe off time) are automatically estimated based on the marked motion path. HS time is defined as the time when the distance between the marks of the left and right lateral malleolus of the leg maximizes in the direction of the tester (Tanabe et al., 2017). The TO time is defined as the maximum angle between the calf (the line connecting the center mark of the knee joint rigid body and the center mark of the ankle joint rigid body) and the vertical line in the sagittal plane. Based on this, HS position and TO position are calculated according to time. Therein, the origin of the coordinate system set by the reference system is located at the middle point of the walking distance.
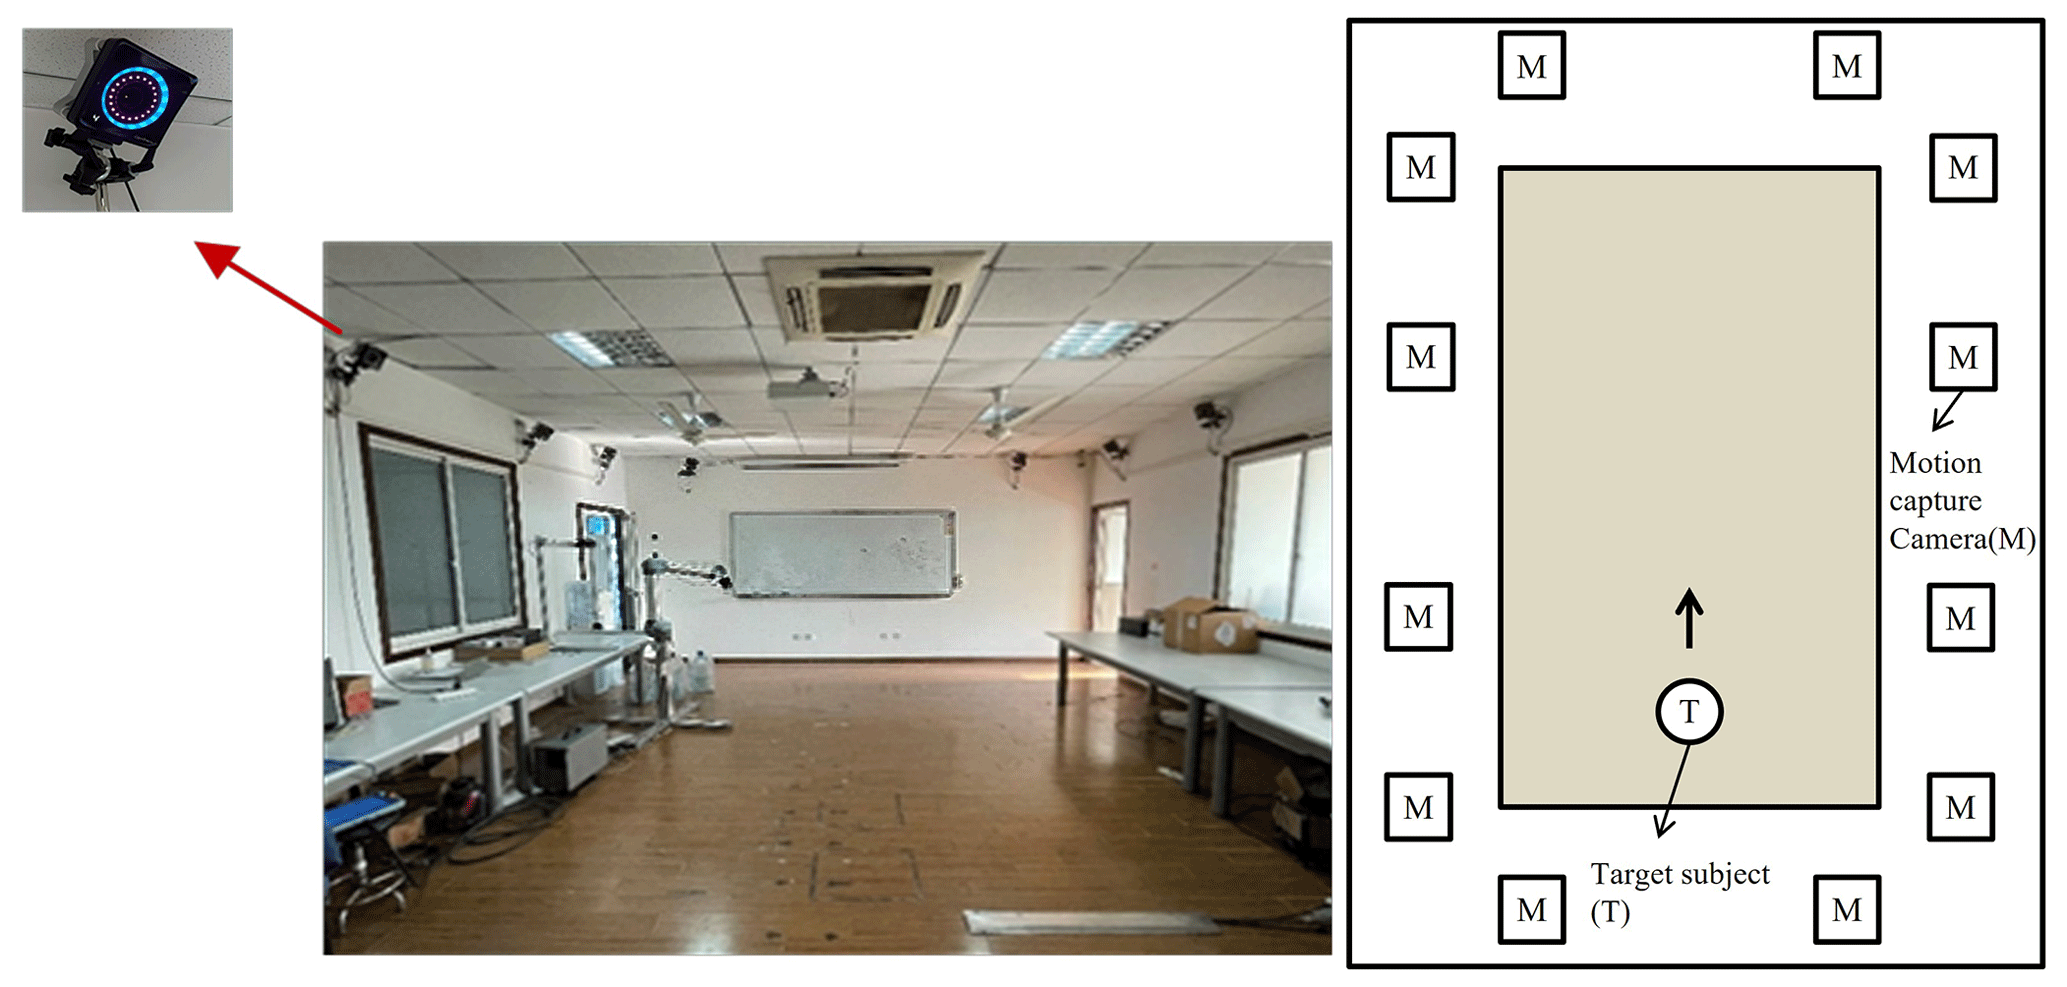
The OptiTrack Prime 17W camera is set around the top of the laboratory (see Fig. 19, where individual motion capture cameras are represented as M) to form the capture area of the entire motion capture system. The rehabilitation robot equipped with lidar is located at one end of the test area (represented by T in Fig. 19).
4.2 Verifying the effectiveness of the gait analysis algorithm
To verify the validity of the proposed gait analysis algorithm, six young testers (three males and three females: average age 24–26, height 170–175 cm and weight 50–60 kg) are recruited to participate in this experiment. In this experiment, each tester carries out five experiments. In the scene of using the rehabilitation robot, gait parameters calculated by the proposed gait analysis algorithm are compared with those measured by the OptiTrack.
The experiment scenario is as follows: before the experiment, the leg length and height of the shoes worn by the tester are recorded, and the tester wears the belt of the rehabilitation robot. The robot moves forward with the force sensor in the belt, and there is a certain distance between the tester's waist and the robot. In the five experiments, the first three experiments are carried out according to the fixed step length and the number of steps marked on the ground (the fixed step length is 350 mm according to the height of the tester in this experiment). For the last two times, it is enough to follow a certain length of a straight path according to the usual walking habits of the tester, taking into account the differences in walking speed and stride length among the different individuals. At the same time, the optical markers are affixed to 22 positions of the lower limbs of the tester. During the experiment, the synchronization of the gait analysis algorithm and data collected by 3D motion capture system is ensured.
4.3 Analysis of gait parameter results
The statistics and errors of gait parameters detected by the reference system and the proposed gait analysis algorithm are shown in Table 1.
Table 1Comparison of spatiotemporal parameters between the reference system and the proposed gait analysis algorithm.
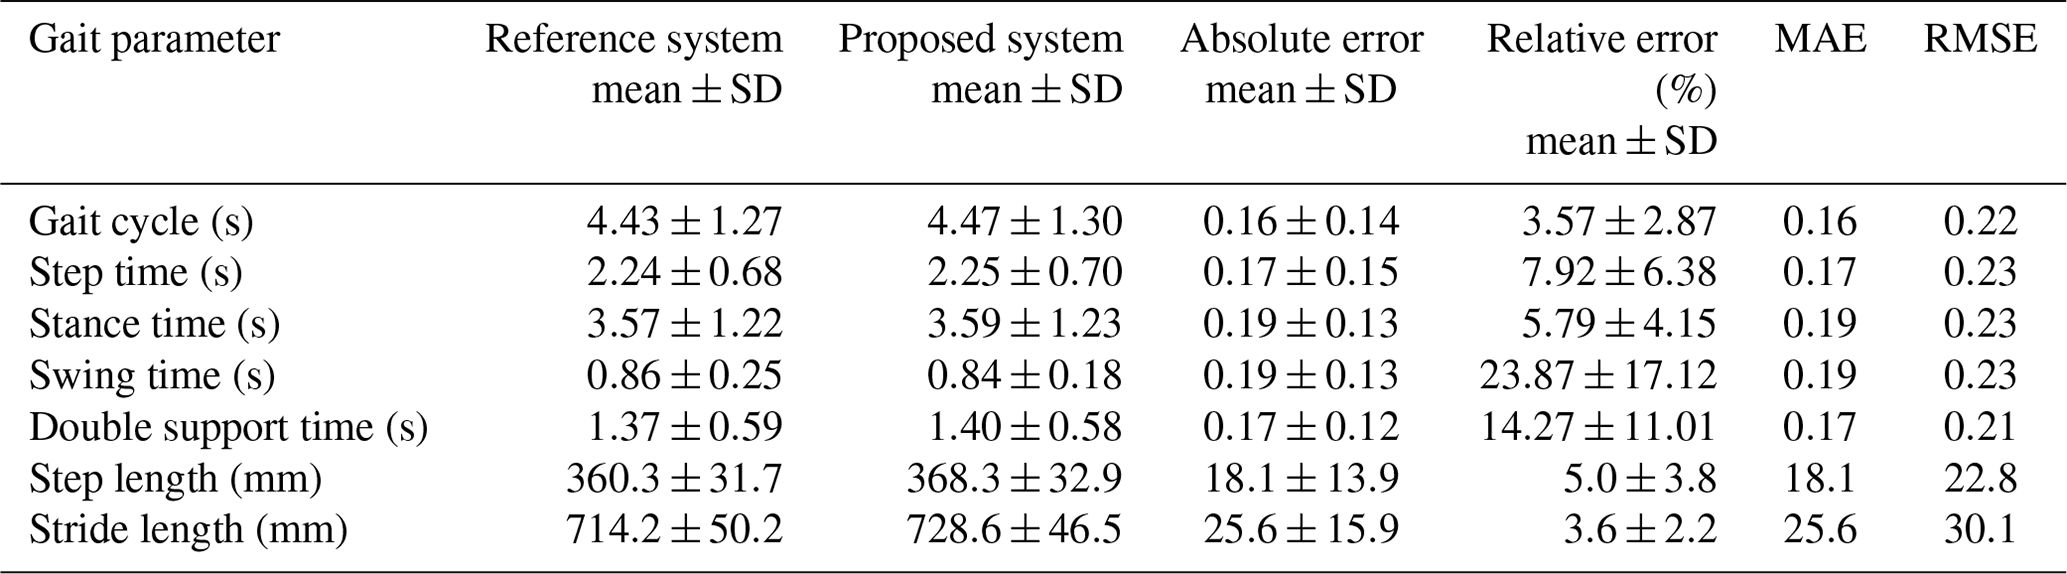
As can be seen from Table 1, for the measurement of gait parameters, because the values of swing time and double support time are relatively small compared with other time parameters, the relative errors of the two are relatively large, 23.87 % and 14.27 %, respectively. The relative errors of the other parameters are all kept below 8 %. At the same time, from the measured step length and step width, the measured values of 360.3, 714.2, 368.3 and 728.6 mm in the experimental group and the control group are slightly different from the fixed step length of 350 mm and step width of 700 mm specified in the experiment. In summary, compared with other gait analysis systems (Fudickar et al., 2018; Iwai et al., 2019), the measurement error of lidar gait analysis algorithm is within the acceptable range. In addition, it can be observed that the walking cycle time of healthy adults is about 1.3 s, the swing time is about 0.47 s and the stance time is about 0.83 s (Kotiadis et al., 2010). On the lower limb rehabilitation robot, the corresponding time parameter value is significantly extended, indicating that rehabilitation walking in the lower limb rehabilitation robot is different from walking in natural, unrestrained conditions.
The correlation and consistency between the two systems can be evaluated by the Pearson correlation coefficient and intra-group correlation coefficient (ICC(2,1)) and 95 % confidence interval. When using Pearson correlation analysis, it is necessary to judge its significance (p) and correlation coefficient (r). Significance indicates whether there is a relationship between the two system, while the correlation coefficient is used to judge the strength of the relationship between the two systems. The correlation of gait parameters between the two systems is shown in Fig. 20. Table 2 shows the correlation and consistency of gait parameters measured between the two systems.
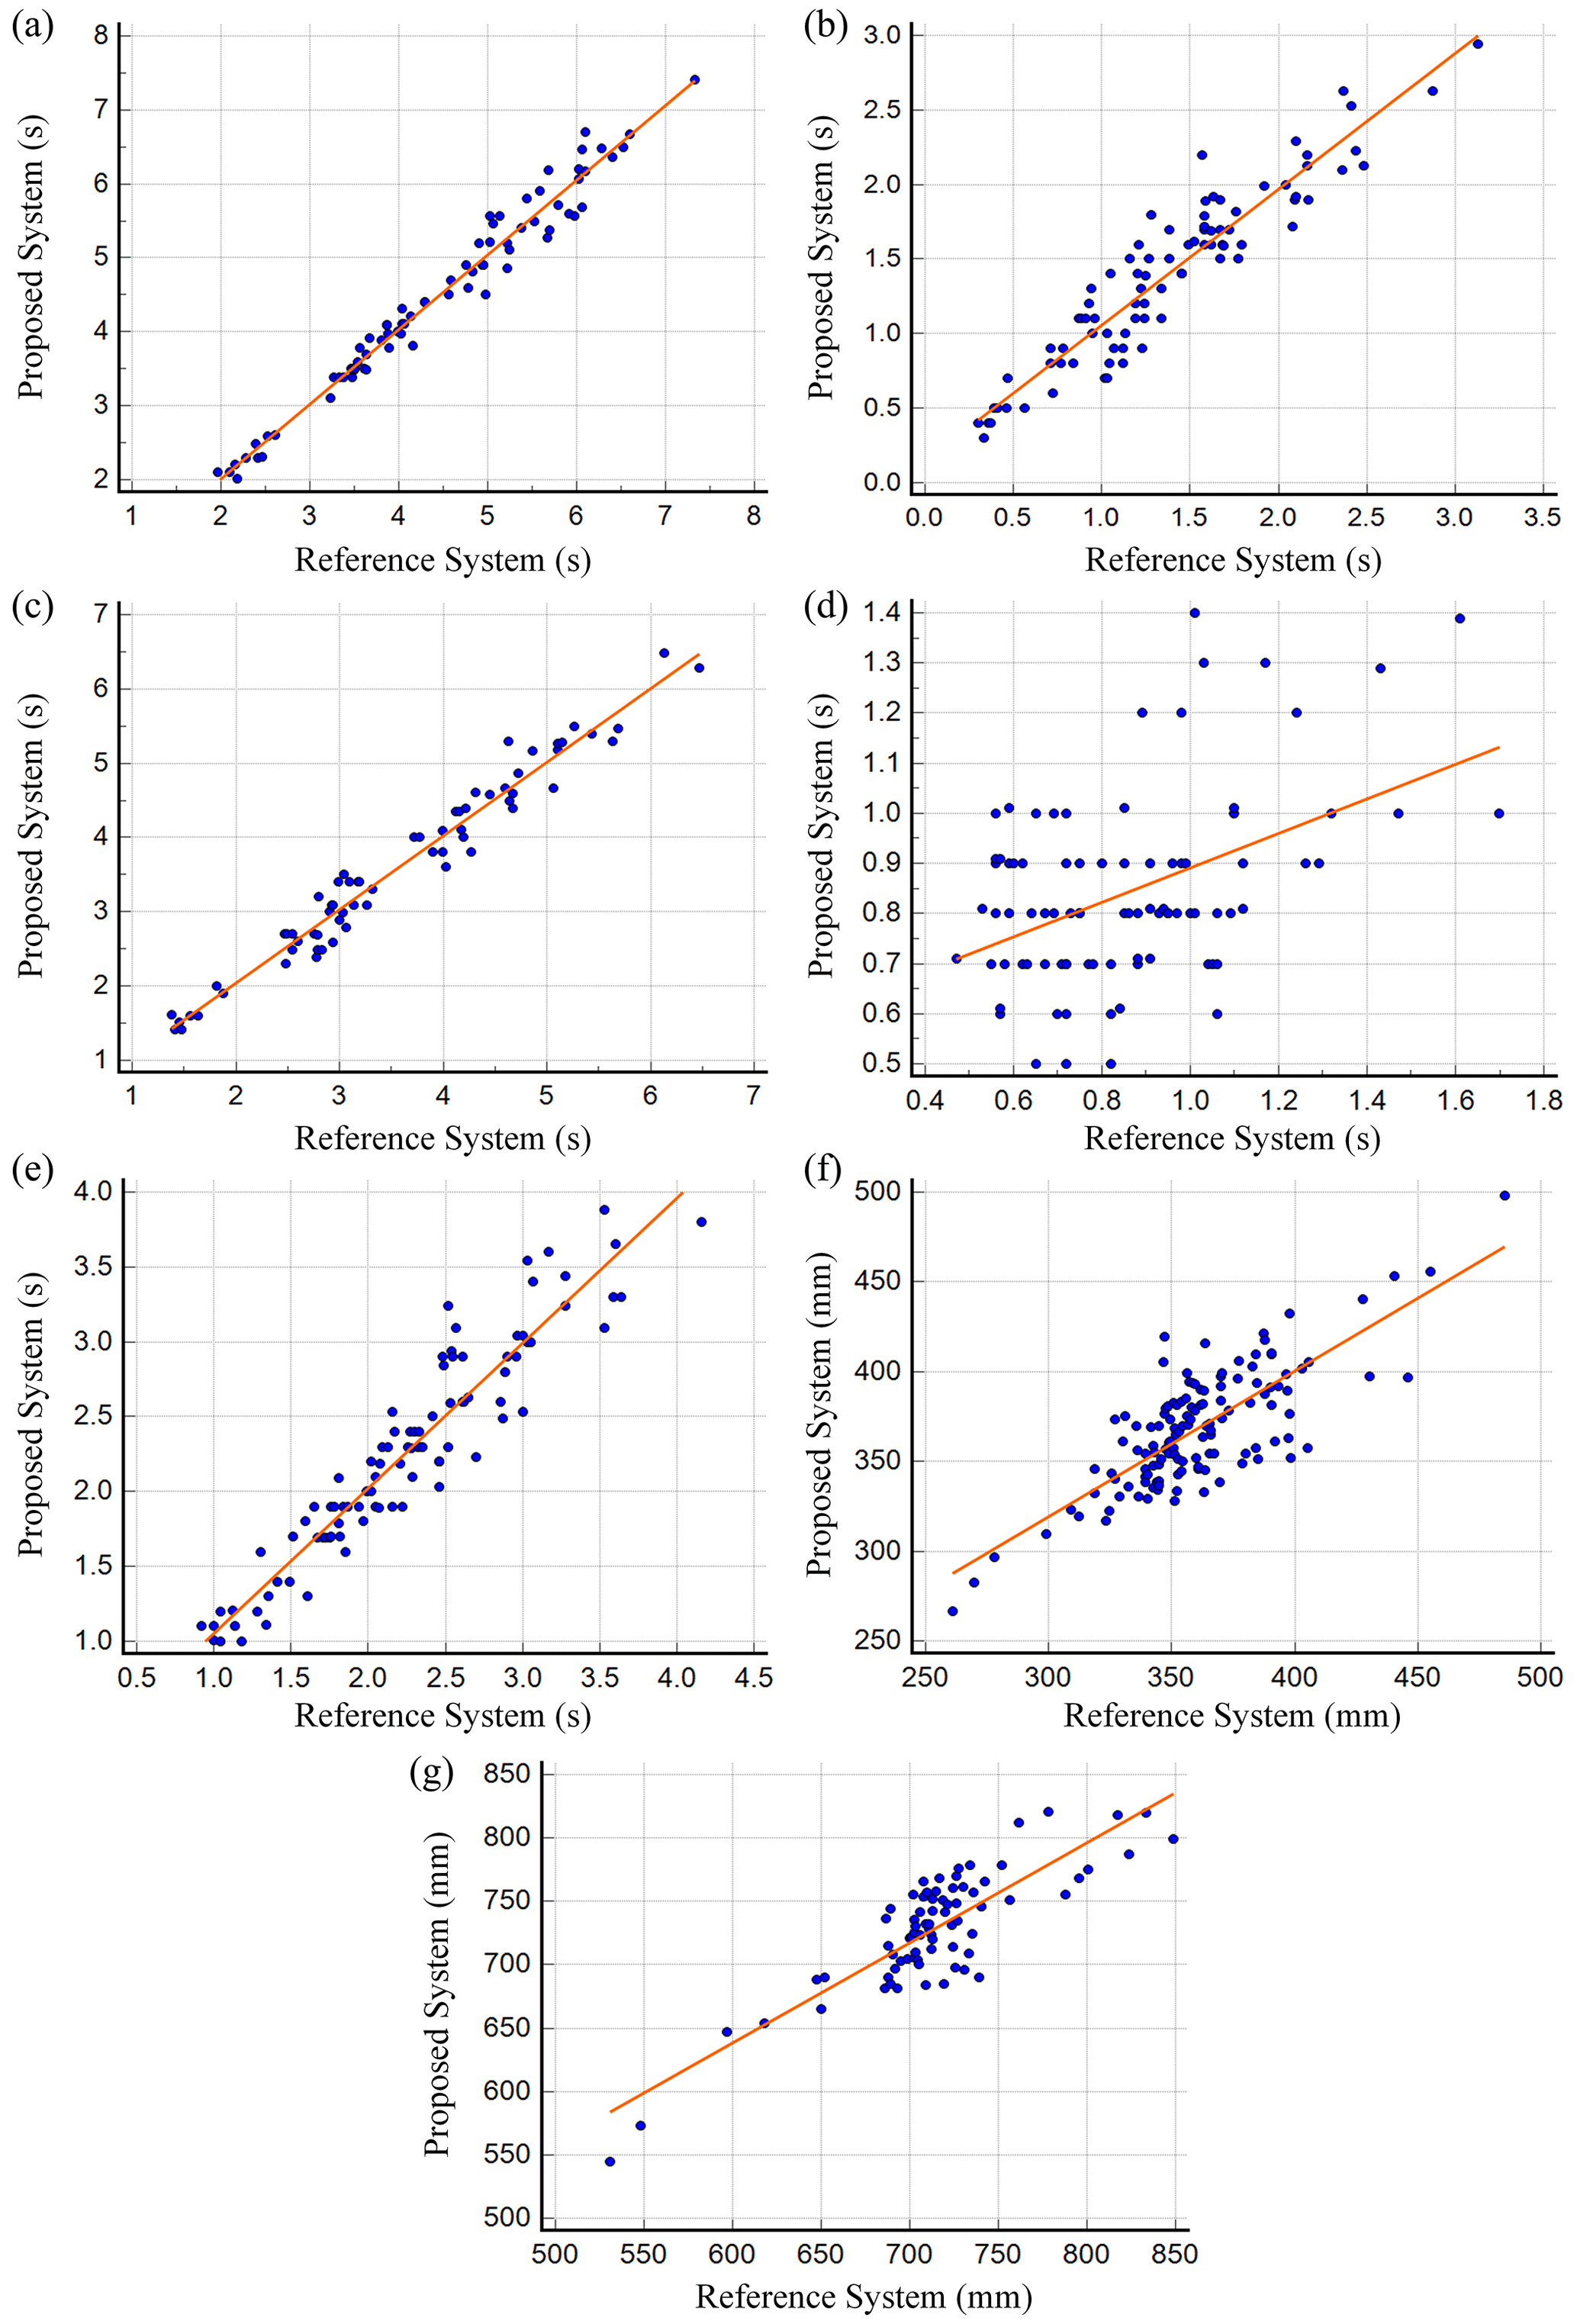
Figure 20Correlation of gait parameters between the two systems: (a) gait cycle, (b) double support time, (c) stance time, (d) swing time, (e) step time, (f) step length and (g) stride length.
Table 2Correlation of gait parameters between the proposed system and the reference system.
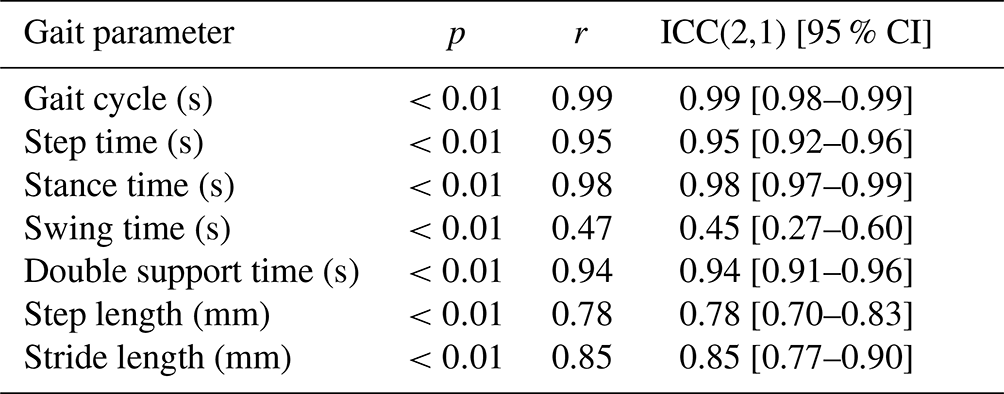
It can be seen from Fig. 20 and Table 2 that all parameters present a significant positive correlation (p<0.01), among which all gait parameters except swing time show good correlation and consistency with the dynamic arrest system (r>0.75, ICC(2,1) >0.75). The gait cycle and the stance time show a very high correlation and consistency (r=0.99, ICC(2,1) =0.99 and r=0.98, ICC(2,1) =0.98), while the swing time has relatively low correlation and consistency compared with other time parameters (r=0.47, ICC(2,1) =0.45). This may be caused by two factors. First, the swing time parameter itself has a small measurement range, and ICC is the ratio of the true variance to the true variance plus error. If the true variance is small, the ICC will be relatively small. Secondly, there are certain errors in the measurement method itself. The proposed algorithm will have similar errors no matter how the measurement parameters change. Therefore, the decrease of the measured value with the measurement error may reduce the concurrent validity of the time parameter measured in the proposed method (Iwai et al., 2019).
Bland–Altman (BA) diagram is a common clinical method used to evaluate the consistency of two measurement methods. At the same time, in order to prove the influence of individuals in each gait parameter on the difference, a BA diagram of each gait parameter is drawn for this paper (as shown in Fig. 21). The horizontal axis represents the mean value of the gait parameters of the two systems. The vertical axis represents the difference between the measured values of the two systems. The blue horizontal solid line in the middle represents the mean value of the difference. The orange horizontal dashed line represents the position where the mean value of the difference is 0. The upper and lower brown horizontal dashed lines respectively represent the upper and lower limits of 95 % consistency limits, namely, the standard deviation of 1.96 times.
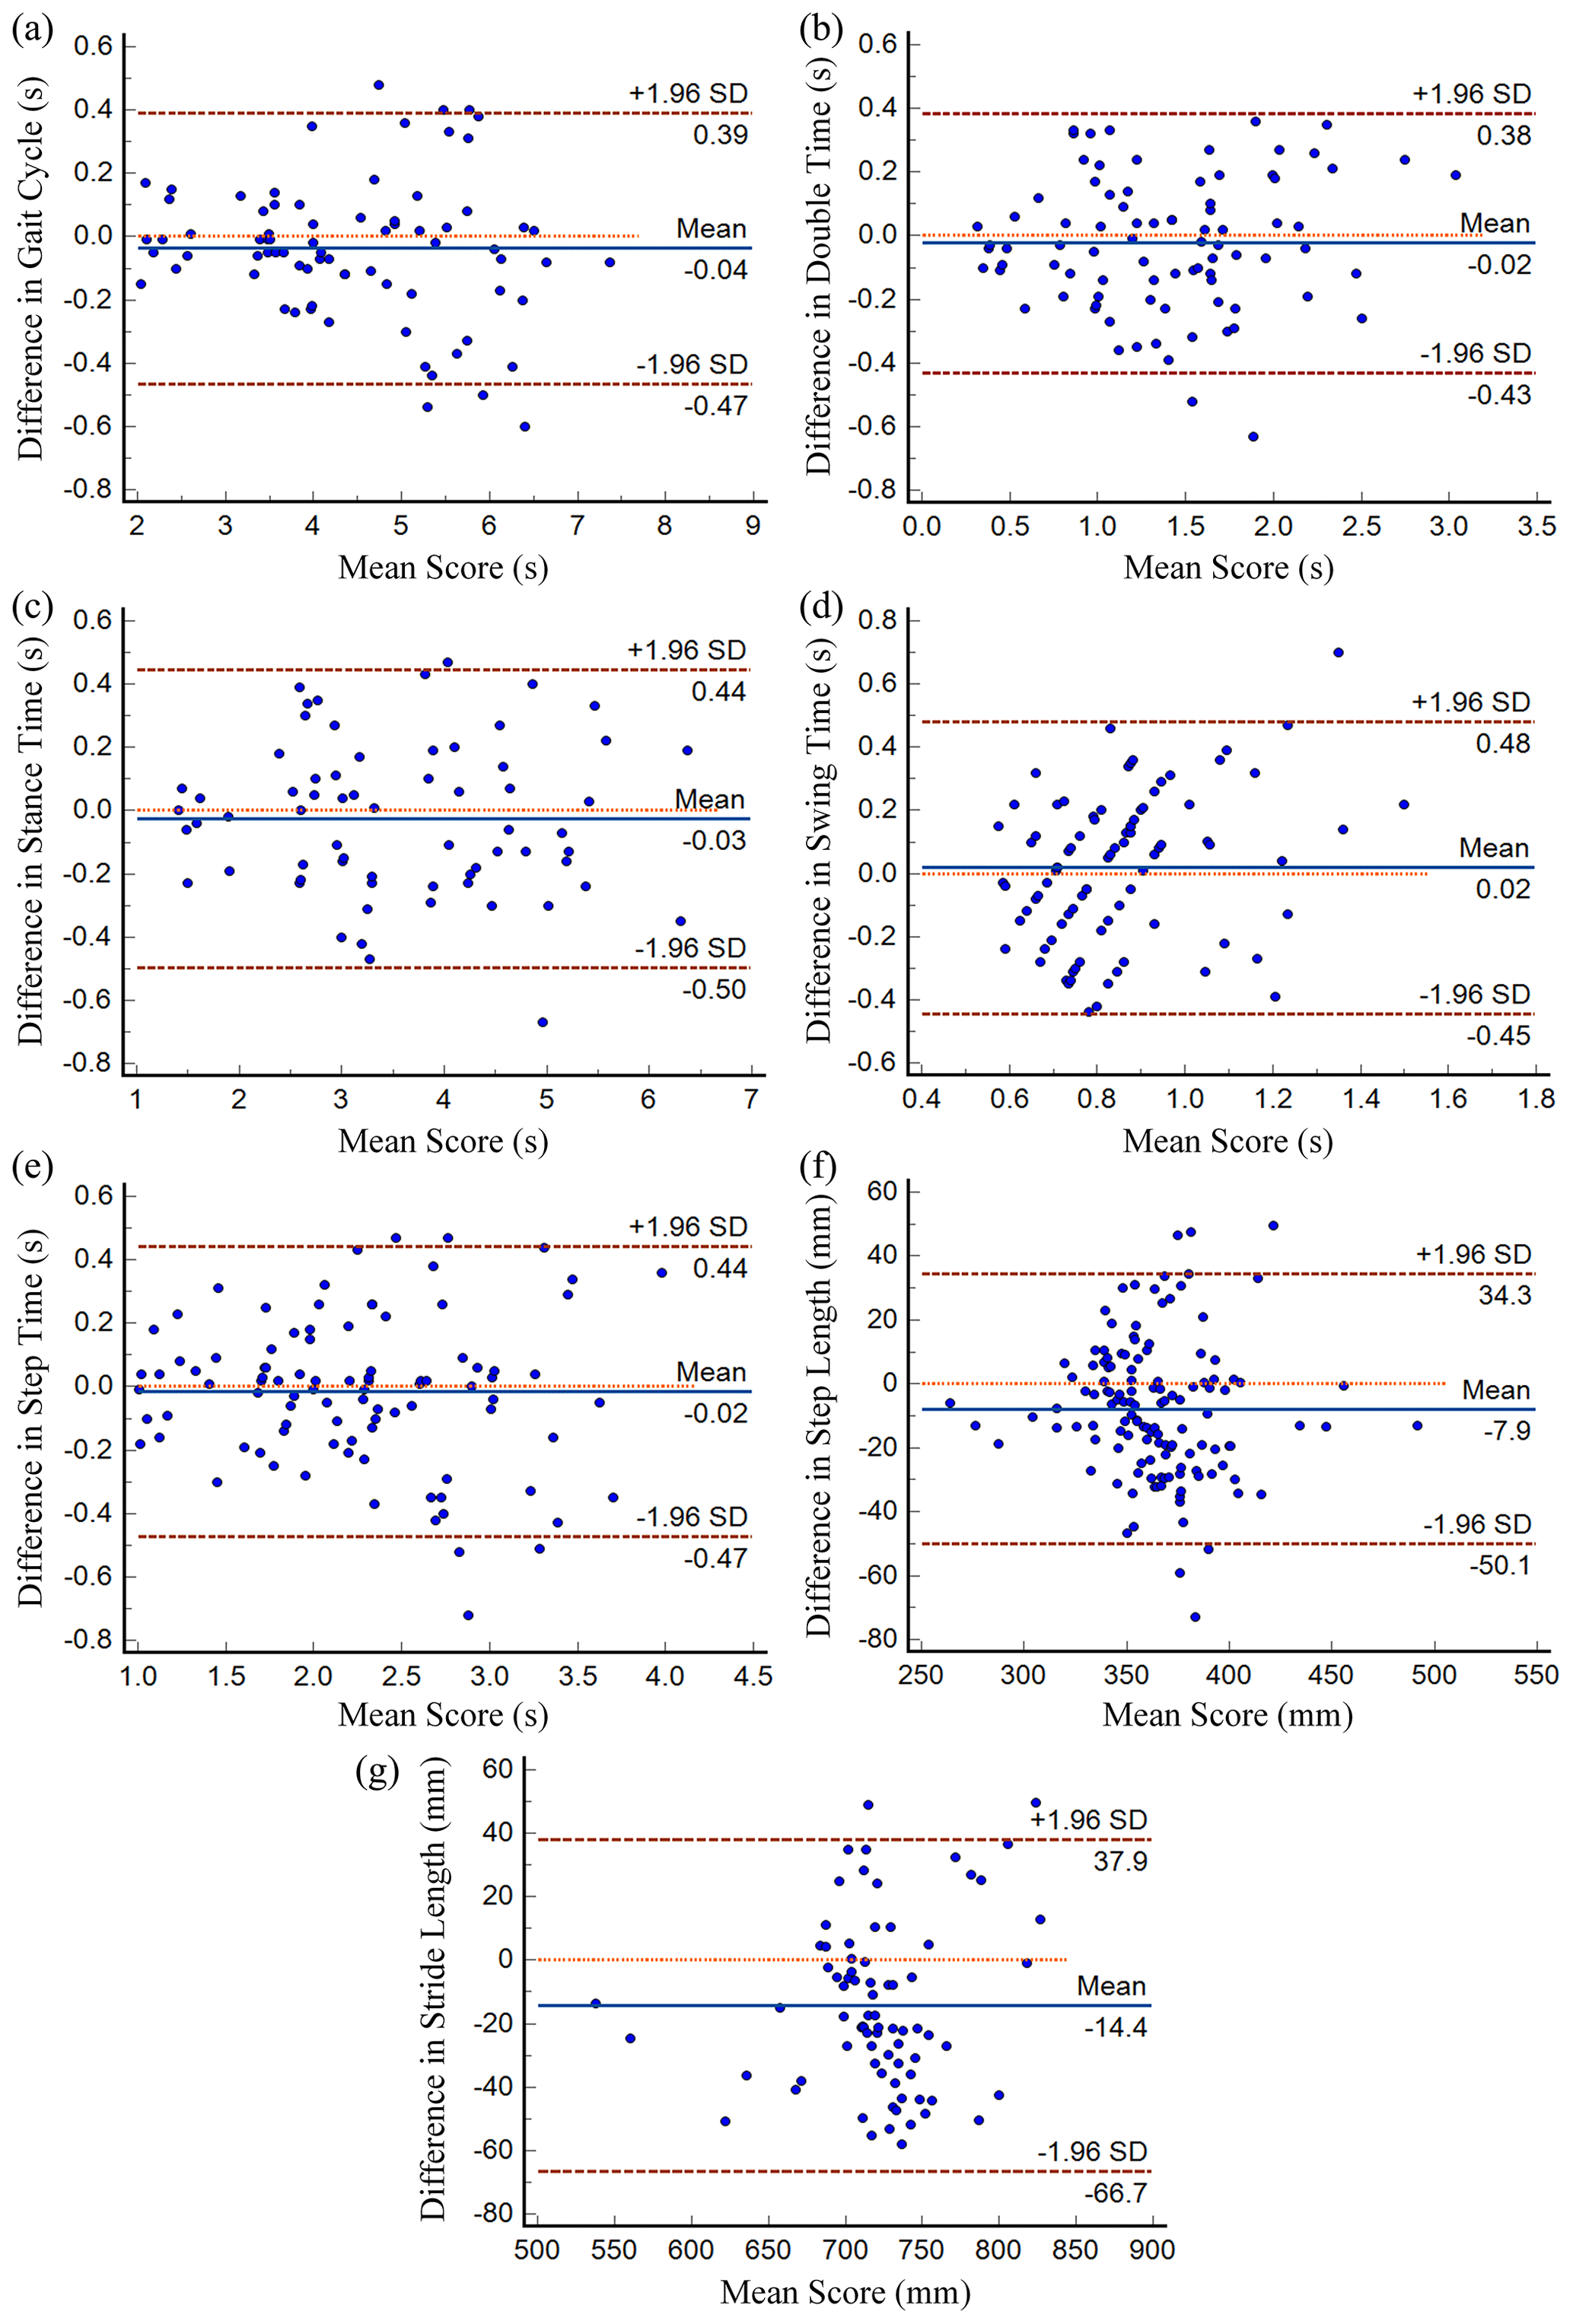
Figure 21Bland–Altman diagrams of the two systems with respect to gait parameters: (a) gait cycle, (b) double support time, (c) stance time, (d) swing time, (e) step time, (f) step length and (g) stride length.
If the difference of the measurement results follows a normal distribution, then 95 % of the difference should lie within mean ± 1.96 SD. When most of the difference points lie within this interval and the mean value of difference is close to zero, this indicates that the consistency of the two systems is better. As can be seen from Fig. 21, most of the points fall within the consistency limit and the average value of the difference is close to zero, which proves that the proposed gait analysis algorithm and the reference system are very consistent.
4.4 Result analysis of different spatial parameter calculation methods
For the same point cloud data, the proposed spatial parameter-splicing algorithm based on the time series and the existing difference algorithm are used to compare step length results. The statistical values and errors obtained are shown in Table 3.
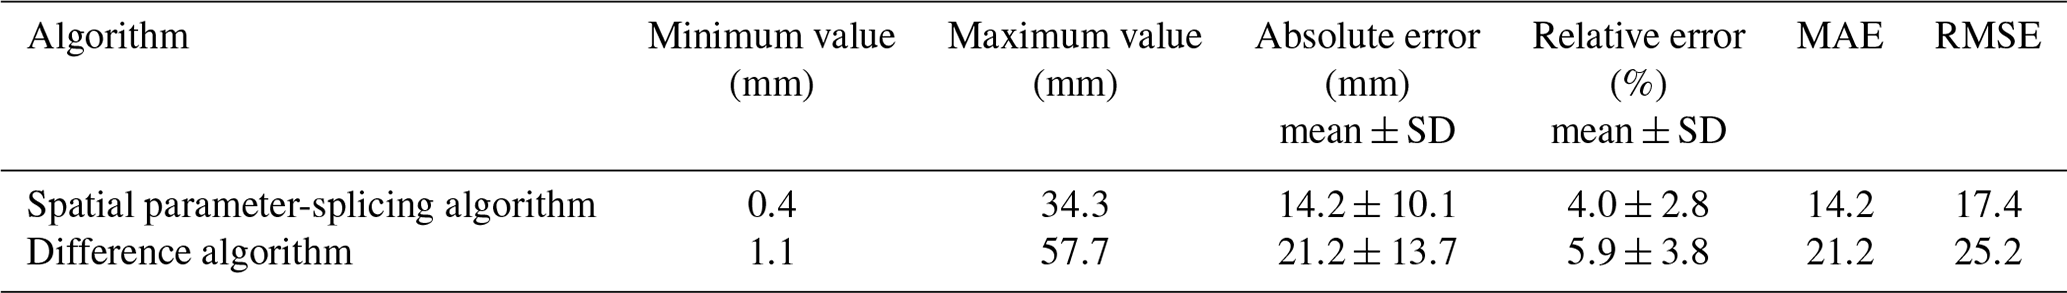
As can be seen from Table 3, when the tester walks randomly along a linear path of a certain length in accordance with their usual walking habits, the relative error and absolute error of the step length calculated by the proposed algorithm are 4 % and 14.2 mm. Compared with the relative error of 5.9 % and the absolute error of 21.2 mm calculated by the existing difference algorithm, it can be seen that the error calculated by the proposed algorithm is smaller than that calculated by the difference spatial parameter algorithm.
4.5 Analysis of the real-time effect of the proposed algorithm
In the above experiment, when the tester used the lower limb rehabilitation robot for walking training, the robot interactive interface simultaneously showed the footprints of the tester. For example, the tester steps out on their left leg and we record the moment when their left leg reaches HS. The proposed gait analysis algorithm synchronously detects the data of the left leg. The processed data are transmitted to the robot through the interface based on TCP communication, and the footprint image and parameters are synchronously displayed on the interface.
Table 4Average recognition delay and RMSE of the proposed algorithm.
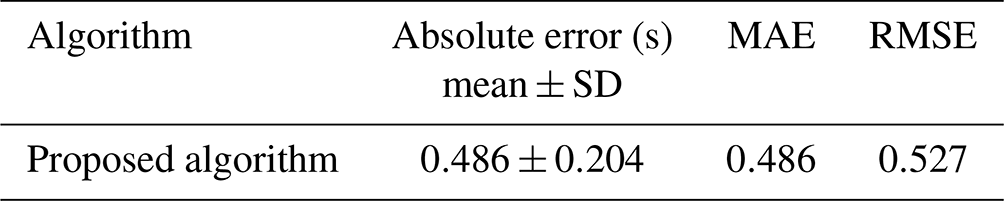
As can be seen from Table 4, the average recognition delay of the proposed gait analysis algorithm is about 0.486 s, which is within the acceptable range. The recognition delay is mainly the detection delay of an HS event and the fluctuation of the leg data in the HS event. The scanning frequency of the lidar sensor itself is 10 Hz. According to the law of the gait curve, after reaching the HS point, the HS situation can be determined only when the next data point is detected within at least 0.1 s.
At present, most quantitative gait analysis is usually limited by site and scope and cannot be well integrated with lower limb rehabilitation robots. In this paper, a gait analysis algorithm for a lower limb rehabilitation robot is proposed, which uses lidar to obtain gait phase information and gait spatiotemporal parameters. The algorithm includes the adaptive clustering method based on a sliding threshold, leg contour fitting and center estimation, recognition of gait phase key points and calculation of gait time and space parameters. To effectively reduce the errors caused by patient trajectory deviation and changes in the lidar coordinate system due to robot motion during walking, a spatiotemporal parameter-splicing algorithm based on a time series is proposed. Compared with the gait parameters measured by the optical motion capture system, the experimental results verify the effectiveness and accuracy of the proposed algorithm. Except for the two parameters of double support time and swing time, which have relatively large relative errors due to their small values, the relative errors of other gait parameters are kept below 8 %. Based on the gait analysis algorithm, a dynamic window method is proposed in this study, which takes 10 Hz as the sampling frequency and 100 data points as the dynamic window to identify whether the 99th data point is the HS point, so as to realize real-time recognition and gait parameter calculation. The experimental results show that the average recognition delay of the proposed algorithm is about 0.486 s, which is within the acceptable range, and it shows good performance for the application of online gait parameter calculation of mobile robots.
In future development work, emphasis should be placed on the application of online gait parameters in real-time robot control and interaction strategies, intelligent recognition of hemiplegia and other abnormal gaits, adaptive adjustment of rehabilitation plan, etc., which have good application prospects in the fields of mobile robots, rehabilitation and diagnostic monitoring.
The data that support the findings of this study are available from the corresponding author upon reasonable request.
LZ and TS conceived the idea. LZ wrote the experimental code and finalized the paper. TS provided financial and project support for the experiment.
The contact author has declared that neither of the authors has any competing interests.
Publisher’s note: Copernicus Publications remains neutral with regard to jurisdictional claims in published maps and institutional affiliations.
The authors are grateful to the anonymous reviewers and the editor for their comments and suggestions on improving our manuscript.
This research has been supported by the Shanghai Municipal of Science and Technology Commission (grant no. 21SQBS00300), the National Natural Science Foundation of China (grant no. 82227807), the Special Fund for Digital Transformation of Shanghai (grant no. 202202004) and the Open Project of the Medical and Industrial Integration Laboratory of Jiangning Hospital Affiliated to Nanjing Medical University (grant no. JNYYZXKY202218).
This paper was edited by Wuxiang Zhang and reviewed by two anonymous referees.
Ahmed, F., Paul, P. P., and Gavrilova, M. L.: Kinect-based gait recognition using sequences of the most relevant joint relative angles, Journal of Winter School of Computer Graphics, 23, 147–156, 2015.
Amitrano, F., Coccia, A., Ricciardi, C., Donisi, L., Cesarelli, G., Capodaglio, E. M., and D'Addio, G.: Design and Validation of an E-Textile-Based Wearable Sock for Remote Gait and Postural Assessment, Sensors, 20, 6691, https://doi.org/10.3390/s20226691, 2020.
Baghdadi, A., Cavuoto, L. A., and Crassidis, J. L.: Hip and Trunk Kinematics Estimation in Gait Through Kalman Filter Using IMU Data at the Ankle, IEEE Sens. J., 18, 4253–4260, https://doi.org/10.1109/jsen.2018.2817228, 2018.
Bayón, C., Ramírez, O., Serrano, J. I., Del Castillo, M. D., Pérez-Somarriba, A., Belda-Lois, J. M., Martínez-Caballero, I., Lerma-Lara, S., Cifuentes, C., Frizera, A., and Rocon, E.: Development and evaluation of a novel robotic platform for gait rehabilitation in patients with Cerebral Palsy: CPWalker, Robot. Auton. Syst., 91, 101–114, https://doi.org/10.1016/j.robot.2016.12.015, 2017.
Bejarano, N. C., Ambrosini, E., Pedrocchi, A., Ferrigno, G., Monticone, M., and Ferrante, S.: A Novel Adaptive, Real-Time Algorithm to Detect Gait Events From Wearable Sensors, IEEE T. Neur. Sys. Reh., 23, 413–422, https://doi.org/10.1109/tnsre.2014.2337914, 2015.
Buckley, C., Mico-Amigo, M. E., Dunne-Willows, M., Godfrey, A., Hickey, A., Lord, S., Rochester, L., Del Din, S., and Moore, S. A.: Gait Asymmetry Post-Stroke: Determining Valid and Reliable Methods Using a Single Accelerometer Located on the Trunk, Sensors, 20, 37, https://doi.org/10.3390/s20010037, 2020.
Cifuentes, C. A. and Frizera, A.: Human-Robot Interaction Strategies for Walker-Assisted Locomotion, in: Springer Tracts in Advanced Robotics, Springer Cham, 115, https://doi.org/10.1007/978-3-319-34063-0, 2016.
Costilla-Reyes, O., Vera-Rodriguez, R., Scully, P., and Ozanyan, K. B.: Analysis of Spatio-Temporal Representations for Robust Footstep Recognition with Deep Residual Neural Networks, IEEE T. Pattern Anal., 41, 285–296, https://doi.org/10.1109/tpami.2018.2799847, 2019.
Duong, H. T. and Suh, Y. S.: Human Gait Tracking for Normal People and Walker Users Using a 2D LiDAR, IEEE Sens. J., 20, 6191–6199, https://doi.org/10.1109/jsen.2020.2975129, 2020.
Eizentals, P., Katashev, A., and Oks, A.: Gait analysis by using Smart Socks system, IOP Conf. Ser.-Mat. Sci., 459, 012037, https://doi.org/10.1088/1757-899x/459/1/012037, 2018.
Fudickar, S., Stolle, C., Volkening, N., and Hein, A.: Scanning Laser Rangefinders for the Unobtrusive Monitoring of Gait Parameters in Unsupervised Settings, Sensors, 18, 3424, https://doi.org/10.3390/s18103424, 2018.
Gurchiek, R. D., Garabed, C. P., and McGinnis, R. S.: Gait event detection using a thigh-worn accelerometer, Gait Posture, 80, 214–216, https://doi.org/10.1016/j.gaitpost.2020.06.004, 2020.
Hutchison, L., Scharfbillig, R., Uden, H., and Bishop, C.: The effect of footwear and foot orthoses on transverse plane knee motion during running – A pilot study, J. Sci. Med. Sport, 18, 748–752, https://doi.org/10.1016/j.jsams.2014.11.007, 2015.
Hynes, A., Czarnuch, S., Kirkland, M. C., and Ploughman, M.: Spatiotemporal Gait Measurement With a Side-View Depth Sensor Using Human Joint Proposals, IEEE J. Biomed. Health, 25, 1758–1769, https://doi.org/10.1109/jbhi.2020.3024925, 2021.
Iwai, M., Koyama, S., Tanabe, S., Osawa, S., Takeda, K., Motoya, I., Sakurai, H., Kanada, Y., and Kawamura, N.: The validity of spatiotemporal gait analysis using dual laser range sensors: a cross-sectional study, Archives of Physiotherapy, 9, 3, https://doi.org/10.1186/s40945-019-0055-6, 2019.
Ji, J. C., Guo, S., Song, T., and Xi, F. F.: Design and analysis of a novel fall prevention device for lower limbs rehabilitation robot, J. Back Musculoskelet., 31, 169–176, https://doi.org/10.3233/bmr-169765, 2018a.
Ji, Q., Yang, L. L., Li, W., zhou, C. C., and Ye, X. S.: Real-time gait event detection in a real-world environment using a laser-ranging sensor and gyroscope fusion method, Physiol. Meas., 39 125003, https://doi.org/10.1088/1361-6579/aae7ee, 2018b.
Kotiadis, D., Hermens, H. J., and Veltink, P. H.: Inertial Gait Phase Detection for control of a drop foot stimulator Inertial sensing for gait phase detection, Med. Eng. Phys., 32, 287–297, https://doi.org/10.1016/j.medengphy.2009.10.014, 2010.
Li, C. Y., He, Y., Chen, T. C., Chen, X. A., and Tian, S. L.: Real-Time Gait Event Detection for a Lower Extremity Exoskeleton Robot by Infrared Distance Sensors, IEEE Sens. J., 21, 27116–27123, https://doi.org/10.1109/jsen.2021.3111212, 2021.
Li, J., Wang, Z. L., Qiu, S., Zhao, H. Y., Wang, Q., Plettemeier, D., Liang, B., and Shi, X.: Using Body Sensor Network to Measure the Effect of Rehabilitation Therapy on Improvement of Lower Limb Motor Function in Children With Spastic Diplegia, IEEE T. Instrum. Meas., 69, 9215–9227, https://doi.org/10.1109/tim.2020.2997545, 2020.
Li, M. T., Deng, J., Zha, F. S., Qiu, S. Y., Wang, X., and Chen, F.: Towards Online Estimation of Human Joint Muscular Torque with a Lower Limb Exoskeleton Robot, Appl. Sci.-Basel, 8, 1610, https://doi.org/10.3390/app8091610, 2018.
Lim, C. D., Wang, C. M., Cheng, C. Y., Chao, Y., Tseng, S. H., and Fu, L. C.: Sensory Cues Guided Rehabilitation Robotic Walker Realized by Depth Image-Based Gait Analysis, IEEE T. Autom. Sci. Eng., 13, 171–180, https://doi.org/10.1109/tase.2015.2494067, 2016.
Liu, T., Inoue, Y., Shibata, K., Shiojima, K., and Ieee: Three-dimensional Lower Limb Kinematic and Kinetic Analysis Based on a Wireless Sensor System, in: IEEE International Conference on Robotics and Automation (ICRA), Shanghai, China, 9–13 May 2011, IEEE, 842–847, https://doi.org/10.1109/ICRA.2011.5979856, 2011.
Matjačić, Z., Zadravec, M., and Olenšek, A.: An effective balancing response to lateral perturbations at pelvis level during slow walking requires control in all three planes of motion, J. Biomech., 60, 79–90, https://doi.org/10.1016/j.jbiomech.2017.06.020, 2017.
Piezzo, C., Leme, B., Hirokawa, M., and Suzuki, K.: Gait measurement by a mobile humanoid robot as a walking trainer, in: 2017 26th IEEE International Symposium on Robot and Human Interactive Communication (RO-MAN), Lisbon, Portugal, 28 August–1 September 2017, IEEE, 1084–1089, https://doi.org/10.1109/ROMAN.2017.8172438, 2017.
Prakash, C., Kumar, R., and Mittal, N.: Recent developments in human gait research: parameters, approaches, applications, machine learning techniques, datasets and challenges, Artif. Intell. Rev., 49, 1–40, https://doi.org/10.1007/s10462-016-9514-6, 2018.
Qian, Z. Q. and Bi, Z. M.: Recent Development of Rehabilitation Robots, Adv. Mech. Eng., 7, 11, https://doi.org/10.1155/2014/563062, 2015.
Sakdarakse, S. and Somboon, P.: Development of LIDAR Based Gait Training System with Gait Assessment, in: 2020 17th International Conference on Electrical Engineering/Electronics, Computer, Telecommunications and Information Technology (ECTI-CON), Phuket, Thailand, 24–27 June 2020, IEEE, 263–266, 2020.
Shi, D., Zhang, W. X., Ding, X. L., and Sun, L.: Parametric generation of three-dimensional gait for robot-assisted rehabilitation, Biol. Open, 9, bio047332, https://doi.org/10.1242/bio.047332, 2020.
Singh, M. S., Pondenkandath, V., Zhou, B., Lukowicz, P., and Liwicki, M.: Transforming Sensor Data to the Image Domain for Deep Learning – an Application to Footstep Detection, 2017 International Joint Conference on Neural Networks (IJCNN), Anchorage, AK, USA, 14–19 May 2017, IEEE, 2665–2672, https://doi.org/10.1109/IJCNN.2017.7966182, 2017.
Tanabe, S., Ii, T., Koyama, S., Saitoh, E., Itoh, N., Ohtsuka, K., Katoh, Y., Shimizu, A., and Tomita, Y.: Spatiotemporal treadmill gait measurements using a laser range scanner: feasibility study of the healthy young adults, Physiol. Meas., 38, N81–N92, https://doi.org/10.1088/1361-6579/aa63d1, 2017.
Vera-Rodriguez, R., Mason, J. S. D., Fierrez, J., and Ortega-Garcia, J.: Analysis of spatial domain information for footstep recognition, IET Comput. Vis., 5, 380–388, https://doi.org/10.1049/iet-cvi.2010.0189, 2011.
Wagner, J., Szymanski, M., Blazkiewicz, M., and Kaczmarczyk, K.: Methods for Spatiotemporal Analysis of Human Gait Based on Data from Depth Sensors, Sensors, 23, 1218, https://doi.org/10.3390/s23031218, 2023.
Wang, C., Kim, Y., Shin, H., and Min, S. D.: Preliminary Clinical Application of Textile Insole Sensor for Hemiparetic Gait Pattern Analysis, Sensors, 19, 3950, https://doi.org/10.3390/s19183950, 2019.
Xu, W. X., Huang, J., and Cheng, L.: A Novel Coordinated Motion Fusion-Based Walking-Aid Robot System, Sensors, 18, 2761, https://doi.org/10.3390/s18092761, 2018.
Ye, J., Wu, H. D., Wu, L. S., Long, J. J., Zhang, Y. L., Chen, G., Wang, C. B., Luo, X., Hou, Q. H., and Xu, Y.: An Adaptive Method for Gait Event Detection of Gait Rehabilitation Robots, Front. Neurorobotics, 14, 38, https://doi.org/10.3389/fnbot.2020.00038, 2020.
Yorozu, A. and Takahashi, M.: Gait Measurement for Human Behavior Estimation Against Autonomous Mobile Robot, in: 13th International Conference on Intelligent Autonomous Systems (IAS), edited by: Menegatti, E., Michael, N., Berns, K., and Yamaguchi, H., Springer, Cham, 302, 1021–1033, https://doi.org/10.1007/978-3-319-08338-4_74, 2016.
Yorozu, A. and Takahashi, M.: Estimation of body direction based on gait for service robot applications, Robot. Auton. Syst., 132, 103603, https://doi.org/10.1016/j.robot.2020.103603, 2020.
Yorozu, A., Moriguchi, T., and Takahashi, M.: Improved Leg Tracking Considering Gait Phase and Spline-Based Interpolation during Turning Motion in Walk Tests, Sensors, 15, 22451–22472, https://doi.org/10.3390/s150922451, 2015a.
Yorozu, A., Nishiguchi, S., Yamada, M., Aoyama, T., Moriguchi, T., and Takahashi, M.: Gait Measurement System for the Multi-Target Stepping Task Using a Laser Range Sensor, Sensors, 15, 11151–11168, https://doi.org/10.3390/s150511151, 2015b.
Ziegler, J., Reiter, A., Gattringer, H., and Muller, A.: Simultaneous identification of human body model parameters and gait trajectory from 3D motion capture data, Med. Eng. Phys., 84, 193–202, https://doi.org/10.1016/j.medengphy.2020.08.009, 2020.