the Creative Commons Attribution 4.0 License.
the Creative Commons Attribution 4.0 License.
 | 07 Oct 2022
Milling chatter recognition based on dynamic and wavelet packet decomposition
Miao Xie
Xinli Yu
Ze Ren
In metal milling, especially in the machining of low-stiffness workpieces, chatter is a key factor affecting many aspects such as surface quality, machining efficiency, and tool life. In order to avoid chatter, a milling chatter identification method based on dynamic wavelet packet decomposition (WPD) is proposed from the perspective of signal processing. The dynamic characteristics of the system are obtained by a hammer test. Based on the principle that the chatter frequency will reach a peak value near the natural frequency of the system, the original milling force signal is decomposed by WPD, and the sub-signals containing rich chatter information are selected for signal reconstruction. After numerical analysis and spectrum comparison, the reconstruction scheme is proved to be robust. Then, the time–frequency domain image of the reconstructed signal and the Hilbert spectrum feature are compared and analyzed to identify the chatter. Finally, the validity and reliability of the proposed method for chatter recognition are verified by experiments.
- Article
(12378 KB) - Full-text XML
- BibTeX
- EndNote


At present, scholars (Sun et al., 2022; Li et al., 2020, 2019) have done a lot of in-depth research on the milling chatter recognition. In the recognition process, the extraction of chatter features is more important regardless of which signal is chosen for milling chatter recognition (Qin et al., 2020). For the collected signal, the relevant feature values can be obtained by a time domain analysis. However, it is difficult for some messy signals to be analyzed for any useful information in the time domain space. Therefore, the conversion of time domain signals to frequency domain signals, namely Fourier transform, is proposed for chatter identification. This is done according to the principle that when chatter occurs, the chatter frequency will peak near the natural frequency of the system, and the frequency spectrum can observe the occurrence of chatter. The formula of the Fourier transform is as follows:
Because the Fourier transform is a global transform, it cannot express the local time–frequency nature of the signal, and the two groups of signals that differ greatly in the time domain have the same spectrogram. To obtain the variation in frequency with time, a short-time Fourier transform (STFT) is proposed. However, studies have shown that STFT has a disadvantage in that the time resolution and frequency resolution cannot be achieved concurrently. Therefore, a time–frequency analysis has been developed. By designing a joint function of time and frequency, the energy density or intensity of signals at different times and frequencies can be described concurrently. The time–frequency local nature is the most important feature of non-stationary signals.
In the study of time–frequency method of chatter recognition, Yao et al. (2010) proposed a two-dimensional eigenvector based on standard deviation and wavelet packet energy ratio, and Cao et al. (2013) proposed chatter characteristics based on the mean value and standard deviation of Hilbert–Huang transform. However, empirical mode decomposition (EMD) is prone to modal aliasing and thus affects the characteristics. Qin et al. (2019) proposed a semi-analytical stability prediction method for the milling process using a global interpolation scheme. Karam and Teti (2013) concluded the process of the reconstructed signal and pointed out that the signal characteristics cannot reliably achieve the online monitoring of the chip shape. Litak et al. (2013) pointed out the generation of high-frequency resonance through analyzing the wavelet power spectrum based on the milling force when the depth of cut was gradually changed in the process of Inconel milling. Karam and Teti (2013) used the wavelet decomposition signal for feature extraction and pattern recognition. The experimental results show that the data feature a vector analyzed by the wavelet packet change which can improve the accuracy of the neural decision system to identify the chip shape. Wavelet decomposition has strong robustness, but the determination of the wavelet basis function lacks theoretical guidance. Niu et al. (2020) aim to propose a unified method to study the surface generation mechanism and to predict the machining quality for variable pitch tools considering runout. Xia et al. (2021a) present an intelligent fault diagnosis framework for machinery based on digital-twin-assisted (DT) and deep transfer learning. Fang et al. (2011) pointed out that the cutting force increases with tool wear based on the influence of different tool radii on cutting force and vibration in the high-speed milling of Inconel and pointed out the superiority of wavelet change in analyzing the cutting vibration in a wide range of frequency bands. Liu et al. (2021) applied fast kurtosis and frequency band power to analyze the force signal of the milling process to detect milling chatter. Experiments show that the force signal has good sensitivity to chatter. Qin et al. (2022) proposed a method for monitoring flutter in robotic drilling based on the centralized velocity synchronous linear chirplet transformation. Niu et al. (2021) proposed an efficient numerical algorithm to accurately compute the dynamic responses. Based on the proposed dynamic model and numerical algorithm, the stability limits and surface location error (SLE) are finally obtained and experimentally validated on two thin-walled plates using two variable pitch tools. Xia et al. (2021b) proposed an improved stacked gated recurrent unit recurrent neural network (GRU-RNN) prediction scheme. Ren et al. (2014) proposed a chatter identification method based on wavelet packet change and kernel principal component analysis, which can achieve high accuracy by measuring the milling force to detect normal milling and chatter milling. At present, the force signal is recognized as the best signal for chatter, but the force sensor is relatively expensive and requires a higher installation location.
Modern signal processing methods are increasingly being used for chatter recognition. Rafal et al. (2015) used the methods of recursive drawing and the Hilbert–Huang transform to analyze force data, pointing out the importance of feature selection in chatter recognition. Qian et al. (2015) used energy as a feature for chatter recognition. However, the energy characteristics are more sensitive, not only because the chatter cause the energy change but also because the system dynamic characteristics cause the energy change. Huang et al. (2013) analyzed force signals with different cutting speeds during the milling of titanium alloys using the following three methods: time domain, fast Fourier transform (FFT), and wavelet transform. The frequency domain method indicates the cutting speed during chatter, and the wavelet analysis indicates that the detail factor d2 can be used to identify the cutting state. Lin and Wang (2011) used the relationship between the extreme value and signal singularities of wavelet transform modes to obtain the wear of cutting tools by observing the information of the location of singularities, proving the effectiveness of wavelet transform in detecting tool wear.
Zhang et al. (2022) propose a supervised contrastive learning-based domain adaptation network (SCLDAN) for a cross-domain fault diagnosis of the rolling bearing.
Jemielniak et al. (2011) used wavelet transform for acoustic and force signals to achieve a tool cutting state recognition. It can be seen that the wavelet packet method has been widely used for chattering recognition, but there is no unified measure of how the signal after wavelet packet decomposition should be selected.
This paper proposes a scheme to identify milling chatter by combining dynamic characteristics and wavelet packet decomposition (WPD). In the field of machining, the effective identification of chatter can improve the precision of precision work and the service life of the tool and spindle system and then seek a combination of identification and suppression to achieve the standard of chatter-free machining. In terms of chatter detection, the scheme model proposed in this paper is simple, easy to operate, and has strong robustness. However, there are also some challenges in this research, such as the time cost of modal testing is increased, and the technicians are required to have certain expertise in the field.
The dynamic characteristics of the machine tool spindle system directly affect the machining performance, but there is no relevant literature to establish the relationship between dynamic characteristics and chatter recognition. Therefore, a new chatter recognition method is pointed out in which the sub-signals containing chatter information are extracted for signal recombination after the signal is decomposed and the dynamic characteristics are obtained, and the correctness of the method is verified by experiments.
Wavelet transform has two variables, namely scale a (scale) and translation τ (translation). The scale a controls the expansion and contraction of the wavelet function, and the translation τ controls the translation of the wavelet function. The scale corresponds to frequency (inversely proportional), and the translation τ corresponds to time.
Assuming that φ(x) and ψ(x) are scale functions and wavelet functions, respectively, the two scale equations are as follows:
In the above formula, the parameter t belongs to R, k belongs to Z, and h0k and h1k are the filter coefficients. We define the recursive function as follows:
From the above formula, a set of functions with a certain relationship can be defined. The set includes the scale function w0(t)=φ(x) and the wavelet mother function w1(t)=ψ(x). Therefore, a wavelet packet can be determined from this set. Extracting an orthonormal basis that can form L2(R) from the wavelet packet is called a wavelet packet basis of L2(R).
The experimental equipment is a four-axis TH6560 machining center, and experiments are carried out under the conditions of dry milling and up-cut milling. The workpiece material is made of aluminum alloy 6061, which has excellent processing performance and weldability and is widely used in the aviation industry. Its size is 150 × 150 × 100 mm, and the main alloying elements and composition contents and mechanical properties are shown in Table 1. The processing parameters are as follows: (a) the radial depth of the cut is 0.1 mm, the axial depth of the cut is 3.0 mm, rotational speed is 500 rpm (revolutions per minute), and the feed rate is 200 mm min−1, and (b) the radial depth of the cut is 1.2 mm, and the axial depth of the cut is 0.2 mm, where the rotational speed is 400 rpm, and the feed rate is 700 mm min−1. The processing experimental platform is shown in Fig. 1.
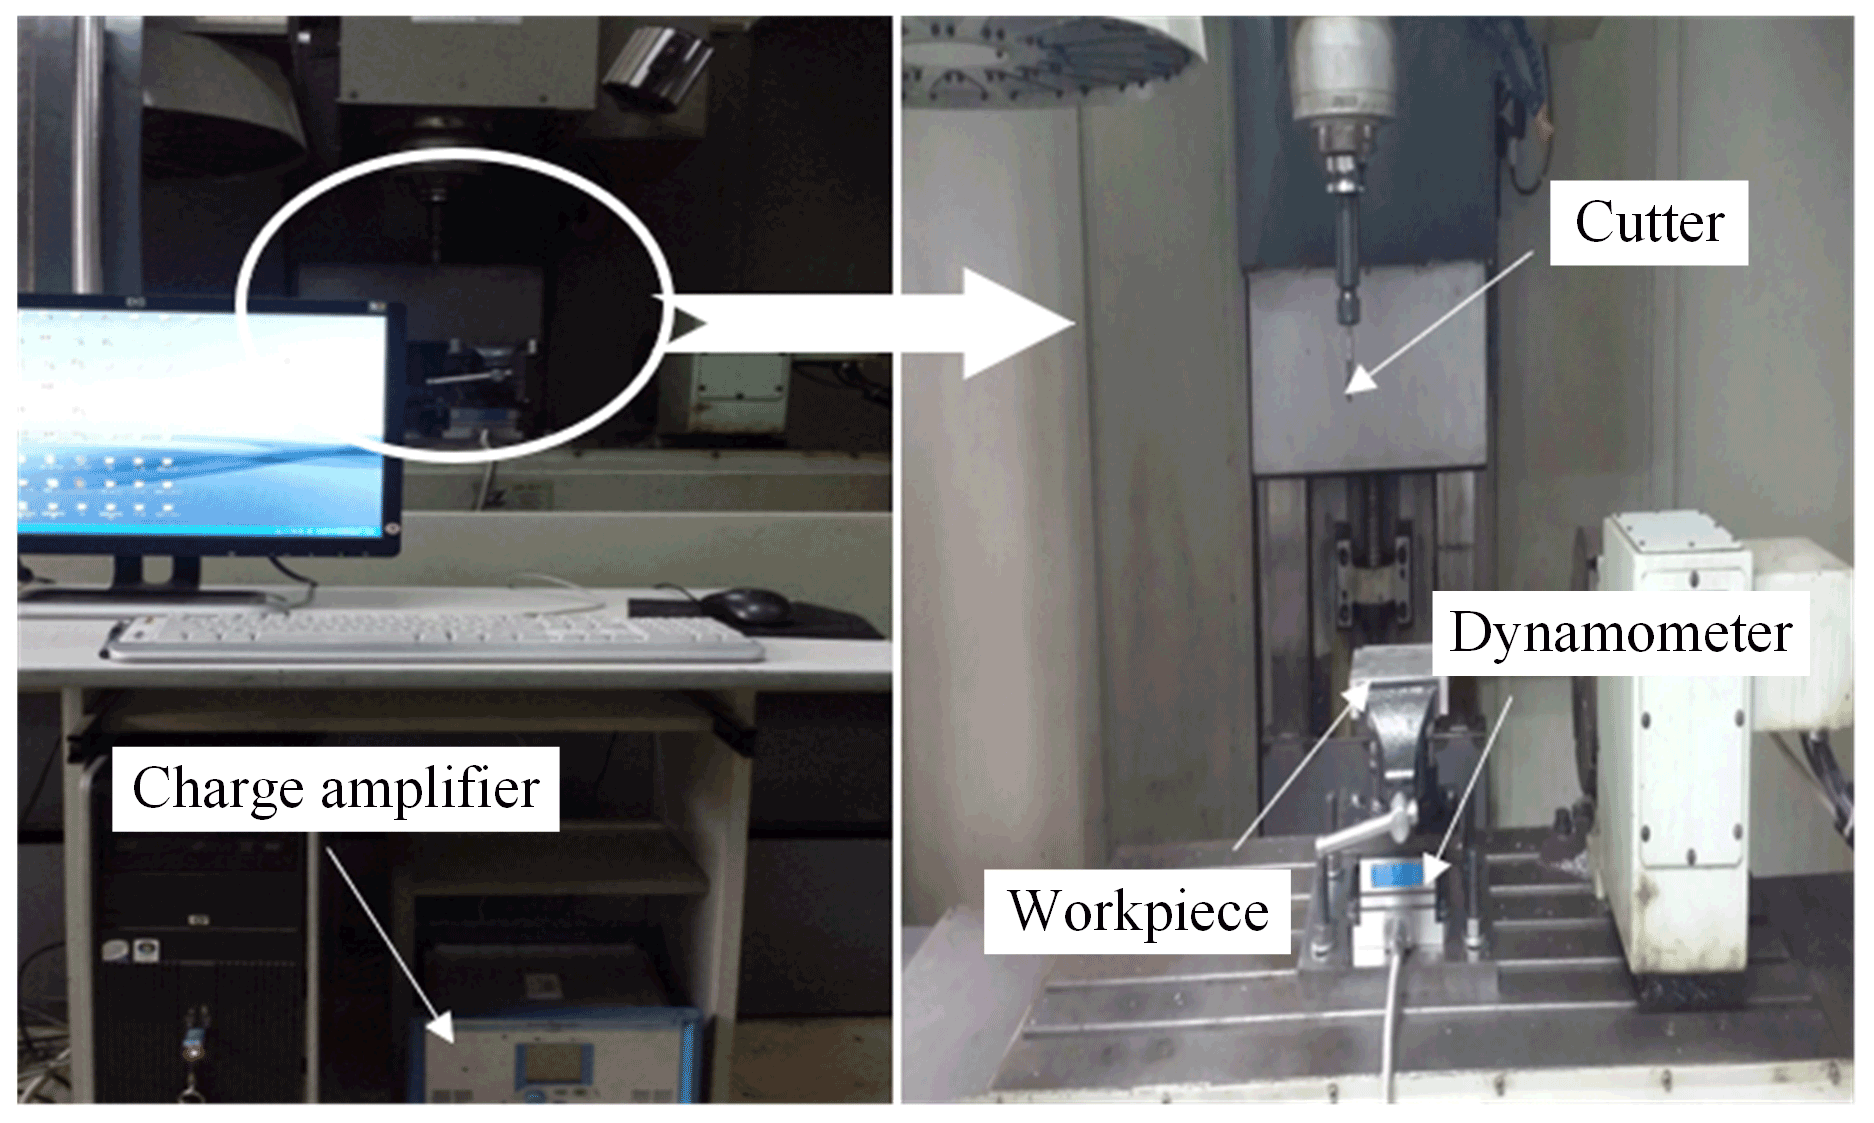
Table 1Main alloying elements and composition content of aluminum alloy 6061.

According to the strength and hardness characteristics of aluminum alloy, a carbide ball end milling cutter is selected; its diameter is D=10 mm, the cutter length is 154.7 mm, the number of teeth is N=4, and the helix angle is 30∘.
The measurement of the cutting force signal through the force measuring Kistler 9257B means that the force in the x, y, and z directions can be measured. The key to choosing the sampling frequency is to estimate the highest frequency of the signal. In order to obtain the cutting force in the frequency range of 0–3500 Hz, according to the Nyquist sampling theorem, the sampled signal will not be aliased, and the frequency of the sampling point is set to fs = 7000 Hz.
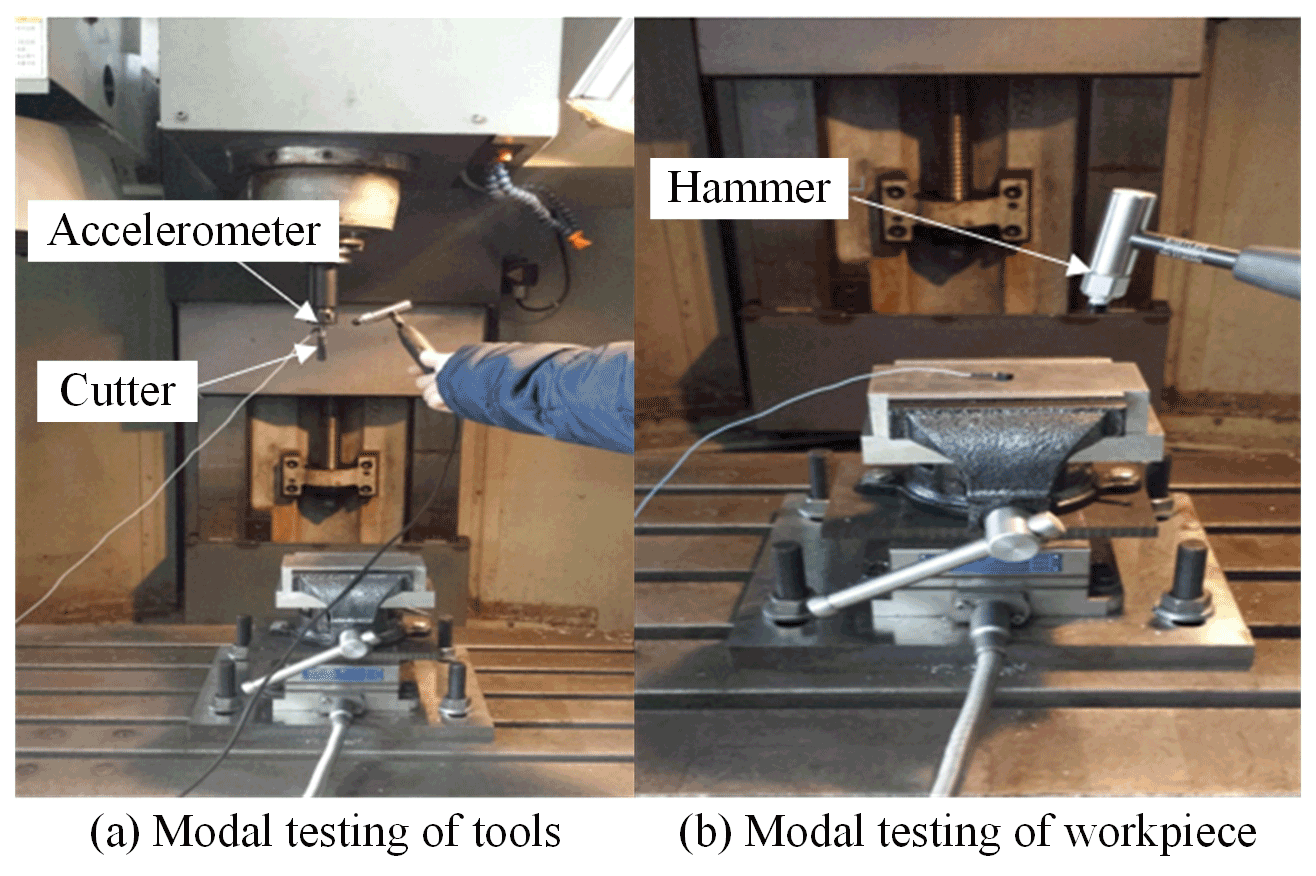
The hammering experiment of the tool and workpiece is shown in Fig. 2. First, we fix the acceleration sensor on the milling cutter of the machine tool spindle, try to place the sticking position as close to the tool tip as possible so that the acceleration sensor is within the effective signal sensing range, and, at the same time, use the force hammer to excite the tool at the corresponding position. The acceleration sensor is pasted on the workpiece to be processed, and the workpiece to be processed is stimulated by a force hammer. The measured signal is transmitted to the data collector through the acceleration sensor, and then the transfer function of the system is calculated and analyzed by professional software.
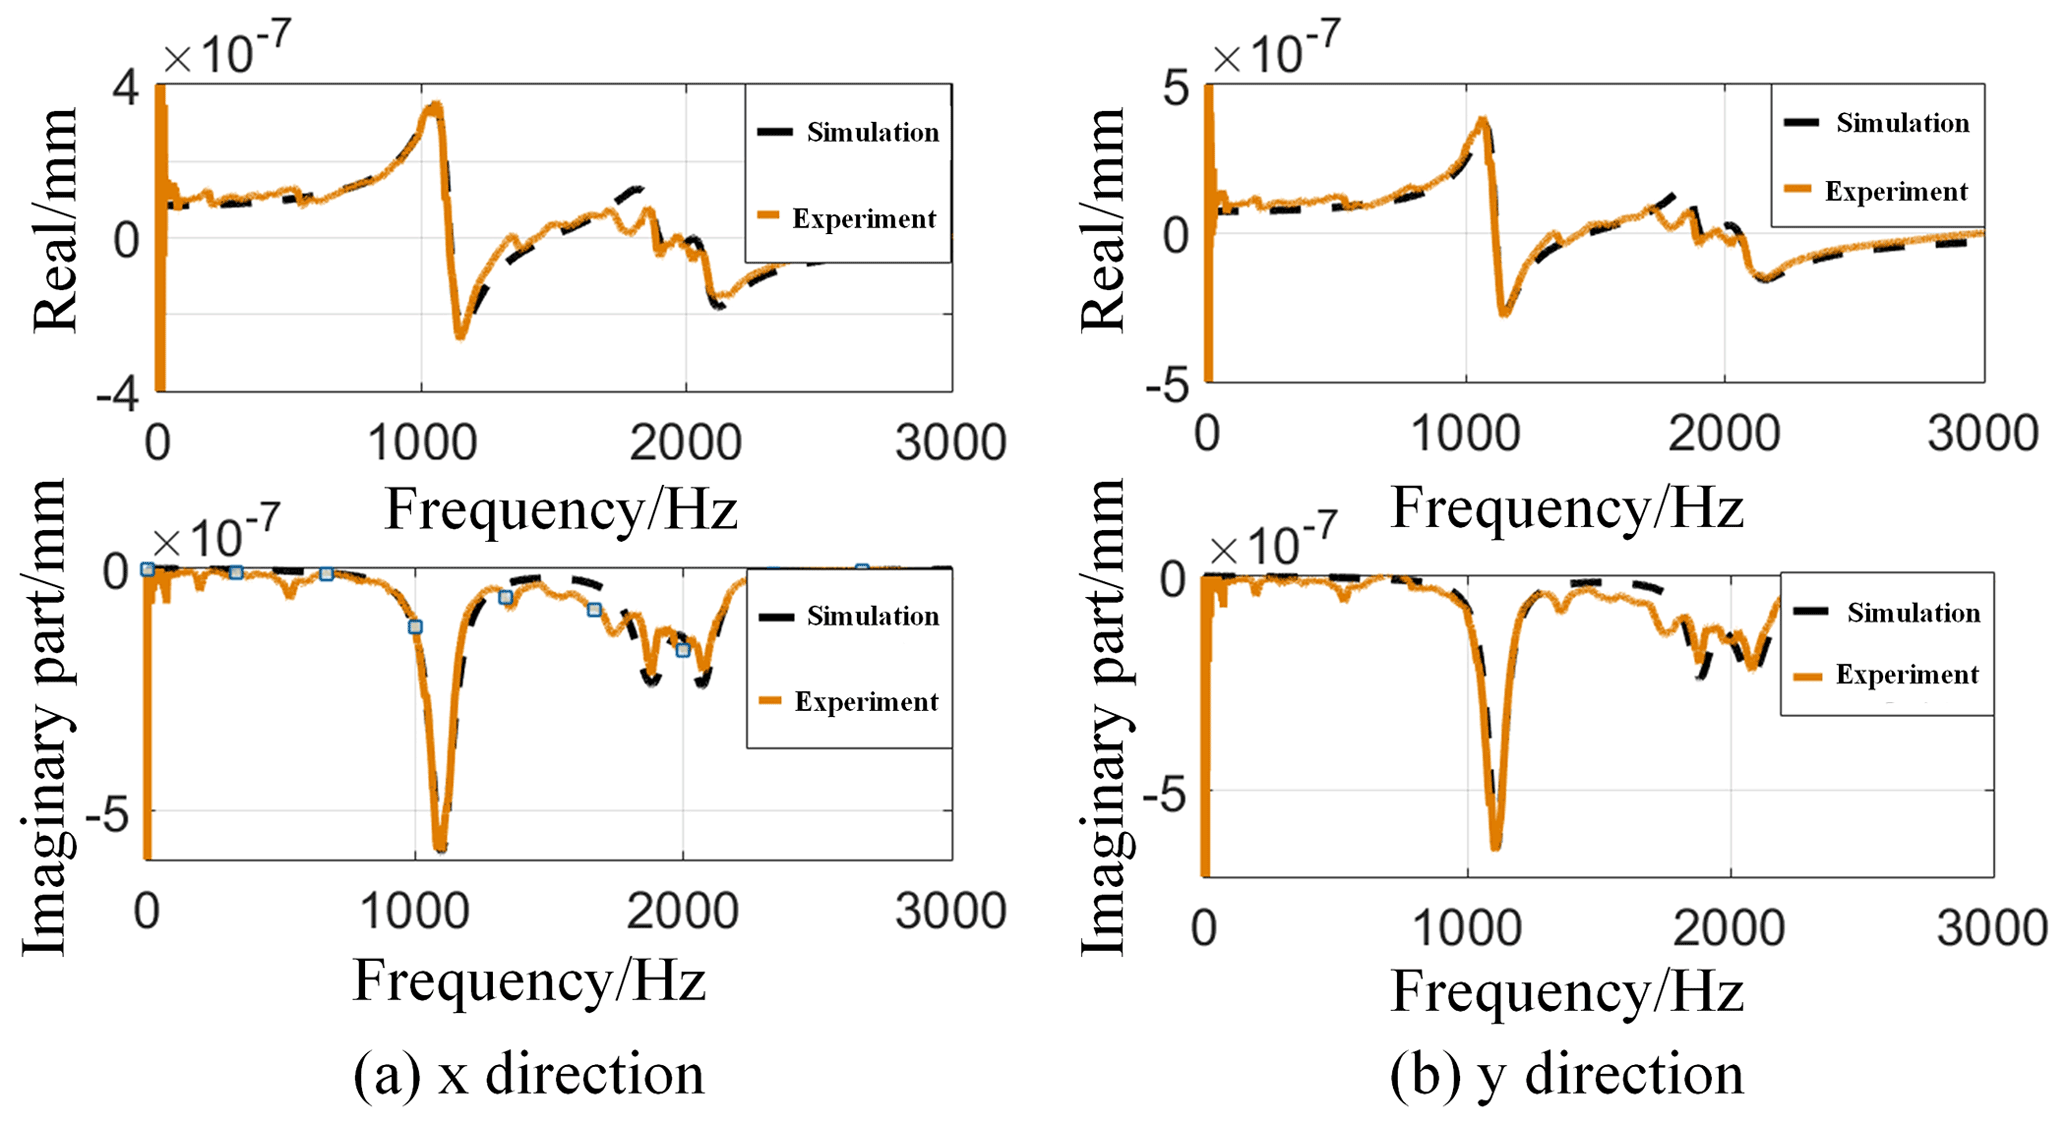
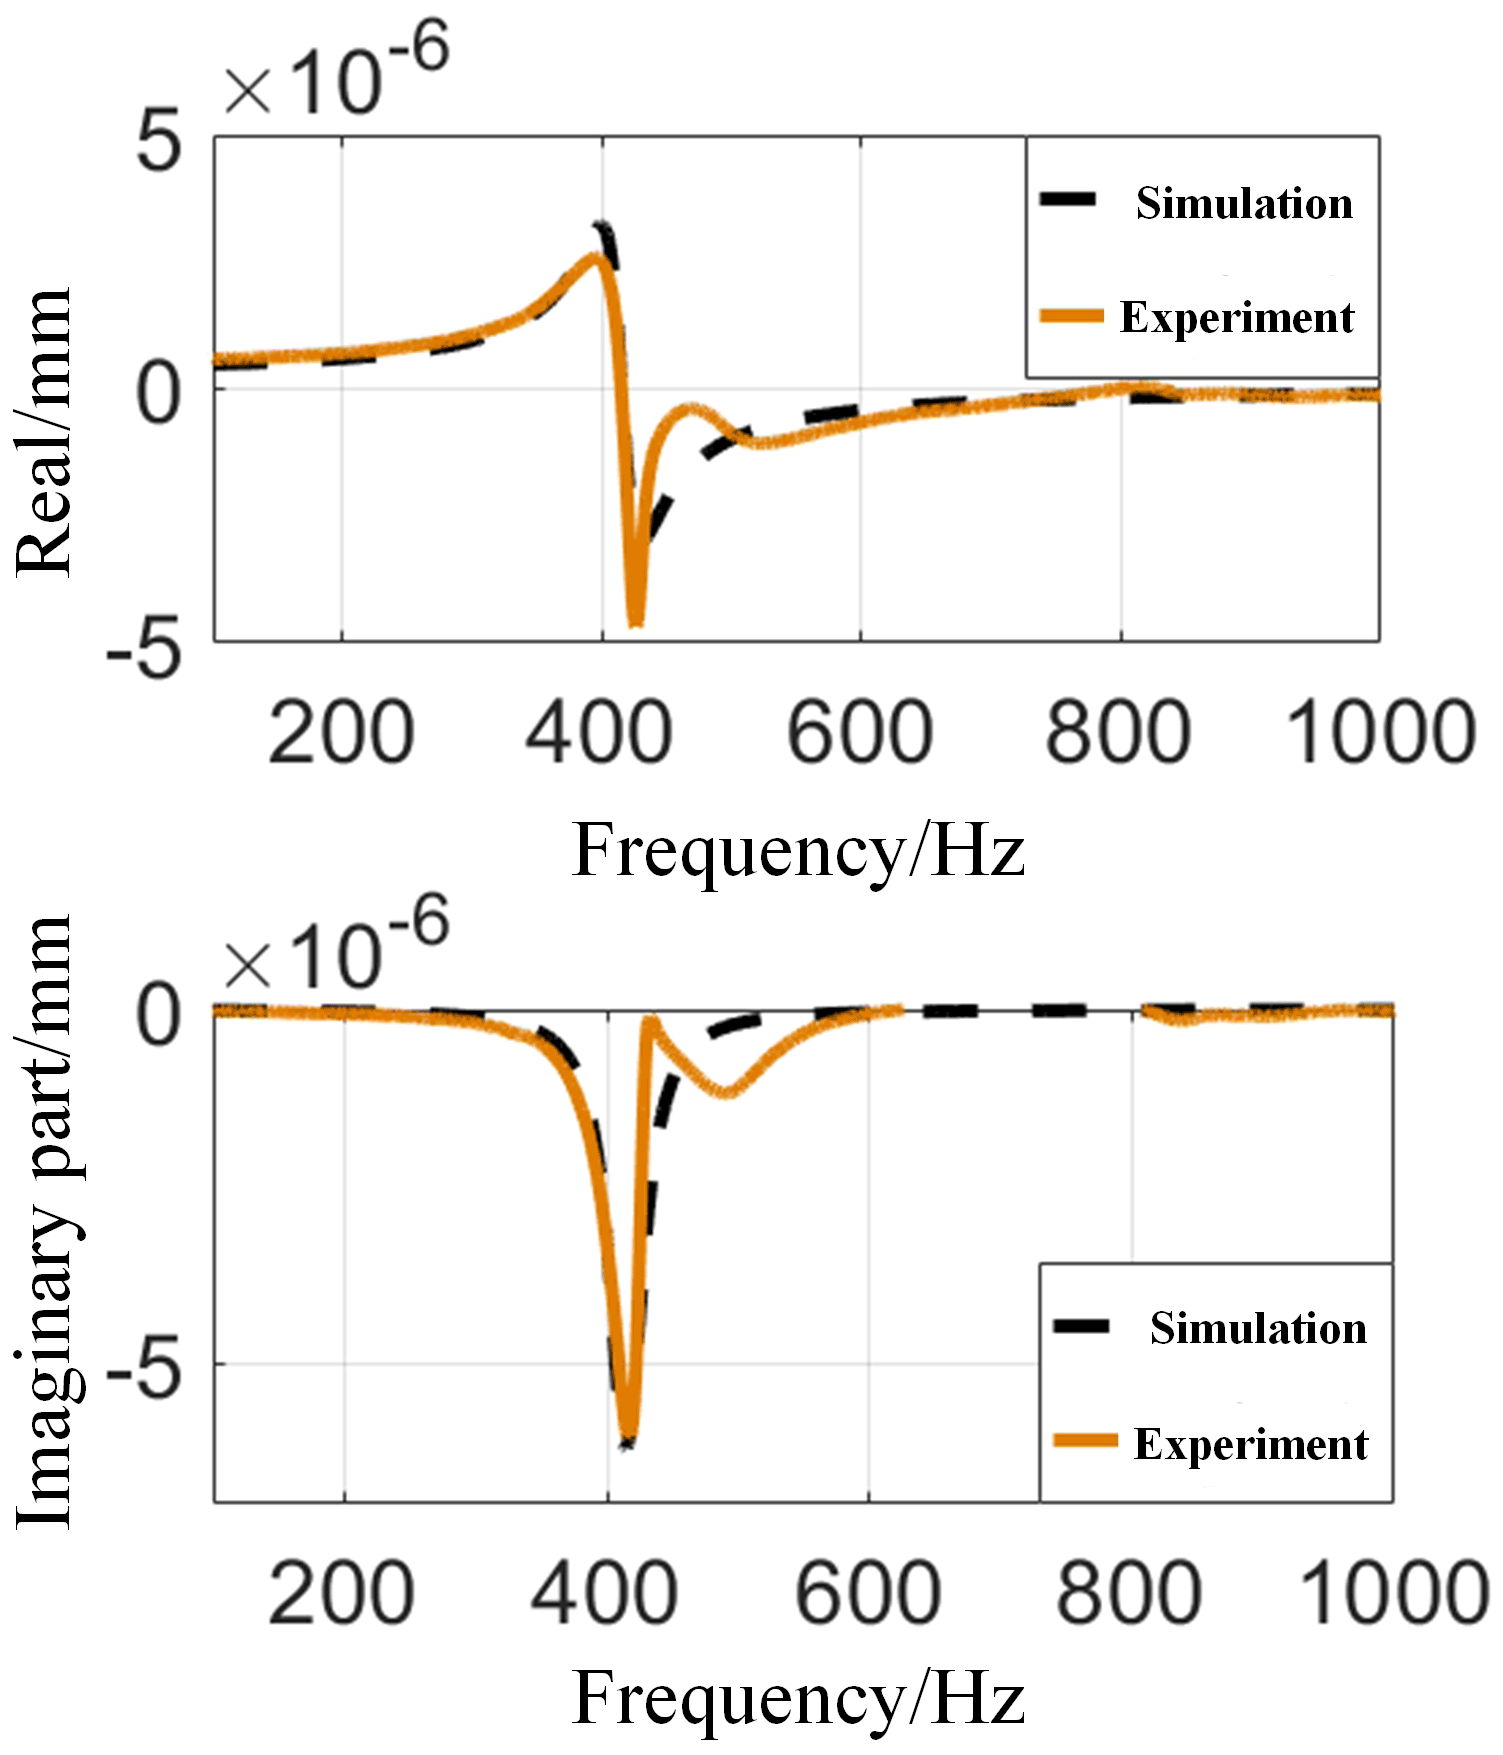
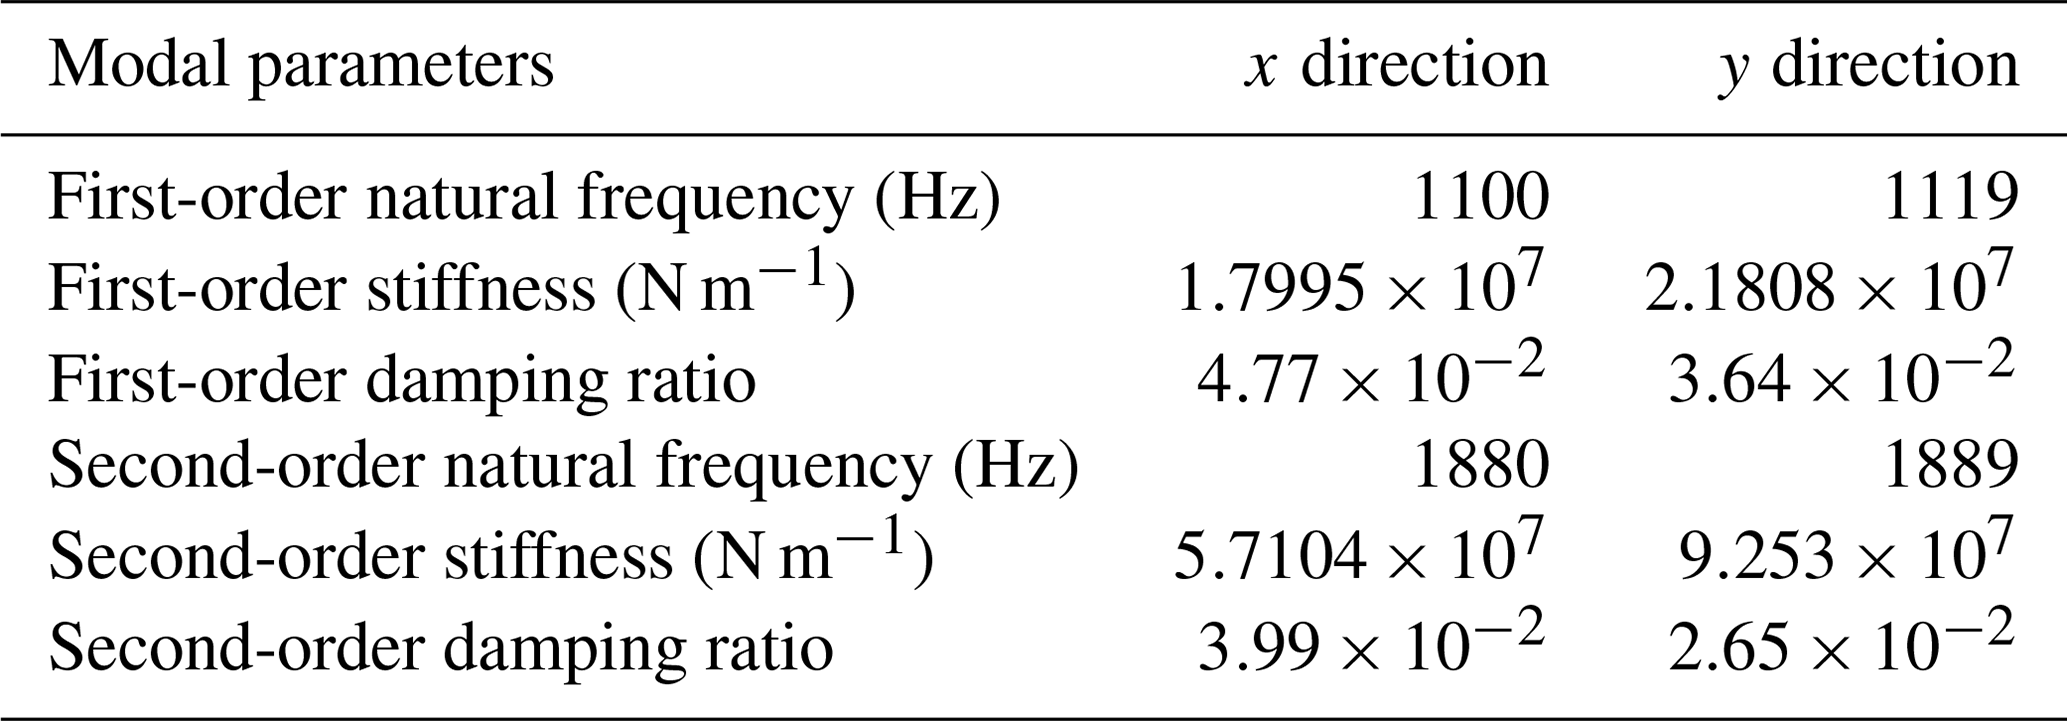
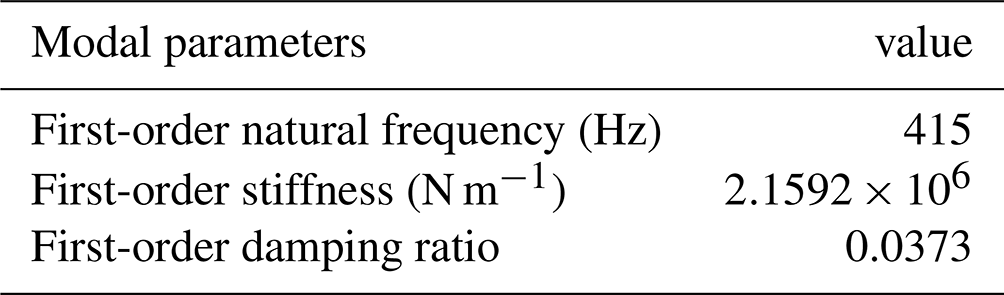
The modal experiment is carried out on the tool, and the frequency response functions of the tool in the x direction and y direction are obtained, as shown in Fig. 3, and the modal parameters corresponding to the x and y directions of the tool are shown in Table 2. The frequency response function of the workpiece is shown in Fig. 4, and the modal parameters are shown in Table 3.
According to the basic information of the tool and the workpiece obtained by the modal experiment, the relative transfer function of the tool and the workpiece can be obtained. The amplitude–frequency characteristics of the tool transfer function, the workpiece transfer function, and the relative transfer function of the tool and the workpiece are shown in Fig. 5.
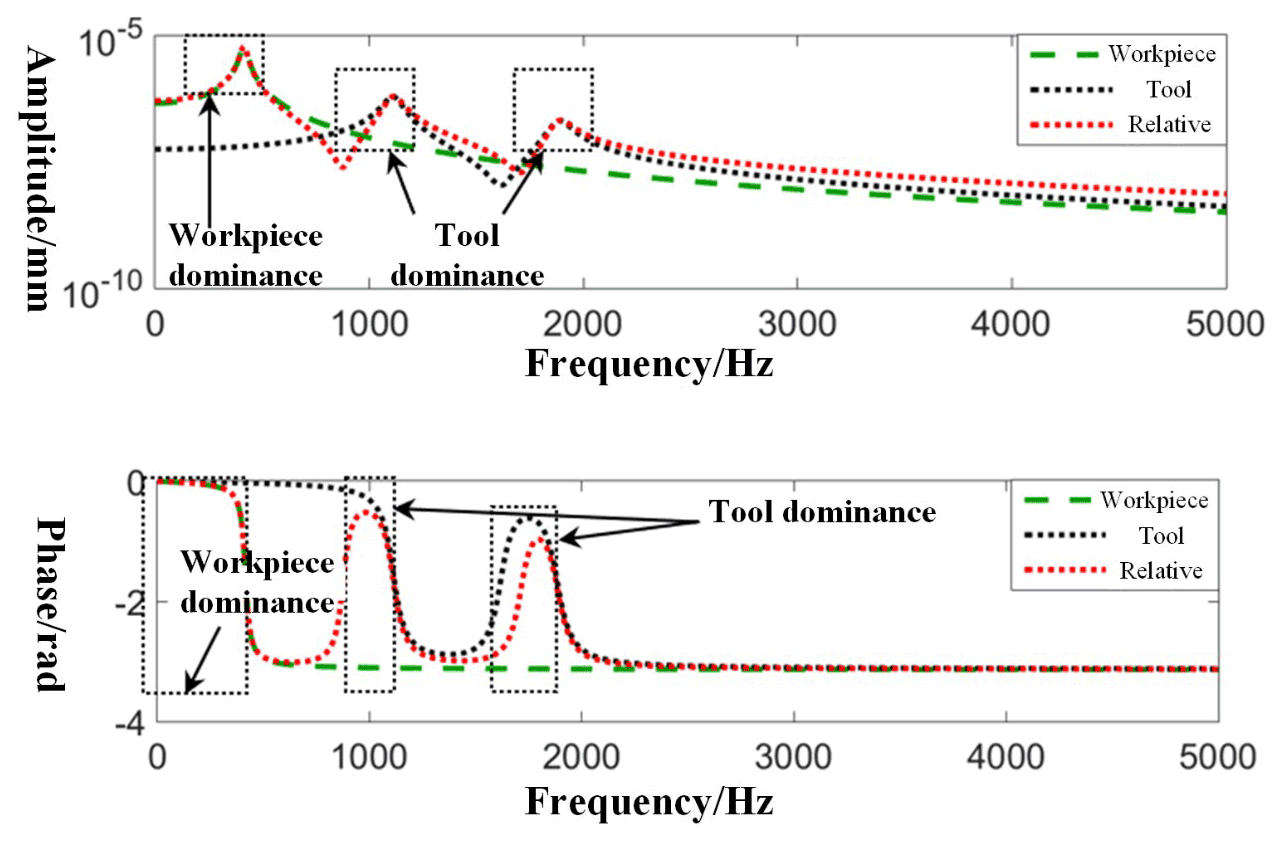
According to Zhu and Liu (2020), it can be seen that the mode of the workpiece is dominant when the frequency is low, while the mode of the tool is dominant only when the frequency is high. When the chatter stability is simulated and analyzed, the tool–workpiece relative transfer function will be used as an initial condition. It can be seen that the natural frequencies of the machine tool system are 415, 1110, and 1880 Hz.
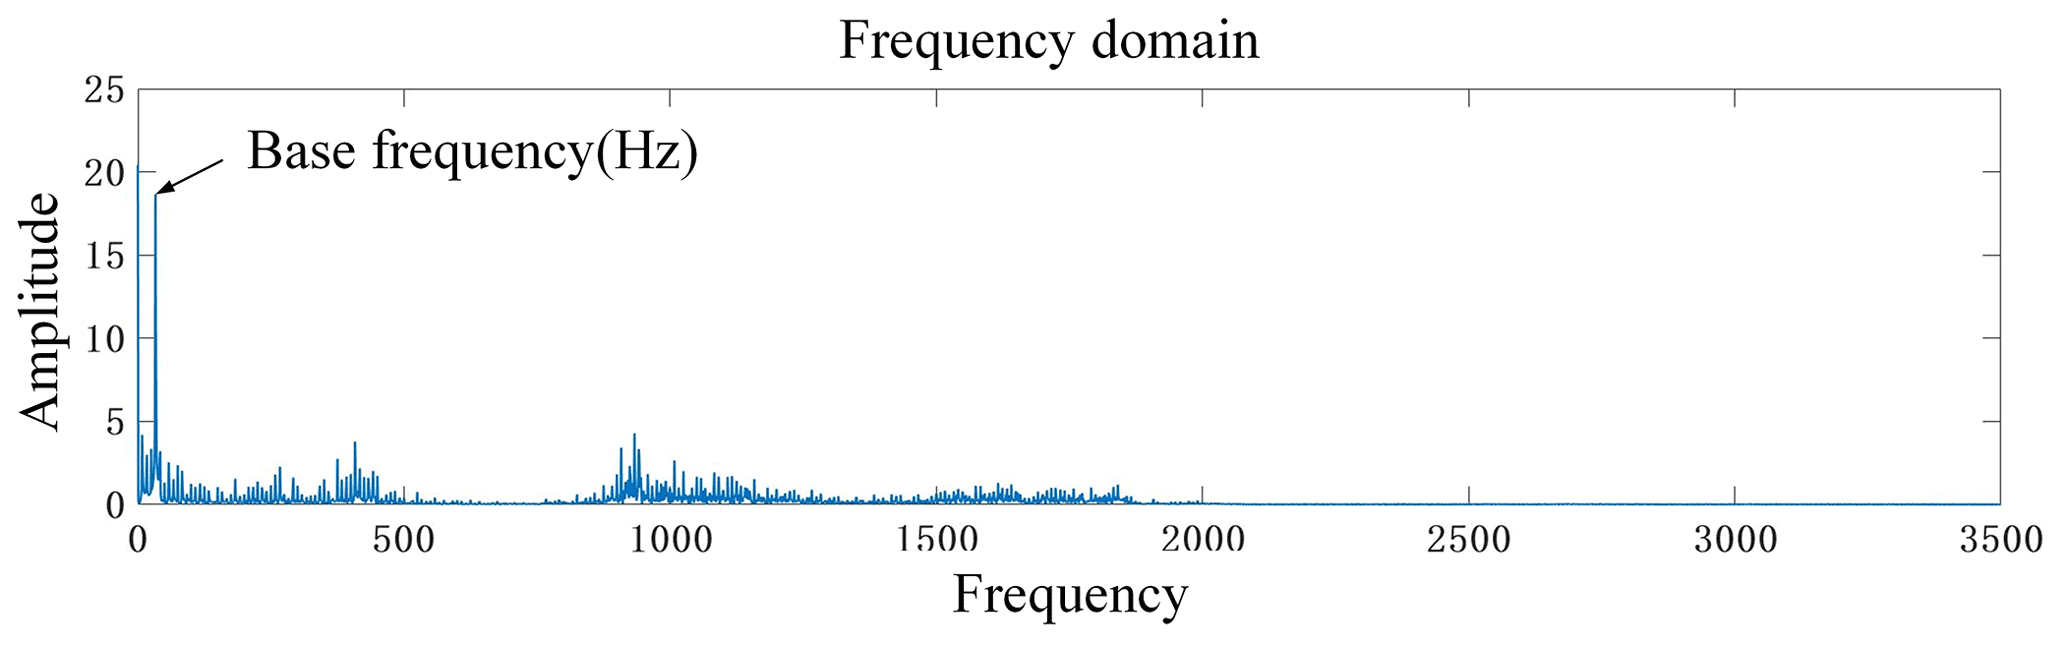
Usually, the frequency amplitude of the discrete periodic signal appears at the cutting frequency of the cutter teeth and resonance of the frequency, but when there is self-excited chatter, the frequency amplitude will appear near the natural frequency of the tool or the multiplier of the tooth pass.
The machine main frequency (SF) is as follows:
The tool tooth pass frequency of the machine (TPF) is as follows:
Among them, z represents the number of channels collected (the cutting forces in three directions of x, y, and z are collected; z=3).
It can be seen from Fig. 6 that the forced vibration occurs because the cutting frequency of the milling force reaches the excitation frequency of the machine tool, but the amplitudes of other frequencies are all smaller than the cutting frequency of the tooth, indicating that there is no chattering during milling under this parameter.
5.1 Wavelet packet decomposition and signal reconstruction
The demy wavelet basis function is used to denoise the milling force signal, the number of decomposition layers is three, and the sampling frequency is 7000 Hz. Figure 7 shows the process of wavelet decomposition of the signal. After the original signal is decomposed by the wavelet packet, frequency bands such as a4, a5, a6, a7, d4, d5, d6, and d7 are formed.

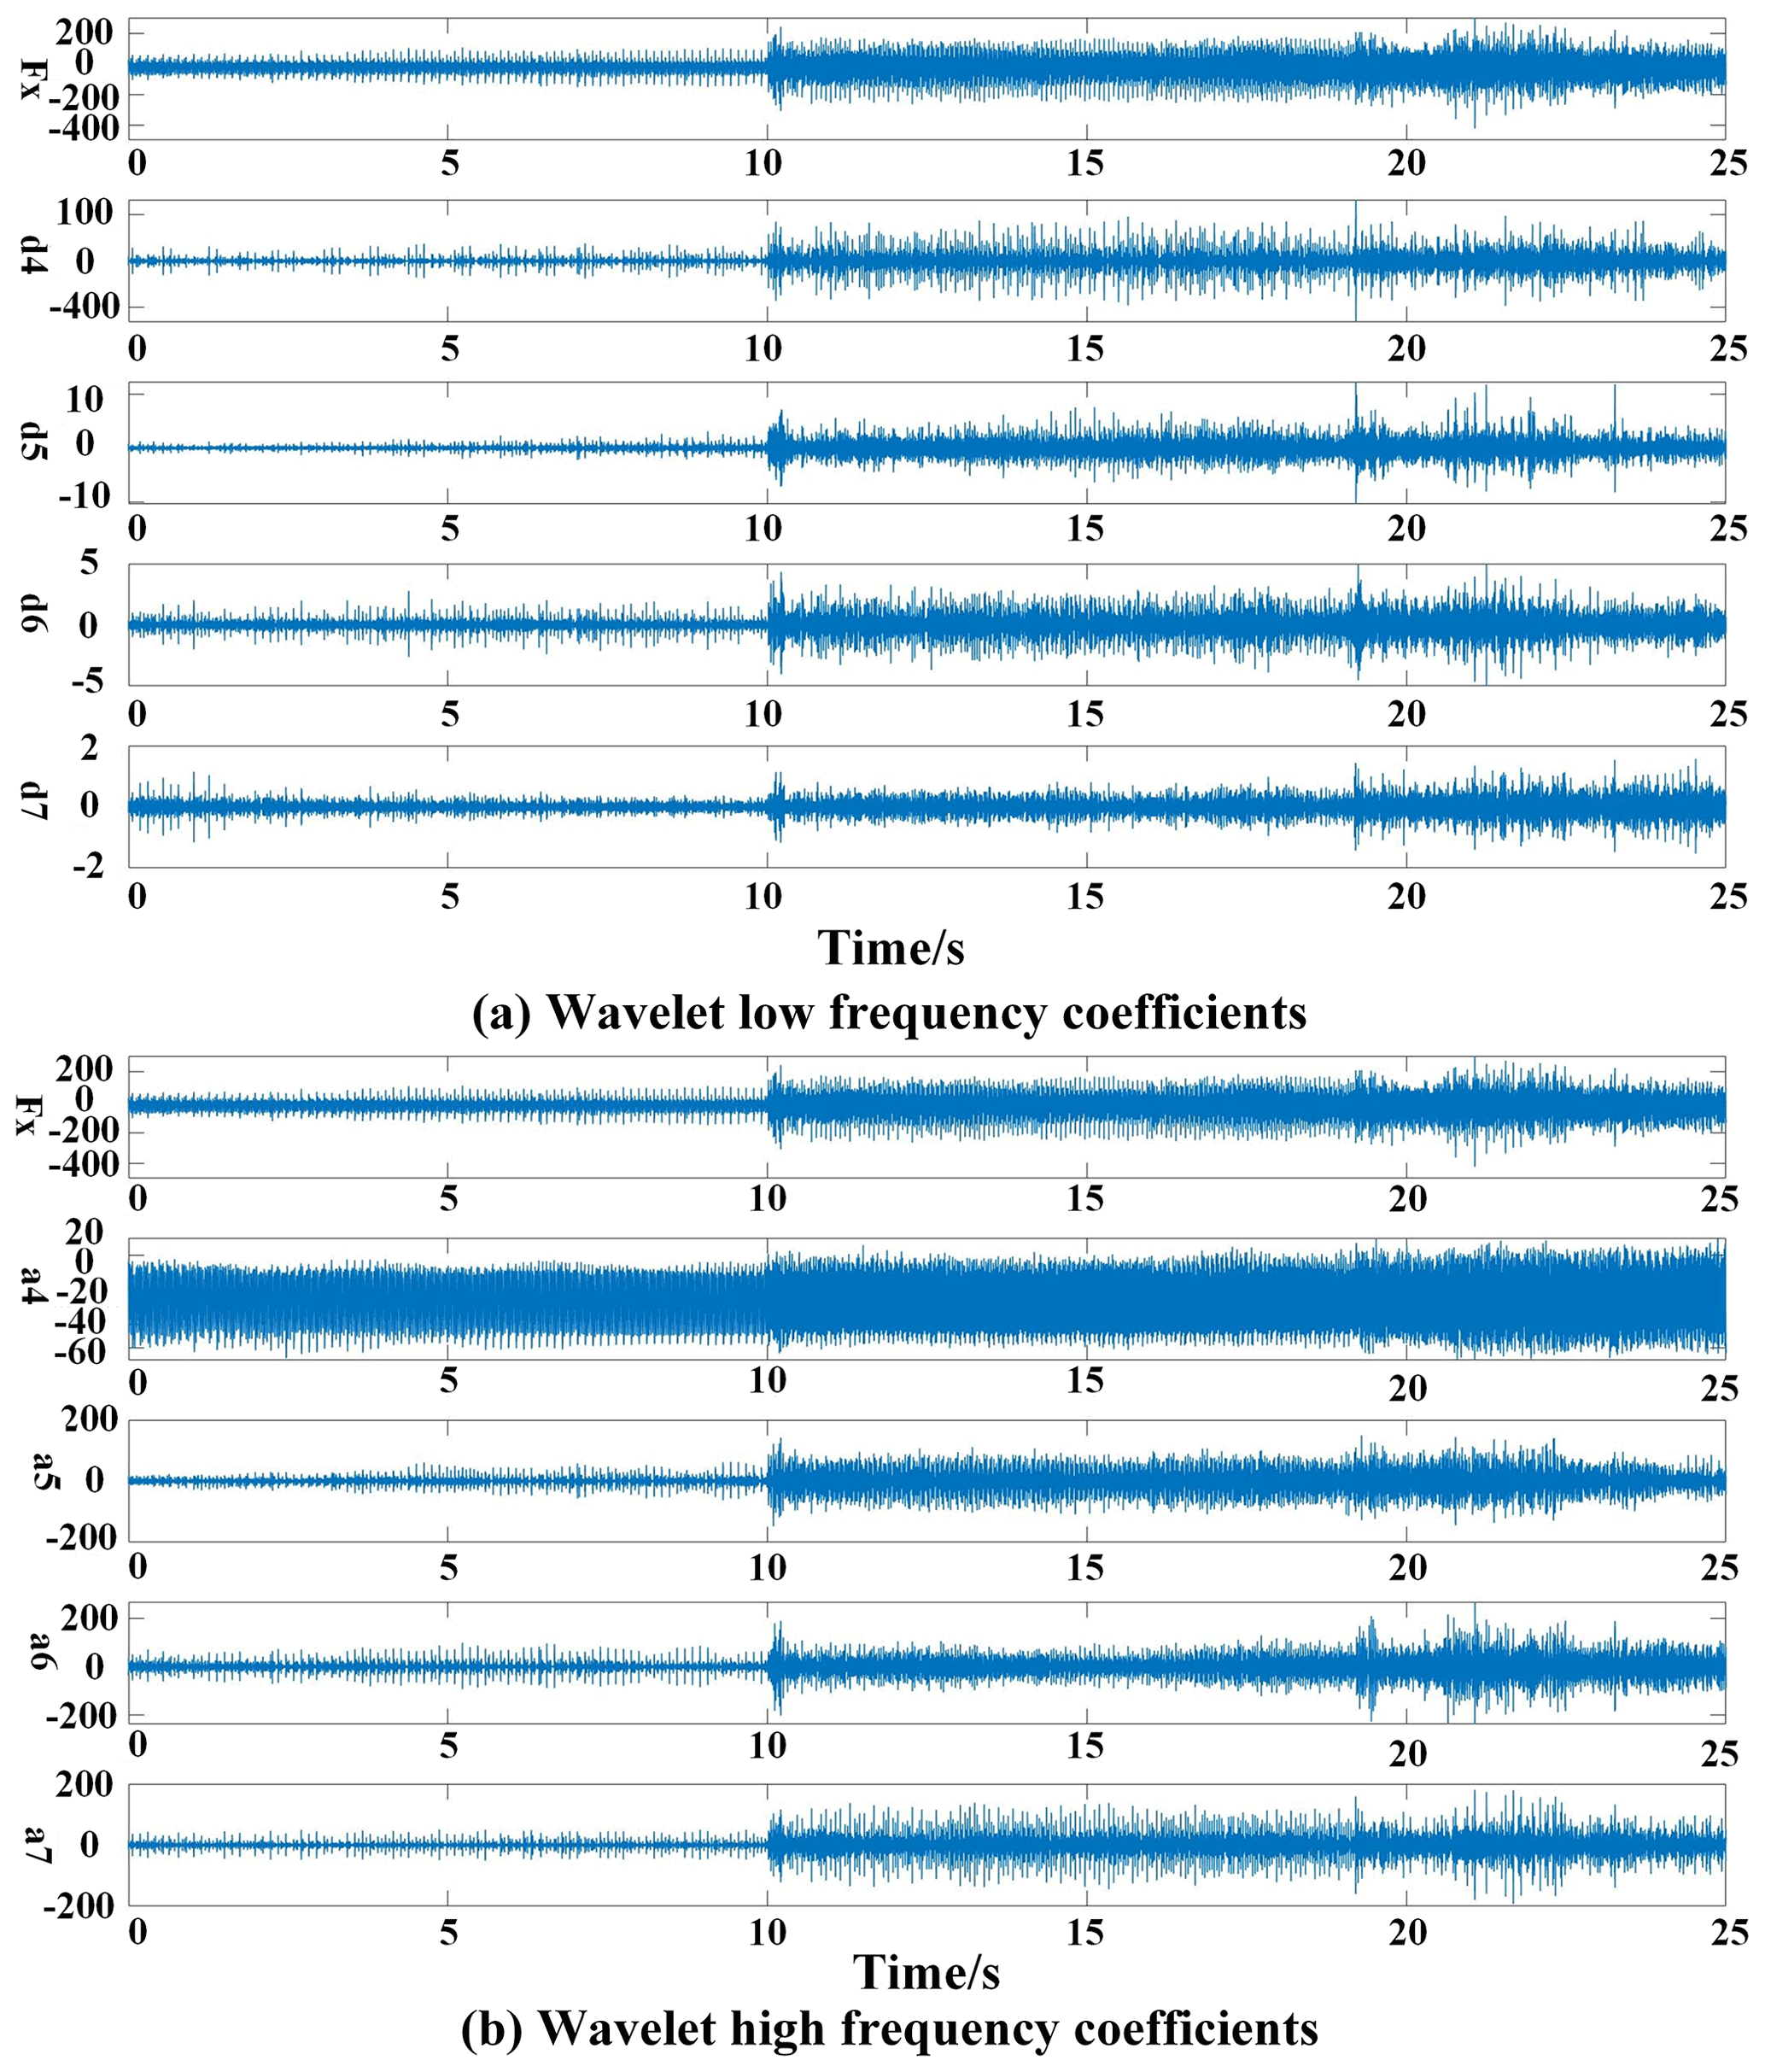
Figure 8 shows the high-frequency coefficients and low-frequency coefficients in the wavelet decomposition process, and the low-frequency coefficients are shown in Fig. 8a, and the high-frequency coefficients are shown in Fig. 8b.
It can be seen from the figure that the original signal Fx is composed of low-frequency coefficients and high-frequency coefficients, and the low-frequency coefficients reflect its real signal. a4–a7 are low-frequency coefficients in the frequency band (0–1750 Hz), and d4–d7 are high-frequency coefficients in the frequency band (1750–3500 Hz).
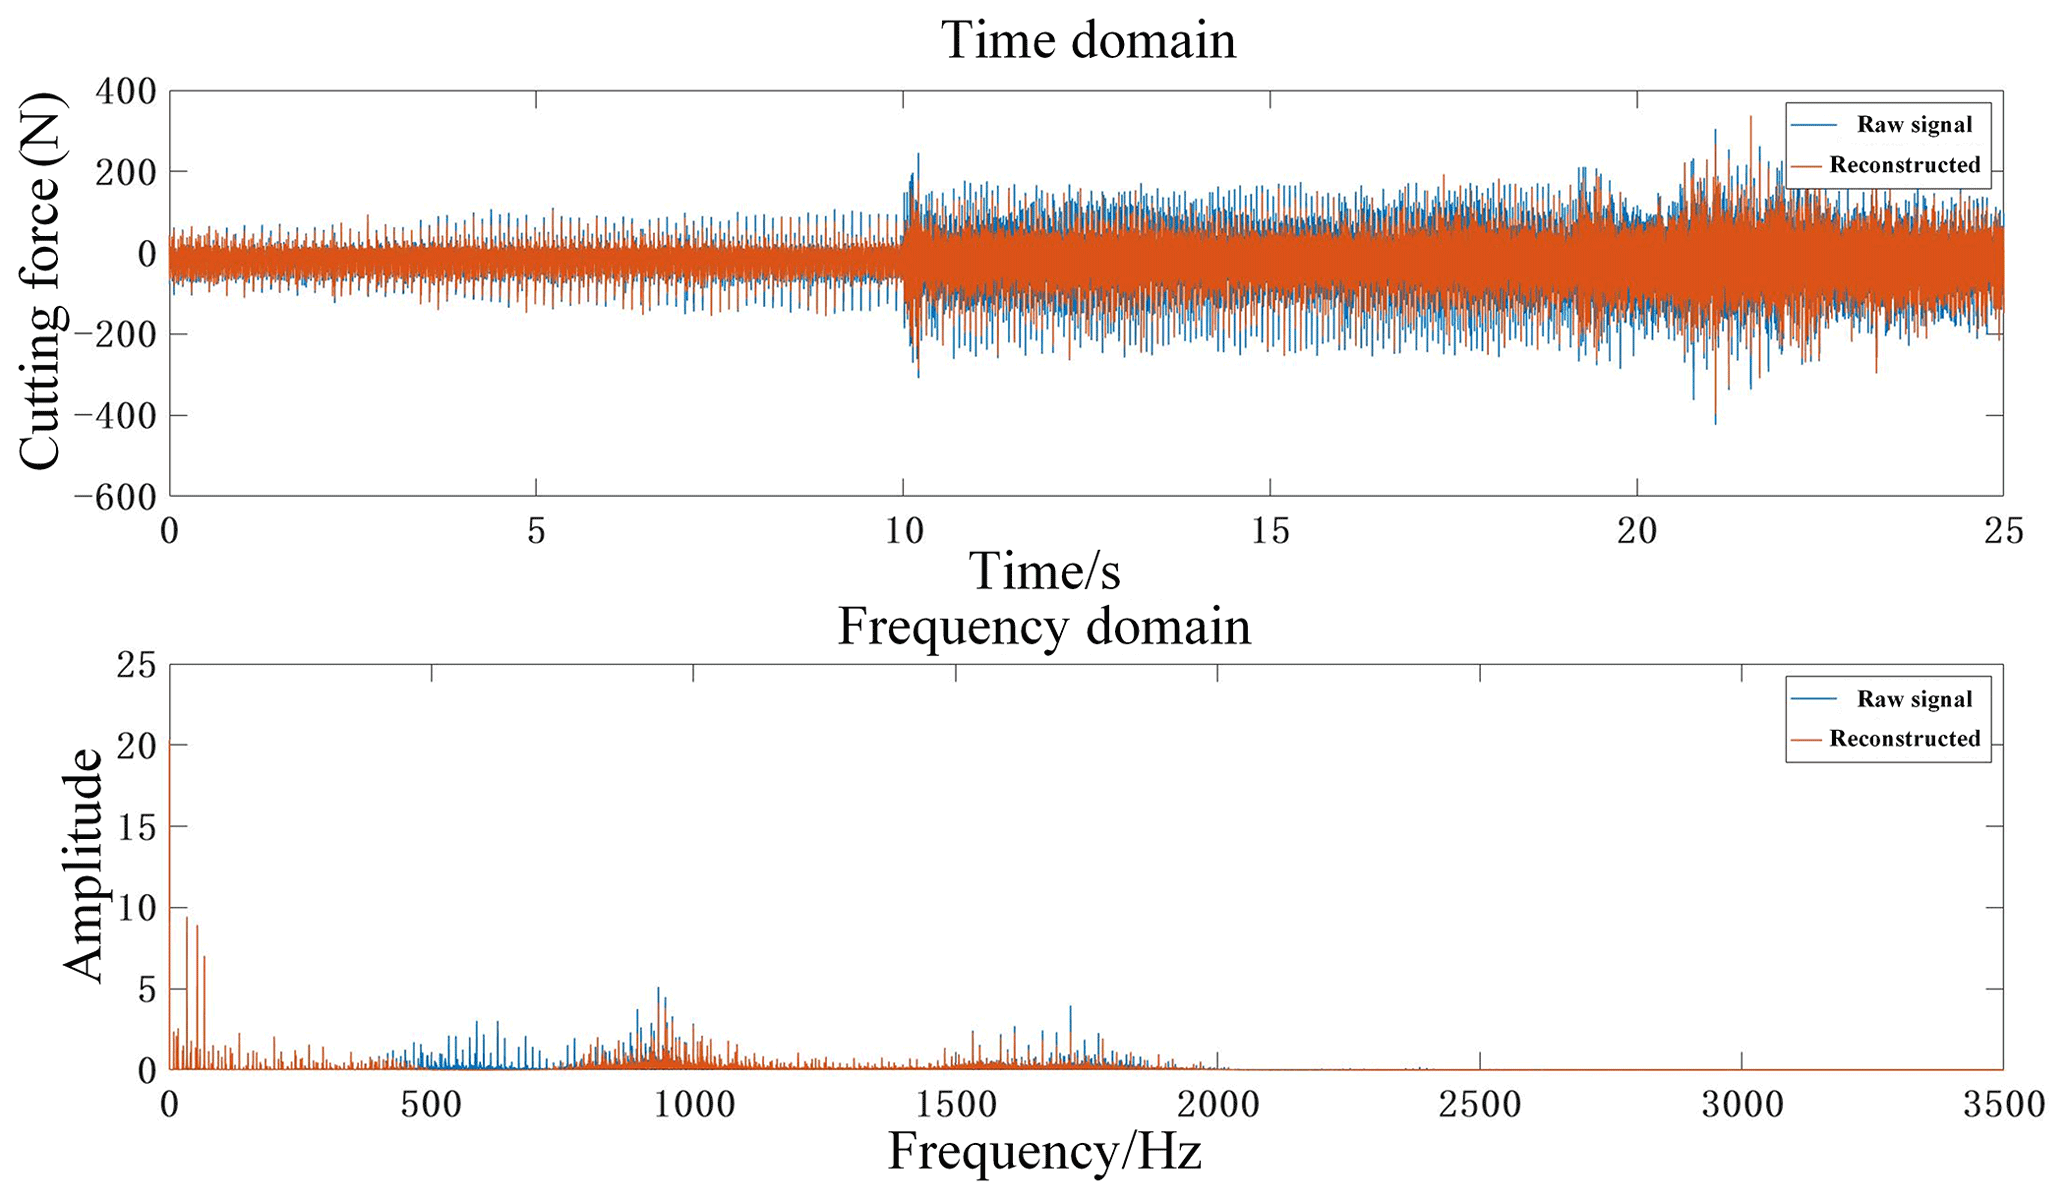
According to the principle that the chatter frequency will peak near the natural frequency of the machine tool system, the signal reconstruction of the third-layer wavelet packet node is carried out. According to the principle that the frequency range contains the natural frequency of the system, the third-layer wavelet packet node is selected. To sum up, we select a4 (0–437.5 Hz) and a6 (875–1312.5 Hz) in the low-frequency part and d4 (1750–2187.5 Hz) in the high-frequency part for signal reconstruction. We then perform a time domain and frequency domain comparative analysis of the original signal and the reconstructed signal, as shown in Fig. 9.
As can be seen from Fig. 9, signal reconstruction using wavelet packet decomposition can not only extract rich chatter information but also achieve noise reduction in the original signal. In order to further verify the accuracy of the reconstruction scheme, the numerical features of the original signal and the reconstructed signal are analyzed here, as shown in Table 4.
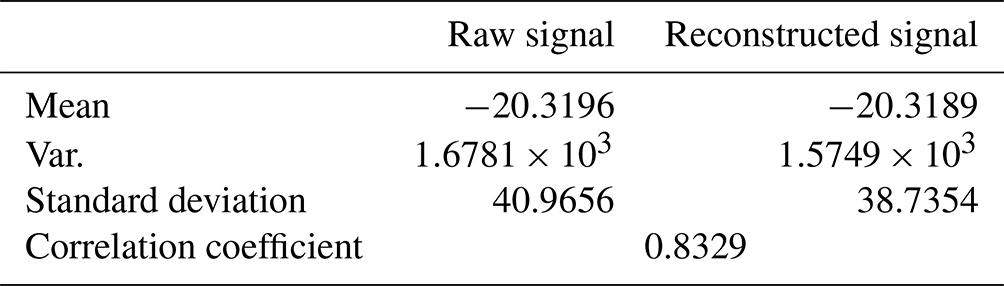
Combining Table 4 and Fig. 9, it can be seen that the reconstruction scheme is effective, a large amount of information related to the raw signal is retained in the reconstructed signal, and the correlation coefficient reflects that the correlation degree of the two sets of signals is strongly correlated. Therefore, this scheme can be used to extract sub-signals rich in chatter information.
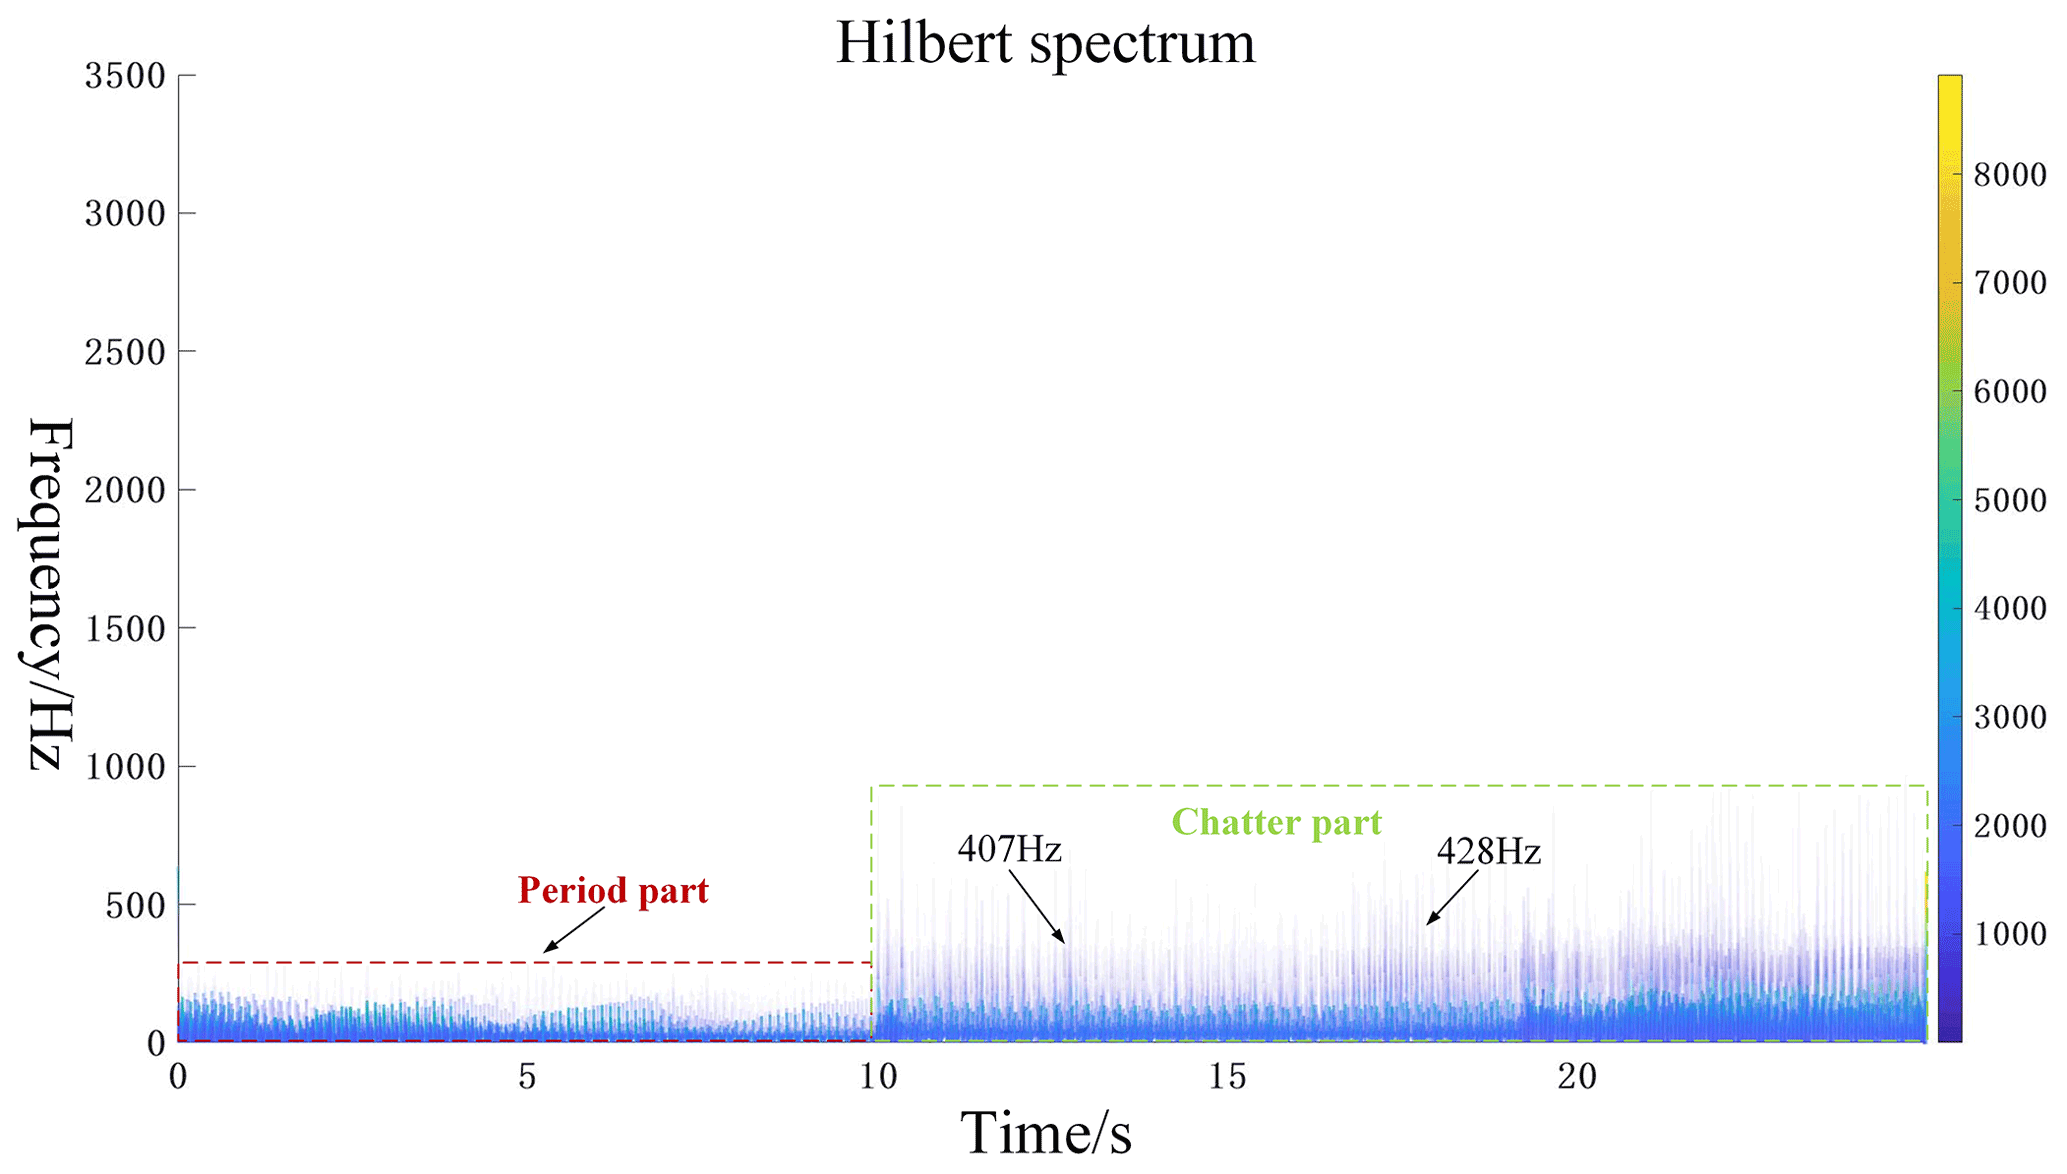
In order to further verify the effectiveness of the proposed method, a Hilbert transform is performed on the three-segment signals a4, a6, and d4, respectively, and the frequency changes with time are analyzed.
Figures 10, 11, and 12 are the Hilbert spectra of the three frequency bands a4, a6, and d4, respectively. In Fig. 10, the natural frequency of the system is dominated by the natural frequency of the workpiece, which is 415 Hz. In the chatter part, it can be seen that its frequencies are all around the natural frequency of the workpiece. In Fig. 11, the natural frequency of the system is dominated by the first-order mode of the tool, which has a value of 1100 Hz. In the chatter part, it can be seen that its frequencies are all near the first-order mode of the tool. In Fig. 12, the natural frequency of the system is dominated by the second mode of the tool, and its value is 1880 Hz. In the chatter part, it can be seen that its frequencies are all near the second-order mode of the tool.

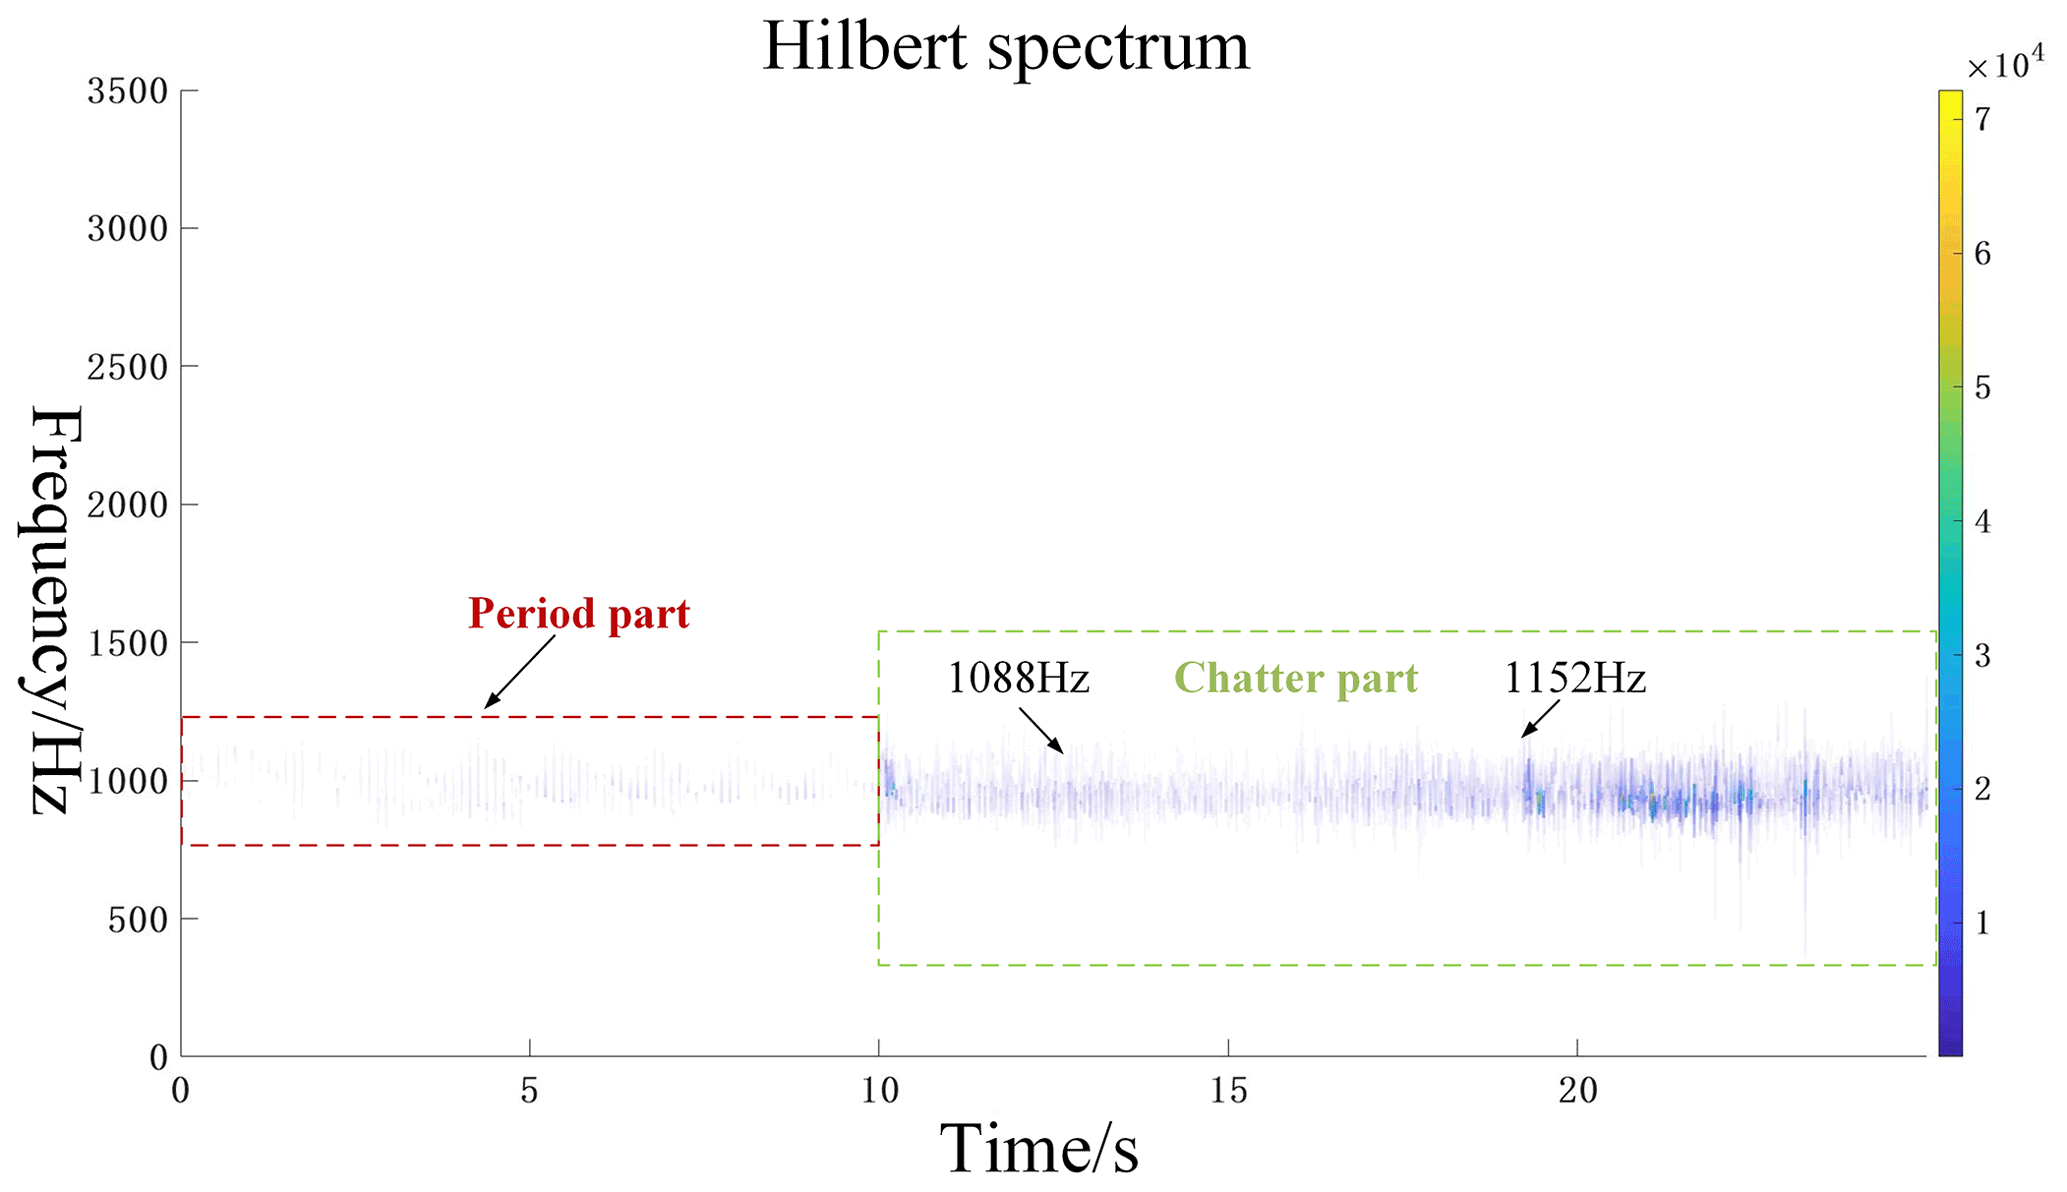
From this, it can be concluded that, when the natural frequency of the machine tool system is determined, the occurrence of the chatter vibration can be judged according to the principle that the amplitude of the chatter vibration frequency will have a peak value near the natural frequency of the machine tool system.
5.2 Chatter identification analysis and results
Chatter is a self-excited vibration of the tool whose frequency is not equal to the intrinsic frequency of the structure because the characteristic equation during cutting has an additional term in addition to the structural transfer function. However, the chattering frequency is still very close to the intrinsic frequency of the structure (Altintas and Ber, 2001). Based on the chatter identification method presented in the previous section, a comparative analysis of the two machining states, steady and chattering, is presented in Fig. 13.
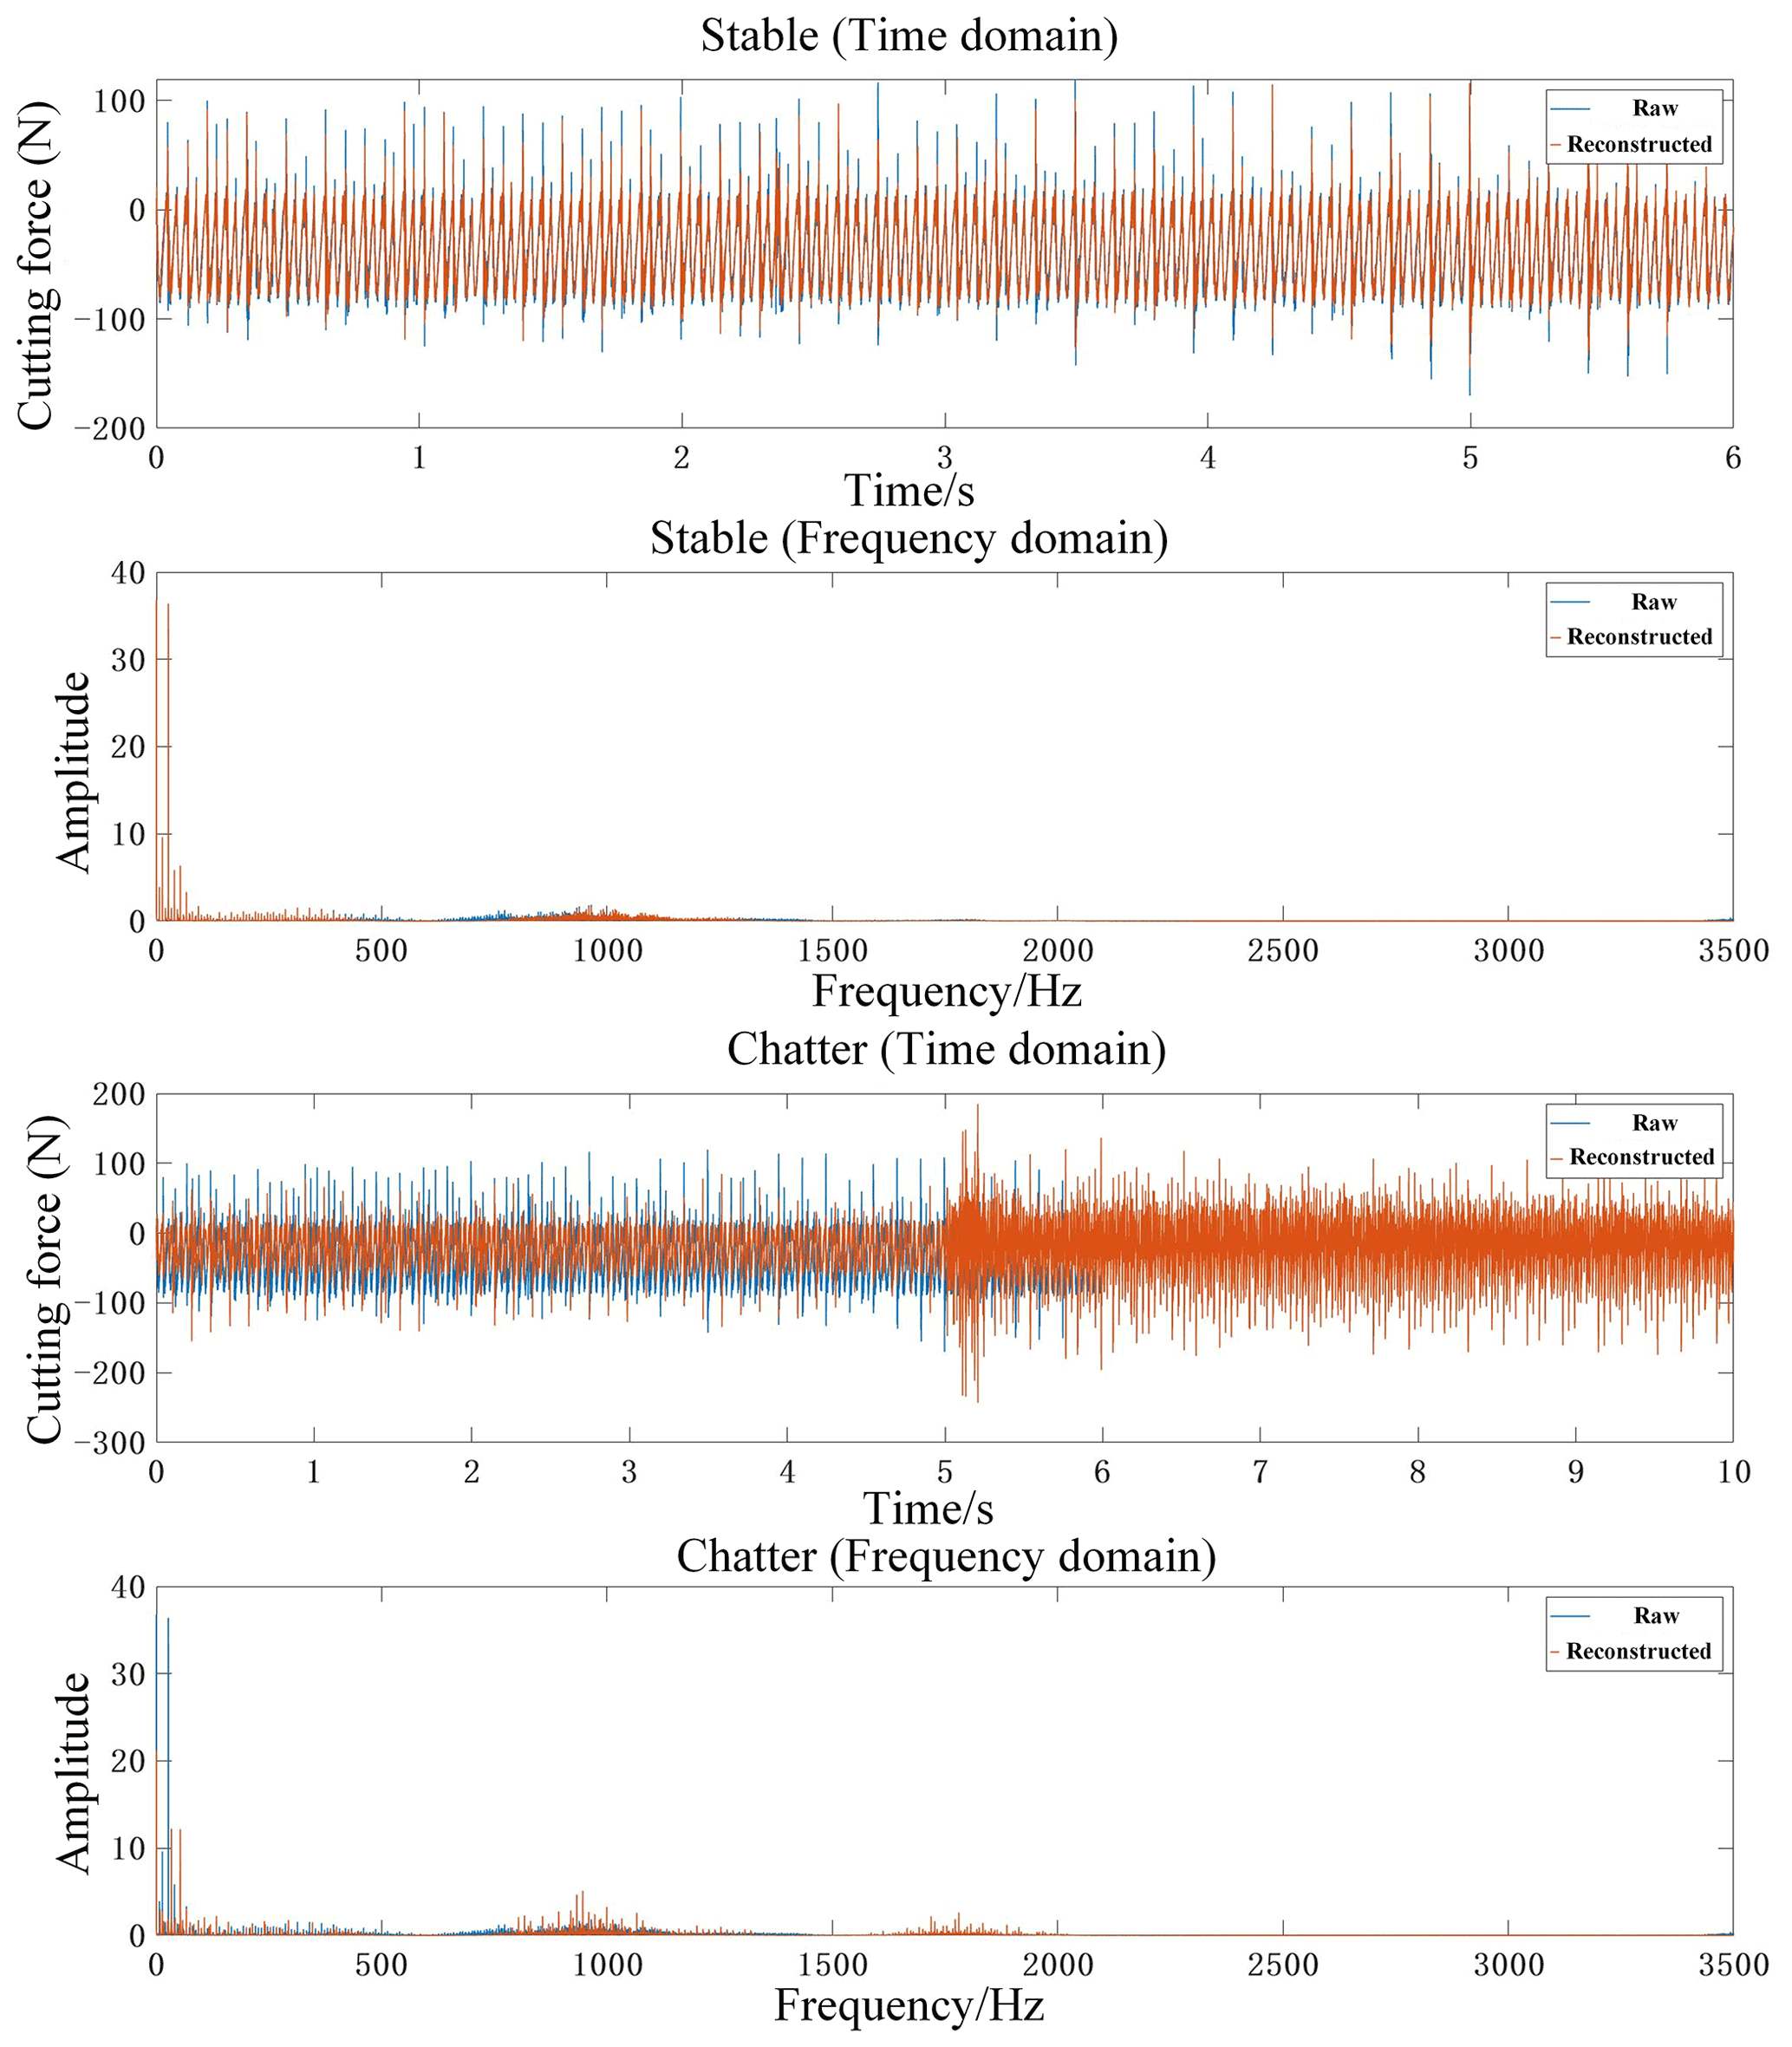
The above two sets of cutting force signals were decomposed by wavelet packets and reconstructed based on the inherent frequency of the system. The wavelet packet decomposition is based on the demy basis function, the number of decomposition layers is three, and the sampling frequency is 7000 Hz. Figure 14 shows the time domain and frequency domain comparison between the original and reconstructed signals for the two processing states.
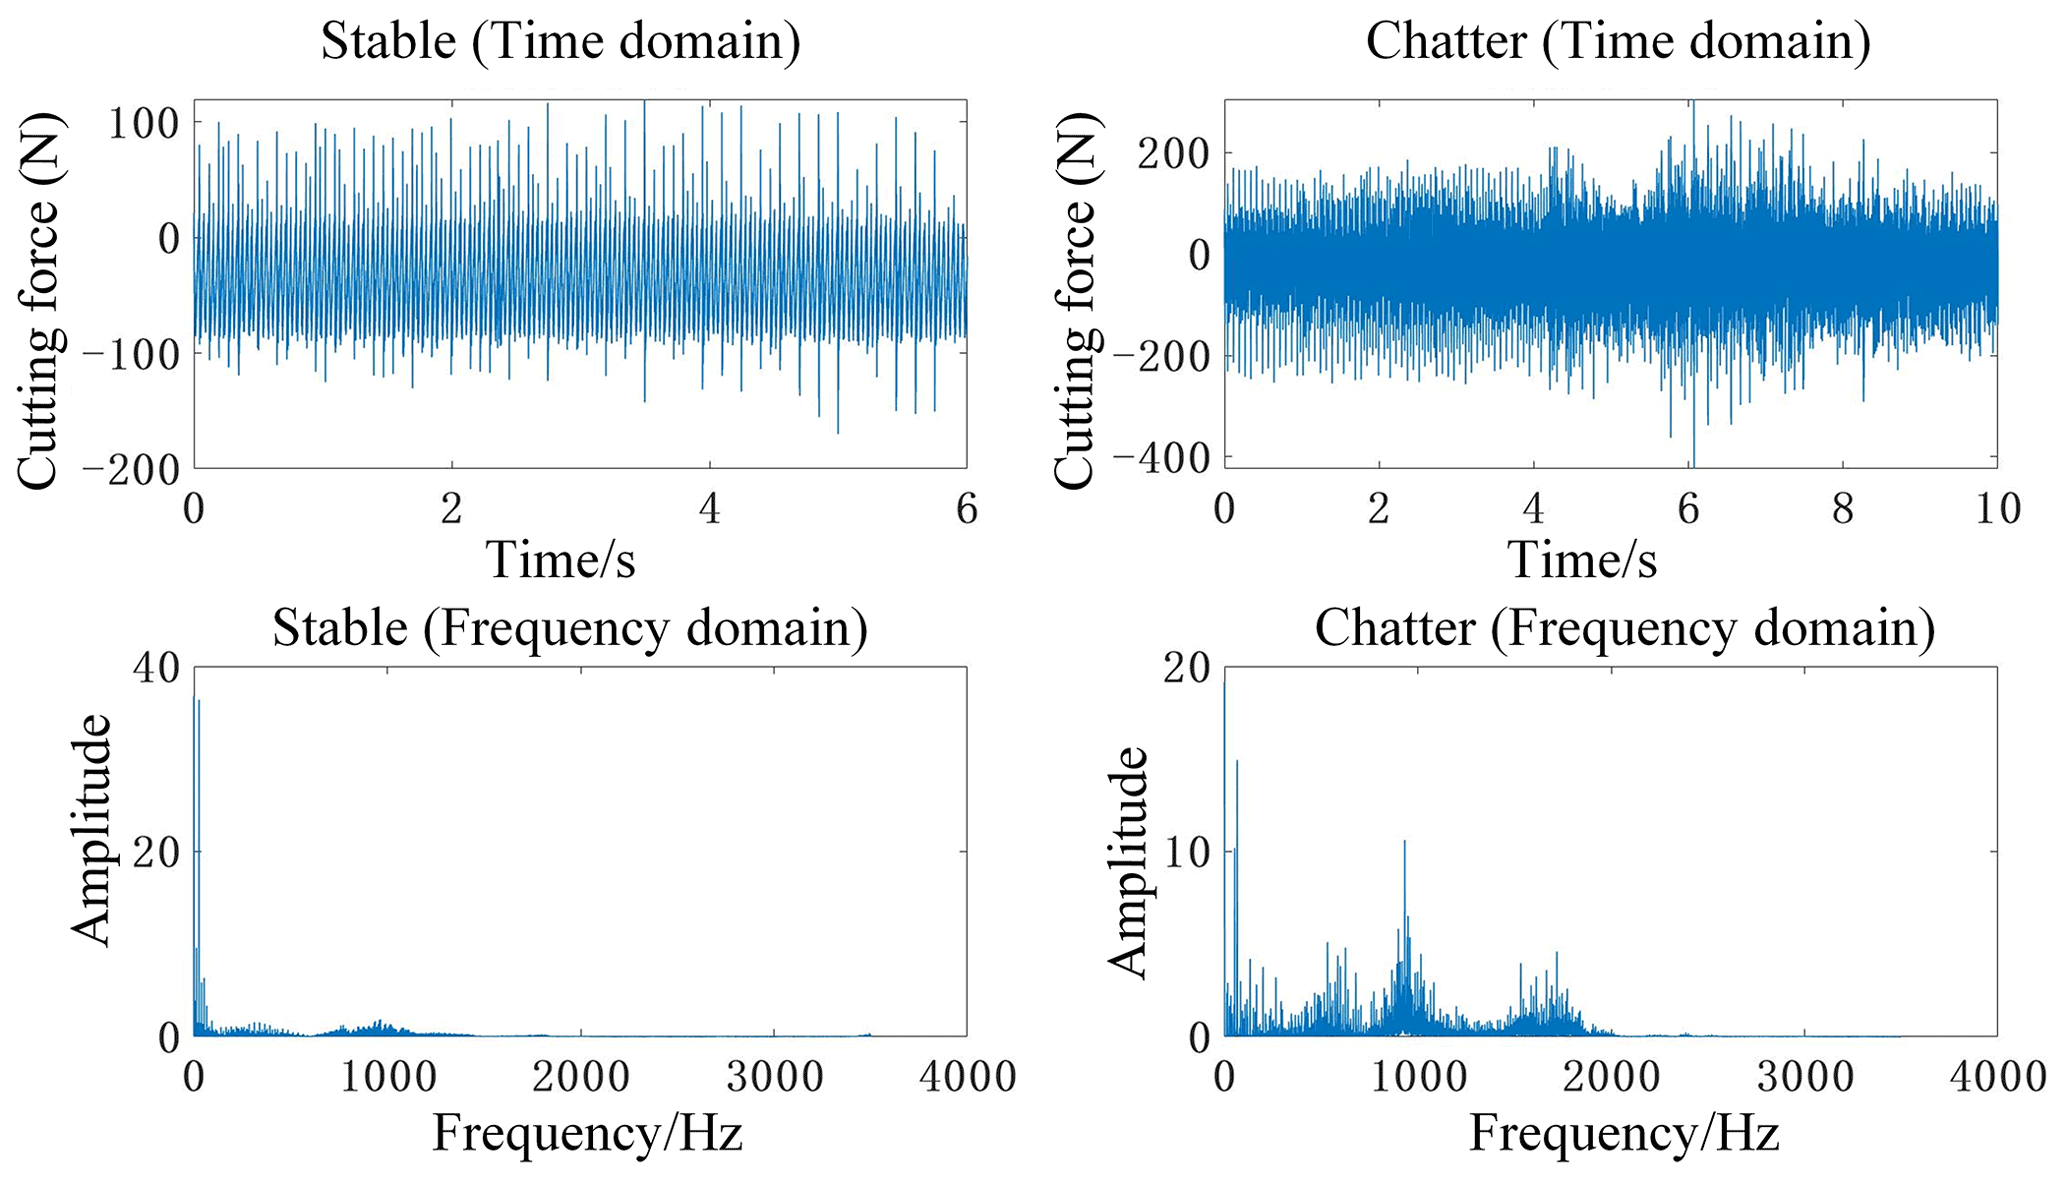
Figure 15 shows the comparative analysis of two groups of cutting force signals in the time domain, power spectral density, and time–frequency domain. First, when the machining state is analyzed from the perspective of the time domain diagram, the amplitude will always tend to be smooth, and its value will always fluctuate within a certain range, but it is not exactly accurate to rely merely on the time domain judgment, which involves a large number of human judgment factors and interference from noise factors. Further frequency domain analysis is carried out based on the characteristic that the chattering frequency will peak around the intrinsic frequency of the system, which is the basis of this work. In the plot of the power spectrum density for steady and chattering, the intrinsic frequency band of the machine tool system has been labeled, and it is clear that, when chattering occurs, the power spectrum density is greater in the intrinsic frequency band, and there are fluctuations in the power spectrum within that frequency band. At stable state, however, the density is less in the natural frequency band of the machine tool system and tends to plateau in this frequency band.
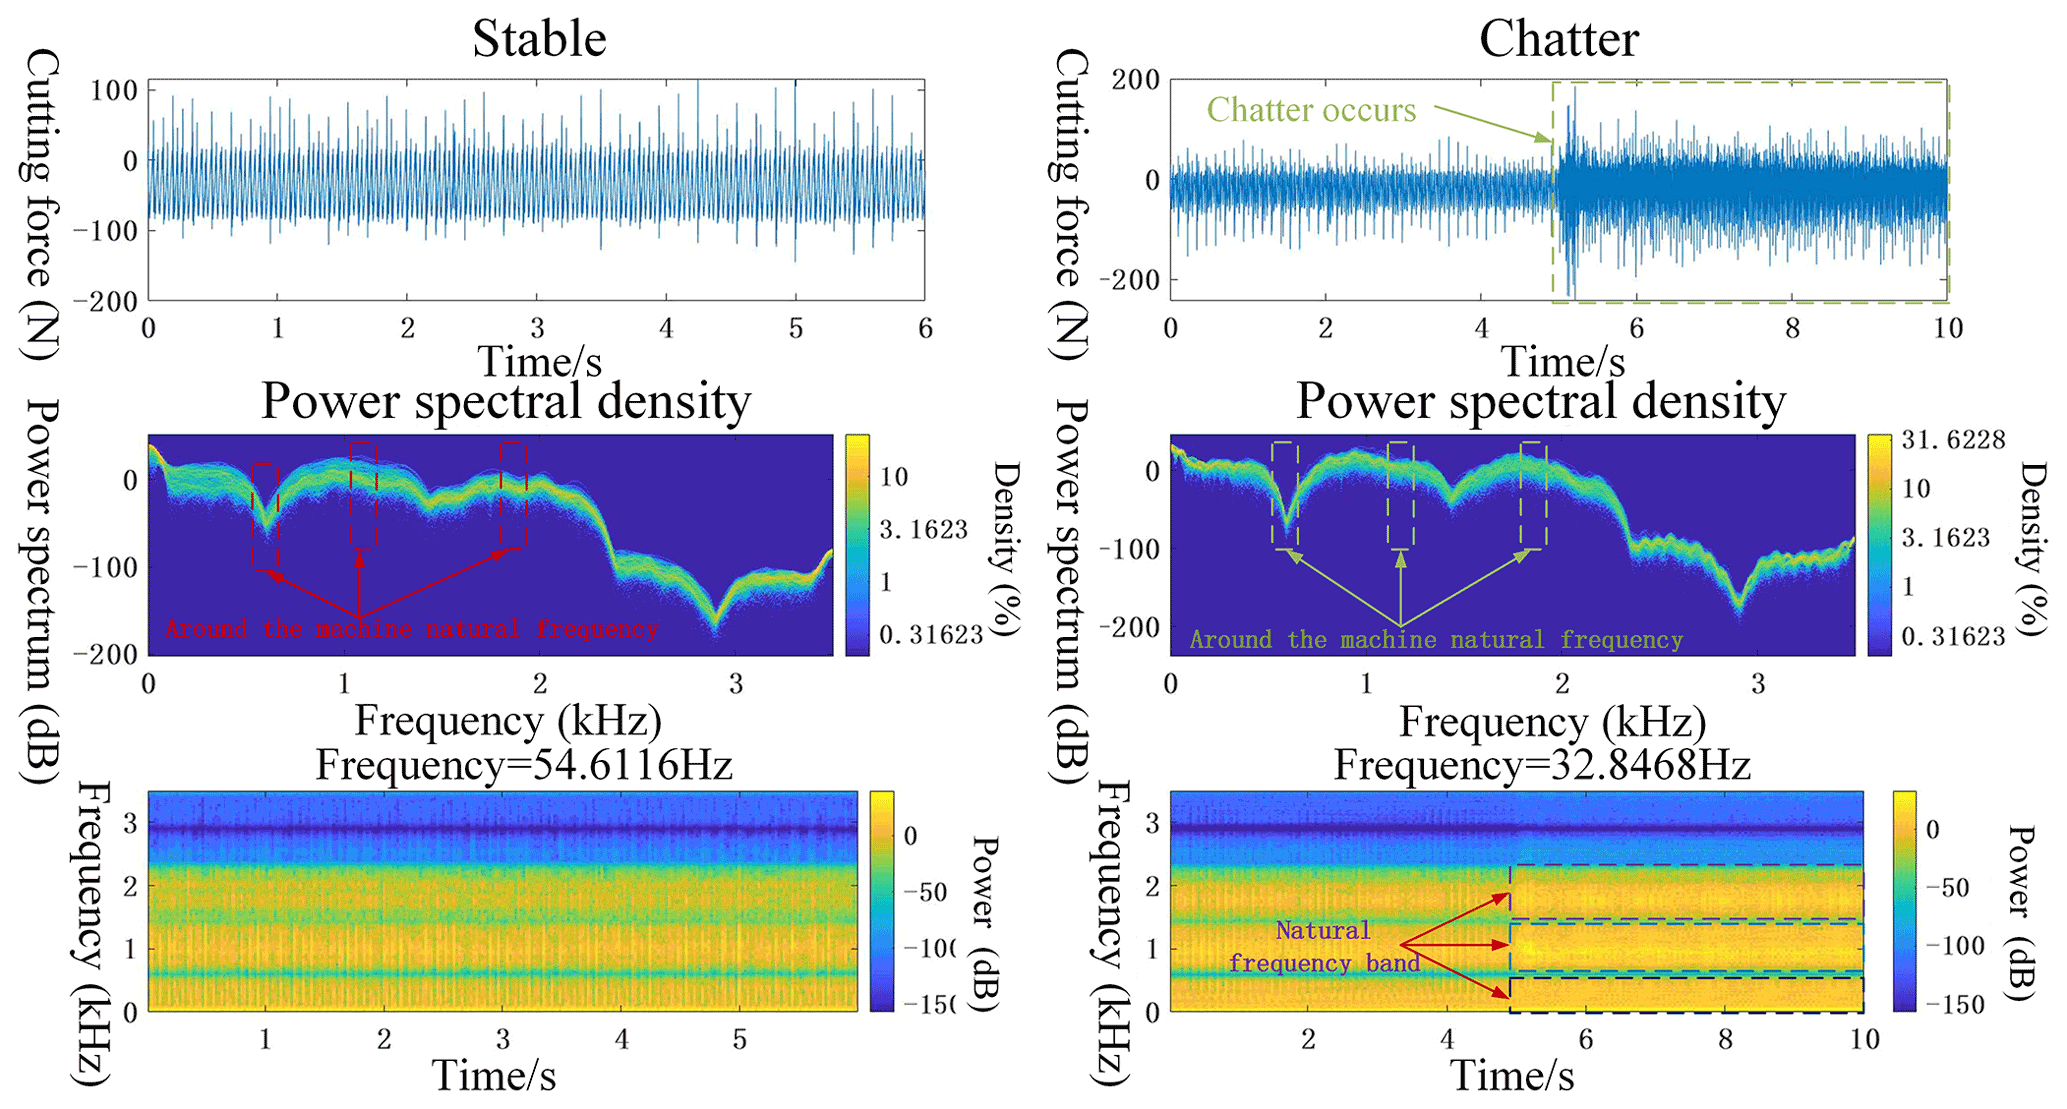
From a time–frequency domain analysis, this is more evident in its steady state and chattering states. As can be seen in Fig. 15, the main frequency bands of the system are all around the intrinsic frequency band; however, when chattering occurs, the power in the frequency band around the intrinsic frequency increases, which verifies that the chattering frequency occurs around the natural frequency of the system.
Figure 15 analyzes the time–frequency domain characteristics of the cutting force signals in the two machining states after the wavelet packet decomposition reconstruction. Due to the dynamic characteristics of the machine tool system, the natural frequency of the machine tool system is not identical at different machining moments. Although in Fig. 15 can roughly analyze the frequency distribution of the stable and chatter states, it is not detailed enough.

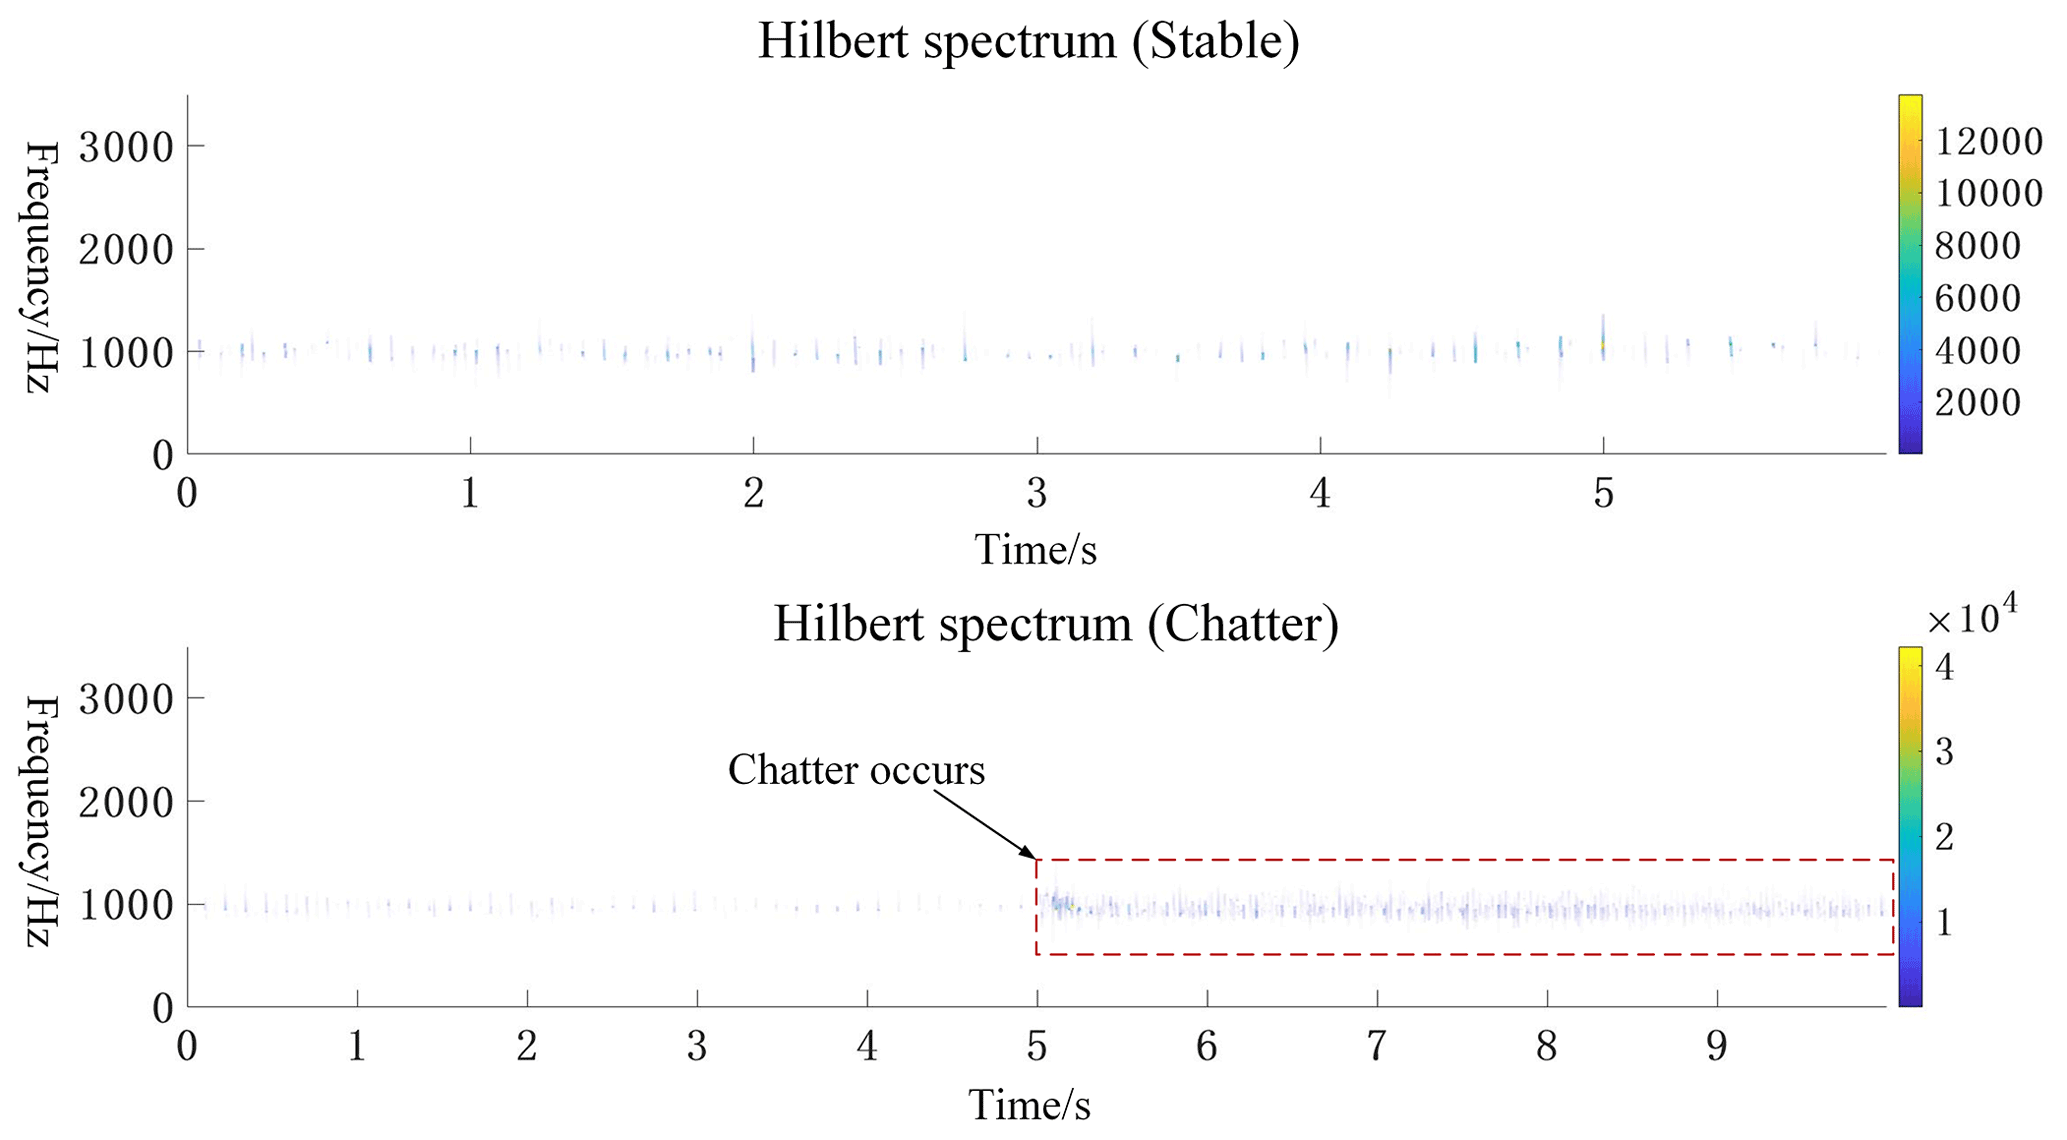
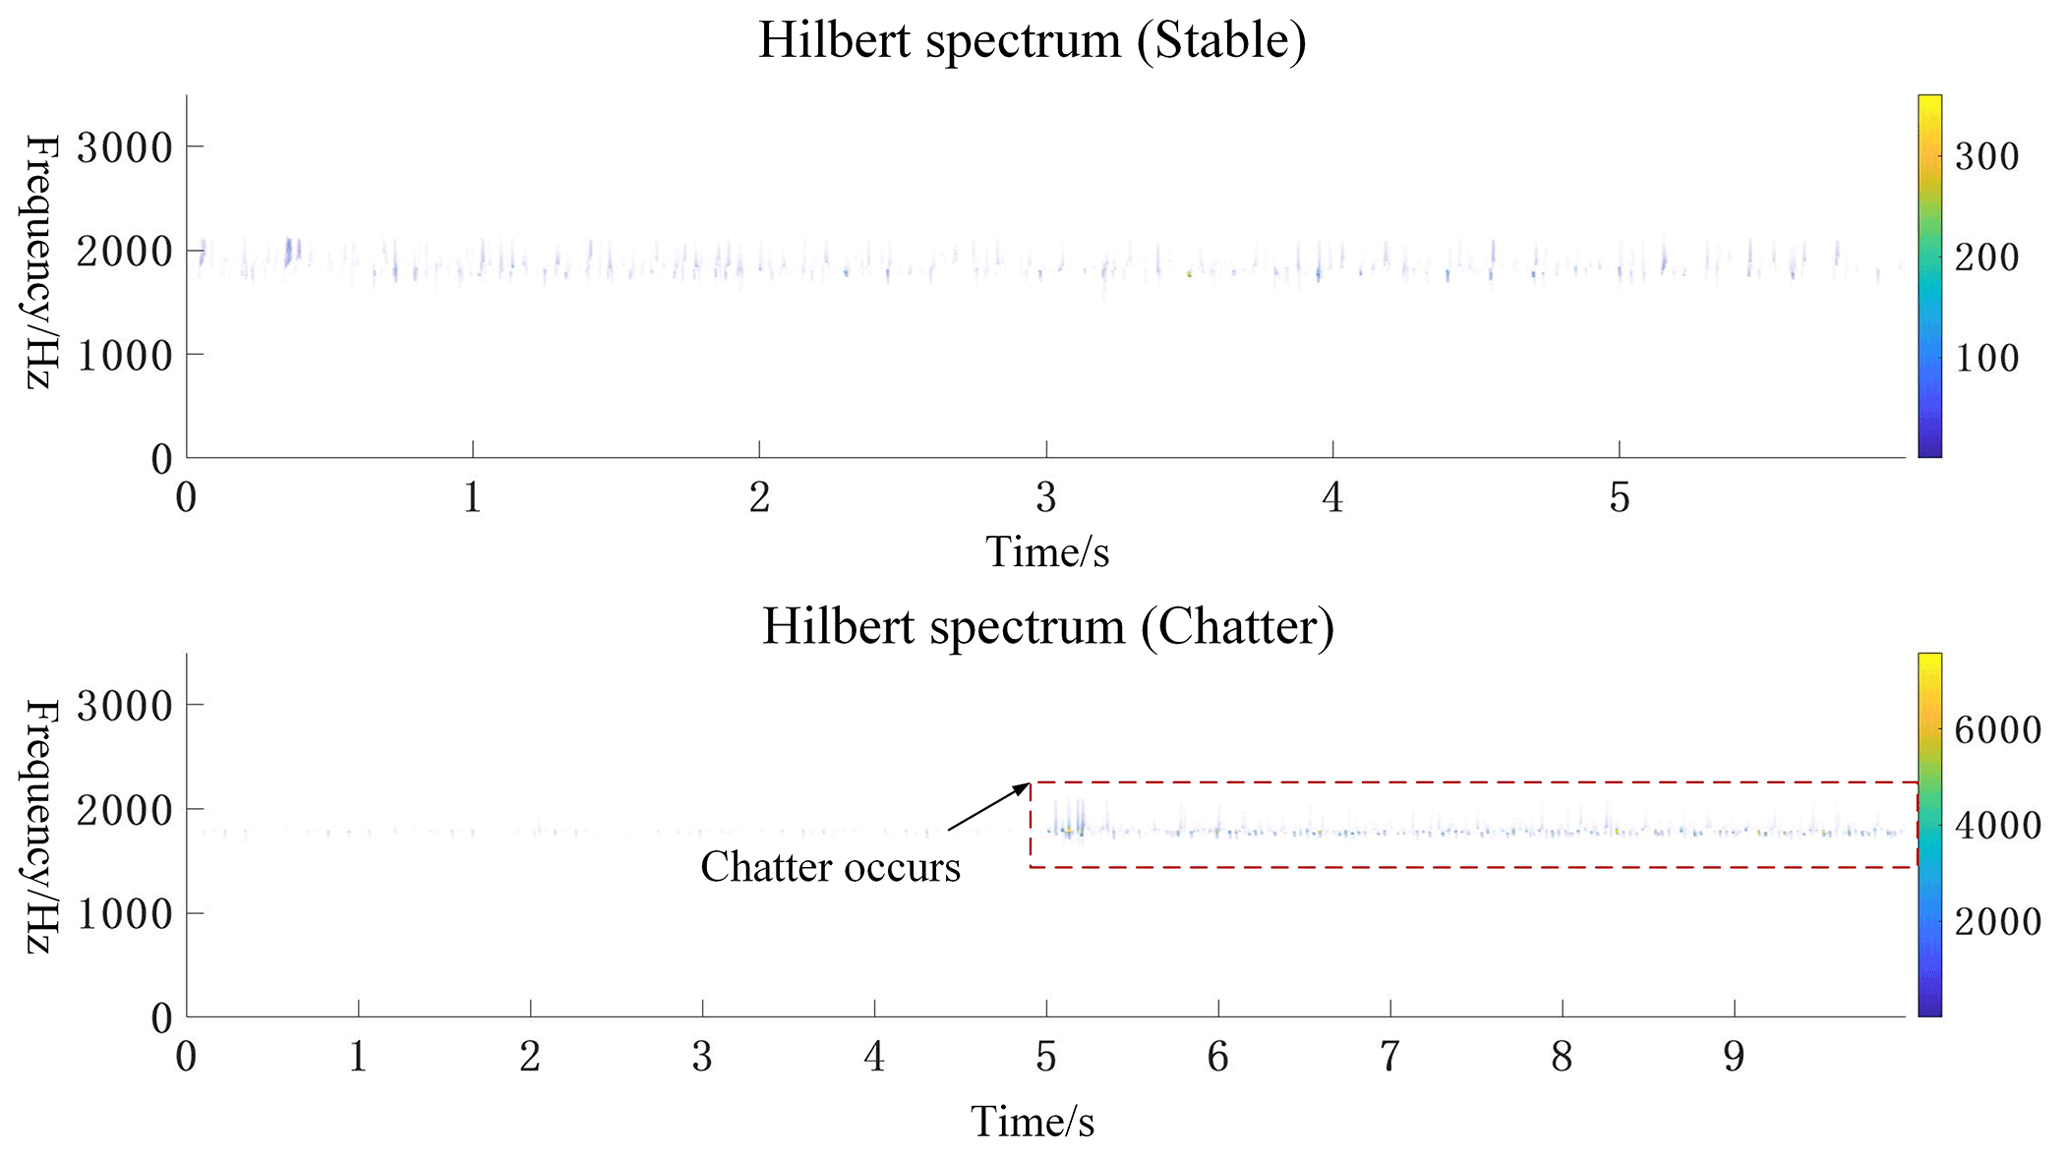
To further verify the solution's feasibility, three sets of sub-signals near the intrinsic frequency band are now analyzed individually for comparison. Figures 16, 17, and 18 show the Hilbert spectra of the sub-signals near the natural frequency of the system for the steady and chattering states. It can be seen in the figures that, when chattering occurs, there is an increase in the density of the Hilbert spectrum for the band containing the machine's natural frequencies.
In this paper, milling chatter identification is carried out based on dynamic features and wavelet packets. By measuring the dynamic characteristics of the system, it provides a basis for effectively extracting sub-signals with rich information and establishes the relationship between the dynamic characteristics of the machine tool spindle system and chatter identification. After obtaining the dynamic characteristics, sub-signals containing chatter information are extracted for signal reconstruction, and the accuracy of the reconstruction scheme is verified by numerical analysis and time–frequency domain images. Experimental results show that this scheme can effectively identify milling chatter. Based on the results obtained in this paper, future work will focus on the automatic extraction technology of chatter features, synchronously collecting different physical signals, extracting multiple chatter features, and fusing to identify chatter.
The data that support the findings of this study are available from the corresponding author upon reasonable request.
MX and XY conceived the idea. MX, XY, ZR, and YL performed all the experiments. MX drafted the paper, and XY, ZR, and YL interpreted, discussed, and edited the paper. MX and XY finalized the paper, including preparing the detailed response letter. XY supervised the work.
The contact author has declared that none of the authors has any competing interests.
Publisher's note: Copernicus Publications remains neutral with regard to jurisdictional claims in published maps and institutional affiliations.
The authors wish to thank Changfu Liu and another anonymous reviewer, for their valuable comments. We are also grateful to the editors, for their comprehensive comments and valuable comments and post-processing of the paper.
This work has been supported by National Natural Science Foundation of China (grant no. 51874158).
This paper was edited by Daniel Condurache and reviewed by Changfu Liu and one anonymous referee.
Altintas, Y. and Ber, A.: Manufacturing automation: metal cutting mechanics, machine tool vibrations, and CNC design, Appl. Mech. Rev., 54, B84, https://doi.org/10.1115/1.1399383, 2001.
Cao, H., Lei, Y., and He, Z.: Chatter identification in end milling process using wavelet packets and Hilbert–Huang transform, Int. J. Mach. Tool. Manu., 69, 11–19, https://doi.org/10.1016/j.ijmachtools.2013.02.007, 2013.
Fang, N., Pai, P. S., and Mosquea, S.: Effect of tool edge wear on the cutting forces and vibrations in high-speed finish machining of Inconel 718: an experimental study and wavelet transform analysis, Int. J. Adv. Manuf. Tech., 52, 65–77, https://doi.org/10.1007/s00170-010-2703-6, 2011.
Huang, P., Li, J., Sun, J., and Zhou, J.: Vibration analysis in milling titanium alloy based on signal processing of cutting force, Int. J. Adv. Manuf. Tech., 64, 613–621, https://doi.org/10.1007/s00170-012-4039-x, 2013.
Jemielniak, K., Kossakowska, J., and Urbański, T.: Application of wavelet transform of acoustic emission and cutting force signals for tool condition monitoring in rough turning of Inconel 625, Proceedings of the Institution of Mechanical Engineers, Part B: Journal of Engineering Manufacture, 225, 123–129, https://doi.org/10.1243/09544054JEM2057, 2011.
Karam, S. and Teti, R.: Wavelet transform feature extraction for chip form recognition during carbon steel turning, Proc. CIRP, 12, 97–102, https://doi.org/10.1016/j.procir.2013.09.018, 2013.
Li, K., He, S., Luo, B., Li, B., Liu, H., and Mao, X.: Online chatter detection in milling process based on VMD and multiscale entropy, Int. J. Adv. Manuf. Tech., 105, 5009–5022, https://doi.org/10.1007/s00170-019-04478-4, 2019.
Li, X., Wan, S., Huang, X., and Hong, J.: Milling chatter detection based on VMD and difference of power spectral entropy, Int. J. Adv. Manuf. Tech., 111, 2051–2063, https://doi.org/10.1007/s00170-020-06265-y, 2020.
Lin, H. and Wang, Q.: Detection of singularity of cutting force signal based on wavelet analysis, Tool Technol., 45, 103–105, 2011.
Litak, G., Kecik, K., and Rusinek, R.: Cutting force response in milling of Inconel: Analysis by wavelet and Hilbert-Huang transforms, Lat. Am. J. Solids Stru., 10, 133–140, https://doi.org/10.1590/S1679-78252013000100013, 2013.
Liu, C., Gao, X., Chi, D., He, Y., Liang, M., and Wang, H.: On-line chatter detection in milling using fast kurtogram and frequency band power, Eur. J. Mech. A-Solid., 90, 104341, https://doi.org/10.1016/j.euromechsol.2021.104341, 2021.
Niu, J., Jia, J., Sun, Y., and Guo, D.: Generation mechanism and quality of milling surface profile for variable pitch tools considering runout, J. Manuf. Sci. E.-T. ASME, 142, 121001, https://doi.org/10.1115/1.4047622, 2020.
Niu, J., Jia, J., Wang, R., Xu, J., Sun, Y., and Guo, D.: State dependent regenerative stability and surface location error in peripheral milling of thin-walled parts, Int. J. Mech. Sci., 196, 106294, https://doi.org/10.1016/j.ijmecsci.2021.106294, 2021.
Qian, S., Sun, Y., and Xiong, Z.: Intelligent chatter detection based on wavelet packet node energy and LSSVM-RFE, C. 2015 IEEE International Conference on Advanced Intelligent Mechatronics (AIM), 1514–1519 (IEEE), 2015.
Qin, C., Tao, J., and Liu, C.: A novel stability prediction method for milling operations using the holistic-interpolation scheme, P. I. Mech. Eng. C-J. Mec., 233, 4463–4475, 2019.
Qin, C., Tao, J., Shi, H., Xiao, D., Li, B., and Liu, C.: A novel Chebyshev-wavelet-based approach for accurate and fast prediction of milling stability, Precis. Eng., 62, 244–255, 2020.
Qin, C., Xiao, D., Tao, J., Yu, H., Jin, Y., Sun, Y., and Liu, C.: Concentrated velocity synchronous linear chirplet transform with application to robotic drilling chatter monitoring, Measurement, 194, 111090, https://doi.org/10.1016/j.measurement.2022.111090, 2022.
Rafal, R., Pawel, L., Krzysztof, K., Bogdan, K., and Jerzy, W.: Chatter identification methods on the basis of time series measured during titanium superalloy milling, Int. J. Mech. Sci., 99, 196–207, https://doi.org/10.1016/j.ijmecsci.2015.05.013, 2015.
Ren, J. B., Sun, G. Z., Chen, B., and Luo, M.: Milling Chatter Identification Method Based on Wavelet Packet Transform and Kernel Principal Component Analysis, Noise and Vibration Control, 34, 161–165, 2014.
Sun, Y., Jin, L., Gong, Y., Wen, X., Yin, G., Wen, Q., and Tang, B.: Experimental evaluation of surface generation and force time-varying characteristics of curvilinear grooved micro end mills fabricated by EDM, J. Manuf. Process., 73, 799–814, https://doi.org/10.1016/j.jmapro.2021.11.049, 2022.
Xia, M., Shao, H., Williams, D., Lu, S., Shu, L., and de Silva, C. W.: Intelligent fault diagnosis of machinery using digital twin-assisted deep transfer learning, Reliab. Eng. Syst. Safe., 215, 107938, https://doi.org/10.1016/j.ress.2021.107938, 2021a.
Xia, M., Shao, H., Ma, X., and de Silva, C. W.: A stacked GRU-RNN-based approach for predicting renewable energy and electricity load for smart grid operation, IEEE T. Ind. Inform., 17, 7050–7059, https://doi.org/10.1109/TII.2021.3056867, 2021b.
Yao, Z., Mei, D., and Chen, Z.: On-line chatter detection and identification based on wavelet and support vector machine, J. Mater. Process. Tech., 210, 713–719, https://doi.org/10.1016/j.jmatprotec.2009.11.007, 2010.
Zhang, Y., Ren, Z., Zhou, S., Feng, K., Yu, K., and Liu, Z.: Supervised Contrastive Learning-Based Domain Adaptation Network for Intelligent Unsupervised Fault Diagnosis of Rolling Bearing, IEEE-ASME T. Mech., https://doi.org/10.1109/TMECH.2022.3179289, online first, 2022.
Zhu, L. and Liu, C.: Recent progress of chatter prediction, detection and suppression in milling, Mech. Syst. Signal Pr., 143, 106840, https://doi.org/10.1016/j.ymssp.2020.106840, 2020.
- Abstract
- Introduction
- Establishment of mathematical models
- Construction of the experimental platform
- Measurement of dynamic characteristics
- Wavelet analysis of cutting force signal
- Conclusion
- Data availability
- Author contributions
- Competing interests
- Disclaimer
- Acknowledgements
- Financial support
- Review statement
- References