the Creative Commons Attribution 4.0 License.
the Creative Commons Attribution 4.0 License.
 | 14 Mar 2022
Design of a steering mechanism for the three-wheel tilting motorcycle
Ming-Yen Chang
Hsing-Hui Huang
Zhao-Long Chen
There is a trend to develop three-wheel motorcycles because of their better stability and superior cornering ability compared to 1F1R (one front wheel and one rear wheel) motorcycles. The main purpose of this study is to establish a design process for the 2F1R (two front wheels and one rear wheel) three-wheel tilting mechanism and to reduce the turning radius to fulfill steering geometry in order to reduce the steering torque for a better handling feel. This research is divided into two parts: first, an existing steering tilting mechanism is selected as a design reference, and creative design methods are applied to set design constraints and requirements to facilitate a new mechanism design. A steering tilting mechanism is developed based on the design parameters of the steering mechanism and design objectives. Then Simpack software is employed to simulate handling tests on various routes and to verify the design model. The steering torque of the new mechanism is found to be much higher than that of the design reference. Therefore, the next step is to apply the Taguchi method to optimize the steering mechanism and to ensure that the parameter combination that satisfies the design objectives for the steering mechanism is selected. Finally, the route evaluation indexes are obtained from handling test simulations. From the results of the steering characteristics of the reference and research vehicle, the steering torque is found to be directly related to the response capability. Furthermore, the steering torque of the research vehicle is reduced by the optimization analysis using the Taguchi method, and the route evaluation indexes indicate that the vehicle's handling characteristics were improved.
- Article
(3673 KB) - Full-text XML
- BibTeX
- EndNote


With the improvement of living quality and the development of transportation, motorcycles have become one of the most convenient means of transportation. Compared with automobiles, motorcycles are cheaper and have better flexibility because of their size; therefore, they are widely used in daily life, public security and military affairs. As the public pays more and more attention to traffic safety issues, three-wheel tilting motorcycles are regarded as a future trend in the market. Besides the improved stability of three-wheelers on the ground, they also have the same rapid roll ability as 1F1R (one front wheel and one rear wheel) two-wheel motorcycles. The development and design capabilities of tilting motorcycles are still insufficient. If a design method for the whole vehicle can be established, it would help to popularize three-wheel vehicles in the future. This research uses a systematic design process (Yan, 1998), starting from the development of the new steering tilting mechanism and optimization analysis of steering performance results. There are many modeling studies on motorcycles. Gani et al. (1997) established motorcycle models through mathematical models and used programming analysis to calculate multi-body dynamics, which was the beginning of motorcycle modeling. Cossalter et al. (1998) used computer simulation to establish motorcycle models under different road conditions, such as steady circle and lane changing and through simulation results such as steering torque and roll angle to get the dynamic characteristics. It helps to obtain the best parameters for real vehicle development in the simulation stage, effectively reducing development costs and time (Cossalter et al., 1998; Mangaraju et al., 2007; Pradeepak et al., 2015; Gosh and Anthony Samy, 2014). These studies even propose methods for optimizing vehicles (Pradeepak et al., 2015). Frank et al. (2020) used drivers with different riding experience to evaluate the results of different road tests and explored the influence of different driving habits and physical conditions on the dynamics of vehicles. This method is helpful for our study on the control of the vehicle route during simulation. Sponziello et al. (2009) and Bartolozzi et al. (2009) also established three-wheeled vehicle models through computer simulation, simulated different driving conditions, explored the influence of the driver's position and analyzed vehicle stability with mathematical models. This research uses optimized quality design, referring to the principle and practice of quality design of Li (2000), which introduces the Taguchi method and its application methods, and obtained the best combination of parameters for the best characteristics.
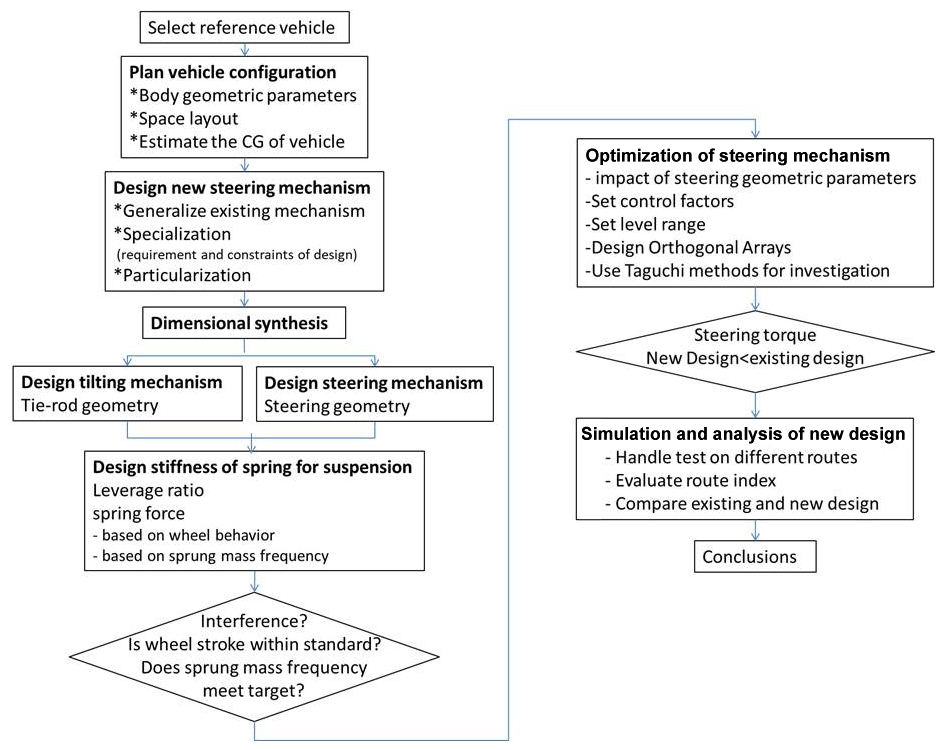
The research flow chart is shown in Fig. 1. Firstly, a commercial steering mechanism is selected as reference, and the geometrical configuration of the vehicle is determined. A design method is used to select a feasible steering mechanism and develop a new steering mechanism according to the design requirements and constraints. Parts of the new mechanism are laid out to the required size to define and to modify the steering geometry based on the suspension geometry. A commercial three-wheel tilting motorcycle is taken as reference to set the target of steering performance. The performance of the new mechanism is then verified, and the influence of steering geometry on steering performance is studied for design adjustments. Finally, the wheel force is calculated based on the center of gravity position, and the tire stroke is constrained to obtain the required suspension spring stiffness. The first-stage research vehicle model is produced for dynamic simulation and compared with the steering performance of the desired result as the basis of design analysis for improvement. Using the influence of steering geometry on steering performance as a control factor level, the Taguchi method experiment is executed to obtain steering geometric parameters that meet the steering requirements. Finally, the model was imported into Simpack software for four handling dynamic simulation tests to evaluate the performance by relative indexes. The steering performance between the research vehicle and the reference vehicle is compared to further optimize the steering mechanism.
2.1 Space layout
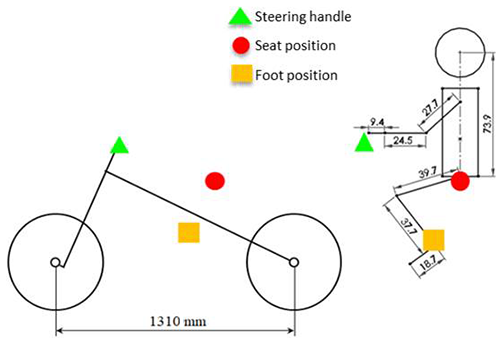
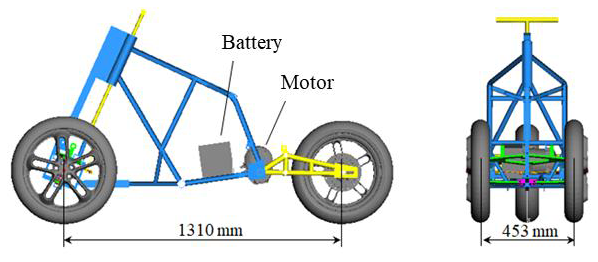
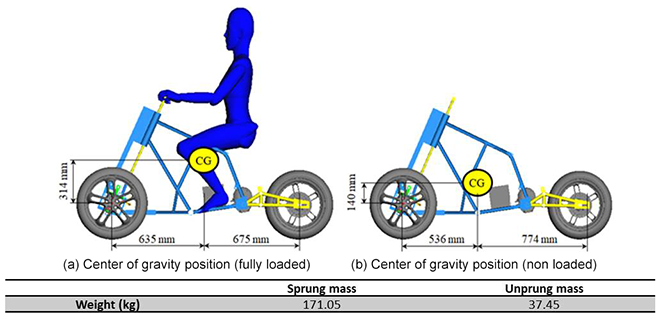
A motor and batteries constitute the power system of this research. The geometry and space layout of the motorcycle are planned first. The human body model is set (77 kg, 176 cm) to confirm the seat and handle position of the motorcycle (Fig. 2). After confirming the position and the weight of the motor and batteries, the sprung mass, unsprung mass and the center of gravity position of the whole motorcycle are calculated as shown in Fig. 2.
2.2 Design of the new steering mechanism
An existing motorcycle is taken as reference and is transferred into a generalized chain based on creative design methodology (Yan, 1998). With the design requirements and constraints, a new generalized chain is developed and further specialized. The mechanism is then realized to complete the research.
2.2.1 Topology of the existing design
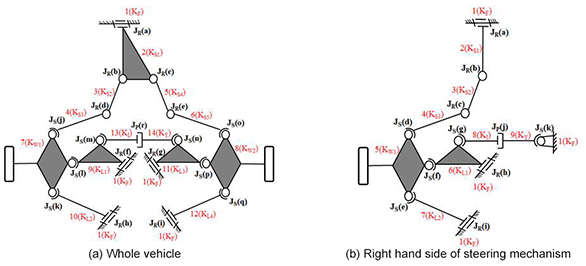
The existing design in this study is a mechanism with 14 links and 20 joints, and its mechanism is shown in Fig. 5a. With the topological characteristics and corresponding relationship between links and joints, Eq. (1) is used to calculate the degree(s) of freedom (DoF) of the mechanism. Due to the symmetry of the steering tilting mechanism, only half of the mechanism is focused as shown in Fig. 5b, to reduce the members of links and joints in assisting retrieval of the atlas for new design subsequently.
where DS is the degrees of freedom of the space device, NL is the number of links of the mechanism, is the number of i-type joints and is the constraints of i-type joint of the mechanism (where i represents different types of joints).
Topological characteristics of the existing steering tilting mechanism can be concluded as follows:
-
It consists of 14 links and 18 joints which are denoted as (14, 18).
-
It has a ground link (KF), one shock absorber (KI) consisting of a piston (KY), four swing arms (KL1–4), two wheel links (KW1–2) and five kinematic links for steering (KS1–5).
-
It has nine revolute joints (a, b, c, d, e, f, g, h, i), eight spherical joints (j, k, l, m, n, o, p, q) and a prismatic joint (r).
-
It is a spatial mechanism with 3 degrees of freedom.
The mechanism has 4 degrees of freedom, shown in Fig. 5a. There is an extra degree of freedom in the mechanism: the link between two joints has a self-spine motion. The self-spin motion does not affect the mechanism, so it needs to be deducted. The actual degrees of freedom are 3 for the rotation of the steering and up and down movement of the left and right wheels.
2.2.2 Design requirements and constraints
After exploring the topological characteristics and the mechanism of the existing design, the requirements and constraints of the research vehicle are further concluded.
The design requirements are as follows:
-
There must be a ground link (KF) for the vehicle body.
-
There must be a wheel link (KW).
-
There are two swing arms (KL1, KL2) for the tilting mechanism.
-
There must be a shock absorber, consisting of a cylinder (KY) and a piston (KI).
-
There must be a link for the steering handle (KS).
-
There must be a link for the tie rod (KS1).
The design constraints are as follows:
-
The vehicle body should be at least a ternary link.
-
The wheel link should be a ternary link and cannot be adjacent to the vehicle body.
-
A swing arm should be a ternary link.
-
The two swing arms should be connected to the wheel link by spherical joints, and at least one of the two swing arms should be adjacent to the vehicle body.
-
The shock absorber should be a dyad with a joint to slide and two spherical joints for self-spin.
-
The shock absorber should be adjacent to two swing arms at the same time.
-
The shock absorber should not be adjacent to the wheel link and steering handle.
-
The steering handle should be adjacent to the vehicle body but should not be adjacent to the swing arm.
-
The tie rod should be adjacent to the steering handle and also adjacent to the wheel link with a spherical joint.
2.2.3 Generalization
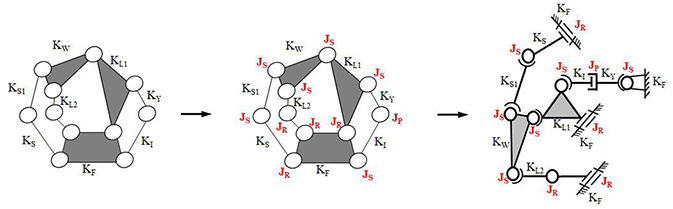
The existing design is transferred into a generalized chain with generalized links and revolute joints. The process increases the number of mechanism links and complexity, but it can help to create all possible designs that meet the requirements. Since several spherical joints have been confirmed to be used in the new design, the number of spherical joints will be reserved in this generalization process, as shown in Fig. 6.
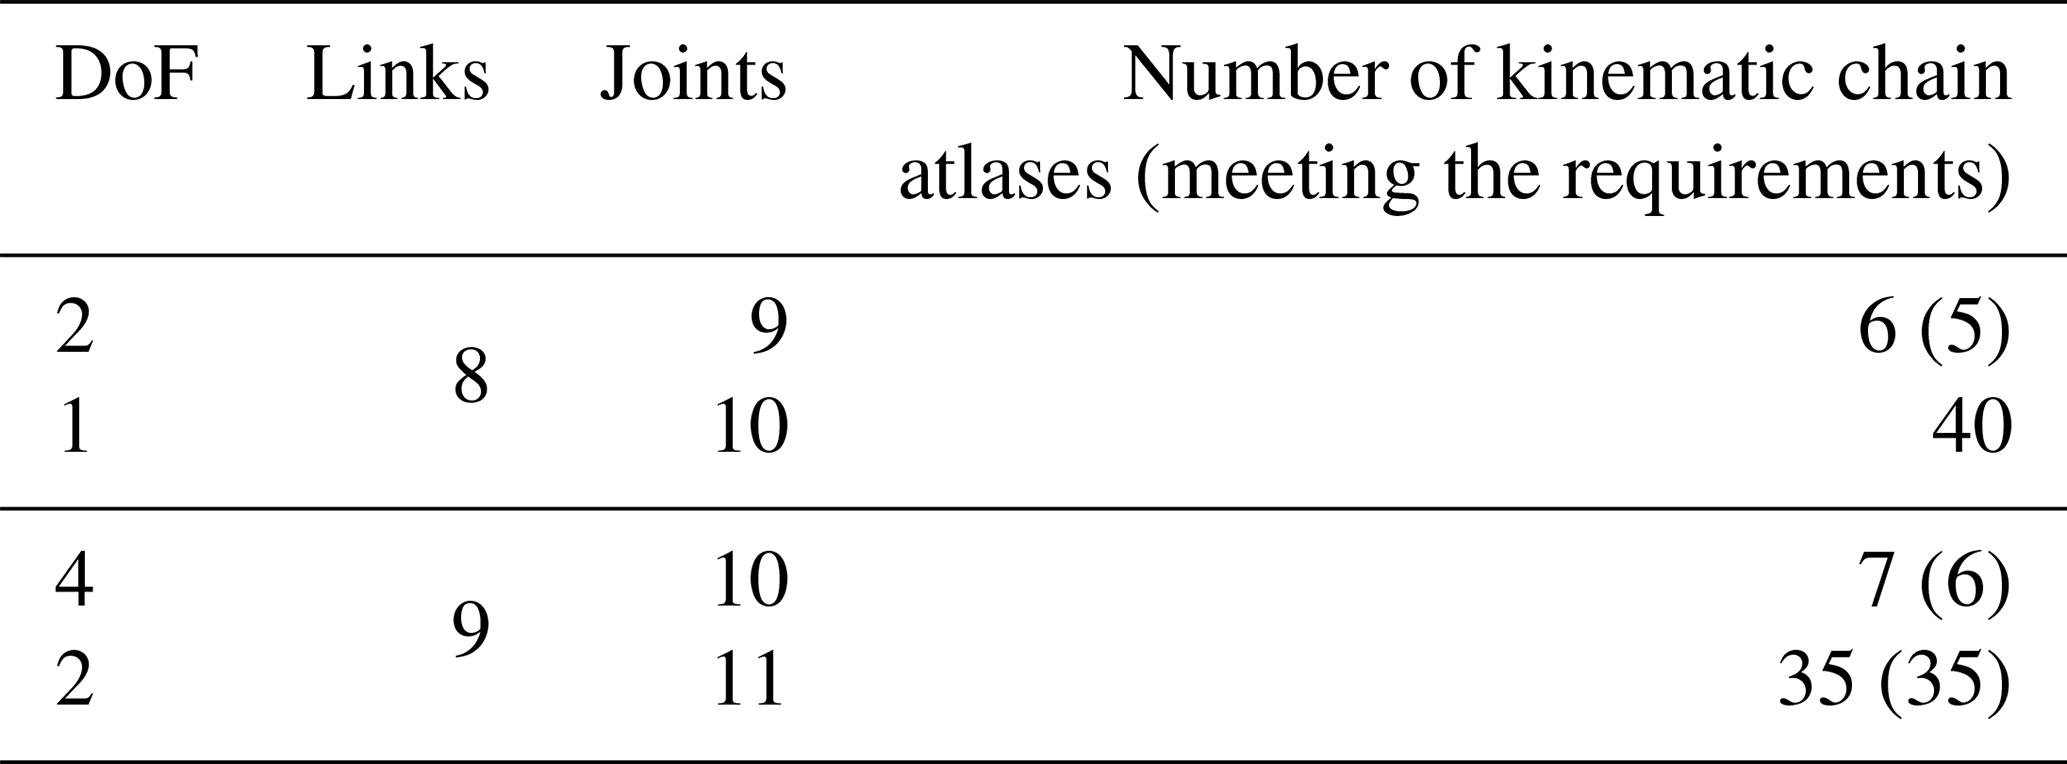
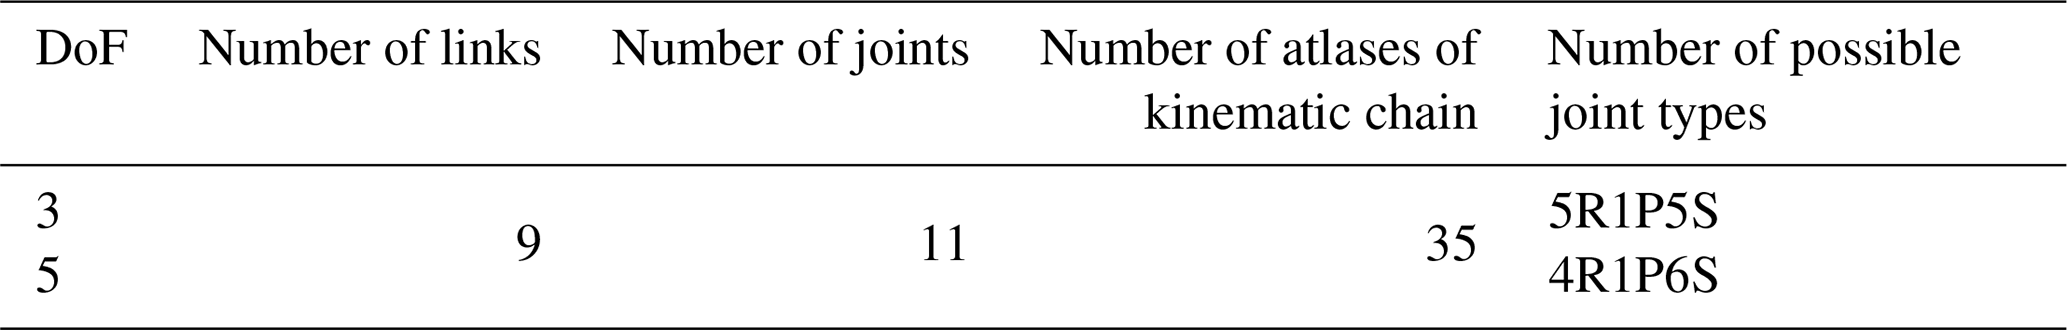
This study takes 9 links and 11 joints, and the atlas of assigned links and joints is collected by applying number synthesis. The desired atlas is selected based on the degrees of freedom. Taking the redundant degrees of freedom into consideration, atlases with degrees of freedom greater than 2 are selected, as listed in Table 1.
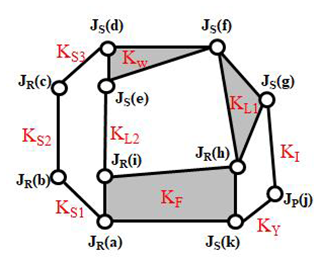
Figure 6Generalization chain of existing design of the three-wheeler tilting motorcycle mechanism.
2.2.4 Specialization
For each feasible kinematic chain obtained from generalization, the required links and joint types are applied to the kinematic chain according to the design requirements and constraints; seven feasible designs are obtained. The feasible specialization kinematic chains are shown in Fig. 7.
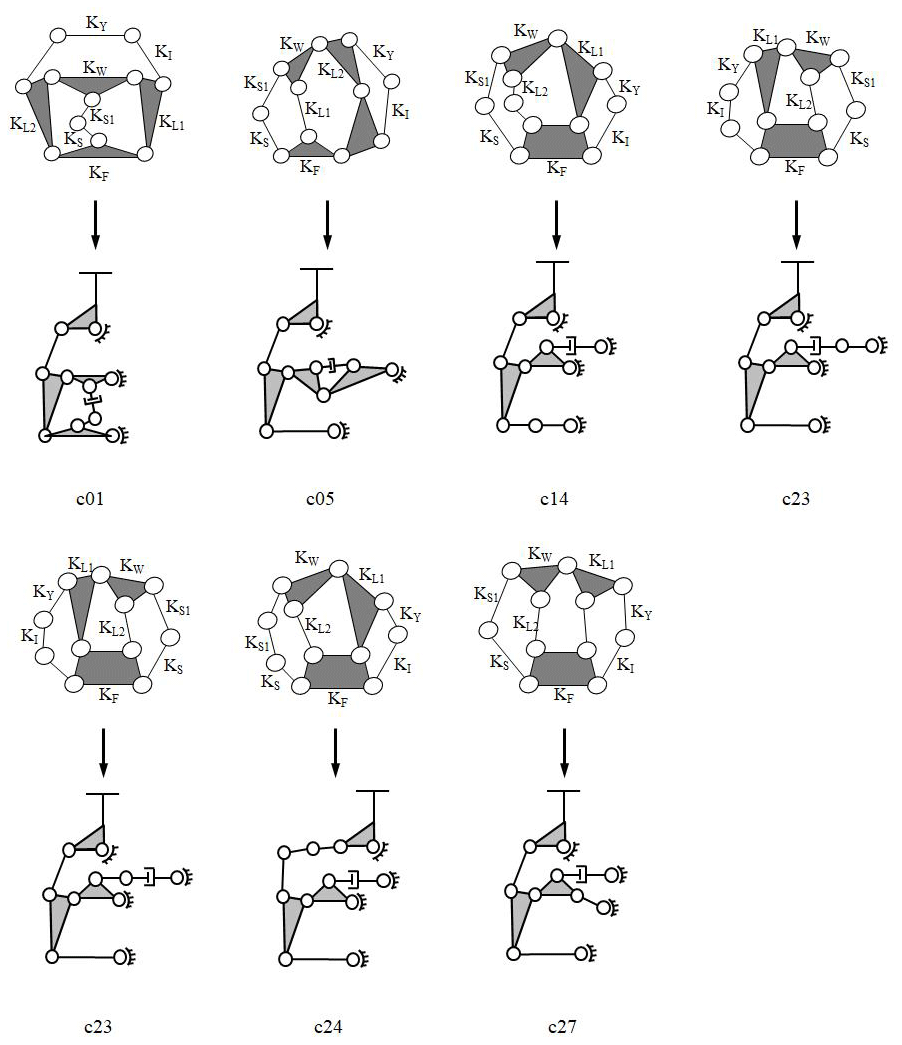
Figure 7Atlas of feasible specialized chains and the skeleton drawings of the three-wheel tilting motorcycle mechanism.
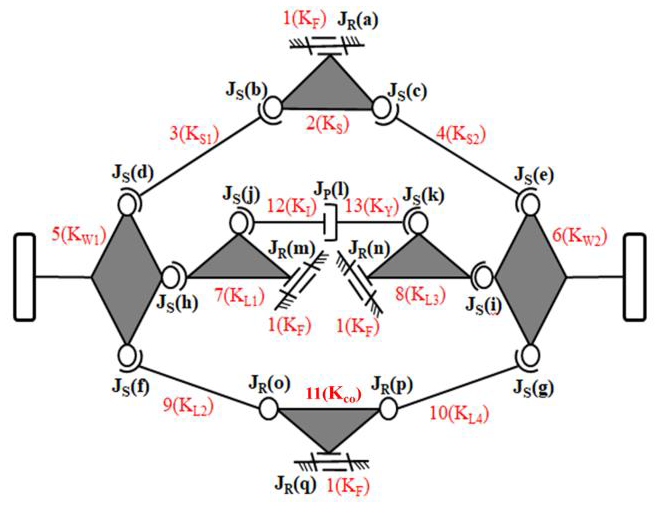
In this study, c21 in Fig. 7 is taken as a design prototype for the further design process. In the generalization process, spherical joints are reserved; therefore, when specifying the joint type of each joint, only revolute joints, sliding joints and spherical joints can be used. The degrees of freedom must be greater than 2, and the possible number of various joints is listed separately, as shown in Table 2. The number of joints is assigned to the feasible specialized kinematic chain, c21, and a new steering tilting mechanism is obtained (Fig. 8).
2.2.5 Dimensional synthesis
The new type of steering tilting mechanism is shown in Fig. 9. The dimension of the mechanism is synthesized based on the space requirements between the front two wheels and the constraint of wheel movement as shown in Fig. 10.
The new mechanism has 4 degrees of freedom: the motion of the tie rod, the bounce of the left and right wheels respectively, and the co-link between the left and right lower control arms, which can be rotated as shown in Fig. 9. When transferring the new design from being one-sided into the whole vehicle, both sides of the mechanism share a co-link, which results in a reduction of links and joints. Observing the influence of the excess degrees of freedom from the motion of the mechanism through computer-aided engineering (CAE), it is found that the motion is stable under normal driving conditions, which means that the motion can keep along on the route we set without uncontrollable wobbling or capsizing. However, if the height difference between the tires is too large, the rotation angle of the co-link will cause inappropriate mechanism motion. Therefore a motion constraint of the co-link is applied to ensure that it operates under a safe angle.

2.3 Tie rod geometry
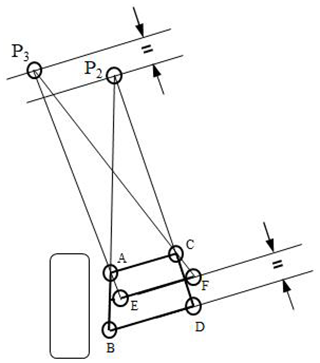
The steering mechanism of this study is similar to that of a general four-wheel vehicle. A tie rod is used to connect the link of the steering handle and knuckle. As the vehicle turns, the steering handle is turned, which drives the tie rod to push the knuckle outward and steers the wheels. Although a three-wheel tilting motorcycle has a greater motion span than a four-wheel vehicle, the wheels can still be pulled up and down by the tie rod, resulting in excessive changes in toe angle if the mechanism geometry is different from the instantaneous center position of the control arm. In this study, the tie rod of the vehicle is parallel to the control arm, and its instant center position relationship is shown in Fig. 11. At the moment of movement, the instant center of the upper and lower control arms and the tie rod are located in the correct position, and the change of the toe angle will be reduced, which may improve the stability.
2.4 Steering design
The steering system of this study is different from 1F1R motorcycles. For a 1F1R motorcycle, wheels steer when the steering handle is turned. For a 2F1R (two front wheels and one rear wheel) motorcycle, the tie rod drives the knuckle to change wheel direction. The objective for designing the steering system is to reduce the turning radius and to fulfill steering geometry for reducing the steering torque for a better handling feel.
A steering quadrilateral is used to understand the impact of design parameters on the steering system. Figure 12 shows the top view of the steering system and the parameter definition. By moving the position of the tie rod outer hardpoint in simulation software, the steering angle of the tire can be measured as shown in Fig. 13.
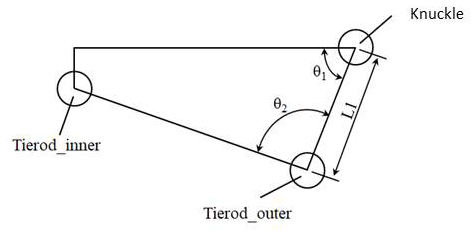
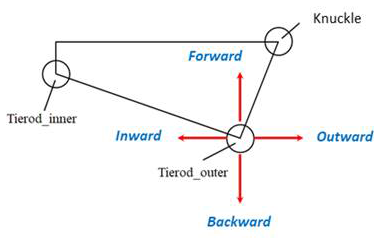
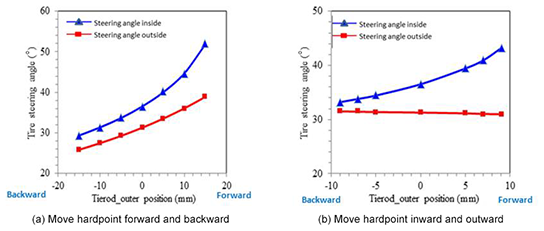
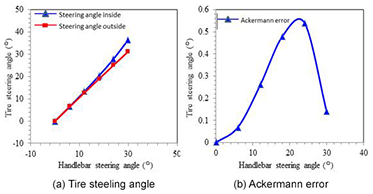
As shown in Fig. 14, moving the hardpoint of the tie rod outer forward or backward changes the length of the steering knuckle arm L1. When the hardpoint of the tie rod outer moves forwards, L1 is shortened, and the wheel steering angle is increased, especially the inner wheel. And the position of the tie rod outer hardpoint is inward or outward, which has a great effect on θ1 and θ2. From the results, the change of hardpoint has a greater effect on the steering angle of the inner wheel relative to the outer. The simulation of the steering design is shown in Fig. 15, and the error of wheel steering angle and Ackermann steering geometry are within the design requirements.
2.5 Suspension spring
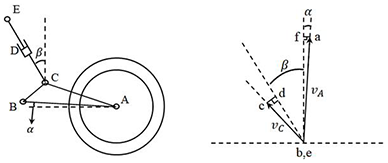
The main function of the suspension system is to help the wheels move along the road, reduce the vibration of the body and provide sufficient grip of the wheels. To meet the requirements for different types of vehicle, the stiffness of suspension varies for different road conditions. The relationship between spring force and deformation is shown in Eq. (2). The required wheel stroke and sprung mass frequency are designed for spring stiffness. The velocity ratio, also known as the leverage ratio, is defined as the ratio between the wheel speed perpendicular to the road surface and the compression speed of the spring (Reimpell et al., 2001), as shown in Eq. (3), which is also varied and related to the motion of the wheel and the spring. The bounce of the wheel and the spring compression are shown in Fig. 16. The front and rear suspension velocity ratios are 1.165 and 2.447 respectively, and these values are used as the design base of the suspension stiffness.
where Fs is the spring force, kS is the spring stiffness and x is the spring deformation.
where vwh is the speed of the wheel perpendicular to the road surface, vs is the spring compression speed, δwh is the displacement of the wheel perpendicular to the road surface and δs is the spring compression.
2.5.1 Calculation of spring stiffness based on wheel stroke
The front suspension is necessary to keep the toe angle as small as possible to maintain stable and straight forward riding experiences. If the front toe angle movement is kept less than 0.5∘, the maximum stroke is 30 mm. The stroke of the rear suspension is set at 100 mm according to the standard of commercially available street vehicles.
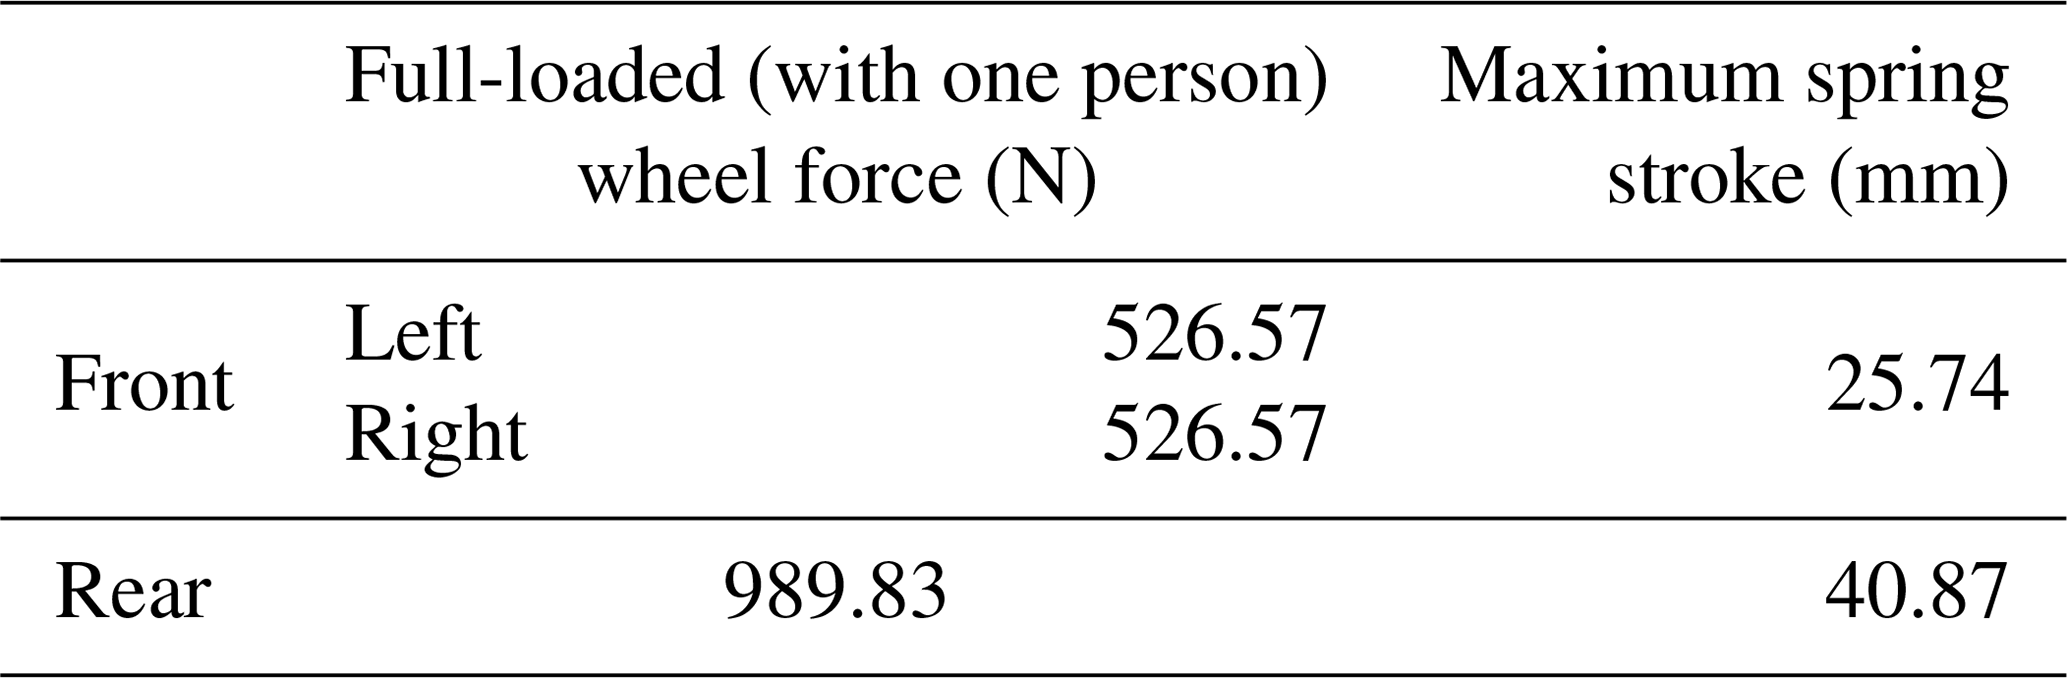
From the velocity ratio, the maximum compression of the spring under the maximum stroke of the wheel and the full-loaded force on the wheel is as shown in Table 3. The required stiffness of the spring is then calculated based on the compression of the stroke and the force.
The stiffness of the rear suspension spring is
The stiffness of the front suspension spring is
2.5.2 Calculation of spring stiffness based on sprung mass frequency
The frequency of sprung mass is usually between 1 and 2 Hz, which is considered the most comfortable settings (Foale, 2006). The sprung mass is calculated to be fully loaded on the front and rear wheels at the position of the center of gravity (Table 4). Sprung mass frequencies of 1 and 2 Hz are taken to calculate the range of suspension stiffness and are converted into the spring stiffness range. The required spring stiffness in the frequency range is shown in Table 5.
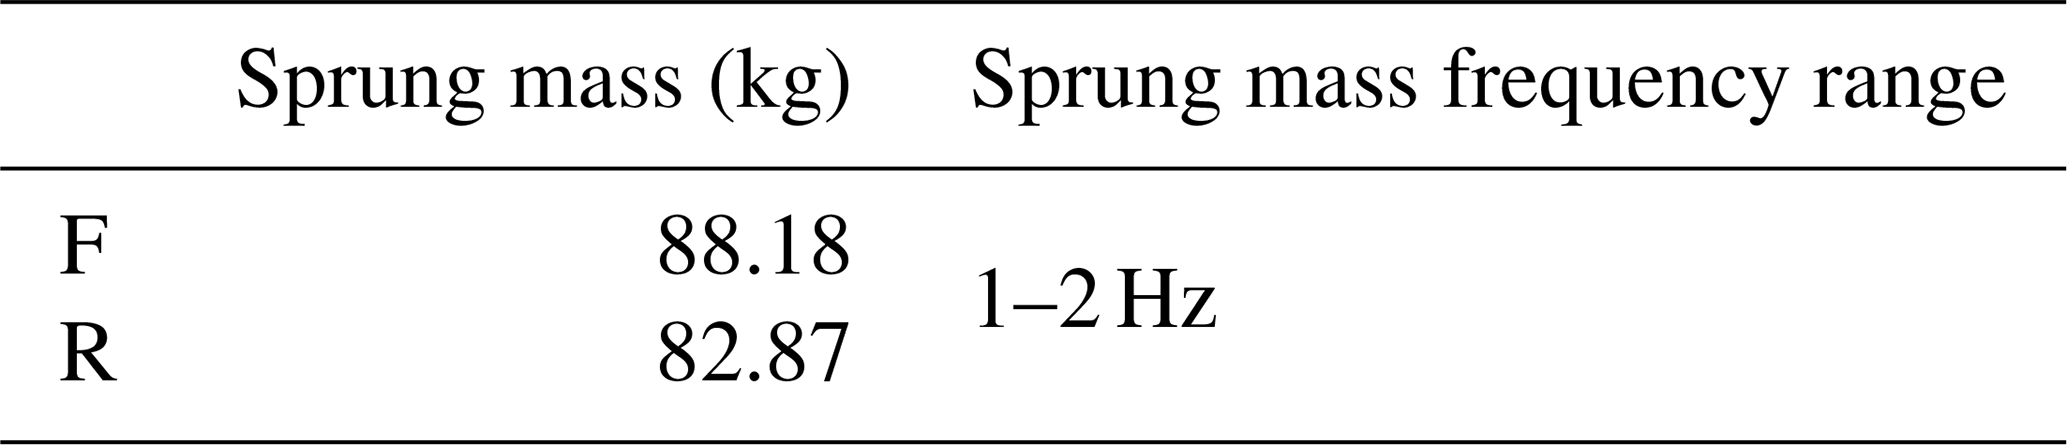
The sprung mass frequency is calculated as follows:
where f is the frequency (Hz), k is the suspension stiffness (N m−1) and m is the sprung mass (kg).
Table 5Conversion of suspension stiffness to spring stiffness.
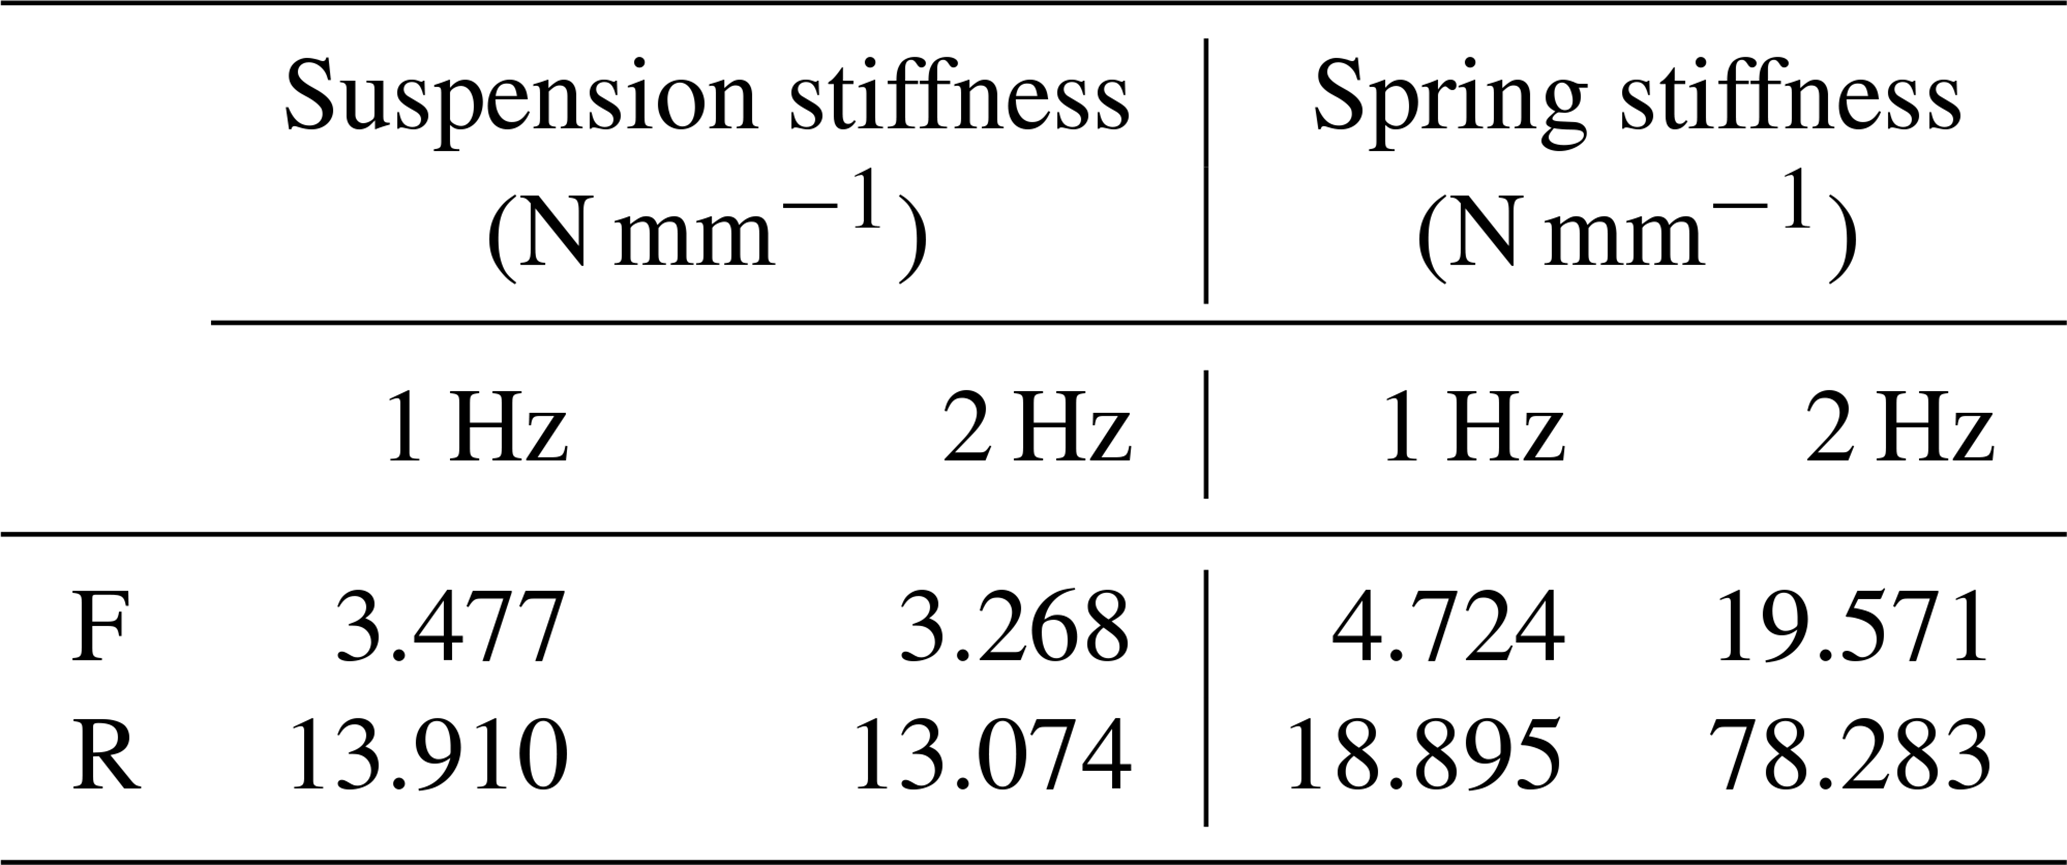
From the result, the spring stiffness calculated by the wheel stroke of the rear suspension falls in the middle of the spring stiffness range calculated by the sprung mass frequency, so the spring stiffness of the rear suspension is selected as 59.27 N mm−1. The spring stiffness of the front suspension calculated from the wheel stroke is 3.7 Hz, which would be relatively uncomfortable for riding. According to the wheel stroke target set previously, the spring stiffness calculated by the sprung mass frequency is too low, which may cause a large change in wheel stroke, resulting in an unstable moving vehicle. Therefore, the spring stiffness is selected as 47.69 N mm−1.
2.6 Simulation of handling test
The simulation software, Simpack, used model predictive control (MPC) to build the vehicle model with the input of the vehicle geometries and parameters. The performances of the reference vehicle and research vehicle are compared by handling test on the four routes as shown in Fig. 17. The key parameter to be compared is the torque applied on the steering handle, but the interference of each part and the differences of steering functionality are further studied. The simulation result is shown in Fig. 18.

The steering characteristics of the research vehicle are different from those of the reference vehicle on the steady circle. The comparison of the two vehicles on the steady circle cannot simply be based on the steering torque. Unlike the steady circle, the simulation results of slalom, lane changing and obstacle avoidance are the result of transient analysis. The steering torque is the sum of the maximum torque when the vehicle turns right or left on the simulation routes. The results of both vehicles show that the steering torque increases with speed. However, there are no big differences on the steering torque of both vehicles at low speed, but the research vehicle needs more steering toque when speed increases.
From the simulation, the research vehicle requires too much steering torque during turns, which makes it difficult for riders to steer. To improve this, steering mechanism optimization is applied to reduce the required steering torque and improve the controllability of the research vehicle.

Taguchi method is used to analyze the optimization of the steering mechanism of the newly designed 2F1R tilting motorcycle. Since it has been verified that the simulations are consistent with the actual measurement results, the experiment using the Taguchi method is replaced with the optimization of the parameters followed by dynamic simulation.
3.1 First-stage Taguchi experiment
The main objective is to reduce the steering torque of the research vehicle while fulfilling the requirements of steering design. The quality characteristics are the steering torque and the turning radius. The main factors are signal factors, control factors and noise factors: signal factors simulate the lane changing; noise factors are unavoidable factors such as environment. Quality characteristic samples are collected from simulations assuming no noise factors. Control factors are set at different levels (Table 6) via the effect of geometric parameters on quality characteristics.

The first-stage Taguchi test is shown in Table 7. A total of 16 run trails are set with different combinations of control factors to reduce the steering torque required when steering. The best combination also needs to fulfill the requirements of the steering design; therefore, the turning radius is listed in the last column in Table 7 for comparison. The result shows that the better the quality characteristics fulfill the requirements of the study, the larger the steering torque as quality characteristics Y.
The signal-to-noise (SN) ratio (Table 8) is then calculated by the “smaller-the-better” method with the quality characteristics Y obtained previously. The best control factor combination is then simulated, which results in the steering torque at 61.87 N m and the turning radius at 513.2 cm. Though this combination significantly reduces the steering torque, the turning radius does not meet the requirement of the steering design. So it cannot be considered the best optimized result. Two combinations with lower steering torque and turning radius are selected from Table 7 for the second-stage Taguchi experiment.
Table 7First-stage Taguchi experiment. The combinations in bold font meet the requirements of reducing the steering radius and steering torque as much as possible. MSD represents mean square deviation, and SN represents the signal-to-noise ratio.

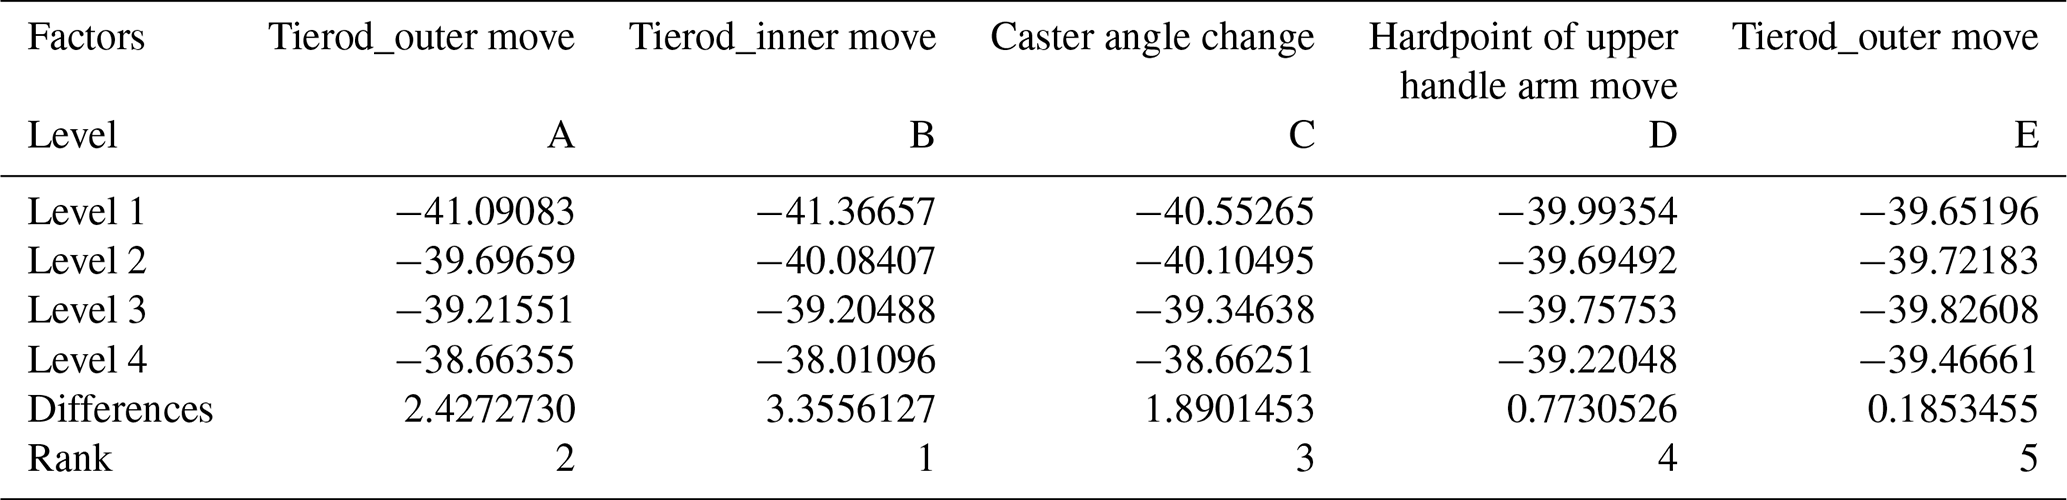
3.2 Second-stage Taguchi experiment
The combinations selected from Table 7 are A1B4C4D4E4 and A2B2C1D4E3 for second-stage Taguchi experiment. Based on the influence of each factor's level on the quality characteristics from the first-stage Taguchi experiment, new control factor levels are set for the two parameter combinations, as shown in Tables 9 and 10. Steering torque and turning radius are set as quality characteristics and undergo the Taguchi experiment separately to obtain the best optimized steering mechanism design.
Table 11 shows the SN ratio of the first parameter combination with steering torque as quality characteristics. Though the quality characteristics from the best optimized combination meet the requirements (the steering torque is 70.79 N m, and the turning radius is 363 cm), it does not fulfill the objectives of the study.
Table 9The first parameter combination of the control factor level.
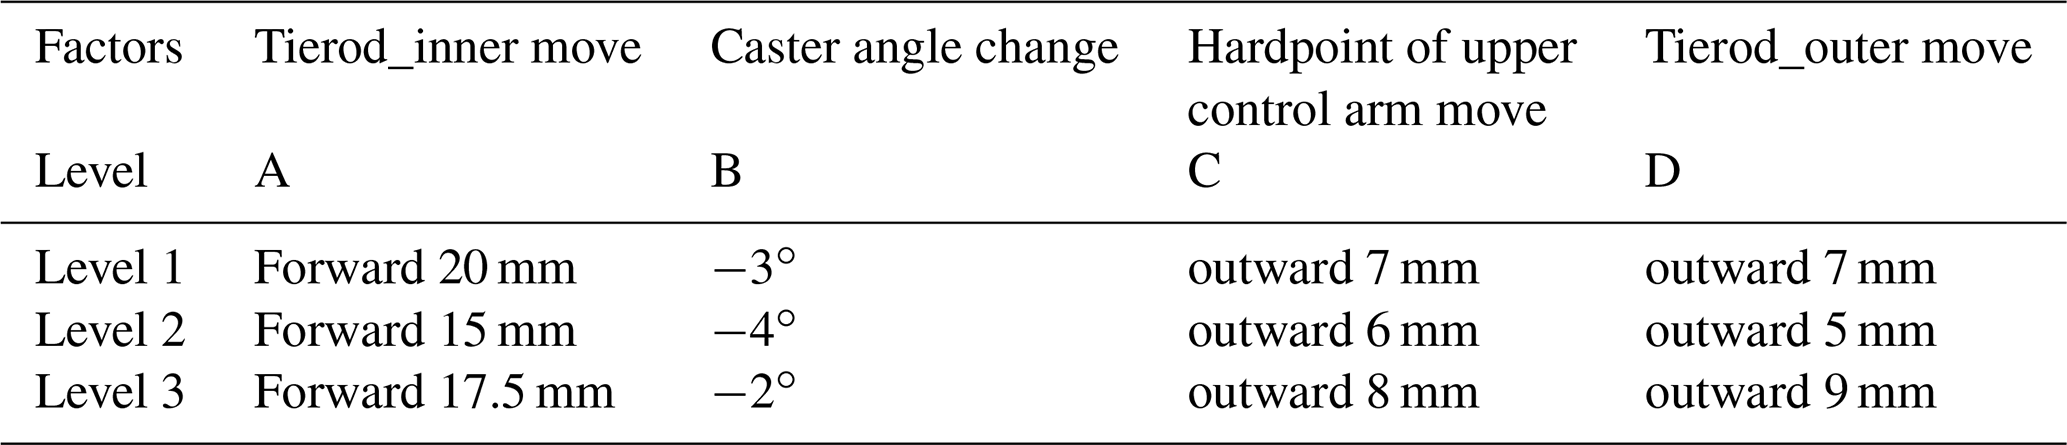
Table 10The second parameter combination of the control factor level.
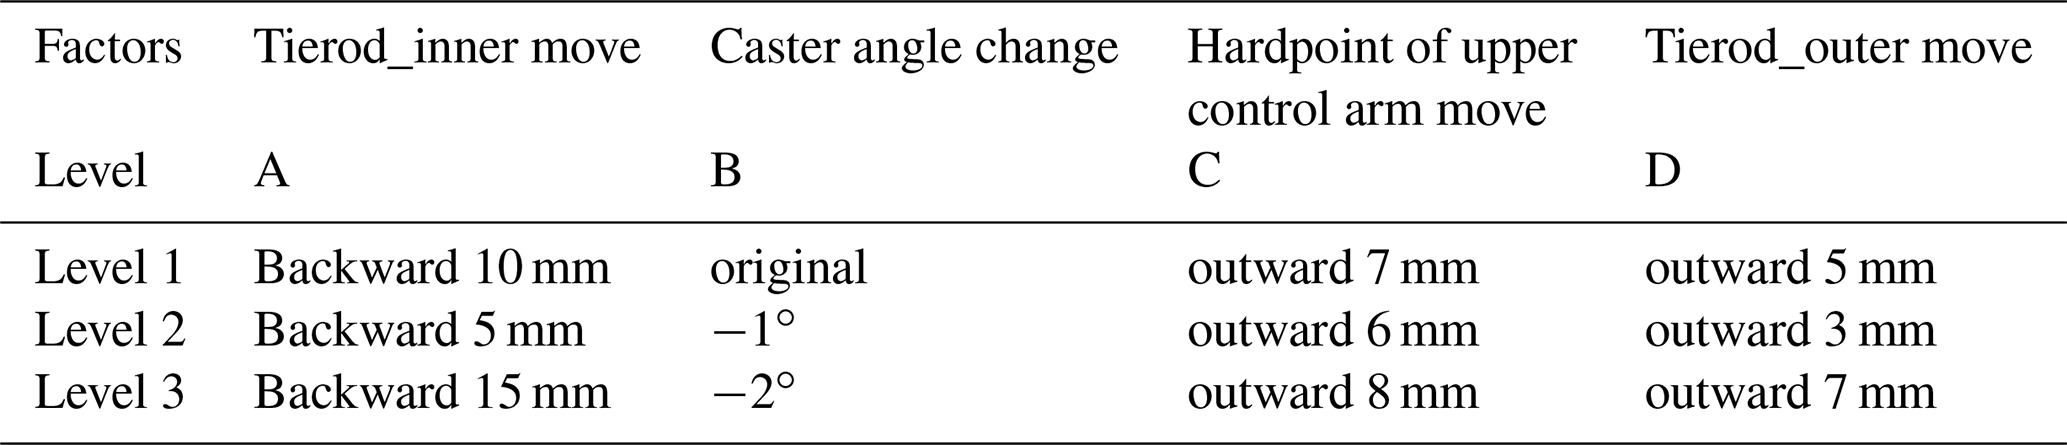
Table 11SN ratio of the first parameter combination for the Taguchi experiment (steering torque).
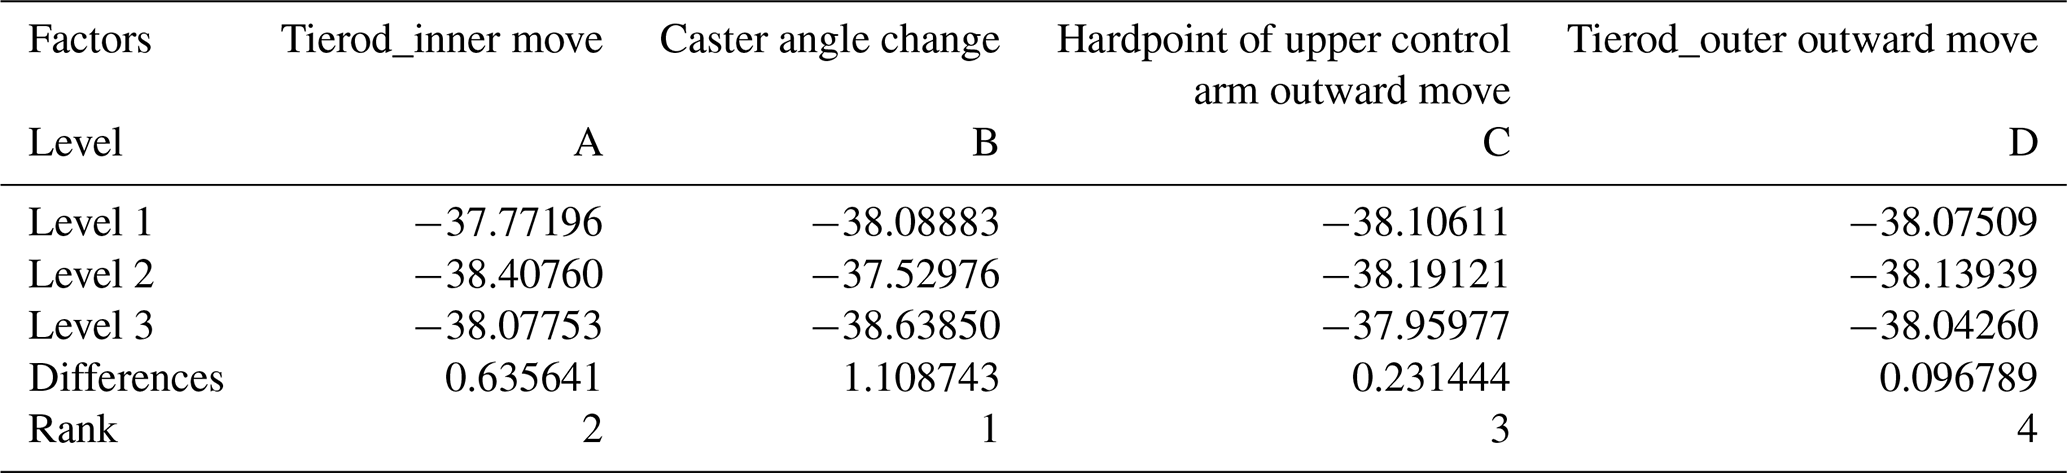
Table 12SN ratio of first parameter combination for the Taguchi experiment (turning radius).
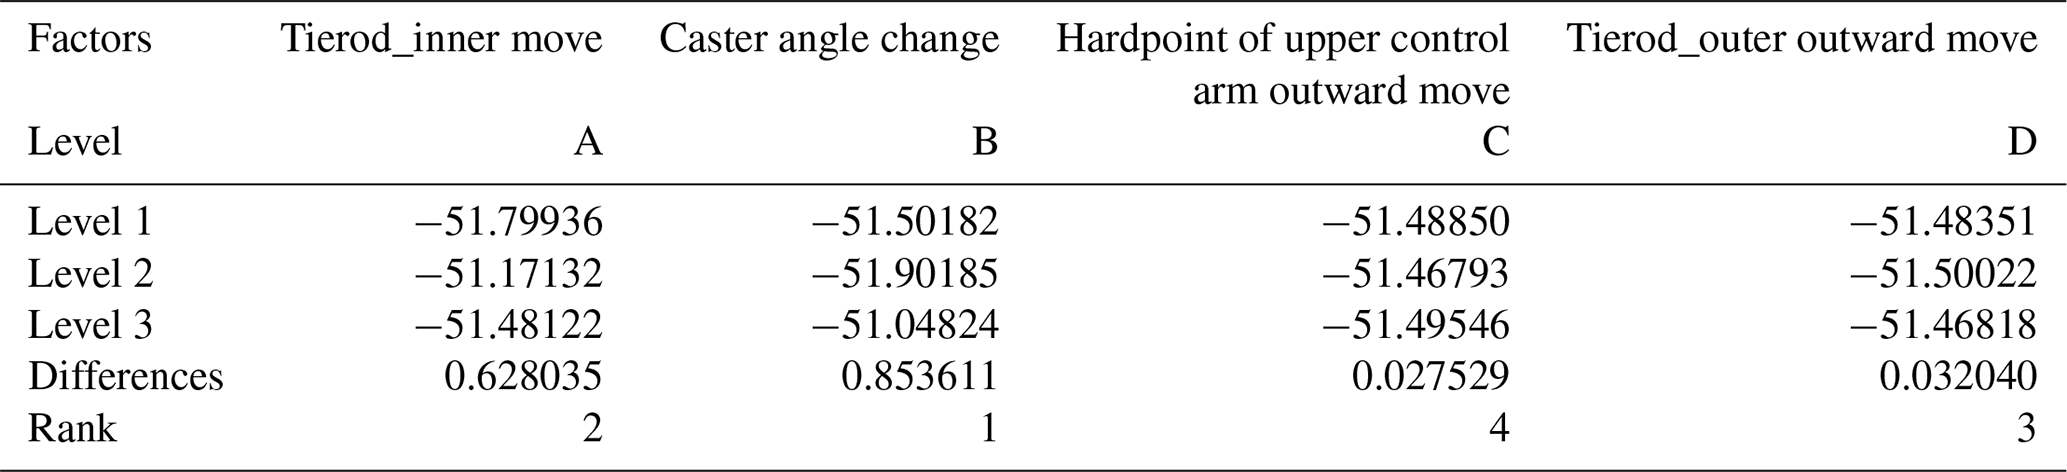
Table 12 shows the SN ratio of the first parameter combination with turning radius as quality characteristics. Compared to the data in Table 11, the impact of the control factor level on the quality characteristics is opposite. When the SN ratio of the steering torque is the smallest, the SN ratio of the turning radius is the largest. It means that the two quality characteristics cannot be both optimized at the same time. So, the steering torque was chosen as the optimized design goal. The optimization analysis must focus on the target steering design of the study; 92.37 N m for steering torque and 343 cm for turning radius are the simulation results of the optimized combination, which do not meet the objectives of the study. Therefore, the result cannot be considered the best optimized.
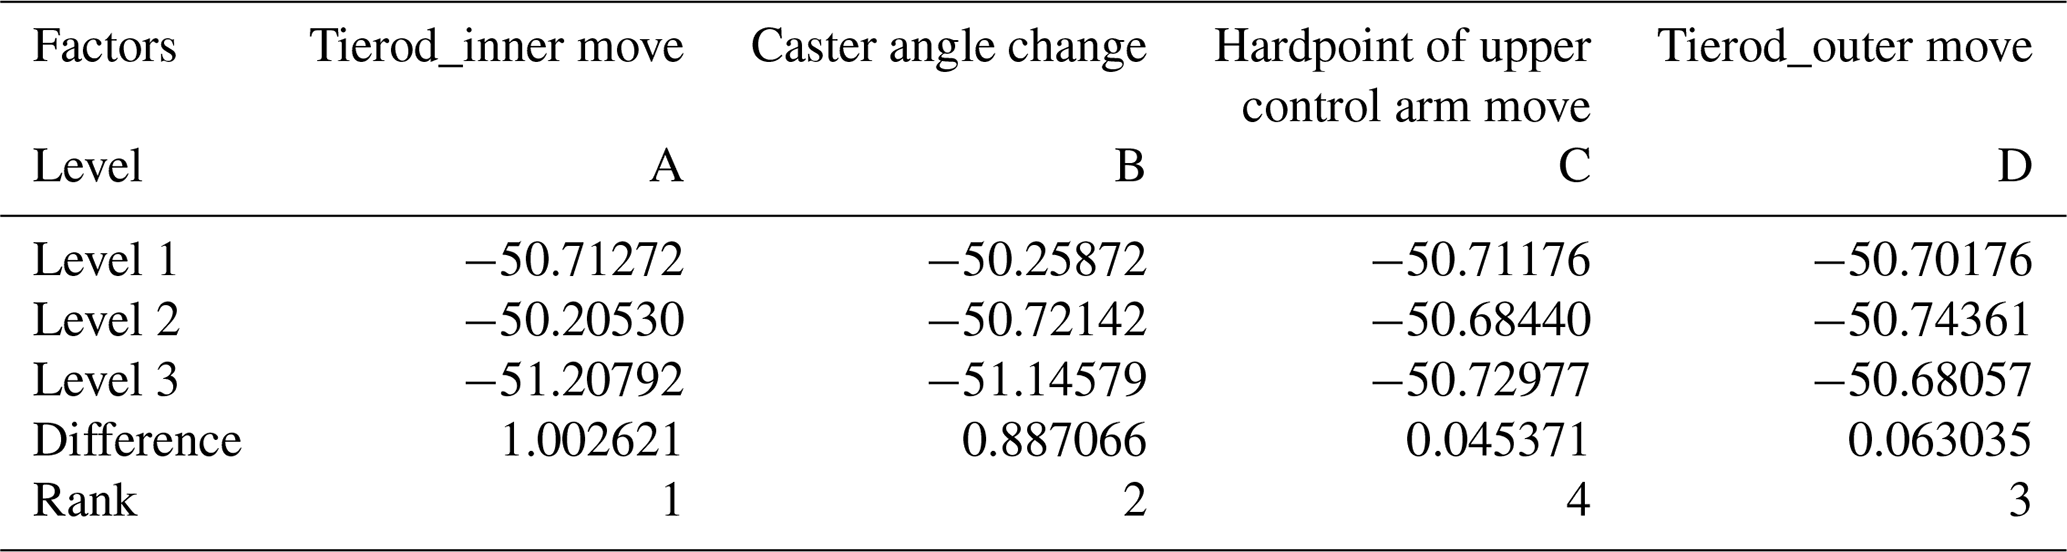
Table 13 shows the SN ratio of the second parameter combination with steering torque as quality characteristics; 91.49 N m for steering torque and 336 cm for turning radius are the simulation results from the optimized combination. The turning radius still does not meet the target of the study; therefore, the result cannot be considered the best optimized analysis.
Table 13SN ratio of the second parameter combination for the Taguchi experiment (steering torque).

Table 14 shows the SN ratio of the second parameter combination with turning radius as quality characteristics; 116.6 N m for steering torque and 305.6 cm for turning radius are the simulation results from the optimized combination. The steering torque is reduced by 42 N m, which meets the target of quality characteristics. The turning radius is increased from 255 to 305.6 cm. From previous experiments, the turning radius increases with a decrease in the steering torque because the SN ratio shows these two quality characteristics are inversely proportional. Though the turning radius from this best optimized parameter combination is larger than the original design, it is still smaller than 320 cm, which is the requirement of the steering design. This parameter combination is taken as the best optimized analysis result of the steering mechanism.
Table 14SN ratio of the second parameter combination for the Taguchi experiment (turning radius).
Four different routes are selected for the handling test. The simulation results of two vehicle models, pre- and post-optimization, are compared with the reference vehicle in order to study the differences between pre- and post-optimization models and potential advantages.
4.1 Simulation on the steady circle
The result shows the trend of different steering torque on the research vehicles and the reference vehicle. The steering torque of the optimized research vehicle is always positive. Different steering characteristics are shown on the pre- and post-optimized vehicles when the speed is faster than 35 km h−1, as shown in Fig. 19. The steering torque on the optimized research vehicle reduces at speeds between 25 and 30 km h−1 compared to the reference vehicle.

The roll index, Eq. (5), and acceleration index, Eq. (6), are used for evaluating the state of the steady circle, and the result of the study is shown in Fig. 20.
where τ is the steering torque, and φ is the lateral roll angle.
where τ is the steering torque, V is the vehicle speed and RC is the radius of the steady circle.
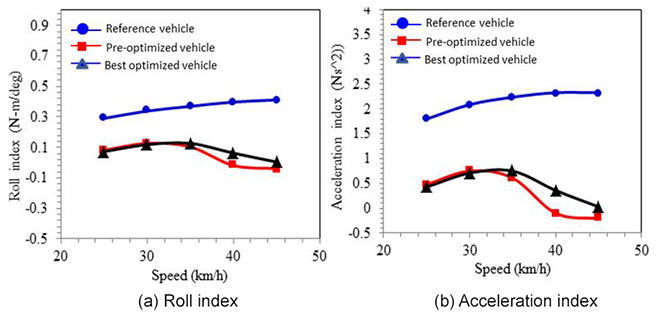
The roll index is defined as the ratio between the steering torque and the lateral roll angle. The lateral roll angle does not change much based on the result of various simulation models. The lateral acceleration is set to be a constant for the acceleration index. Therefore, the trends of both indexes are influenced by steering torque. The bigger the indexes are, the more steering torque is needed. The result shows that both pre- and post-optimized research vehicles have an index close to zero, smaller than the reference vehicle. In reality, the torque opposite to the steering direction is required for most 1F1R motorcycles when turning. The torque is at the same direction as the steering direction when the speed increases. The reference vehicles and the research vehicle show different behavior than the 1F1R wheel motorcycle. The tire side slip angle can explain the cause for the differences.
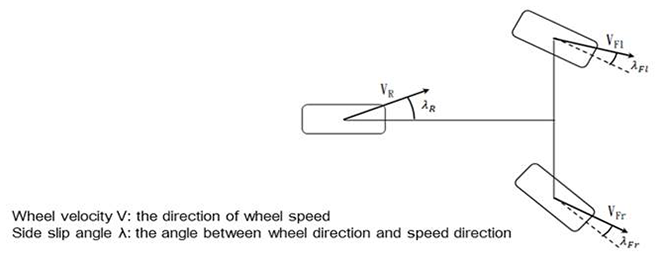
The side slip angle of front and rear tires have impact on the steering characters (Fig. 21). The steering ratio can explain the differences (Eq. 7). When the steering ratio is less than 1, called under-steering, the actual turning radius is larger than the ideal turning radius, which causes riders to increase the steering angle, consequentially increasing the lateral force on the front tire, which leads to the tires sliding laterally. When the steering ratio is equal to 1, called neutral steering, the actual turning radius is equal to the ideal turning radius. Riders do not have to apply any torque to steer. When steering ratio is larger than 1, called oversteering, the actual turning radius is smaller than the ideal radius. Riders have to apply a torque opposite to the turning direction on steering handle to stabilize the motorcycle. The roll angle of the motorcycle is then reduced, which prevents the rear tire from sliding. In general, neutral steering and moderate oversteering are better for motorcycles, which are different from cars.
where λR is the rear tire lateral slip angle, λF is the front tire lateral slip angle Δ is the tire steering angle.

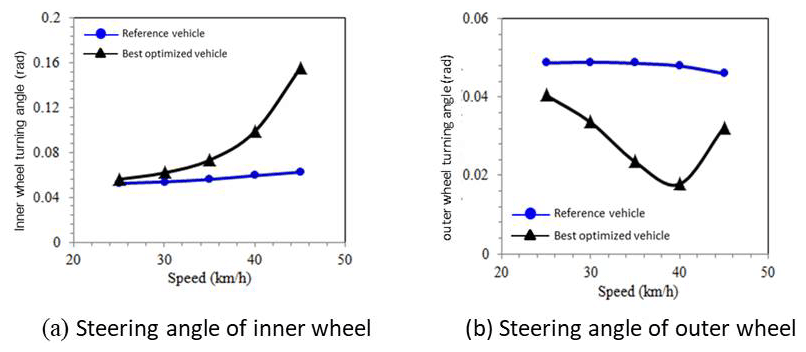
Let us look at the steering ratio of the inner and outer wheel separately during steering as shown in Fig. 22. When the steering ratios of inner and outer wheels of the reference vehicle are less than 1, it is called under-steering. The steering ratio reduces when the speed increases. When the reference vehicle runs on the steady circle, it requires more positive steering torque as the speed increases. As for the best optimized research vehicle, the trends of inner and outer wheels are different. The inner wheel shows under-steering, which becomes more obvious as speed increases. The outer wheel shows oversteering. The simulated wheel steering angles are shown in Fig. 23. The result shows that the steering angle of the inner wheel is larger than the outer wheel during steering, which corresponds to the simulation result of the steering ratio and the outcome of the steering design. From the explanation above, the steering characteristics of the best optimized research vehicle can be inferred from the steering torque simulation: the steering torque is close to zero and will elevate moderately with speed then drop back to close to zero. It is considered to be a neutral steering motorcycle with slight under-steering.
4.2 Simulation of slalom
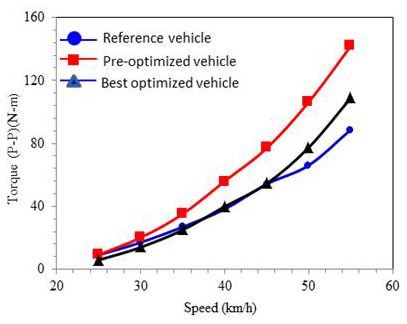
Based on the analysis of the best steering mechanism, the steering torque of the research vehicles is reduced, and the steering torque is even lower than the reference vehicle at low speed, as shown in Fig. 24.
The roll transfer function and time lag between the steering torque and the roll angle are the two evaluation indexes for slalom. The two indexes are calculated by Eq. (8) with the simulation result of the study as shown in Fig. 25.
where φ is the roll angle, τ is the steering torque and f is the frequency of cone spacing.
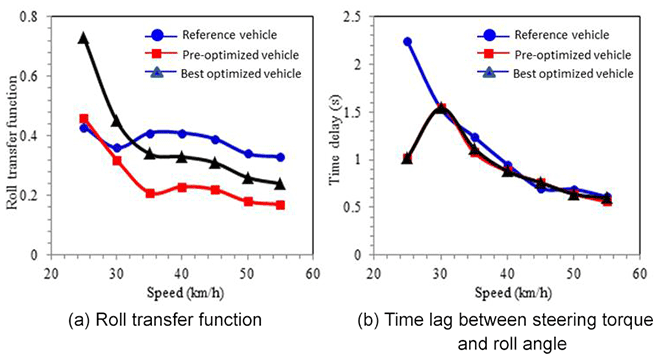
The larger the roll transfer function, the smaller the steering torque required to reach corresponding roll angle, which does not change a lot for different simulated models. The best optimized research vehicle has higher roll transfer function than the reference vehicle due to lower steering torque at low speed. As the speed increases, the steering torque of the best optimized research vehicle is larger than that of the reference vehicle. The roll transfer function of the best optimized vehicle is lower than that of reference vehicle but still higher than the pre-optimized research vehicle. This shows that the optimization of the steering mechanism still effectively reduces the steering torque of the research vehicle. The time lag of the research vehicles at low speed is shorter than that of the reference vehicle. A shorter time is needed between the steering torque input and the roll angle output, which is a good response. In summary, there is no significant difference on response performance after the optimization of the research vehicle, but the roll transfer function is effectively improved, which improves the controllability of the vehicle with lower steering torque required.

4.3 Simulation of lane change
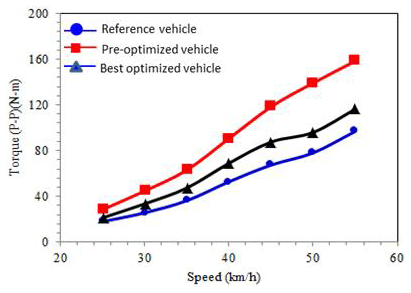
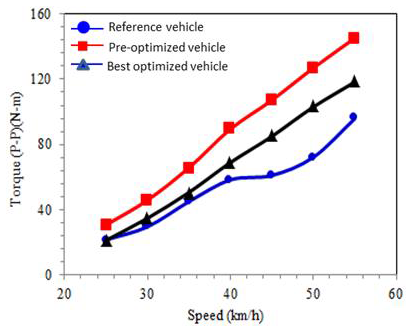
The simulation shows that the steering torque of the best optimized vehicle is reduced effectively, which meets the target of the quality characteristics as in Fig. 26. The lane change roll index is the route evaluation index calculated by Eq. (9), with the simulated result shown in Fig. 27.
where τp-p is the steering torque peak–peak value, is the roll angle peak–peak value and Vavg is the speed of vehicle.
The lane change roll index is defined as the vehicle's speed of response when riders apply the steering torque. The smaller the lane change roll index is, the smaller steering torque needed to attain the roll angle speed for changing lanes. The response of the motorcycle is faster. The lane change roll index of reference vehicles decreases when the speed increases, which means the faster the vehicle, the more responsive the vehicle. Though both pre- and post-optimized vehicles show that the lane change roll indexes increase with the speed increase, the lane change roll index of the post-optimized research vehicle is reduced significantly compared with the pre-optimized vehicle. The steering characteristics of the post-optimized research vehicle are more sensitive.
4.4 Simulation of obstacle avoidance
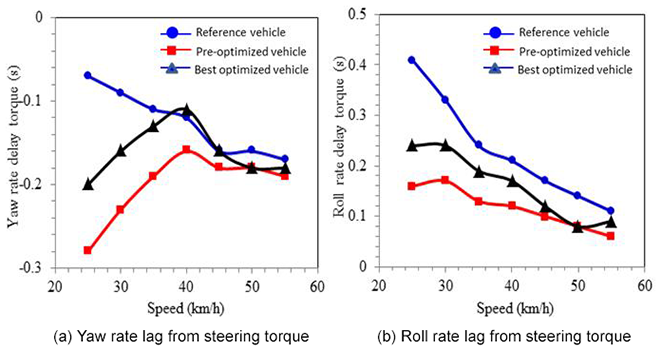
The simulated shows that the steering torque of the best optimized research vehicle is reduced effectively which meets the target of the quality characteristics as in Fig. 28. Yaw rate delay and roll rate delay from the steering torque are the obstacle avoidance route evaluation indexes as shown in Fig. 29.
The obstacle avoidance is used to test motorcycles' reaction capability. The required steering characteristics are instant surge of roll rate and yaw rate after applying steering torque. The shorter the time required from the steering torque input to full roll rate and full yaw rate, the better the motorcycles' reaction capability. If the lag is negative, the roll rate and the yaw rate reach the maximum values before applying steering torque and vice versa. In theory, the steering torque is input, and the roll speed and the yaw speed are outputs, which happen after input. However, when 1F1R motorcycle enters a turn, a counter-steering technique is applied. The steering handle is steered opposite to the turning direction, so the vehicle has centrifugal force to roll toward the turning direction. The steering handle is then steered to the turning direction for balance. The vehicle would tilt opposite to the turning direction with the counter-steering, which would cause imbalance of the motorcycle. The counter-steering is automatically considered in the yaw rate simulation, so it reaches its full speed before steering torque. The best optimized research vehicle has a larger delay than the pre-optimized vehicle for both the yaw rate and roll rate. The optimization has reduced the steering torque but worsened the reaction capability. The reference vehicle has a larger delay than both research vehicles.
-
The study only realizes one of the kinematic chains, c21, from the category of dimensional synthesis; other researchers can continue with the dimensional synthesis for other kinetic chains to produce a more feasible steering tilting mechanism for three-wheel tilting motorcycles.
-
The final degrees of freedom of the new steering tilting mechanism are 4. The simulation shows that the mechanism can function normally. It is necessary to constrain the rotation of the connecting link to limit extra degrees of freedom.
-
When the hardpoint of tie rod outer which connects the tie rod and steering knuckle changes in the steering system, moving the tie rod outer hardpoint forward or backward has an impact on the tire steering angle. The maximum tire steering angle increases if the tie rod outer hardpoint is moved forward. The larger the tire steering angle is, the smaller the turning radius will be. Moving the tie rod outer hardpoint inward and outward has an impact on the steering angle of the inner tire but not for the outer tire. Based on the relationship between the tie rod outer hardpoint and the tire angle, a steering system is designed which has reduced the turning radius and fulfills Ackermann geometry.
-
From the two-stage Taguchi experiments, the steering torque and the turning radius are found not to be best optimized at the same time. When the steering torque decreases, the turning radius increases. Therefore, the reduction of steering torque can be attained using a set of parameter combinations that meet the requirement of turning radius. The final optimized design fulfills the requirement of the turning radius and reduces the steering torque, which effectively improves the controllability of the vehicle.
-
The required stiffness of the spring for suspension design is calculated from the stroke of wheel and the frequency of sprung mass. Eventually, the stiffness of the spring calculated from wheel stroke is selected. When the stiffness of front suspension from the wheel stroke is selected, the translated spring frequency does not fall into the desired range. Large wheel stroke causes vehicles to be instable, and a limitation of the wheel stroke is required as safety is the first priority when choosing the stiffness of the front suspension system. The spring stiffness of the back suspension calculated from the sprung mass frequency falls into the desired range to provide preferred riding comfort.
-
The characteristics of the vehicle can be reflected via the evaluation indexes of the routes, such as reaction of the vehicle and controllability. The different routes provide different evaluations for the vehicles. Smaller required torque on the obstacles avoidance route shows good controllability but does not mean a good reaction capability of the vehicle. A vehicle should be designed based on overall performance targets, instead of a single objective. The best steering characteristics cannot be optimized with one single objective.
Data can be made available upon request.
MYC, HHH and ZLC conceived the presented idea. ZLC performed the CAE. MYC and HHH verified the analytical methods and supervised the findings of this work. All authors discussed the results and contributed to the final article. All authors have read and agreed to the published version of the article.
The contact author has declared that neither they nor their co-authors have any competing interests.
Publisher's note: Copernicus Publications remains neutral with regard to jurisdictional claims in published maps and institutional affiliations.
This research has been supported by the Ministry of Science and Technology of Taiwan (grant no. MOST 110-2221-E-020-021).
This paper was edited by Dario Richiedei and reviewed by two anonymous referees.
Bartolozzi, R., Frendo, F., Guiggiani, M., and Di Tanna, O.: Comparison between Experimental and Numerical Handling Tests for a Three Wheeled Motorcycle, SAE Int. J. Engines, 1, 1389–1395, 2009.
Cossalter, V., Da Lio, M., Biral, F., and Fabbri, L.: Evaluation of Motorcycle Maneuverability with the Optimal Maneuver Method, SAE Technical Paper, No. 983022, 1998.
Foale, T.: Motorcycle Handling and Chassis Design: The Art and Science, Tony Foale Designs, Spain, 2006.
Frank, T., Fowler, G., Garman, C., and Sharpe, S.: Motorcycle Rider Inputs During Typical Maneuvers, SAE Technical Paper, No. 2020-01-1000, 2020.
Gani, M., Limebeer, D., and Sharp, R.: Multi-Body Simulation Software in the Analysis of Motorcycle Dynamics, IFAC P., 30, 227–232, 1997.
Ghosh, S. and Anthony Samy, B.: The Influence of Motorcycle Usage Pattern on its Stability and Response in Dynamic Condition, SAE Technical Paper 2014-01-0126, https://doi.org/10.4271/2014-01-0126, 2014.
Li, H. H.: Taguchi Method: Principles and Practices of Quality Design, Gao Li Book Co., Ltd., Taipei, 2000.
Mangaraju, K., Ghosh, S., Anand, R., and Babu, R.: Vehicle Handling Comparison of Motorcycles and Bebek Vehicles, SAE Technical Paper, No. 2007-32-0109, 2007.
Pradeepak, R., Bhambri, M., and Rahman, S.: A Parametric Multi Body Approach to Find the Key Elements Influencing the Steering Torque Applied by Rider on a Motorcycle, SAE Technical Paper, No. 2015-01-0641, 2015.
Reimpell, J., Stoll, H., and Betzler, J. W.: The Automotive Chassis: Engineering Principles, Society of Automotive Engineers, 2001.
Sponziello, A., Frendo, F., and Guiggiani, M.: Stability Analysis of a Three-Wheeled Motorcycle, SAE Int. J. Engines, 1, 1396–1401, 2009.
Yan, H. S.: Creative design of mechanical device, Donghua, Taiwan, 1998.