the Creative Commons Attribution 4.0 License.
the Creative Commons Attribution 4.0 License.
 | 18 Oct 2021
Influence of geometric attributes on friction coefficient in sheet metal stamping
Dewang Zhao
Kunmin Zhao
Huaihao Song
Daxin Ren
Ying Chang
This paper presents a test device to explore the influence of geometric attributes of the contact surface on a friction coefficient along with sliding speed and contact pressure. Friction tests were conducted on a third-generation high-strength steel QP980. The friction coefficients for different surface curvatures, contact pressures, and sliding speeds were calculated, and the influences of these factors were analyzed. The formula for calculating the friction coefficients between curved contact surfaces was derived. The relationship between bending-induced surface roughness increase and friction coefficient was established. An enhanced friction coefficient model with pressure, velocity, and curvature dependence was proposed. The enhanced friction model was applied to simulate the stamping of an automotive part, and a better correlation was achieved.
- Article
(6310 KB) - Full-text XML
- BibTeX
- EndNote


Sheet metal stamping is an efficient and widely used manufacturing process in the automobile industry. Recent years have seen increasing applications of advanced high-strength steels and aluminum alloys in automobile bodies for weight reduction. The friction between sheet metal and die during the stamping process has a great impact on formability, surface quality, and die wear. The Coulomb friction model has been commonly used to describe the friction condition in numerical simulations of sheet metal stamping, which in its general form allows the friction coefficient to be defined in terms of sliding speed, contact pressure, temperature at the contact point, and other field variables. The friction coefficient is also influenced by the contact surface's shape and topography, the material's hardness, and the lubrication condition. However, in conventional stamping operations, the dies are made according to corporate or industry standards with specifications on material hardness and surface roughness, the to-be-stamped sheet metals have pre-determined surface topography, and lubrication oil is not preferred unless otherwise necessitated by severe poor formability. Therefore, this study focused on the influence of a geometric attribute of the contact surface, i.e., the surface curvature, together with two process variables, sliding speed and contact pressure, on the friction coefficient.
Evin et al. (2014) used a friction simulator (strip drawing test) that has a flat blank holder and a roller to evaluate the friction in different contact areas of bar and lubricated specimens under one drawing speed and various contact pressures. The friction coefficient on a curved contact surface (the roller) was found to be lower than the one on a flat contact surface (the blank holder) by the simple calculation method but higher by the slope method. It appears that only one size of roller was used in their study, and the roller's radius was not mentioned. Lemu et al. (2013) studied the impact of surface roughness on friction coefficient through bending under tension tests with a fixed roller of 20 mm in diameter. The force to overcome bending and unbending of the specimen over the roller was not explicitly subtracted from the pulling force when calculating the friction coefficient, although it should be. Wang et al. (2016) evaluated the pressure dependence of the friction coefficient via pin-on-disk wear tests, where a bare 0.9 mm-thick DP780 steel was used as the pin specimen and a cold-worked DC53 tool steel was machined into the circular disk specimen to prevent material plowing. The results showed a decrease in friction coefficient with an increase in normal contact pressure and a significant improvement in springback prediction using a pressure-dependent friction model. Li et al. (2018) pointed out that friction coefficient decreases with an increase in sliding speed and contact pressure. Kim et al. (2012) conducted draw-bend tests on AA5754 sheets applied with Parker lubricant to study the contact pressure and sliding speed dependencies of the friction coefficient and revealed that the friction coefficient decreases with sliding speed but increases with contact pressure, contrary to what Wang and Li had pointed out, probably because of the different lubrication conditions. The fact that surface coating and lubrication condition complicate the pressure dependence of friction coefficient has been noticed by Evin et al. (2014). Furthermore, the geometric influence of the differently sized pins on the friction coefficient was not considered by Kim et al. (2012). A one-side-contact friction test device was used by Ma et al. (2011) to measure the friction coefficients of 0.95 mm-thick SUS304L lubricated by press oil. The sliding distance was found to be an influencing factor for the friction coefficient in addition to the sliding speed. Dilmec et al. (2016) presented a test apparatus which can determine the friction coefficient for both the flange and the radius contact regions with a single experiment. The effects of die radius, surface roughness of the tools, drawing speed, blank holder force, and lubrication on the dynamic friction coefficient were investigated by using analysis of variance (ANOVA). The friction coefficient in the die radius region was found to be significantly different from the one in the flange region, e.g., 0.43 versus 0.25 for dry condition, and much less sensitive to the geometric and process parameters. The contact pressure in the die radius region, although directly related to the blank holder force, was not explicitly calculated; otherwise, a clearer relationship between the friction coefficient and the contact pressure in the curved contact region could be established. The bending and unbending force was not but should be excluded from the total punch force when calculating the friction coefficient. Trzepiecinski et al. (2015) pointed out that the directional topography of sheet metals caused by the rolling process results in diversification of the friction coefficient according to the sliding orientation to the rolling direction.
While the influence of contact pressure and sliding speed on friction coefficient has been intensively investigated, the study on the influence of the contact surface's geometric attribute in terms of curvature is limited. Evin et al. (2014), Kim et al. (2012), and Dilmec et al. (2016) reported different friction coefficients between flat surfaces and between curved surfaces but did not analyze the root cause in depth. The main purpose of this study was to investigate how the geometric attribute of the contact surface impacts the friction coefficient. To experimentally determine the friction coefficients, a universal test-machine-based mechanically driven device that can explore the influence of the geometric attribute of the contact surface on the friction coefficient along with sliding speed and contact pressure was designed and manufactured. Friction tests were conducted on a third-generation advanced high-strength steel QP980 because of its superior strength and formability and its increasing attention in the automotive industry (Chen et al., 2017). The friction coefficients between a pair of flat surfaces and three pairs of curved surfaces under three contact pressures and three sliding speeds were calculated, and the influences of these factors were analyzed. Additionally, finite-element modeling was performed to verify the theoretical formula derived for calculating the bending/unbending forces. Finally, the impact of surface curvature on friction was correlated with the change in surface roughness caused by bending based on microscopic observation and quantification.
2.1 Design of the friction device
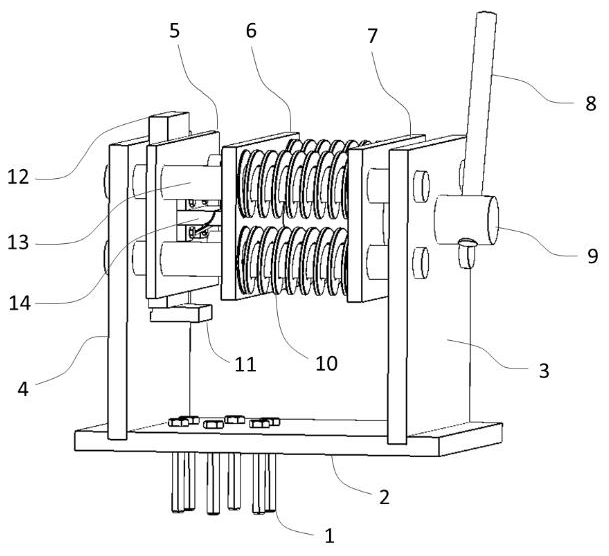
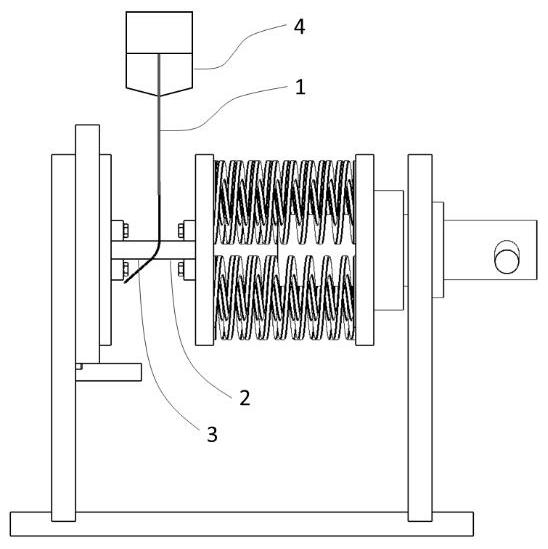
The drawing of a new friction test device is shown in Fig. 1 (front view in Fig. 2). The six bolts fix the base plate on the worktable of a universal test machine. The two vertical plates are inserted into the slots of the base plate. The guides have external threads at one end, matching the internal threads of the holes in vertical plate 3. The other end of the guides protruding from vertical plate 4 are bolted with nuts. The guides not only play a guiding role, but also help prevent the vertical plates from being deformed under screw drive loading. Three sliding plates and four springs are mounted on the guides. The springs are placed between sliding plates 6 and 7. A male die and a female die are installed on sliding plates 5 and 6, respectively. A long rectangle specimen is clamped between the male and female dies. The top end of the specimen is pulled by the head of the universal test machine. The middle round hole in sliding plate 7 is engraved with an internal thread, which matches the thread on the screw rod to form a screw drive. The screw rod is rotated by the handle, pushing sliding plate 7 to compress the springs, which transmit the force to sliding plate 6. The female die on sliding plate 6 transmits the force to the male die on sliding plate 5. The function of the spacer is to adjust the distance between the dies to adapt for specimens of different thicknesses so that they coincide with the center line of the universal test machine to avoid eccentric loading. The spacer is support by the pallet, which is embedded in vertical plate 4.
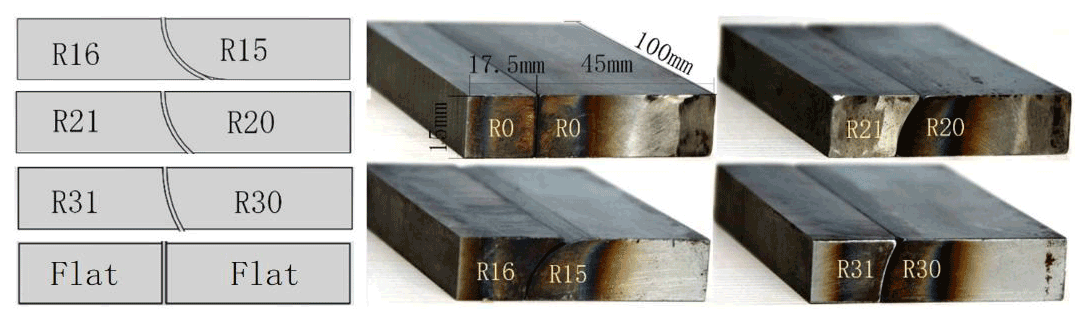
Four sets of male and female dies with different contact surface shapes were designed and manufactured, as shown in Fig. 3. One set of dies has a flat surface, and the other three sets have curved surfaces with a radius of 15, 20, and 30 mm on the male dies, respectively. The corresponding female dies have a radius of 16, 21, and 31 mm, respectively, to accommodate the 1 mm-thick specimen. The overall dimensions of each set of dies are 100 mm long, 62.5 mm wide, and 15 mm high.
2.2 Materials
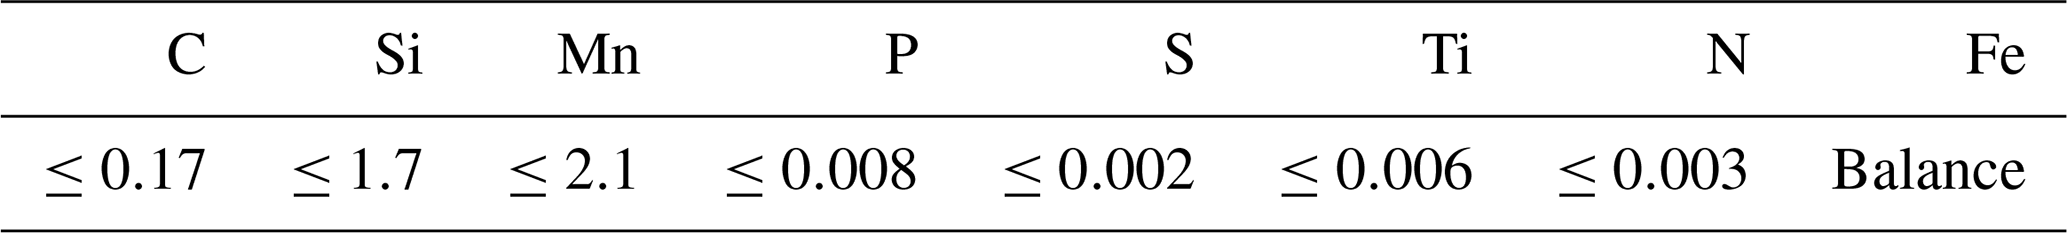
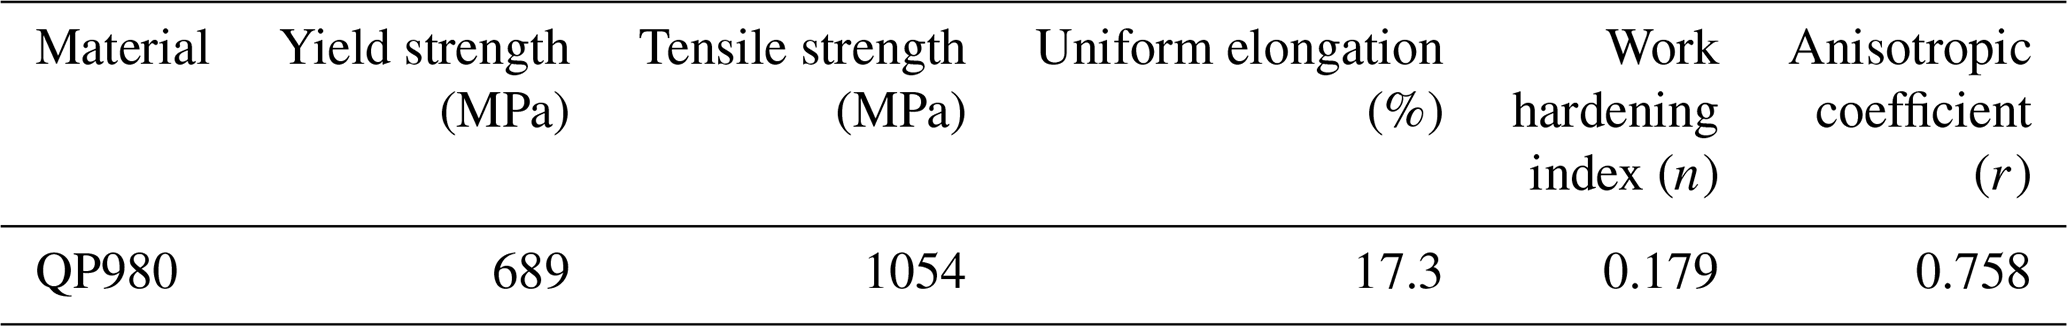
As-received bare 1.0 mm-thick QP980 advanced high-strength steel produced by Baoshan Iron & Steel Co. Ltd. was used in this experiment. The chemical composition is given in Table 1, and the mechanical properties are given in Table 2. The steel sheet was cut to 180 mm-long and 30 mm-wide rectangular specimens with the length aligned with the sheet's rolling direction. After the specimens were prepared, the corner burrs were removed and the surface was treated with acetone to maintain surface finish. The treated specimens were properly stored to ensure that the surface was clean and free from contamination.
The dies to clamp the specimens are made of Cr12MoV, a tool steel that has the advantages of high hardness, small heat treatment deformation, good wear resistance, and good hardenability. The dies were quenched at 1100 ∘C for 30 min and tempered twice at 200 ∘C to a surface hardness of 60 HRC. The surface roughness Ra of these dies is approximately 0.6 µm, which meets the standard used in the automotive stamping industry (Zhao et al., 2017).
No lubricant or stamping oil was applied to the specimens and dies; therefore, the effect of lubrication was not evaluated in this experiment.
2.3 Test procedures and results
The friction tests were carried out on a SANS electronic universal test machine (shown in Fig. 4), which has a rated maximum load of 100 kN and a real-time data acquisition system to collect the force, speed, and displacement data. Pulling speeds of 2, 5, and 10 mm s−1 were applied in the tests.

The clamping force on the specimen is determined through the spring stiffness and the screw pod advancement distance. Although the stiffness of each single spring is known, the stiffness of the screw drive assembly consisting of springs, sliding plates, guides, and screw rod needs to be calibrated following this procedure: remove the dies and place a force transducer between the sliding plates (5 and 6 in Fig. 1); turn the screw rod to compress the springs, generating force on plate 6; record the force and the advancement distance to calculate the overall stiffness of the assembly. According to the thread characteristic of the screw rod, the corresponding advancement distance for each turn of the rod, i.e., the amount of spring compression, can be obtained. Thus, the force between the two sliding plates generated by each turn of the screw rod was determined. During the test, the number of turns of the screw rod was counted to calculate the clamping force on the specimen. Clamping forces of 5.55, 6.92, and 8.23 kN were applied in the tests.
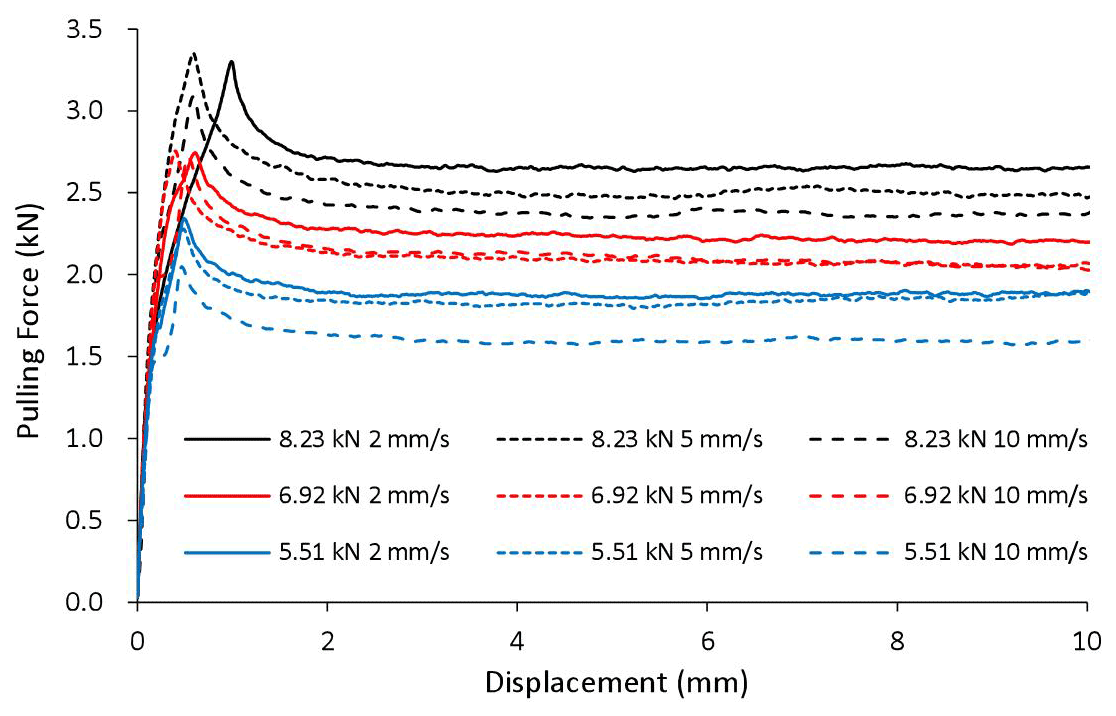
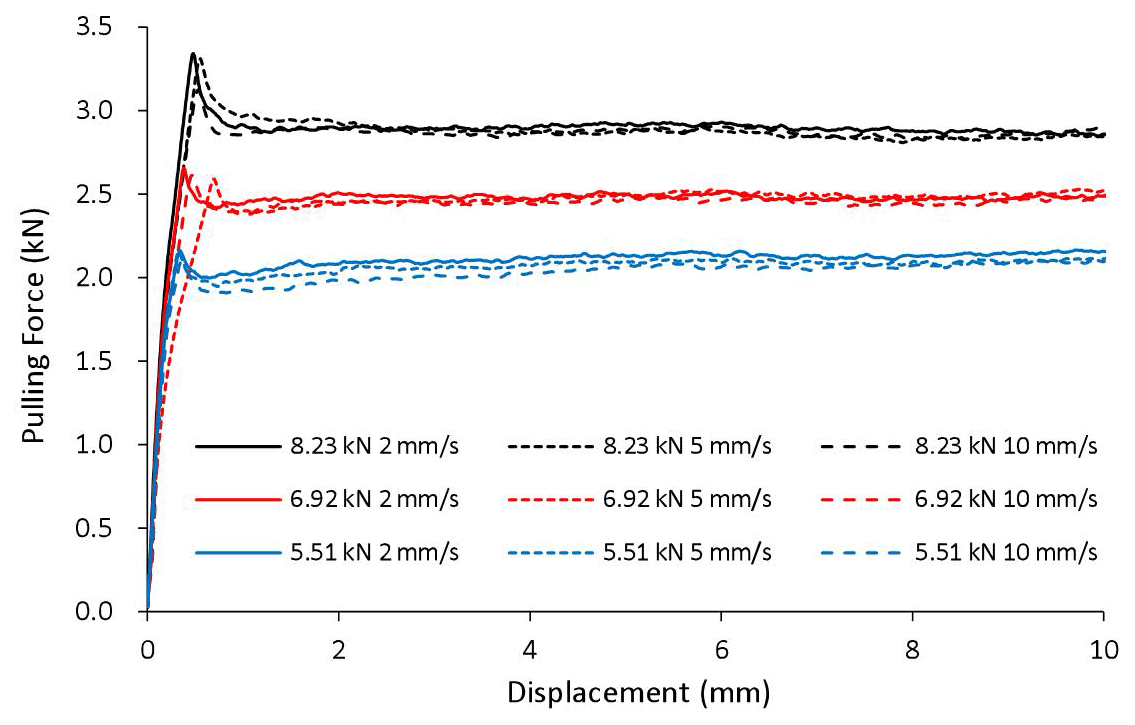
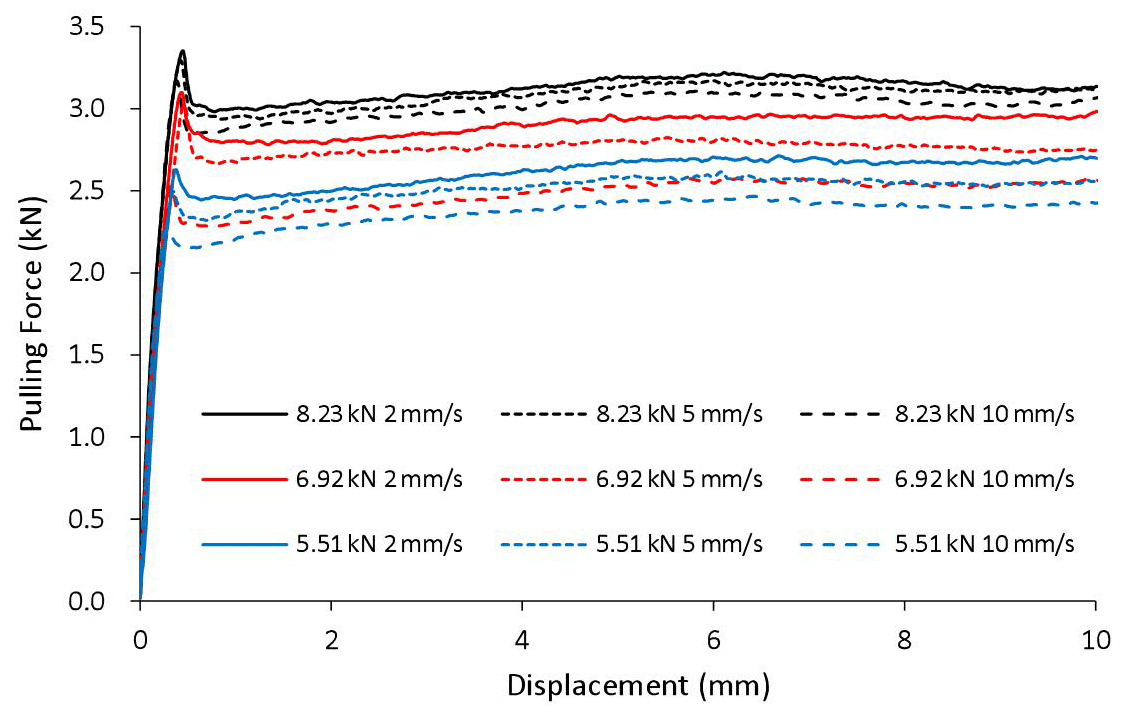
There are 36 combinations among the four geometric attributes (flat, R30, R20, and R15), three clamping forces (5.55, 6.92, and 8.23 kN), and three pulling speeds (2, 5, and 10 mm s−1). Each case was tested three times to ensure repeatability. The recorded pulling forces versus displacement curves for all cases are plotted in Figs. 5–8.
It can be seen that in all cases the pulling force increases initially until the specimen starts to slide and then decreases and remains stable as the specimen continues sliding over the dies. It is not a surprise that the pulling force increases with clamping force, since friction force is positively related to normal force. For a given die radius and clamping force, a higher pulling speed lowers the pulling force because of the negative relationship between sliding speed and friction coefficient, as pointed out by the literature. The geometric attribute of the contact surface apparently has a positive impact on the pulling force, i.e., the larger the curvature of the contact surface the greater the pulling force, partially caused by the difference in bending/unbending force and partially by the difference in friction coefficient, which will be examined in detail later.

The Coulomb friction coefficient is calculated by the normal pressure and sliding friction force on the contact surface, which are determined by the clamping force N and pulling force P in this experiment. The pulling force versus clamping force for all cases are plotted in Fig. 9.
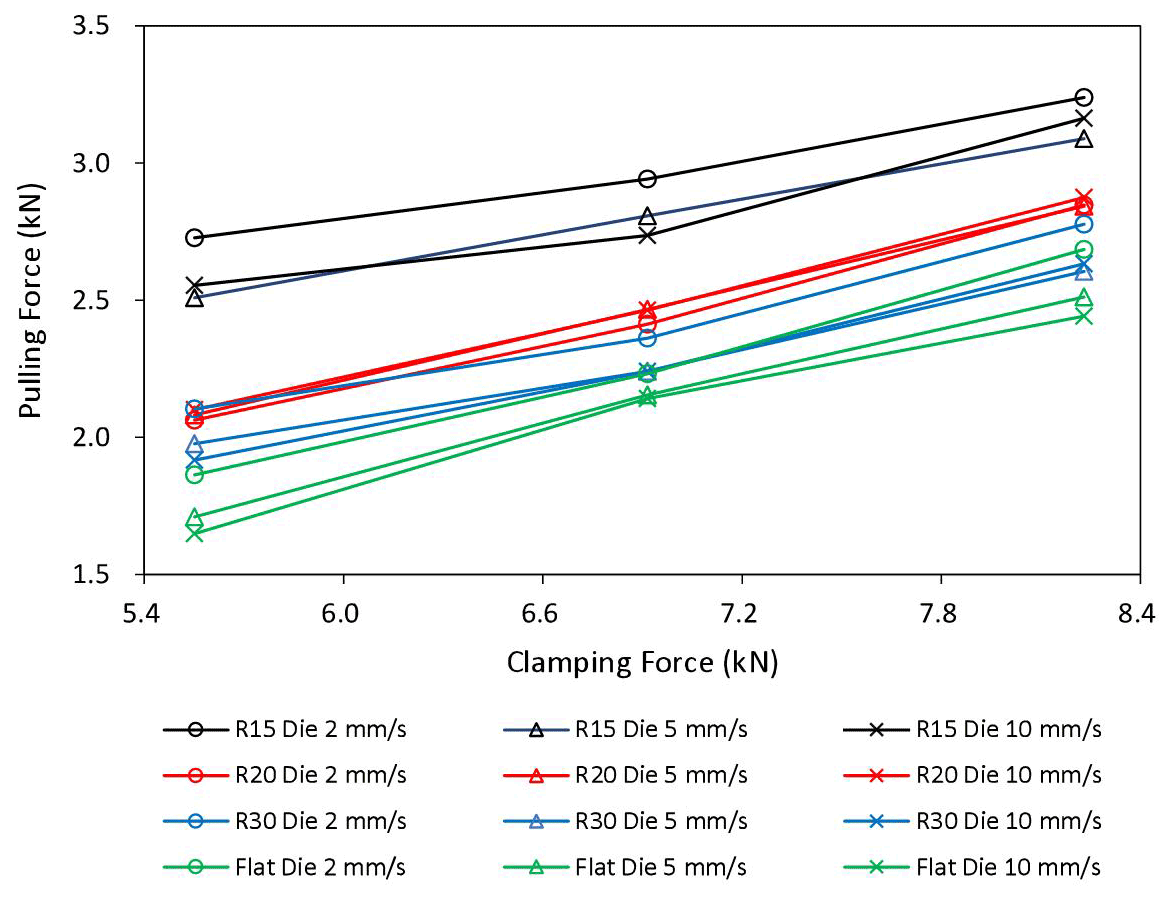
The friction coefficient formula for a flat contact surface is straightforward, i.e., , but for a curved contact surface, the pulling force P has two parts: the force to overcome the bending and reverse bending of the specimen when entering and exiting the clamping dies and the friction force between the specimen and the clamping dies. The formula for calculating the friction coefficient between curved contact surfaces is , where λ is a correction factor related to the curvature and Pb+ub is the bending/unbending force that needs to be determined theoretically or via numerical simulation.
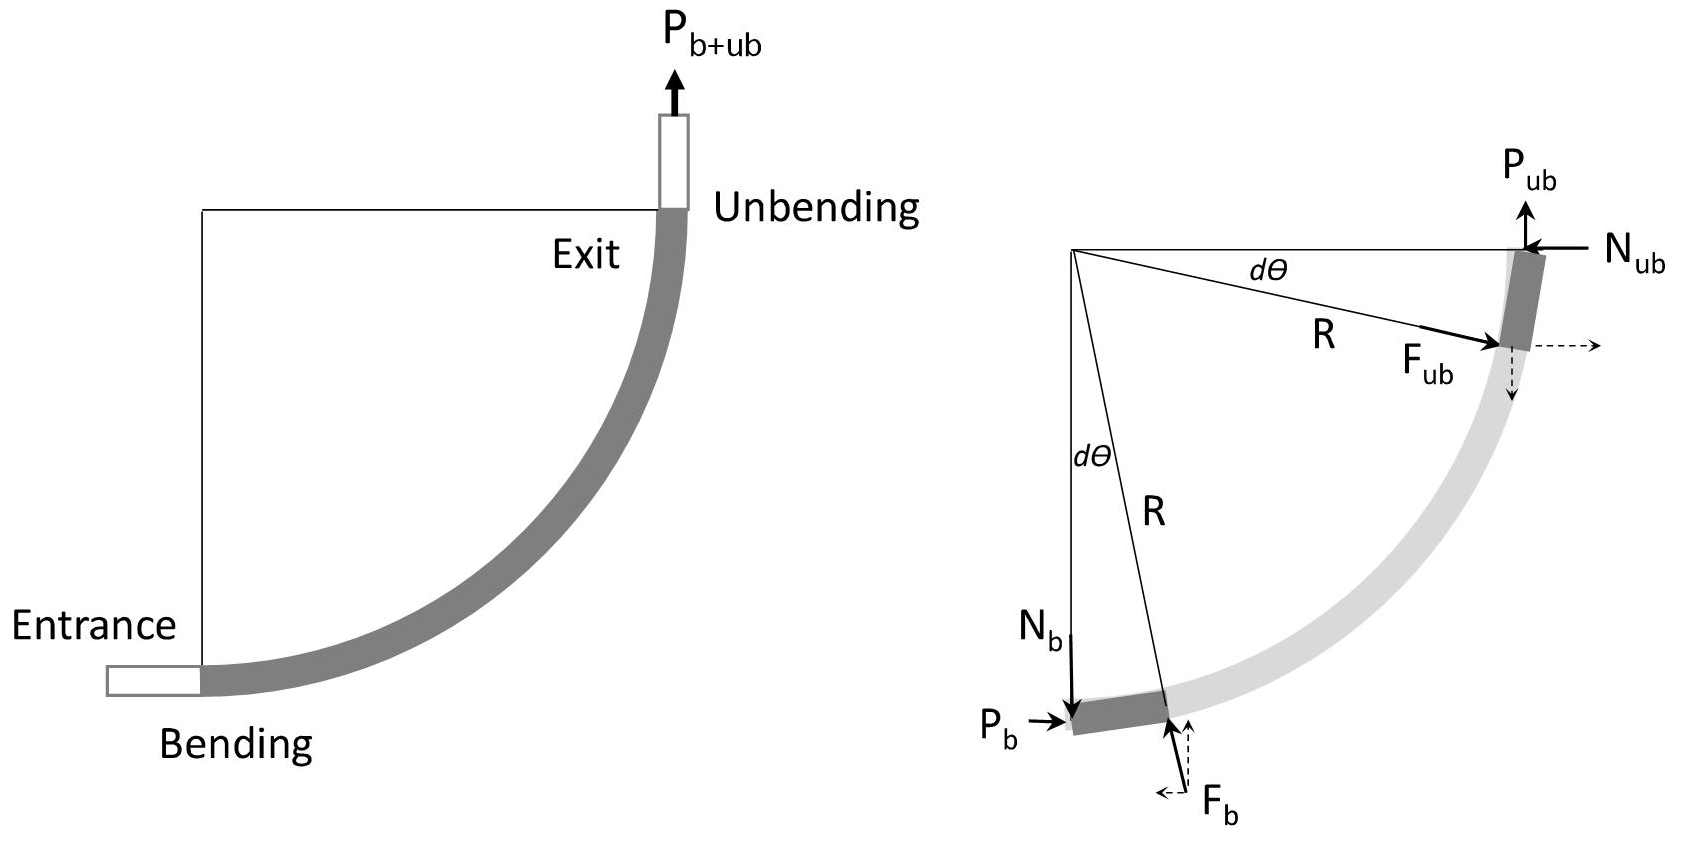
According to the force diagram in Fig. 10, the bending/unbending force is given by Eq. (1):
where σy is the stress in different layers of the specimen, R is the radius of the die, w is the width of the specimen, and t is the thickness of the specimen. The detailed derivations are provided in Appendix A.
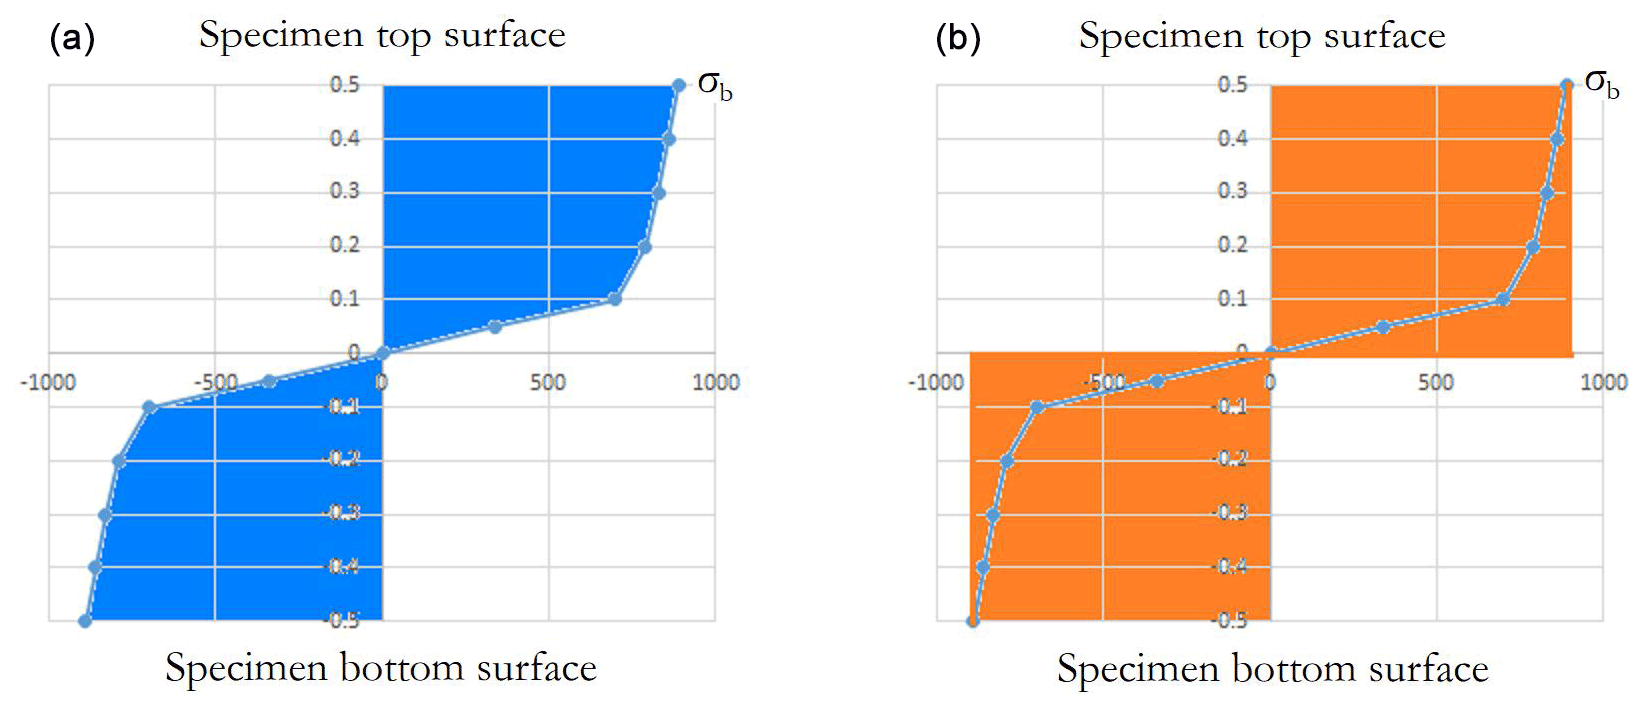
Figure 11Illustration of through-thickness stress distribution (a) and their approximation (b).
Figure 11 illustrates the stress distribution through the thickness. The middle layer is assumed to be the natural layer. The stress distribution can be simplified by a pure plastic model as shown in the right-hand-side diagram in Fig. 11, which yields an explicit formula for the bending/unbending force given by Eq. (2):
where σb is the stress in the outermost layer, which as a function of strain σb=σ(εb) can be determined from the stress-hardening curve of QP980. The strain εb is given by Eq. (3):
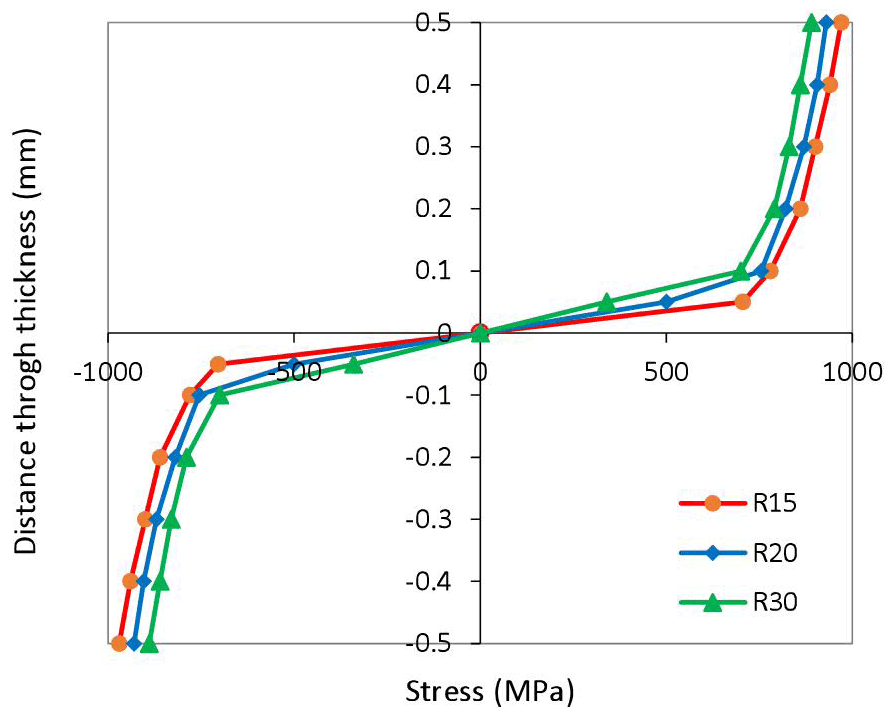
The through-thickness stress distributions in the curved specimens with different radii are plotted in Fig. 12.
Finite-element simulation is a powerful tool to help investigate complex physical problems. The abovementioned methods to calculate the bending/unbending force are based on some assumptions and approximations. It is worthwhile obtaining the bending/unbending force via finite-element modeling. ABAQUS/Standard is used to model this experiment. The specimen is modeled by a mesh of 1×1 mm S4R (four-node doubly curved, reduced integration) thick-shell elements with 11 Simpson thickness integration points. The interaction between the specimen and die is defined by the surface-to-surface finite sliding contact algorithm, where the normal behavior is defined by the hard-contact pressure overclosure and penalty constraint enforcement method, and the tangential behavior is defined as frictionless. Stationary boundary conditions are assigned to the dies. Since there is no friction force in this numerical model, the simulated pulling force is equal to the bending/unbending force.
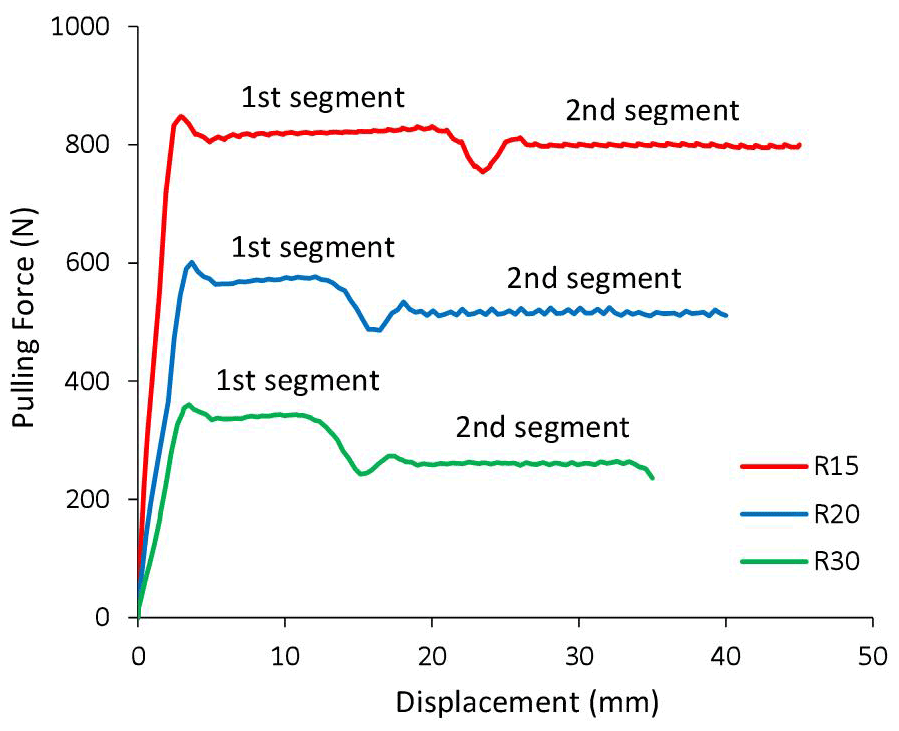
The simulated pulling forces versus displacements for the curved specimens are plotted in Fig. 13, where two stable segments and a bump between them are observed. This phenomenon is due to the numerical model setup not exactly mimicking the experimental setup. In the experiment, the specimen is bent by the dies and then pulled sliding over the die, while in the finite-element model, a pre-bent specimen is directly modeled for simplification. Therefore, in the first segment of deformation in simulation, the specimen initially does not have stress and just undergoes unbending as it slides through the dies, which does not exactly reflect what happens in the experiment where the specimen is bent first and then unbent. In the second segment of deformation, the specimen undergoes bending and unbending, which occurs in both the experiment and the simulation. The strain and stress contour plots in Figs. 14 and 15 reveal the difference between the two segments of deformation. The simulated pulling force in the second segment is considered the bending/unbending force since this segment more closely represents the experiment.
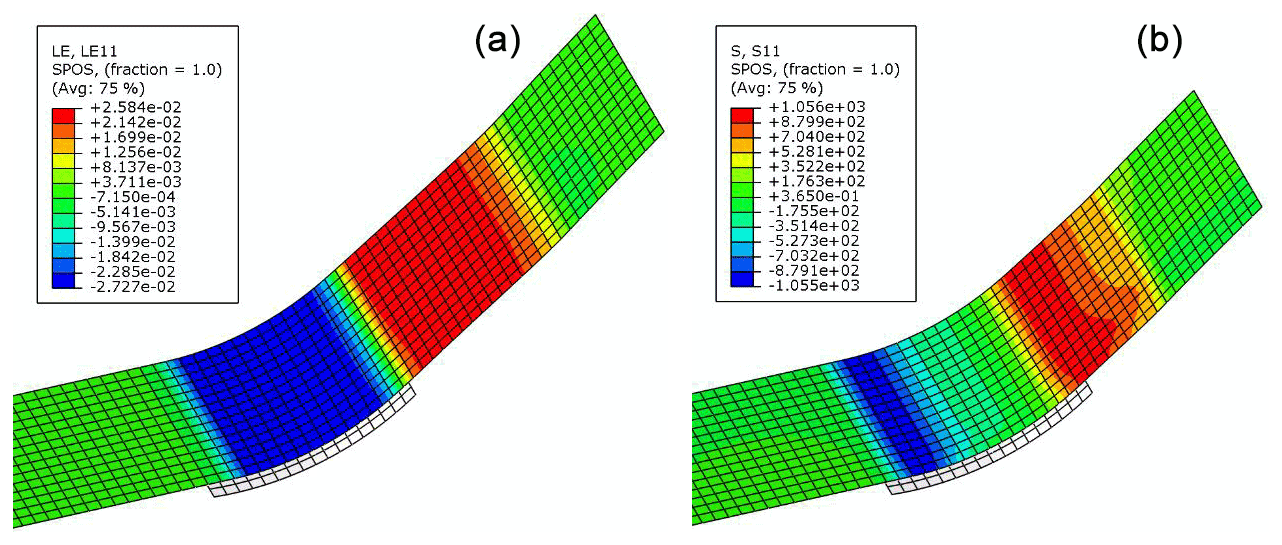
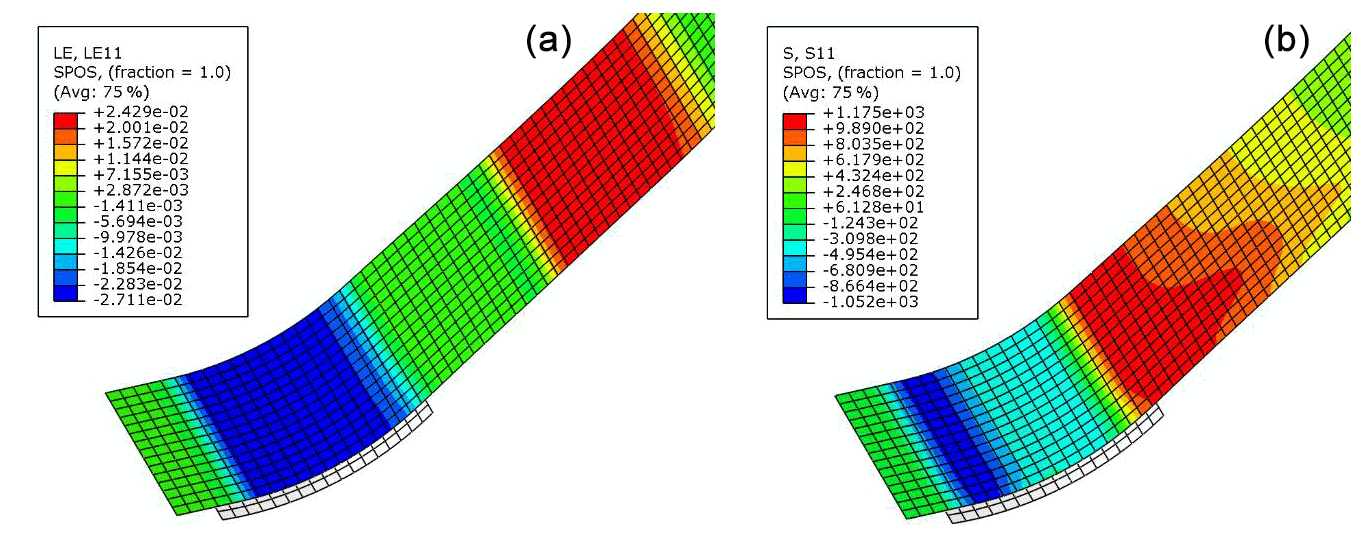
Figure 15First principal strain (a) and stress (b) during the second segment of deformation.
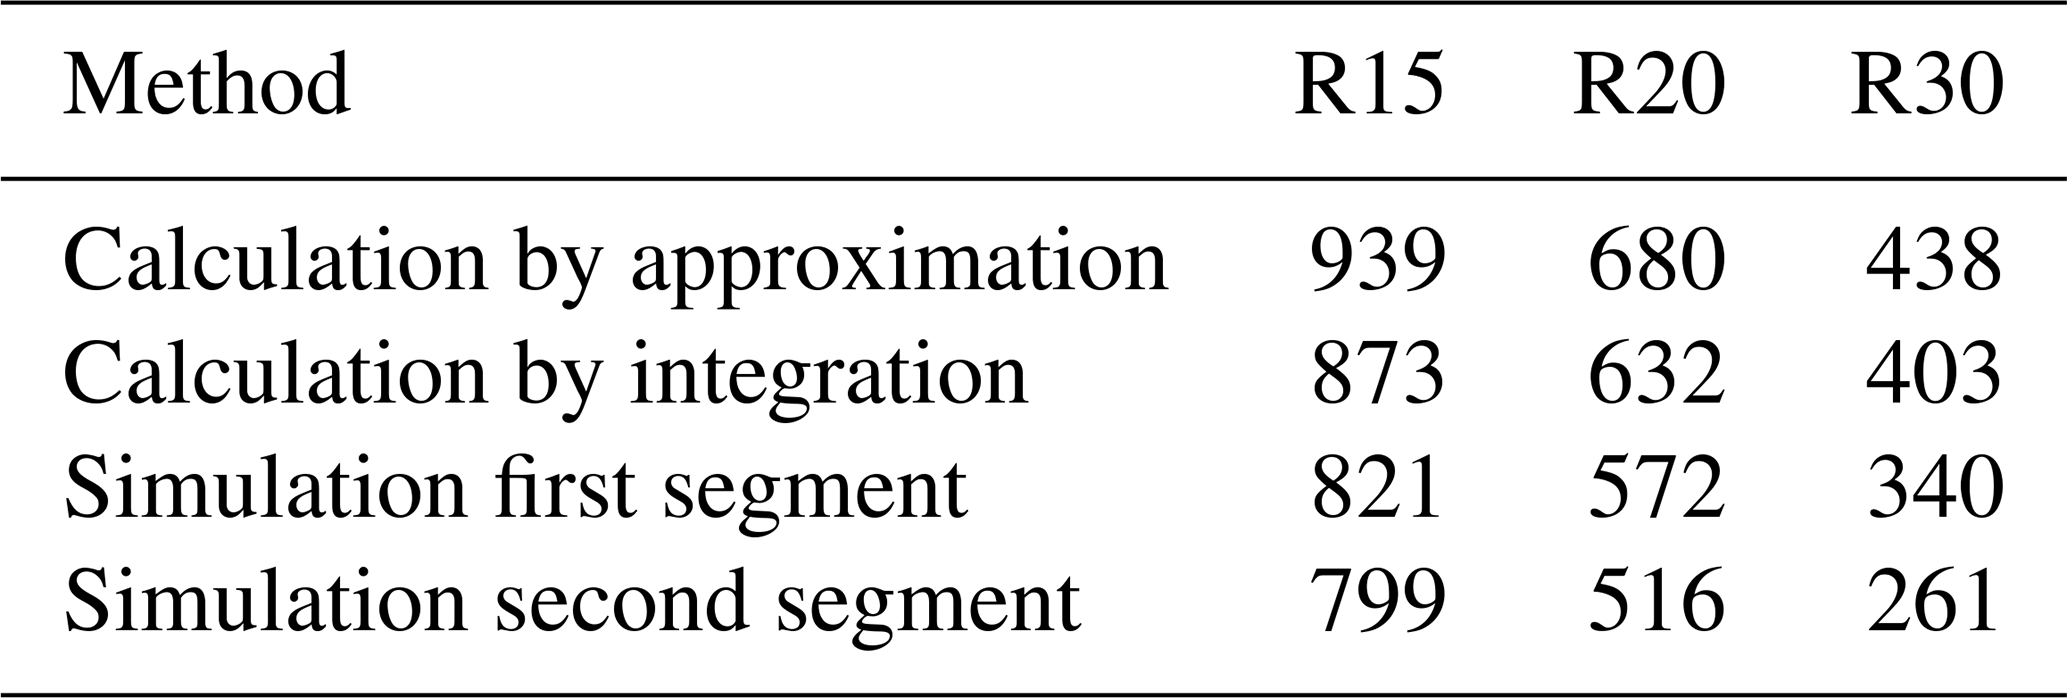
The theoretically calculated and numerically simulated bending/unbending forces are presented in Table 3. The overestimation by theoretical calculations is probably due to the assumptions and approximations behind them. It is reasonable that a higher force is required to cause bending and unbending of a specimen over a smaller radius.
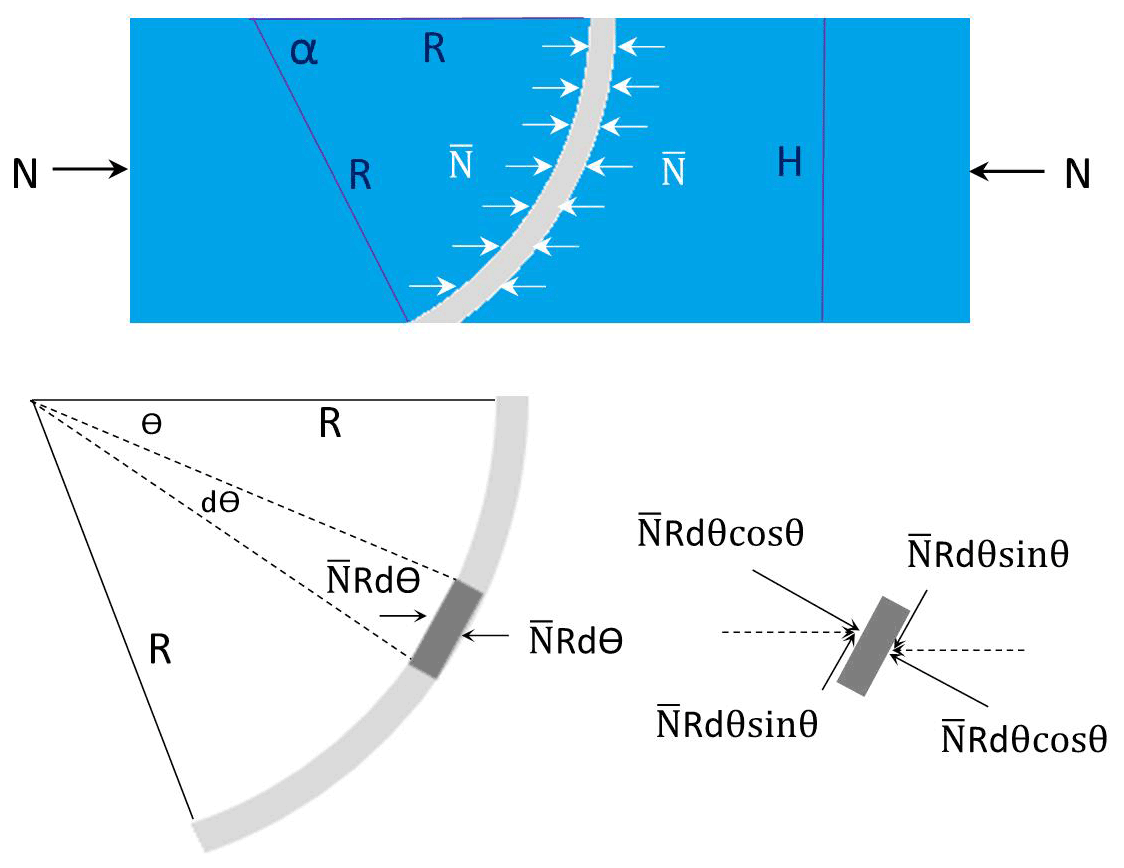
The clamping force N is the normal contact force for the flat die but not for the curved dies. Figure 16 shows the force diagram of a curved specimen. The formula for calculating the friction coefficient between curved contact surfaces is given by Eq. (4):
where H is the height of the die (15 mm) and R is the die radius (15, 20, and 30 mm). The detailed derivations are provided in Appendix B. For a flat contact surface, the R is infinite and there is no bending/unbending force, so the Pb+ub and terms in Eq. (4) drop out. The degeneration leads to the formula .
The friction coefficients for all combinations among the geometric attributes, pulling speeds, and clamping forces are presented in Table 4.
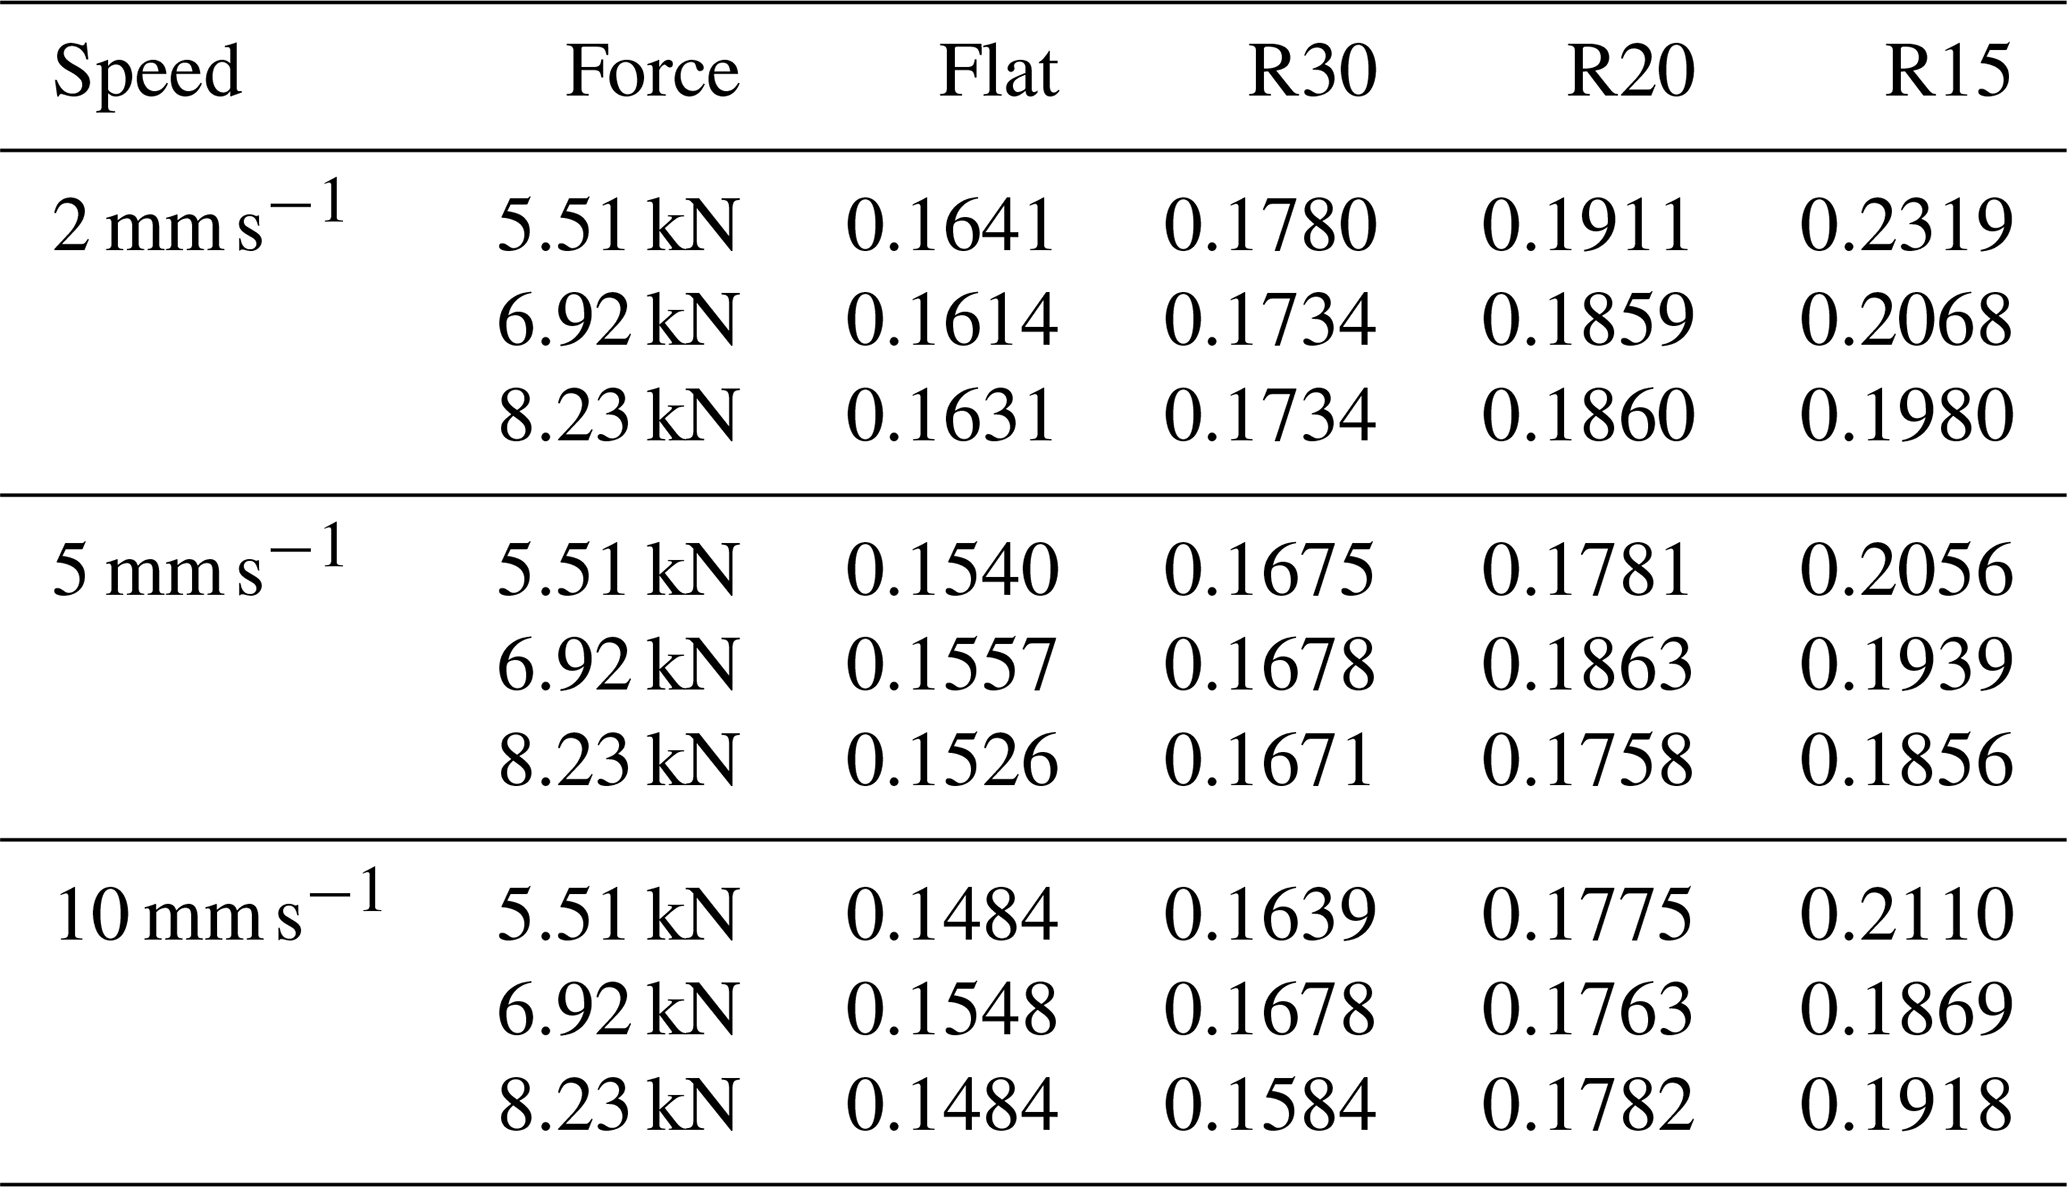
It can be seen from Table 4 that the friction coefficient in general is negatively related to sliding speed and positively to the curvature of the contact surface, consistent with what was found in Lemu et al. (2013), Kim et al. (2012), Ma et al. (2011), and Dilmec et al. (2016). However, its sensitivity to contact pressure is not as significant as reported by other researchers (Wang et al., 2016; Li et al., 2018; Kim et al., 2012; Trzepiecinski et al., 2015), probably because the difference in the clamping forces applied in this experiment is not large enough to cause a noticeable influence and the lubrication conditions in these studies are different as well.
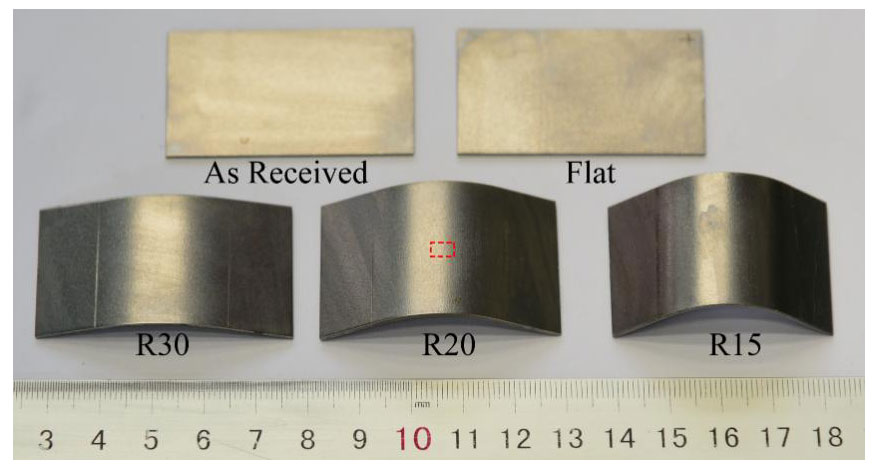
Figure 17Image of the as-received sheet and the specimens stamped by flat and curved dies (R30, R20, R15).
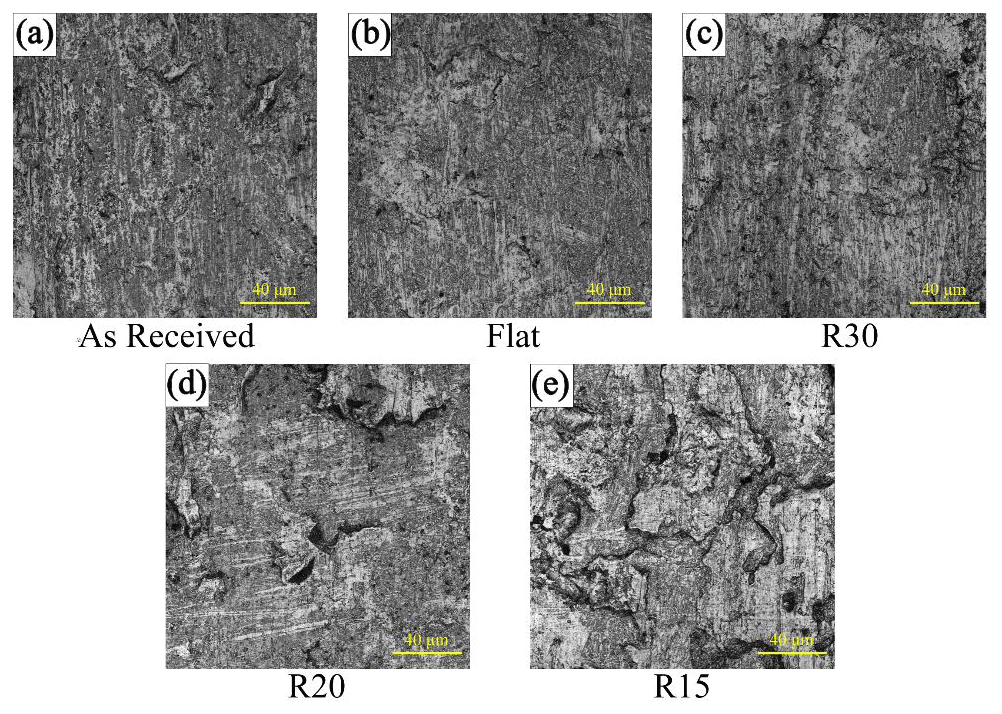
Figure 18Surface morphology of the as-received sheet and the specimens stamped by flat and curved dies (R30, R20, R15).
The influence of geometric attribute on friction coefficient can be explained by examining the property of the contact surface. Figure 17 shows the images of the as-received sheet and the specimens stamped by flat and curved dies at 8.23 kN clamping force. A small area of each specimen was observed by a laser confocal microscope LEXT OLS4000, and the surface morphology images were shown in Fig. 18. It can be seen from the microscopic images that the surface of the curved specimens is rougher than the surface of the flat specimen and that the degree of roughness is positively related to the curvature. The limitation of this confocal microspore is that it cannot measure the concave surface, i.e., the inner surface of the curved specimens, due to the interference between the lens and the specimen. It is also not convenient to measure a large curved area using this microscope. Therefore, a 3D surface profiling instrument Talysurf CLI 2000 was used to measure the surface roughness of both the outer and inner surfaces of each specimen. The probe traveled along three paths in both the length and width directions as shown in Fig. 19. The measured roughnesses along the six paths of each surface were averaged as the surface roughness and are plotted in Fig. 20.
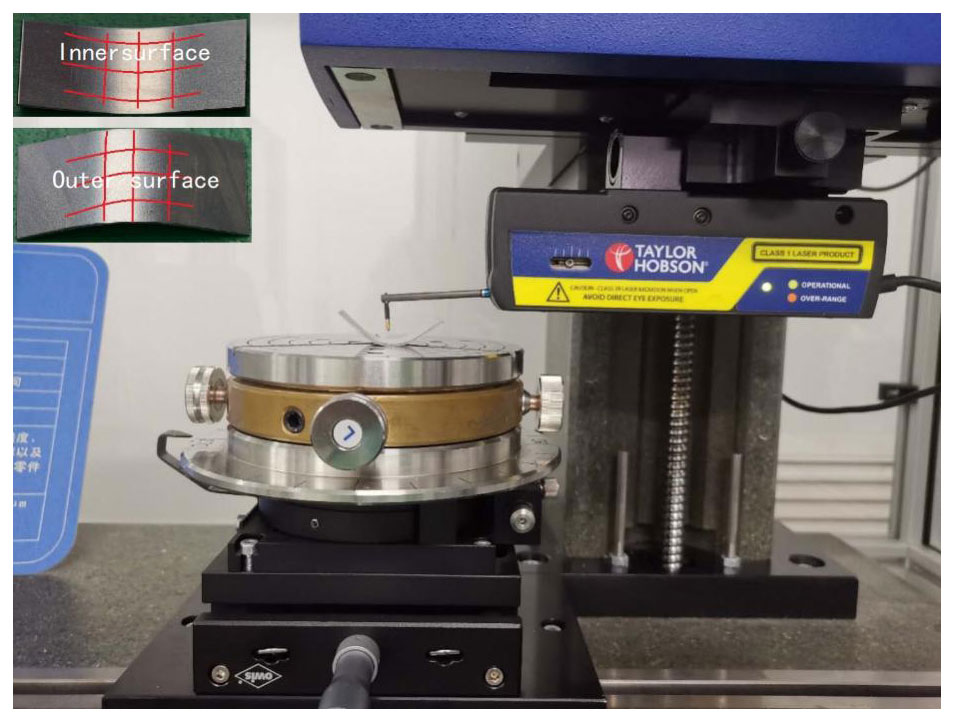

Figure 20Surface roughness of the specimens stamped by flat and curved dies (R30, R20, R15).
Comparison between the as-received sheet and the stamped flat specimen reveals that pressure changes the surface roughness very little. To further investigate the impact of contact pressure on surface roughness, a group of flat specimens were clamped at 5, 25, 50, and 100 MPa, respectively. The measured surface roughness is within 0.8–0.82 µm. It has been reported in Wang et al. (2016), Li et al. (2018), Stembalskin et al. (2013), and Tamai et al. (2016) that contact pressure does influence the friction coefficient, but since the pressure-induced deformation of surface topology is elastic, the measurement of unloaded specimens does not show significant changes in surface roughness. On the other hand, bending does cause a permanent change in surface roughness, and the amount of roughness increase is positively related the curvature. A curve fitting in Fig. 20 shows that the bending-induced surface roughness increase can be approximated by a second-order polynomial function:
where κ is the curvature of the specimen.
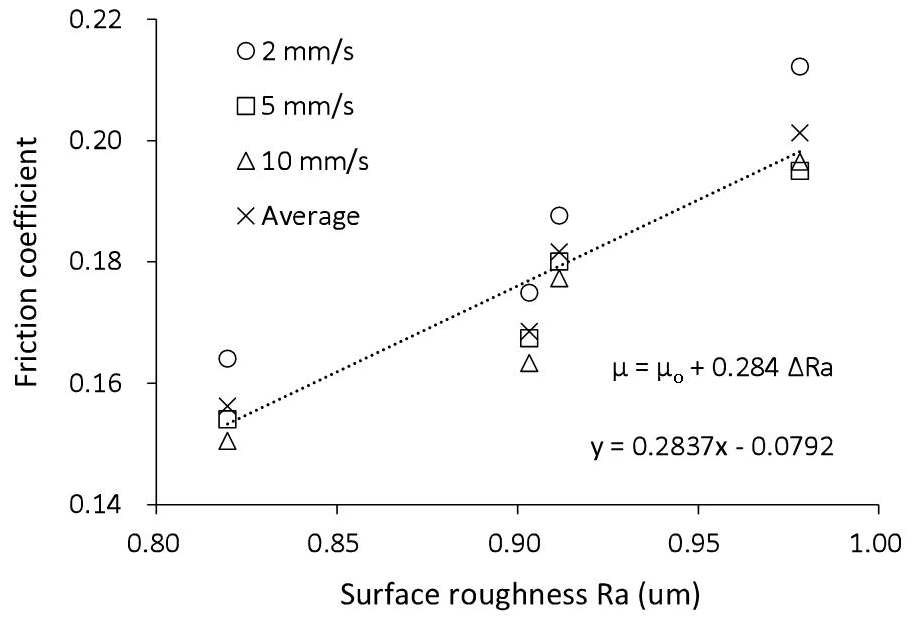
The influence of surface roughness on friction has been reported in Leu (2011), Liang et al. (2018), Shi et al. (2019), Sigvanta et al. (2019), Xiao et al. (2007), Ivkovic et al. (2007), Trzepiecinski et al. (2017), Sahin et al. (2007), Trzepiecinski et al. (2019), and Folle et al. (2019). To quantify the relationship between surface roughness and friction coefficient, a curve fitting was performed for the data points in Fig. 21, which yield a linear function:
where μo is the friction coefficient of the flat specimen.
Combining Eqs. (5) and (6) and neglecting the linear term of κ yield
This leads to the conclusion that the specimen's surface roughness changes as it bends and slides over the curved dies. Since surface roughness is directly related to friction, the degree of change in surface roughness is reflected by the change in friction coefficient.
The Coulomb friction model with a constant friction coefficient is widely used in stamping simulation. However, the friction coefficient is not constant in reality but depends on multiple factors such as contact pressure, sliding speed, and geometric attribute. The value of friction is one of the considerable uncertainties in simulation, and using an enhanced friction model may lead to improved simulation results.
The theory manual of stamping simulation software AutoForm (AutoForm R7 Software Manual 2016) provides a Coulomb friction model with contact pressure and sliding-velocity-dependent friction coefficient:
where μo is the base friction coefficient at reference conditions, po the reference contact pressure, p the contact pressure, a the pressure exponent, vo the reference sliding velocity, v the sliding velocity, and b the velocity factor.
An enhanced friction coefficient model of QP980 with geometric attribute dependence taken into account can be constructed by combining Eqs. (7) and (8):
where κ is the curvature, and c and d are the curvature factors which have been determined to be 1.49 and 0.546 in Eq. (8). The parameters a and b can be determined individually by using the data in Table 4. The forces of 5.51, 6.92, and 8.23 kN on a 30-by-15 mm2 specimen correspond to contact pressures of 12.2, 15.4, and 18.3 MPa. The parameters a and b are determined to be 0.928 and 0.0097, respectively. In summary, the constants and reference values in Eq. (9) are
The enhanced friction model was used to simulate an automotive structural part–front load beam. The die setup is shown in Fig. 22. The upper tools consist of a pad and steel, and the lower tools consist of a binder and a post. The stamping process is defined as below.
-
Step 1: a developed blank of QP980 1.0 mm thick is initially placed between the upper tools and the lower tools.
-
Step 2: the upper pad moves down to press the blank against the post, and a constant force of 102 kN is applied to the pad.
-
Step 3: while the blank is held between the pad and the post, the upper steel moves down until it closes with the lower binder.
-
Step 4: the upper steel and the lower binder move down together, pulling the blank into the die cavity until they hit home position. A constant force of 246 kN is applied to the binder.
-
Step 5: the part is removed from the dies, followed by a free-state springback analysis.
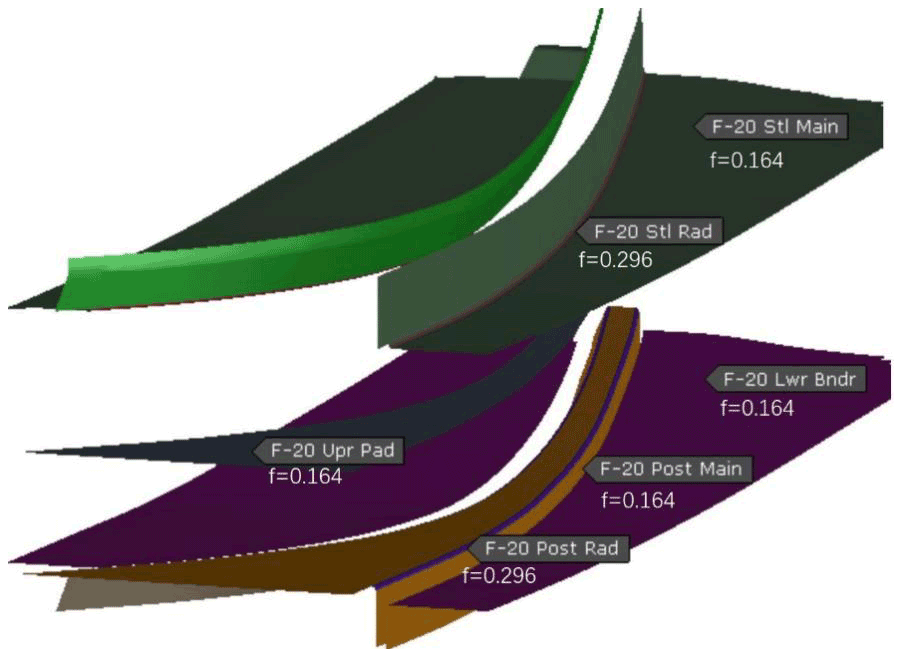
In order to apply curvature-dependent friction coefficients to the die, the radii of the steel and post are defined as separate tools. Thus, the steel is separated into steel-main and steel-radius and the post into post-main and post-radius. The reference friction coefficient of 0.164 is assigned to steel-main, pad, post-main, and binder. The curvature of steel-radius and post-radius is , which leads to a friction coefficient of 0.296 by using Eq. (7). Each tool's name and its applied initial friction coefficient are labeled in Fig. 22. The friction model in the AutoForm software takes into account the pressure and velocity dependence during the simulation.
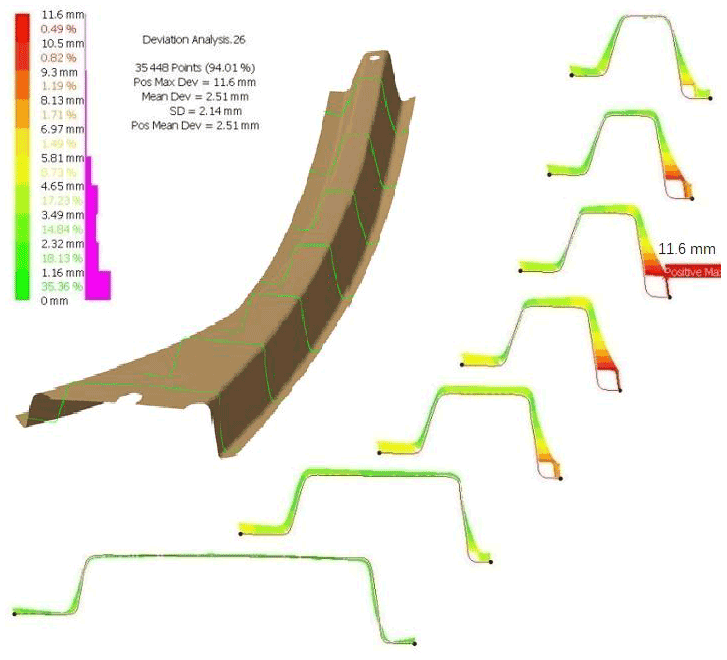
A major concern of high-strength steel parts is springback; therefore, the load beam was measured for dimensional quality along seven sections as shown in Fig. 23. The measurement shows a maximum springback magnitude of 11.6 mm on the sidewall near the bottom radius. The simulated springback values are presented in Fig. 24, where it can be seen that the enhanced friction model predicts 11.9 mm, while the conventional friction model predicts 13.1 mm, indicating that the enhanced model improves simulation accuracy.
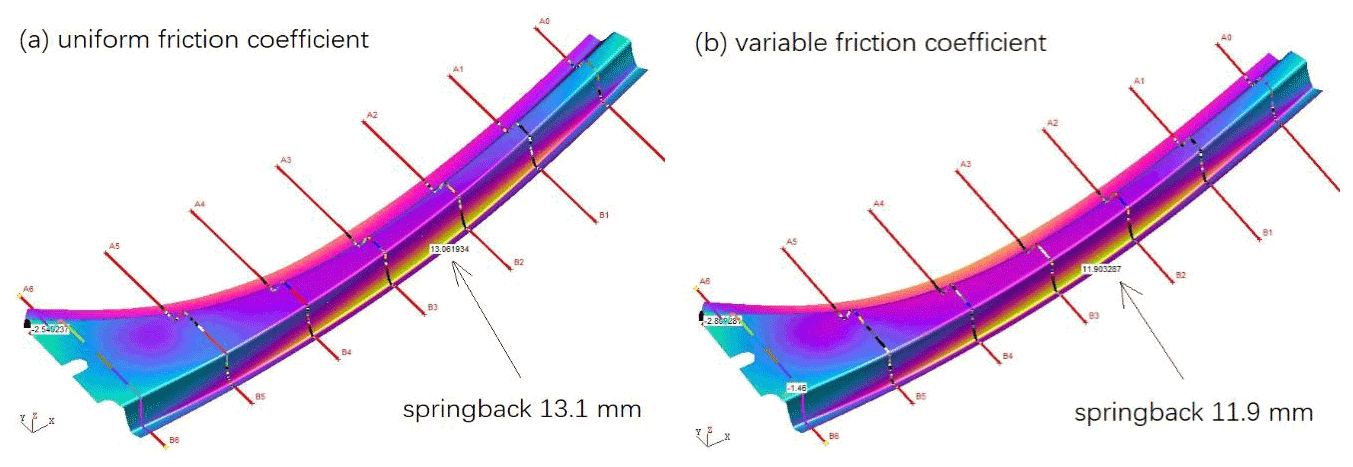
Figure 24Simulated springback magnitude of the load beam: (a) conventional uniform friction coefficient model; (b) enhanced variable friction coefficient model.
Another big concern of stamping high-strength steel is die wear. Engineers often use simulation to predict the most severe worn areas of the die so that the die's lifetime can be better estimated and a preventive maintenance schedule can be created. Friction plays an important role in die wear, so a more accurate friction model is desired in simulation. Figure 25 shows the simulated die wear in terms of friction work by using the conventional model and the enhanced model. Differences in friction–work distribution and the peak value are observed. The curvature-induced increase in friction coefficient yields a higher degree of die wear.
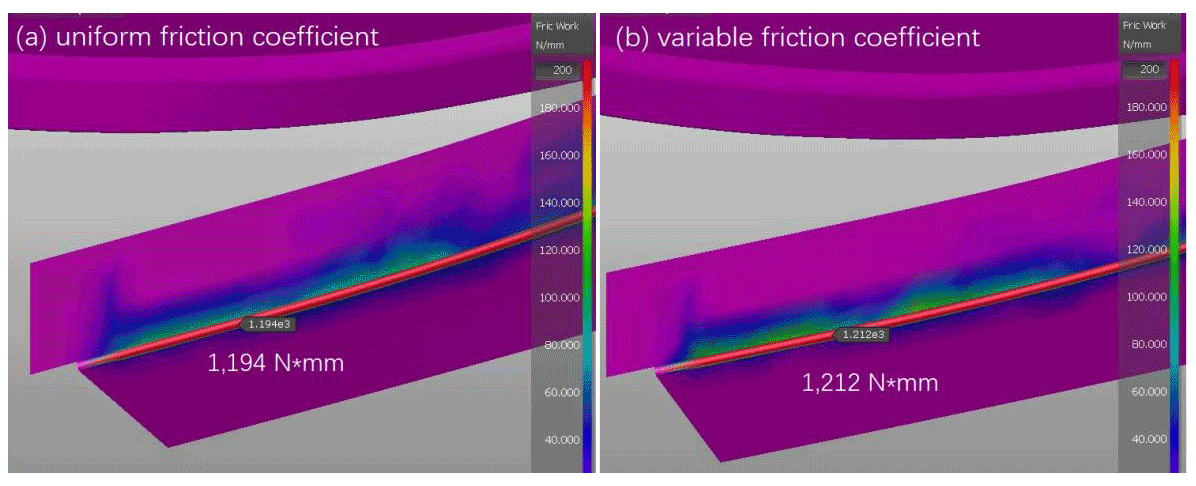
Figure 25Simulated die wear in terms of friction work: (a) conventional uniform friction coefficient model; (b) enhanced variable friction coefficient model.
A universal test-machine-based mechanically driven friction device was designed and manufactured. Friction tests were conducted on a third-generation high-strength steel QP980 with flat and curved dies at different pulling speeds and clamping forces. The formula for calculating the friction coefficients between curved contact surfaces was derived. Finite-element modeling was performed to find the bending/unbending force when a specimen is pulled over curved dies. The relationship between bending-induced surface roughness increase and friction coefficient was established. An enhanced friction coefficient model with contact pressure, sliding velocity, and geometric curvature dependence was proposed, and the parameters were determined. The enhanced friction model was applied to simulate the stamping of an automotive part, and the simulation results were compared with measurement results. The following conclusions can be drawn.
-
The friction coefficient between curved contact surfaces is higher than the one between flat surfaces when other geometric and process attributes like die surface roughness, lubrication condition, contact pressure, and sliding speed are the same. The friction coefficient in general is positively related to the curvature of the contact surface.
-
Sliding speed negatively impacts the friction coefficient between flat and curved surfaces, although the impact on flat surface is more consistent than on curved surface. The friction coefficient is also negatively related to contact pressure. The difference in contact pressure in this experiment is not large enough to generate a significant pressure sensitivity.
-
The increase of friction coefficient between curved contact surfaces is because the specimen's surface roughness changes as it bends and slides over a curved die. The degree of change in surface roughness is positively related to the curvature, and so is the change in friction coefficient.
-
The curvature-induced surface roughness increase can be approximated by a second-order polynomial. A linear relationship between the surface roughness and friction coefficient can be established. Thus, the dependence of friction coefficient on curvature can also be modeled by a second-order polynomial.
-
The enhanced friction coefficient model with contact pressure, sliding velocity and geometric curvature dependence can be implemented in stamping simulation software and the predicted springback and die wear using the enhanced model are more accurate.
Referring to Figs. 10 and 11,
For a simplified through-thickness stress distribution,
Referring to Fig. 16,
The datasets supporting the conclusions of this article are included within the article (Sect. 2.3, Figs. 5 to 8).
DZ and KZ were in charge of the whole trial; DZ and DR wrote the manuscript; HS assisted with experimentation; YC assisted with FEM. All the authors read and approved the final manuscript.
The contact author has declared that neither they nor their co-authors have any competing interests.
Publisher's note: Copernicus Publications remains neutral with regard to jurisdictional claims in published maps and institutional affiliations.
The QP980 high-strength steel is provided by Baoshan Iron & Steel Co. Ltd. of China.
This research has been supported by the High-level Scientific Research Startup Fund for the Introduction of Talent of Anhui University of Science and Technology, the National Natural Science Foundation of China (grant nos. 51775160 and 51971050) and the China Postdoctoral Science Foundation (grant no. 2020M680947).
This paper was edited by Jeong Hoon Ko and reviewed by two anonymous referees.
AutoForm R7: Software Manual, AutoForm Engineering GmbH, USA, 2016.
Chen, X., Niu, C., Lian, C., and Lin, J.: The evaluation of formability of the 3rd generation advanced high strength steels QP980 based on digital image correlation method, Procedia Engineer., 207, 556–561, https://doi.org/10.1016/j.proeng.2017.10.1020, 2017.
Dilmec, M. and Arap, M.: Effect of geometrical and process parameters on coefficient of friction in deep drawing process at the flange and the radius regions, Int. J. Adv. Manuf. Tech., 86, 747–759, https://doi.org/10.1007/s00170-015-8225-5, 2016.
Evin, E., Nemeth, S., and Vyrostek, M.: Evaluation of friction coefficient of stamping, Acta Mechanica Slovaca, 18, 20–27, https://doi.org/10.21496/ams.2014.027, 2014.
Folle, L. and Schaeffer, L.: New Proposal to Calculate the Friction in Sheet Metal Forming Through Bending Under Tension Test, Mater. Res., 22, 2019, https://doi.org/10.1590/1980-5373-mr-2019-0523, 2019.
Ivkovic, B., Djukdjanovic, M., and Stamenkovi, D.: The Influence of the Contact Surface Roughness on the Static Friction Coefficient, Tribology in industry, 22, 41–44, 2007.
Kim, Y. S., Jain, M. K., and Metzger, D. R.: Determination of pressure-dependent friction coefficient from draw-bend test and its application to cup drawing, Int. J. Mach. Tool. Manu., 56, 69–78, https://doi.org/10.1016/j.ijmachtools.2011.12.011, 2012.
Lemu, H. and Trzepiecinski, T.: Numerical and experimental study of frictional behavior in bending under tension test, J. Mech. Eng., 59, 41–49, https://doi.org/10.5545/sv-jme.2012.383, 2013.
Leu. D.: Modeling of surface roughness effect on dry contact friction in metal forming, Int. J. Adv. Manuf. Tech., 57, 575–584, https://doi.org/10.1007/s00170-011-3305-7, 2011.
Li, G., Long, X., Yang, P., and Liang, Z.: Advance on friction of stamping forming, Int. J. Adv. Manuf. Tech., 96, 21–28, https://doi.org/10.1007/s00170-017-1538-9, 2018.
Liang, G., Schmauder, S., Lyu, M., Schneider, Y., Zhang, C., and Han, Y.: An investigation of the influence of initial roughness on the friction and wear behavior of ground surfaces, Materials, 11, 237, https://doi.org/10.3390/ma11020237, 2018.
Ma, N. and Sugitomo, N.: Development and application of non-linear friction models for metal forming simulation, AIP Conf. Proc., 1383, 382, https://doi.org/10.1063/1.3623635, 2011.
Sahin, M., Cetinarslan, C. S., and Akata, H. E.: Effect of surface roughness on friction coefficients during upsetting processes for different materials, Materials and Design, 28, 633–640, https://doi.org/10.1016/j.matdes.2005.07.019, 2007.
Shi, R., Wang, B., Yan, Z., Wang, Z., and Dong, L.: Effect of surface topography parameters on friction and wear of random rough surface, Materials, 12, 2762, https://doi.org/10.3390/ma12172762, 2019.
Sigvanta, M., Pilthammara, J., and Hol, J.: Friction in sheet metal forming: influence of surface roughness and strain rate on sheet metal forming simulation results, Procedia Manufacturing, 29, 512–519, https://doi.org/10.1016/j.promfg.2019.02.169, 2019.
Stembalskin, M., Pres, M., and Skoczynski, W.: Determination of the friction coefficient as a function of sliding speed and normal pressure for steel C45 and steel 40HM, Arch. Civ. Mech. Eng., 13, 444–448, https://doi.org/10.1016/j.acme.2013.04.010, 2013.
Tamai, Y., Inazumi, T., and Manabe, K.: FE forming analysis with nonlinear friction coefficient model considering contact pressure, sliding velocity and sliding length, J. Mater. Process. Tech., 227, 161–168, https://doi.org/10.1016/j.jmatprotec.2015.08.023, 2016.
Trzepiecinski, T.: A Study of the Coefficient of Friction in Steel Sheets Forming, Metals, 9, 988, https://doi.org/10.3390/met9090988, 2019.
Trzepiecinski, T. and Fejkiel, R.: On the influence of deformation of deep drawing quality steel sheet on surface topography and friction, Tribol. Int., 115, 78–88, https://doi.org/10.1016/j.triboint.2017.05.007, 2017.
Trzepiecinski, T., Bazan, A., and Lemu, H. G.: Frictional characteristics of steel sheets used in automotive industry, Int. J. Auto. Tech. Kor., 16, 849–863, https://doi.org/10.1007/s12239-015-0087-1, 2015.
Wang, W., Zhao, Y., Wang, Z., Hua, Z., and Wei, X.: A study on variable friction model in sheet metal forming with advanced high strength steels, Tribol. Int., 93, 17–28, https://doi.org/10.1016/j.triboint.2015.09.011, 2016.
Xiao, L., Bjorklund, S., and Rosen, B. G.: The influence of surface roughness and the contact pressure distribution on friction in rolling/sliding contacts, Tribol. Int., 40, 694–698, https://doi.org/10.1016/j.triboint.2005.11.021, 2007.
Zhao, D., Ren, D., Zhao, K., Pan, S., and Guo, X.: Effect of welding parameters on tensile strength of ultrasonic spot welded joints of aluminum to steel – By experimentation and artificial neural network, J. Manuf. Process., 30, 63–74, https://doi.org/10.1016/j.jmapro.2017.08.009, 2017.
- Abstract
- Introduction
- Experiment
- Friction coefficient
- Influence of curvature on friction coefficient
- Enhanced friction model
- Example of application
- Conclusions
- Appendix A: Calculation of bending/unbending force
- Appendix B: Friction coefficient formula for the curved surface
- Data availability
- Author contributions
- Competing interests
- Disclaimer
- Acknowledgements
- Financial support
- Review statement
- References