the Creative Commons Attribution 4.0 License.
the Creative Commons Attribution 4.0 License.
 | 24 Aug 2021
Modeling of additive height and numerical analysis of cooling parameters for aero blade remanufacturing
Shijie Dai
Tao Wang
Liwen Wang
Additive remanufacturing height and matching cooling parameters are the key factors affecting blade repair quality. First, the mathematical model of the single additive remanufacturing repair height and wire-feeding speed was established, the solution method was proposed and the numerical solution was obtained, and the validity of the model was verified by experiments. Then, based on the calculation results of a single additive remanufacturing repair, the geometric morphology of the cross section under double additive remanufacturing repair was analyzed, and the mathematical model was established. Second, based on the optimal parameters obtained by numerical analysis and the mathematical model, the fluid structure coupling heat transfer model of “blade fixture” for base channel cooling was established. The cooling effect of the typical section under different initial temperatures and different flow rates was calculated, and the coupled heat transfer in the process of blade remanufacturing was explained by the mechanism. Third, through the comparative analysis of the cooling effect, optimal cooling parameters of double additive remanufacturing repair were obtained, and the model of coupled heat flow was verified by experiment. The results showed that the mathematical model of additive remanufacturing height is effective for studying the thermal cycle and cooling effect of welding, and the cooling parameters obtained by numerical analysis can effectively guarantee the quality of double additive remanufacturing of blade repair.
- Article
(11333 KB) - Full-text XML
- BibTeX
- EndNote


Due to a long time of working in a high pressure and high temperature environment, coupled with grinding and impact with dust in the air, the compressor blades of aircraft engines are usually damaged to different degrees. The damage to the blade will affect the thrust and flight safety of the engine. Additive remanufacturing repair (hereinafter referred to as ARM-repair) is currently a recognized technology in aviation maintenance for blade tip damage within 2 mm (Chai et al., 2014). In civil aviation, the 4–9 stage compressor blades of the CFM56 series engine are made of Ni 718 alloy. Because of the advantages of good arc stability and low current, micro-beam plasma arc welding (MPAW) is very suitable for welding ultrathin alloys, which have become one of the main methods of blade ARM-repair (Liu et al., 2018; Wang et al., 2016). However, due to the ultrathin blade tip and poor thermal conductivity, the matching of increased ARM-repair height and the cooling parameters is a technical challenge in blade additive remanufacturing, which seriously affects the blade repair quality.
The additive remanufacturing of ultrathin alloy blades is equivalent to high quality surfacing. One of the main requirements for automatic additive remanufacturing is to know the shape and size of the deposited bead (Ding et al., 2015). Panchagnula and Simhambhatla (2018a) built a mathematical model that uses the values of the height and width of the first layer to predict the geometry of other layers. The model predicts the relationship between the geometry of the bead and key process parameters. Ding et al. (2016) also established the relationship between single bead geometry and welding process parameters through an artificial neural network (ANN) model. The increase in additive remanufacturing height will prolong the molten pool cooling time, which directly affects the weld seam quality (Zhao et al., 2011; Shen et al., 2020). Numerical modeling of the molten pool can provide predictions, not only for molten pool shape and deposited bead shape but also for the mass and heat transfer process, which is critical for understanding and control of the microstructure evolution of the deposited parts (Wu et al., 2017). For a nickel-based alloy, an excellent thermal cycle can effectively enhance the mechanical property of the weld seam. Excessive temperatures above the melting point could significantly increase the weld zone's grain size (Ram et al., 2005). Moreover, a molten pool's temperature fluctuation and cooling rate are also significant enough to influence the microstructure and properties of the weld zone (Baruah et al., 2016; Desai et al., 2014; Manvatkar et al., 2015). When the material thickness is small, the effect is more significant (Zhang et al., 2016; Gao et al., 2014). Ouyang et al. (2002) studied the microstructure characters and geometrical properties of deposited layers in rapid prototyping based on variable polarity gas tungsten arc welding, developing the relationships between the geometry of deposited layers and the process parameters. The results show that the microstructure of the weld zone is highly dependent on the related locations of deposited parts. Karimzadeh et al. (2006) established a sequential coupled thermomechanical model for the welding of a titanium alloy, based on the large displacement theory. They discovered the influence of heat input on the welding effect. Neela (2009) developed a three-dimensional finite element model to simulate heat transfer in the laser-engineered net shaping process and analyzed the process parameters' influence on peak temperature, thermal cycles, and molten pool dimensions.
In addition to overall heat transfer characteristics, fluid heat transfer of the cooling medium is also a factor worth studying in additive remanufacturing of ultrathin superalloys (Qu et al., 2002; Wu et al., 2011). It is beneficial to improve the quality of welding when the temperature and cooling time of the molten pool is controlled in an acceptable range (Manvatkar et al., 2015). Manikandan et al. (2014a, b) investigated the effect of cooling efficiency on the formation of Laves phase of Inconel 718 in the melting zone under tungsten inert gas (TIG) welding, applying constant current and composite current pulse modes and calculating the cooling rate. Sun et al. (2016) studied three cooling methods of air cooling, copper block cooling, and spray cooling and point out that reasonable control of the cooling rate is helpful to ensure the quality of the welded joint. By analyzing the latest active thermal management technologies (Wang et al., 2020a) and oriented spray cooling technology (Wang et al., 2020b, c), Wang et al. (2018) proposed a gas-atomized spray cooling system integrated with an ejector loop and applied the cooling method with micro-structured surfaces.
A compressor blade is a kind of ultrathin alloy which has higher requirements for temperature control and cooling of the molten pool, and the repair process is more complicated. Repair height and cooling parameters significantly influence the thermal cycle of the molten pool, which are the key factors affecting the repair quality of ultrathin alloy blades. In this paper, through establishing the mathematical model, the solutions of single ARM-repair height are obtained in Sect. 2. Then, the validity of the model was verified by experiments in Sect. 3. Based on the results of Sects. 2 and 3, the geometric morphology of the cross section under double additive remanufacturing repair was analyzed, and the mathematical model was established in Sect. 4. Then, the finite element model (Sect. 5) and the calculation of model parameters (Sect. 6) are carried out. Through numerical analysis and discussion, the matching cooling parameters were obtained in Sect. 7. The metallographic experiment (Sect. 8) further confirmed the validity of the study. The study can provide scientific theoretical support for blade ARM-repair height and related cooling parameters and positively improve blade repair technology.
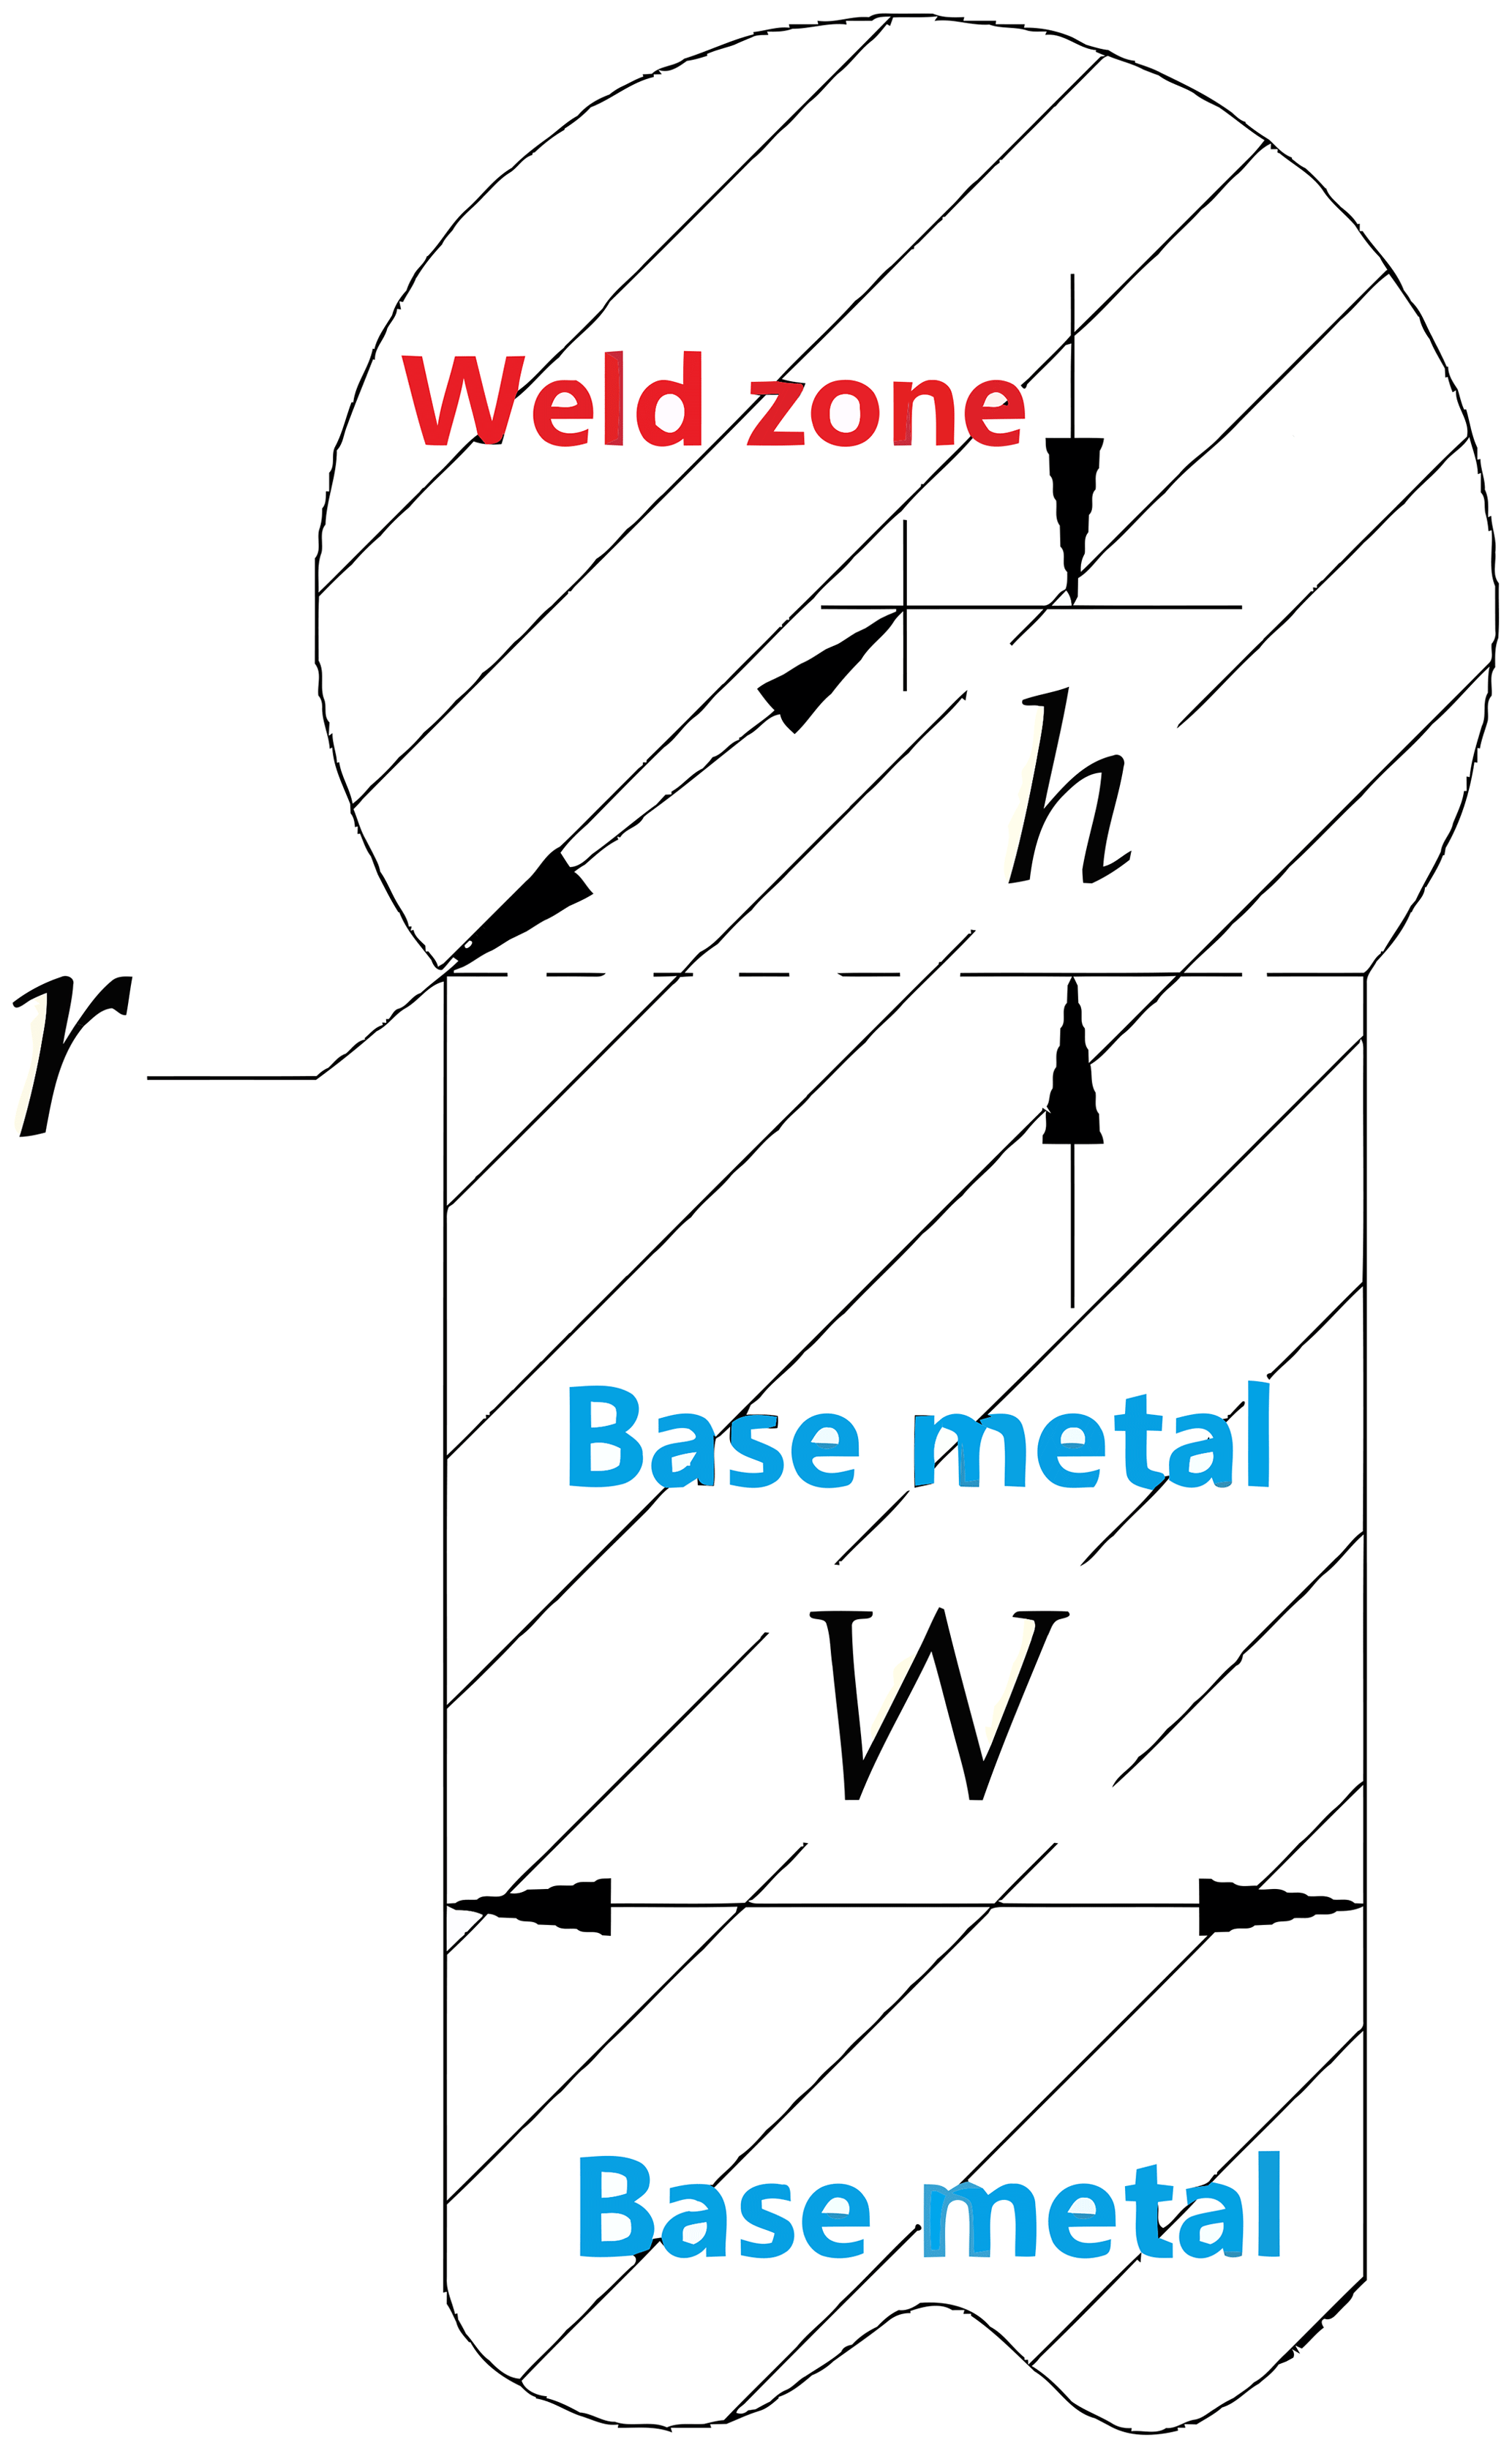
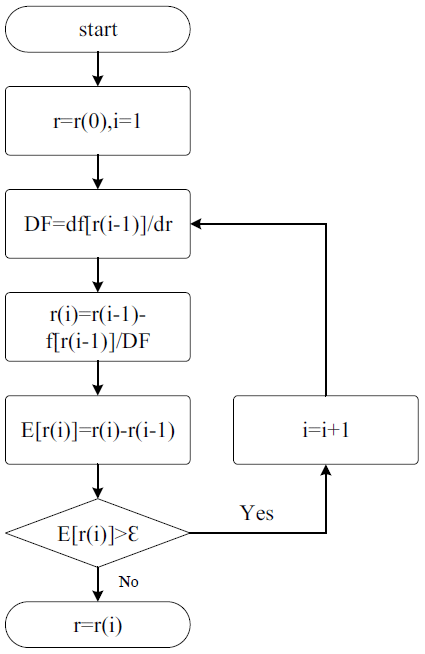
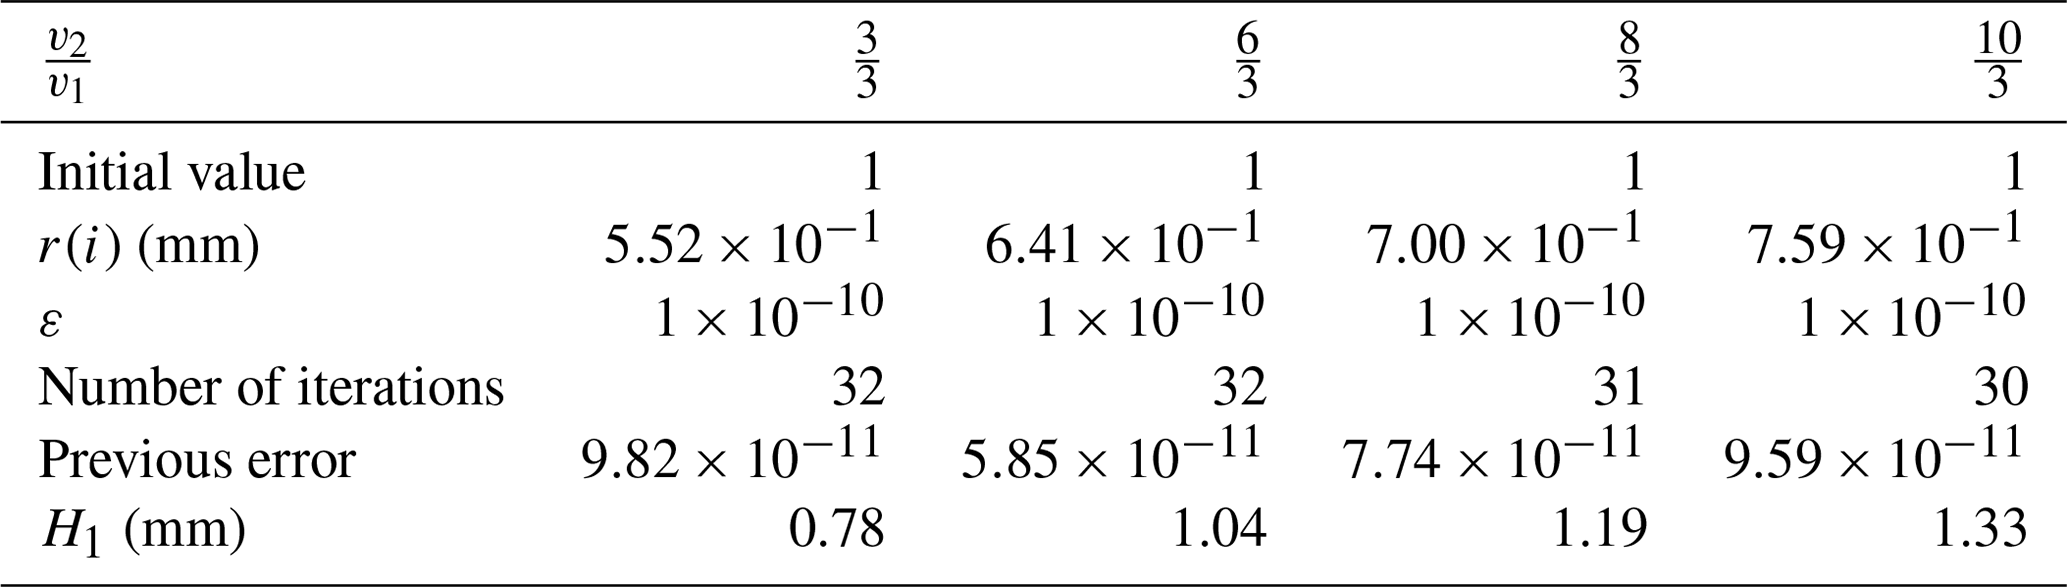
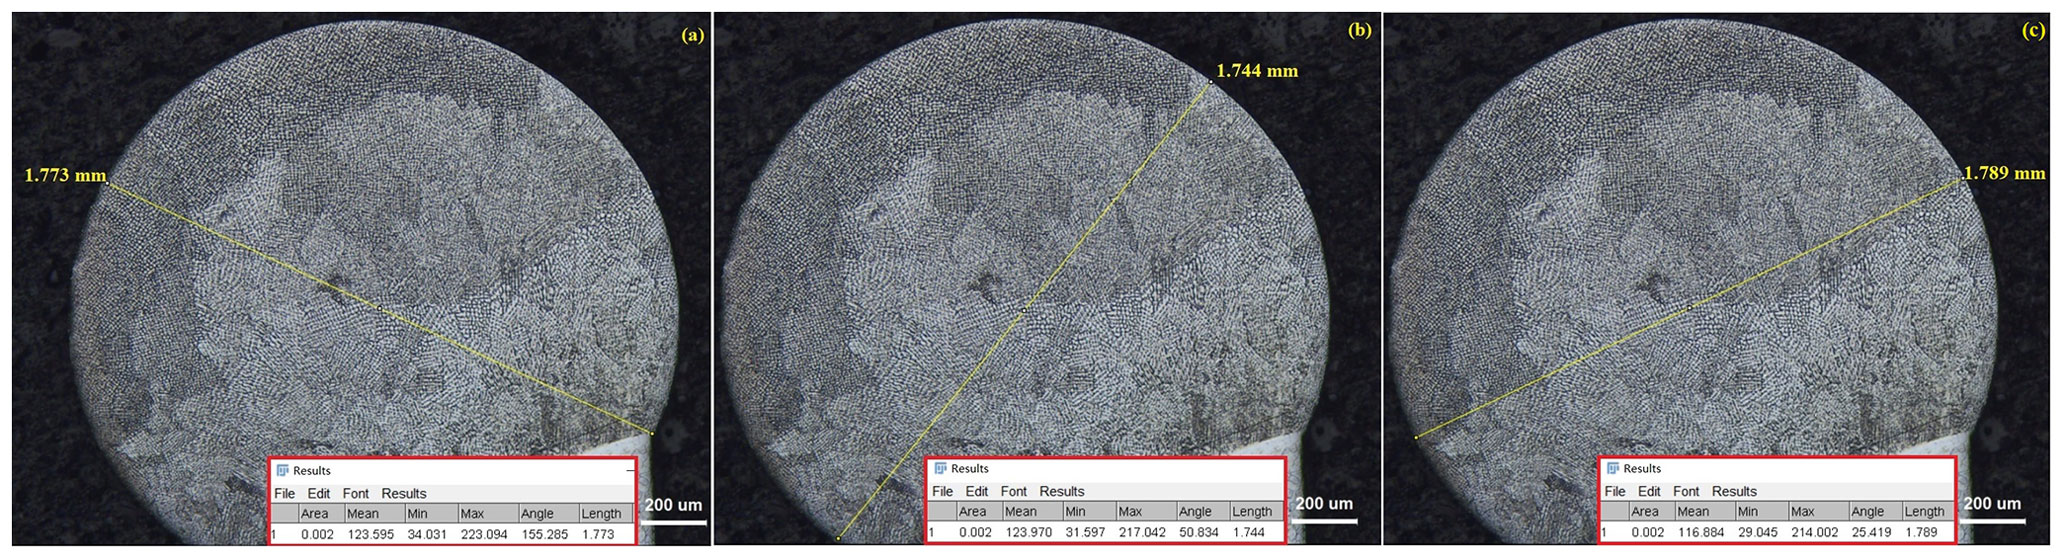
Figure 3Cross section morphology of additive zone with wire-feeding speed of 8 in min−1 (3.39 mm s−1).
After ARM-repair by the MPAW automatic system, the cross section morphology of the blade is shown in Fig. 1.
Benefitting from the excellent and stable heat input of the MPAW automatic machine, the shape of the cross section increases evenly as the wire-feeding speed increases, and an approximate circle with radius r is formed on the base metal. In Fig. 1, where h is defined as the height of the ARM-repair part, W is defined as the width of base metal. Despite the mass loss due to evaporation in melting and solidification, based on the theory of mass conservation, the relationship of the parameters can be expressed by Eq. (1) as follows:
where L is the length of test piece, R is the wire radius, v1 is the welding speed, and v2 is the wire-feeding speed. In this study, it is known that w=1 mm, R=0.4 mm, and v1=3 in min−1 (1.27 mm s−1), and v2 is set to 3 in min−1 (1.27 mm s−1), 6 in min−1 (2.54 mm s−1), 8 in min−1 (3.39 mm s−1), and 10 in min−1 (4.24 mm s−1), respectively, so that, in the following:
Let r be an iterative variable. For the difficulty in derivation, Eq. (1) can be written as follows:
The first derivative of r on both sides of the Eq. (3) is obtained as follows:
and is set as follows:
where A and B represent the equations in two braces on the right side of Eq. (5), respectively. With the first derivative for r, Eq. (5) is obtained as follows:
Since it is difficult to obtain the analytical solution of Eq. (6), the Newton iteration method is used to calculate the numerical solution. The solution steps are shown in Fig. 2, where ε is the calculation accuracy. In addition, the single ARM-repair height H1 can be obtained as follows:
After calculation, the numerical solutions are shown in Table 1. According to the ARM-repair height and wire-feeding speed calculation results, the ARM-repair height is low at 3 in min−1 (1.27 mm s−1), and it may need several rounds of ARM-repair to meet the requirements of the height, which leads to low efficiency and increases process difficulty. ARM-repair height is high at 10 in min−1 (4.24 mm s−1), which requires significant heat input and is not conducive to the rapid cooling of the molten pool. With the frequency increase in ARM-repair for ultrathin blades, the technical difficulty increases, and the repair quality decreases. Therefore, the ideal repair height is slightly higher than 1 mm (before grinding). The ARM-repair height produced by wire-feeding speed of 6 in min−1 (2.54 mm s−1) and 8 in min−1 (3.39 mm s−1) is more suitable from the calculation data.
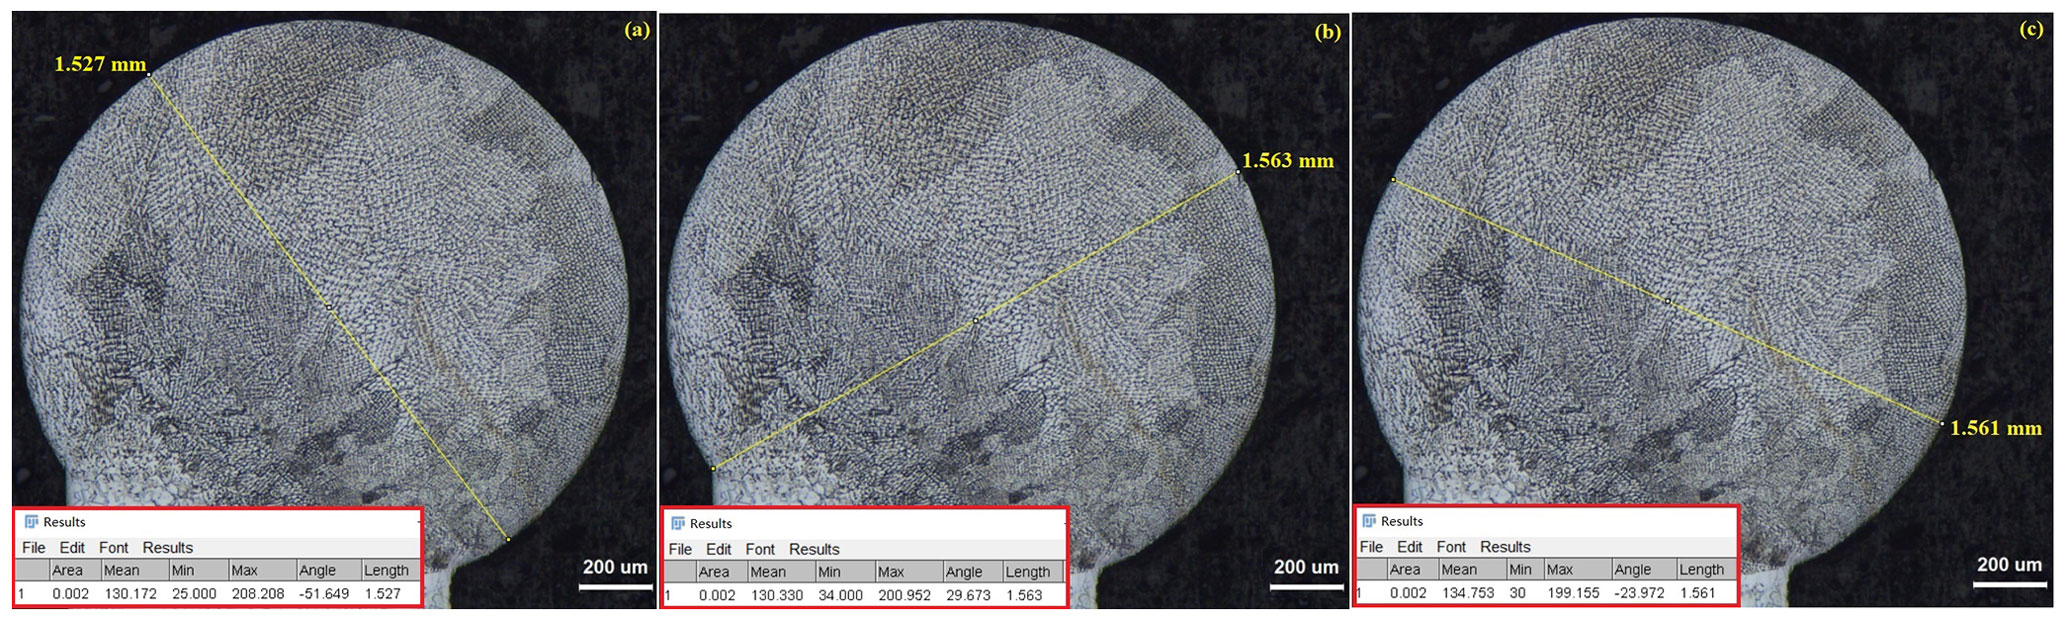
Figure 4Cross section morphology of additive zone with wire-feeding speed of 6 in min−1 (2.54 mm s−1).
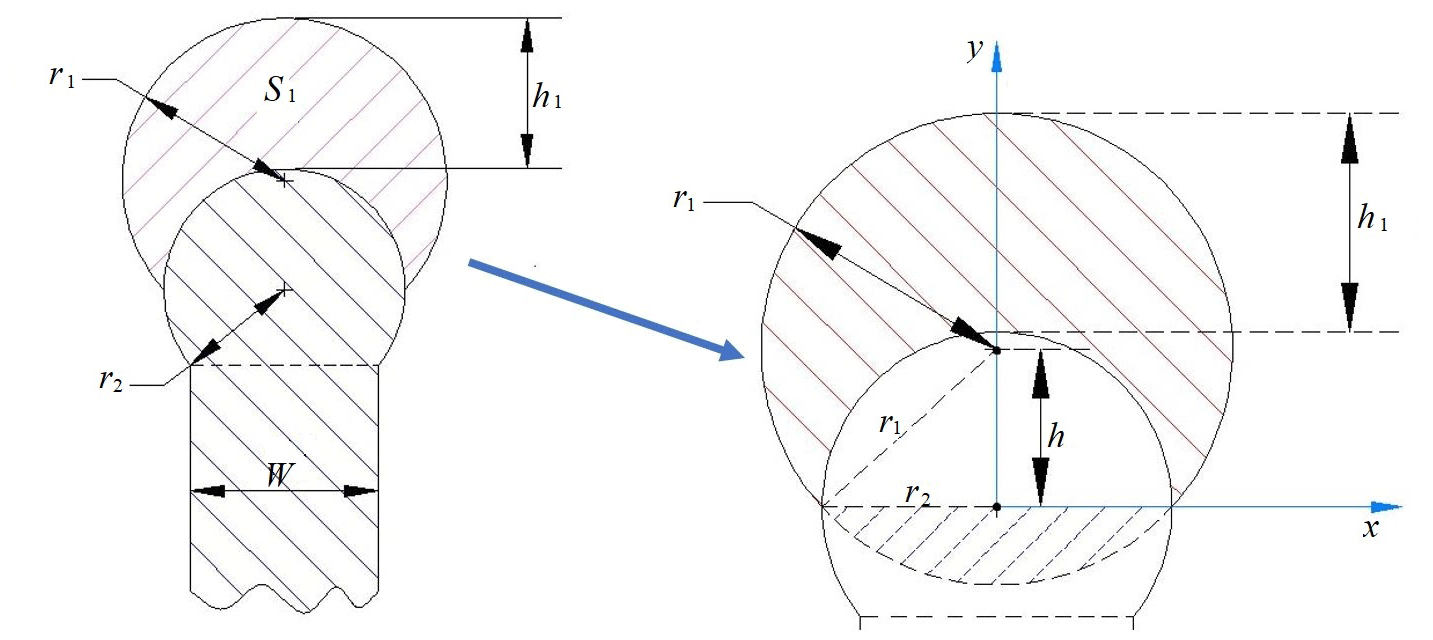
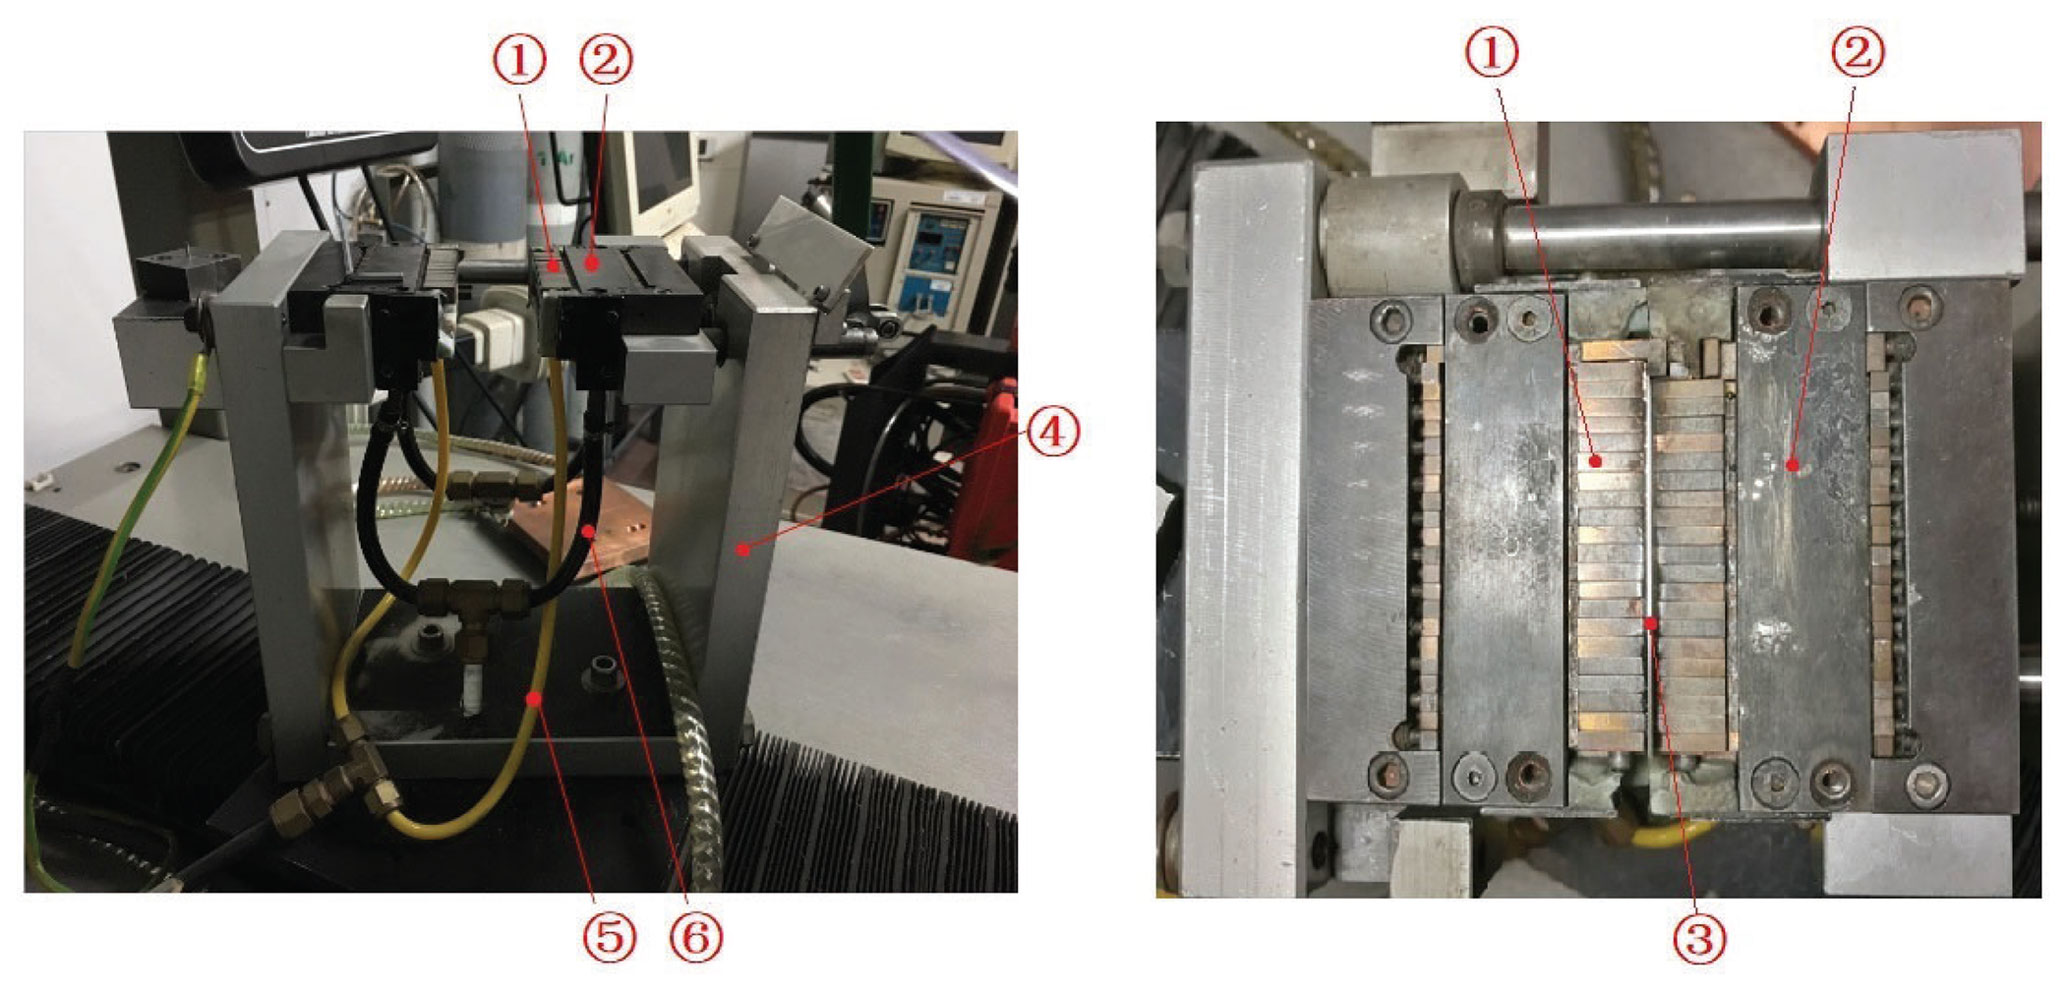
Figure 6The structure of MPAW fixture. ➀ Copper bonds. ➁ Clamping structure. ➂ Inconel 718 test piece. ➃ Aluminum frame. ➄ Shield gas channel. ➅ Cooling water channel.
In the experiment, the thickness of the Inconel 718 test piece is w=1 mm, and the radius of the welding wire is R=0.4 mm. After surfacing, the cross section morphology of single ARM-repair area under different wire-feeding speeds is shown as Figs. 3 and 4. Because the test piece is very thin, there is a certain degree of horizontal error in the manual polishing of the upper surface before welding, so the morphology after surfacing has a certain degree of tilt. According to the experimental parameters obtained from previous studies (Gong et al., 2019; Dai et al., 2020a), the cross section morphology of the additive zone of two kinds of wire-feeding speeds (6 in min−1 (2.54 mm s−1) and 8 in min−1 (3.39 mm s−1)) was measured by software.
The results show that, although the cross sectional morphology is inclined to a certain extent, the roundness of the additive morphology of the two wire-feeding speeds is good, which is consistent with the theoretical model. A morphology of 6 in min−1 (2.54 mm s−1) is better than 8 in min−1 (3.39 mm s−1).
In terms of error size, the diameter of the additive zone is about 1.7 mm at 8 in min−1 (3.39 mm s−1) wire-feeding speed, and 1.5 mm at 6 in min−1 (2.54 mm s−1) wire-feeding speed. Compared with 2r(i) of the theoretical model, the actual diameter increases by 0.3 and 0.25 mm respectively, which shows that the error is much more minor at a wire-feeding speed of 6 in min−1 (2.54 mm s−1).
In terms of error ratio, the error ratio is close to that of the wire-feeding speed. The causes of the error can be judged as follows: the smoothness and flatness of the ARM-repair surface, the theoretical model adopting the same density of the base metal and welding wire, and the possible density change in the welding wire and the base metal after fusion. Moreover, the latent heat and mass loss is also a possible reason for the errors.
The additive zone's ideal morphology and repair height are achieved, which will lay a good foundation for the next stage of blade repair technology. The results show that the cross section morphology is in good agreement with the theoretical model in the overall trend, which verifies the effectiveness of the theoretical model.
According to the repair requirements, the repair height of the second additive remanufacturing is about 0.8–1 mm, and the diameter of the first additive part needs to be covered by the second part. The ideal cross section after the second additive repair is shown in Fig. 5, where S1 represents the cross-sectional area of the second additive material after repair, h1 represents the height of the second additive material, r1 represents the large circle radius of the second additive material, r2 represents the small circle radius of the section of the first additive material, and W represents the thickness of the test piece.
The MPAW automatic system can achieve good wire-feeding accuracy. Despite the mass loss due to evaporation in melting and solidification, according to the law of conservation of mass, the relationship between the second wire-feeding speed v and cross-sectional area S1 can be expressed as follows:
where ρ is the density of the welding wire, the length of the test piece is L=65 mm, v is the wire-feeding speed, the radius of the welding wire is r0=0.4 mm, the welding time is t=50 s, and S1 is the cross-sectional area of the second pass. According to the solution of the mathematical model of single ARM-repair height in Table 1, select a single ARM-repair height corresponding to the wire-feeding speed of 6 in min−1 (2.54 mm s−1) as the research object.
It is known that r2=0.64 mm; when considering the lower thermal conductivity of Inconel 718 to facilitate the heat dissipation of the molten pool, the height of double the ARM-repair is 0.8 mm. Therefore, the calculation process of double the ARM-repair cross-sectional area is as follows:
When solved after substitution, h=0.58 mm, and mm.
Take the position of the center of the small circle as the origin of the coordinate to establish the coordinate system in Fig. 5, and then the small circle equation is as follows:
The big circle equation is as follows:
Therefore, let S0 represent the common area of the two circles; then, in the following:
When we solve after the substitution, and .
For , let x=0.64sin t; then dx=0.64cos tdt. When x=0, let t=0, and when x=0.64, let , which is then solved as .
For , let x=0.86sin t; then dx=0.86cos tdt. When x=0, let t=0, and when x=0.64, let , which is then solved as .
After calculation, the common area of the two circles is S0=0.888 mm2. With Eq. 14, we determine the following:
The solutions are S1=1.4464 mm2. By substituting into Eq. (8), the wire-feeding speed of the double additive remanufacturing repair is v≈3.8 mm s−1 (9 in min−1).
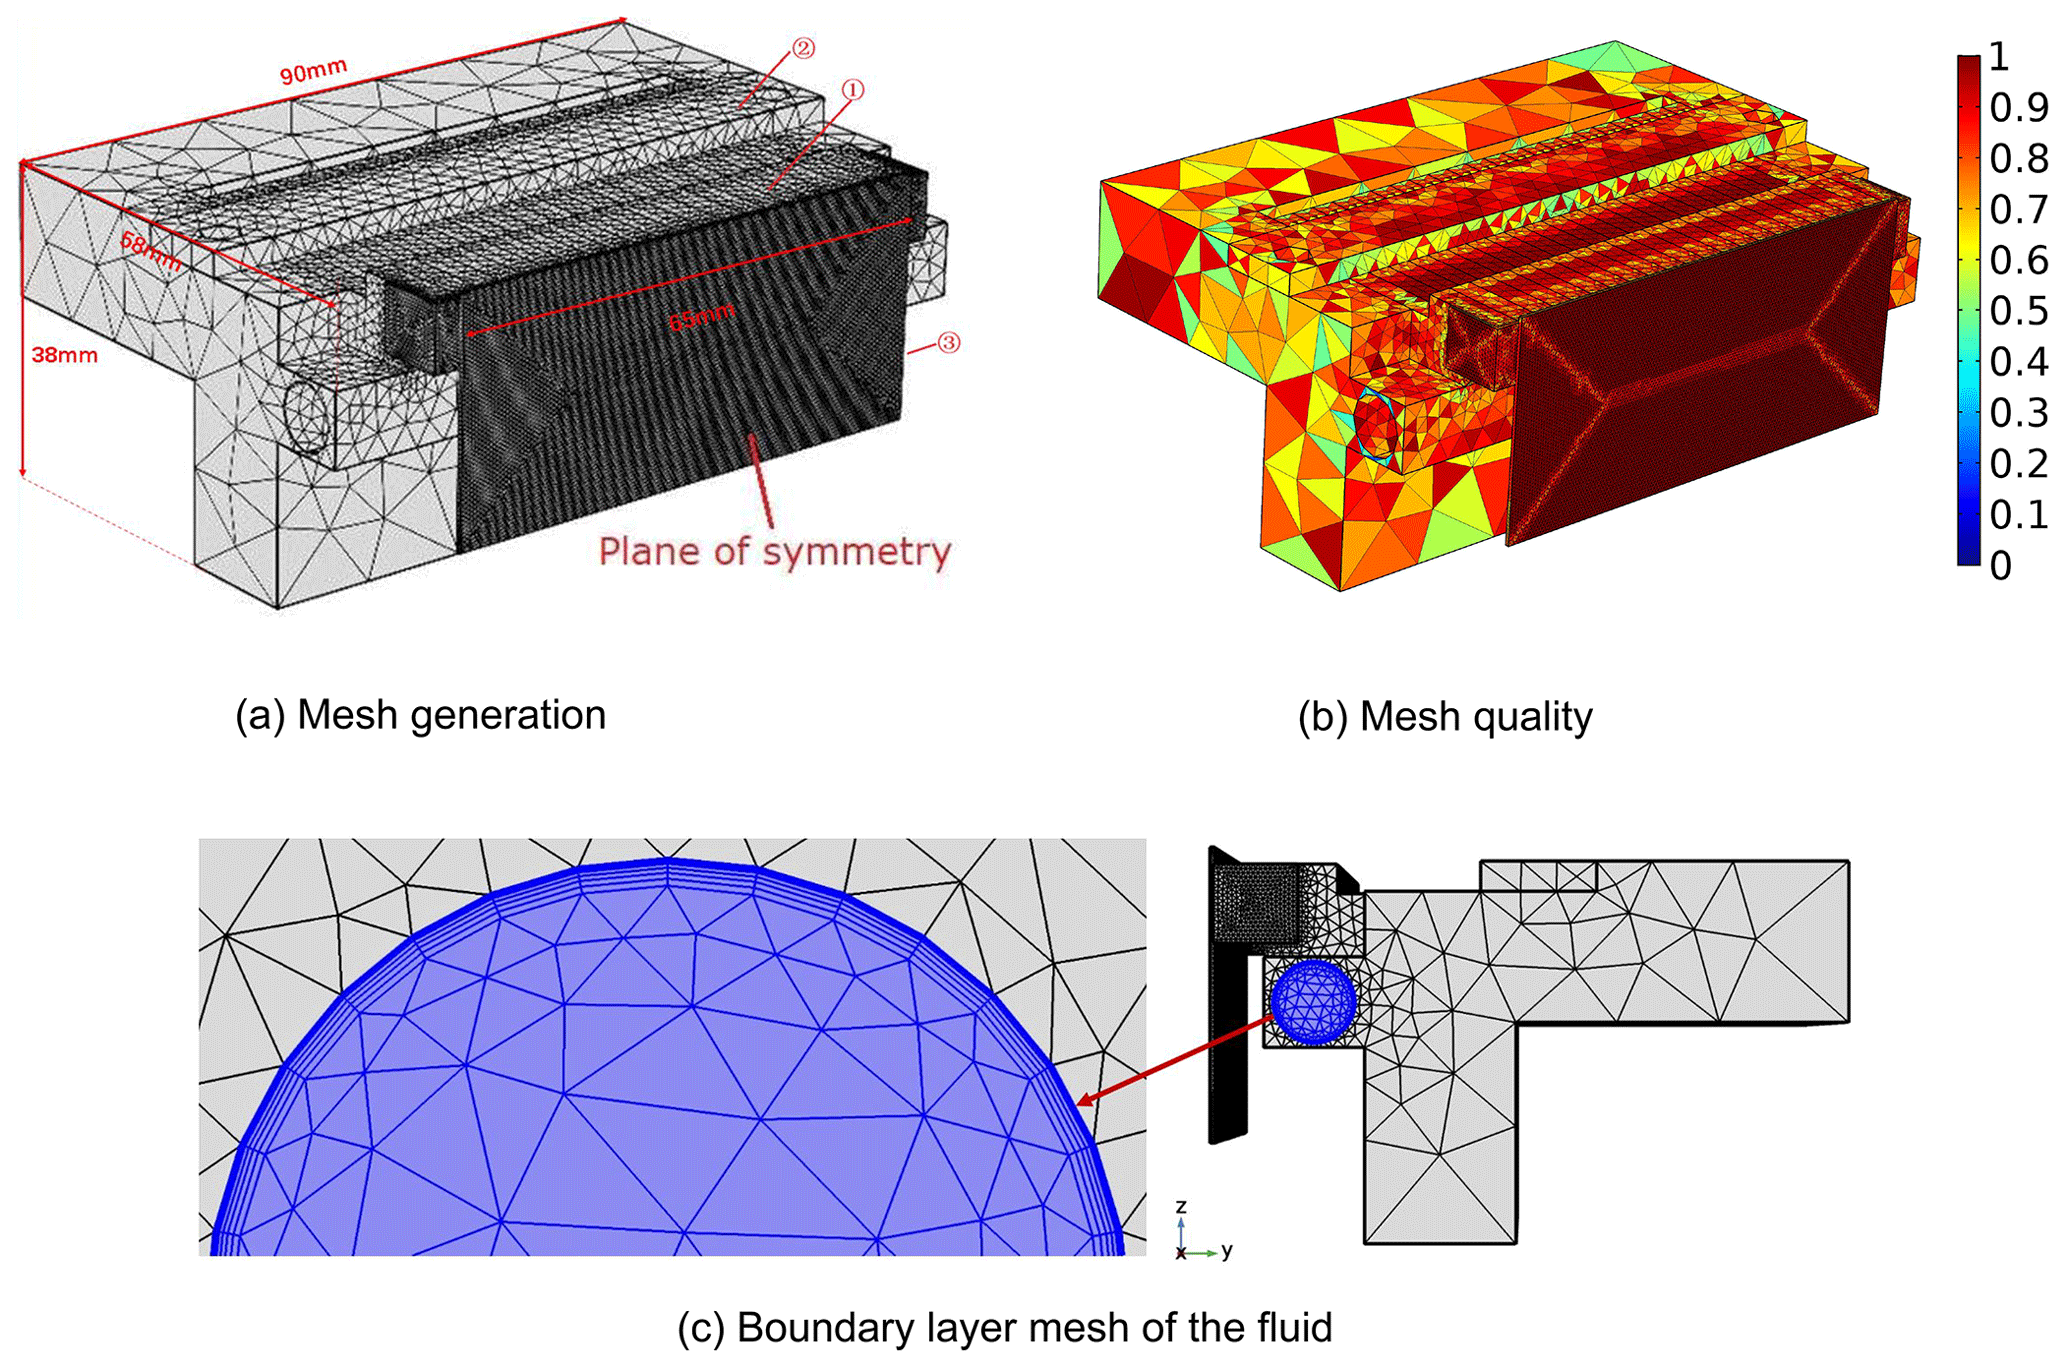
Figure 7Meshing and mass distribution. (a) Mesh generation. (b) Mesh quality. (c) Boundary layer mesh of the fluid.

Figure 8Fluid boundary conditions and initial value step function. (a) Fluid boundary conditions and initial values. (b) Initial value step function.
The structure of the MPAW repair fixture is shown in Fig. 6. It mainly comprises an aluminum frame and a copper heat-dissipation clamping structure, which is equipped with two rows of movable cooling copper bonds. To simplify the calculation, considering that the aluminum frame is not involved in heat dissipation, only the structures involved in clamping and heat dissipation are modeled. The curvature of the ultrathin blade tip is small after being clamped. In this study, an Inconel 718 alloy sheet () was used for simulations and experiments.
For symmetric structures, the method of symmetry plane can simplify many of operations in COMSOL. The symmetry plane is defined as the cross section in the x axis direction of the Inconel 718 alloy test piece. After meshing, the meshing and mesh quality is shown in Fig. 7. It is shown that the dense mesh was applied to the ARM-repair surface of the Inconel 718 alloy test piece. Similarly, it is also applied to the primary heat transfer surface of the copper bonds. The coarse mesh is applied to the rest of the structure. The unit number of the grid is 215 852. The smallest unit size and the maxima are and 1.79 mm, respectively. The maximum unit growth rate is 1.3, and the grid quality of important heat transfer parts is close to 1. For the fluid mesh, boundary layer mesh is applied to the wall of the fluid part of the fixture. The stretch factor is 1.2, and the thickness adjustment factor is 1. The boundary layer mesh of the fluid part is shown in Fig. 7c.
In this paper, the coupled heat transfer model is mainly composed of solid heat transfer and fluid heat transfer. The model equations can be referred to in our previous research (Gong et al., 2021). In addition, for heat conduction in the microstructure, the effect of thermal resistance on the overall heat transfer should be considered (Wang et al., 2021). Due to the temperature of the contact surfaces between the copper bonds and the blade being less than 427 ∘C, the thermal radiation resistance can be neglected (Bahrami et al., 2004a). The thermal contact resistance model can be seen to in other works (Zheng et al., 2014; Shi et al., 2018; Tariq et al., 2016; Yovanovich et al., 2006; Grujicic et al., 2005; Bahrami et al., 2004b) and our previous research (Dai et al., 2020b).
The fluid calculation parameters are brought into the model parameter setting conditions, establishing a “blade fixture” solid heat transfer and fluid heat transfer coupling model, and the fluid boundary conditions are shown in Fig. 8a.
-
Tap water at 10 ∘C was used. The fluid property is incompressible.
-
The inlet of the flow channel is on the right side of the fixture. The four velocities are converted to the normal velocity of the cross section for velocity boundary conditions.
-
The outlet of the flow channel is on the left side of the fixture, and has adopted the pressure boundary condition. Assuming there is no backflow, the outlet pressure is set to 0 Pa.
-
There is no slip of the wall boundary condition.
Due to the boundary conditions of the fluid, the velocity value at the beginning of the simulation is This does not match the initial velocity value u=0 m s−1 in the flow channel. The transient solver will start to calculate the solution based on these initial values, leading to the convergence of the calculation results. In order to solve the consistency problem of the initial value of fluid in modeling, a step function is defined, as shown in Fig. 8b. Let the time derivatives of the function at the beginning of the smoothing region be 0. Based on the consistency of initial values, the loads and boundary conditions on the transient model are gradually increased. The command expression of velocity field U0 is U0=V1 × step 1(t [s−1]) at the start-up stage, when the inlet velocity or pressure difference increases gradually. In order to solve the numerical fluctuation of k and ε in this period, the default time solver of the k–ε model adopts an uncalibrated absolute tolerance for k and ε. The tolerance is set to the following:
where Uscale and Lfact are the input parameters in the advanced setting part of the COMSOL physical interface node, and their default values are 1 m s−1 and 0.035, respectively. lbb, min is the shortest edge of the geometry bounding box.
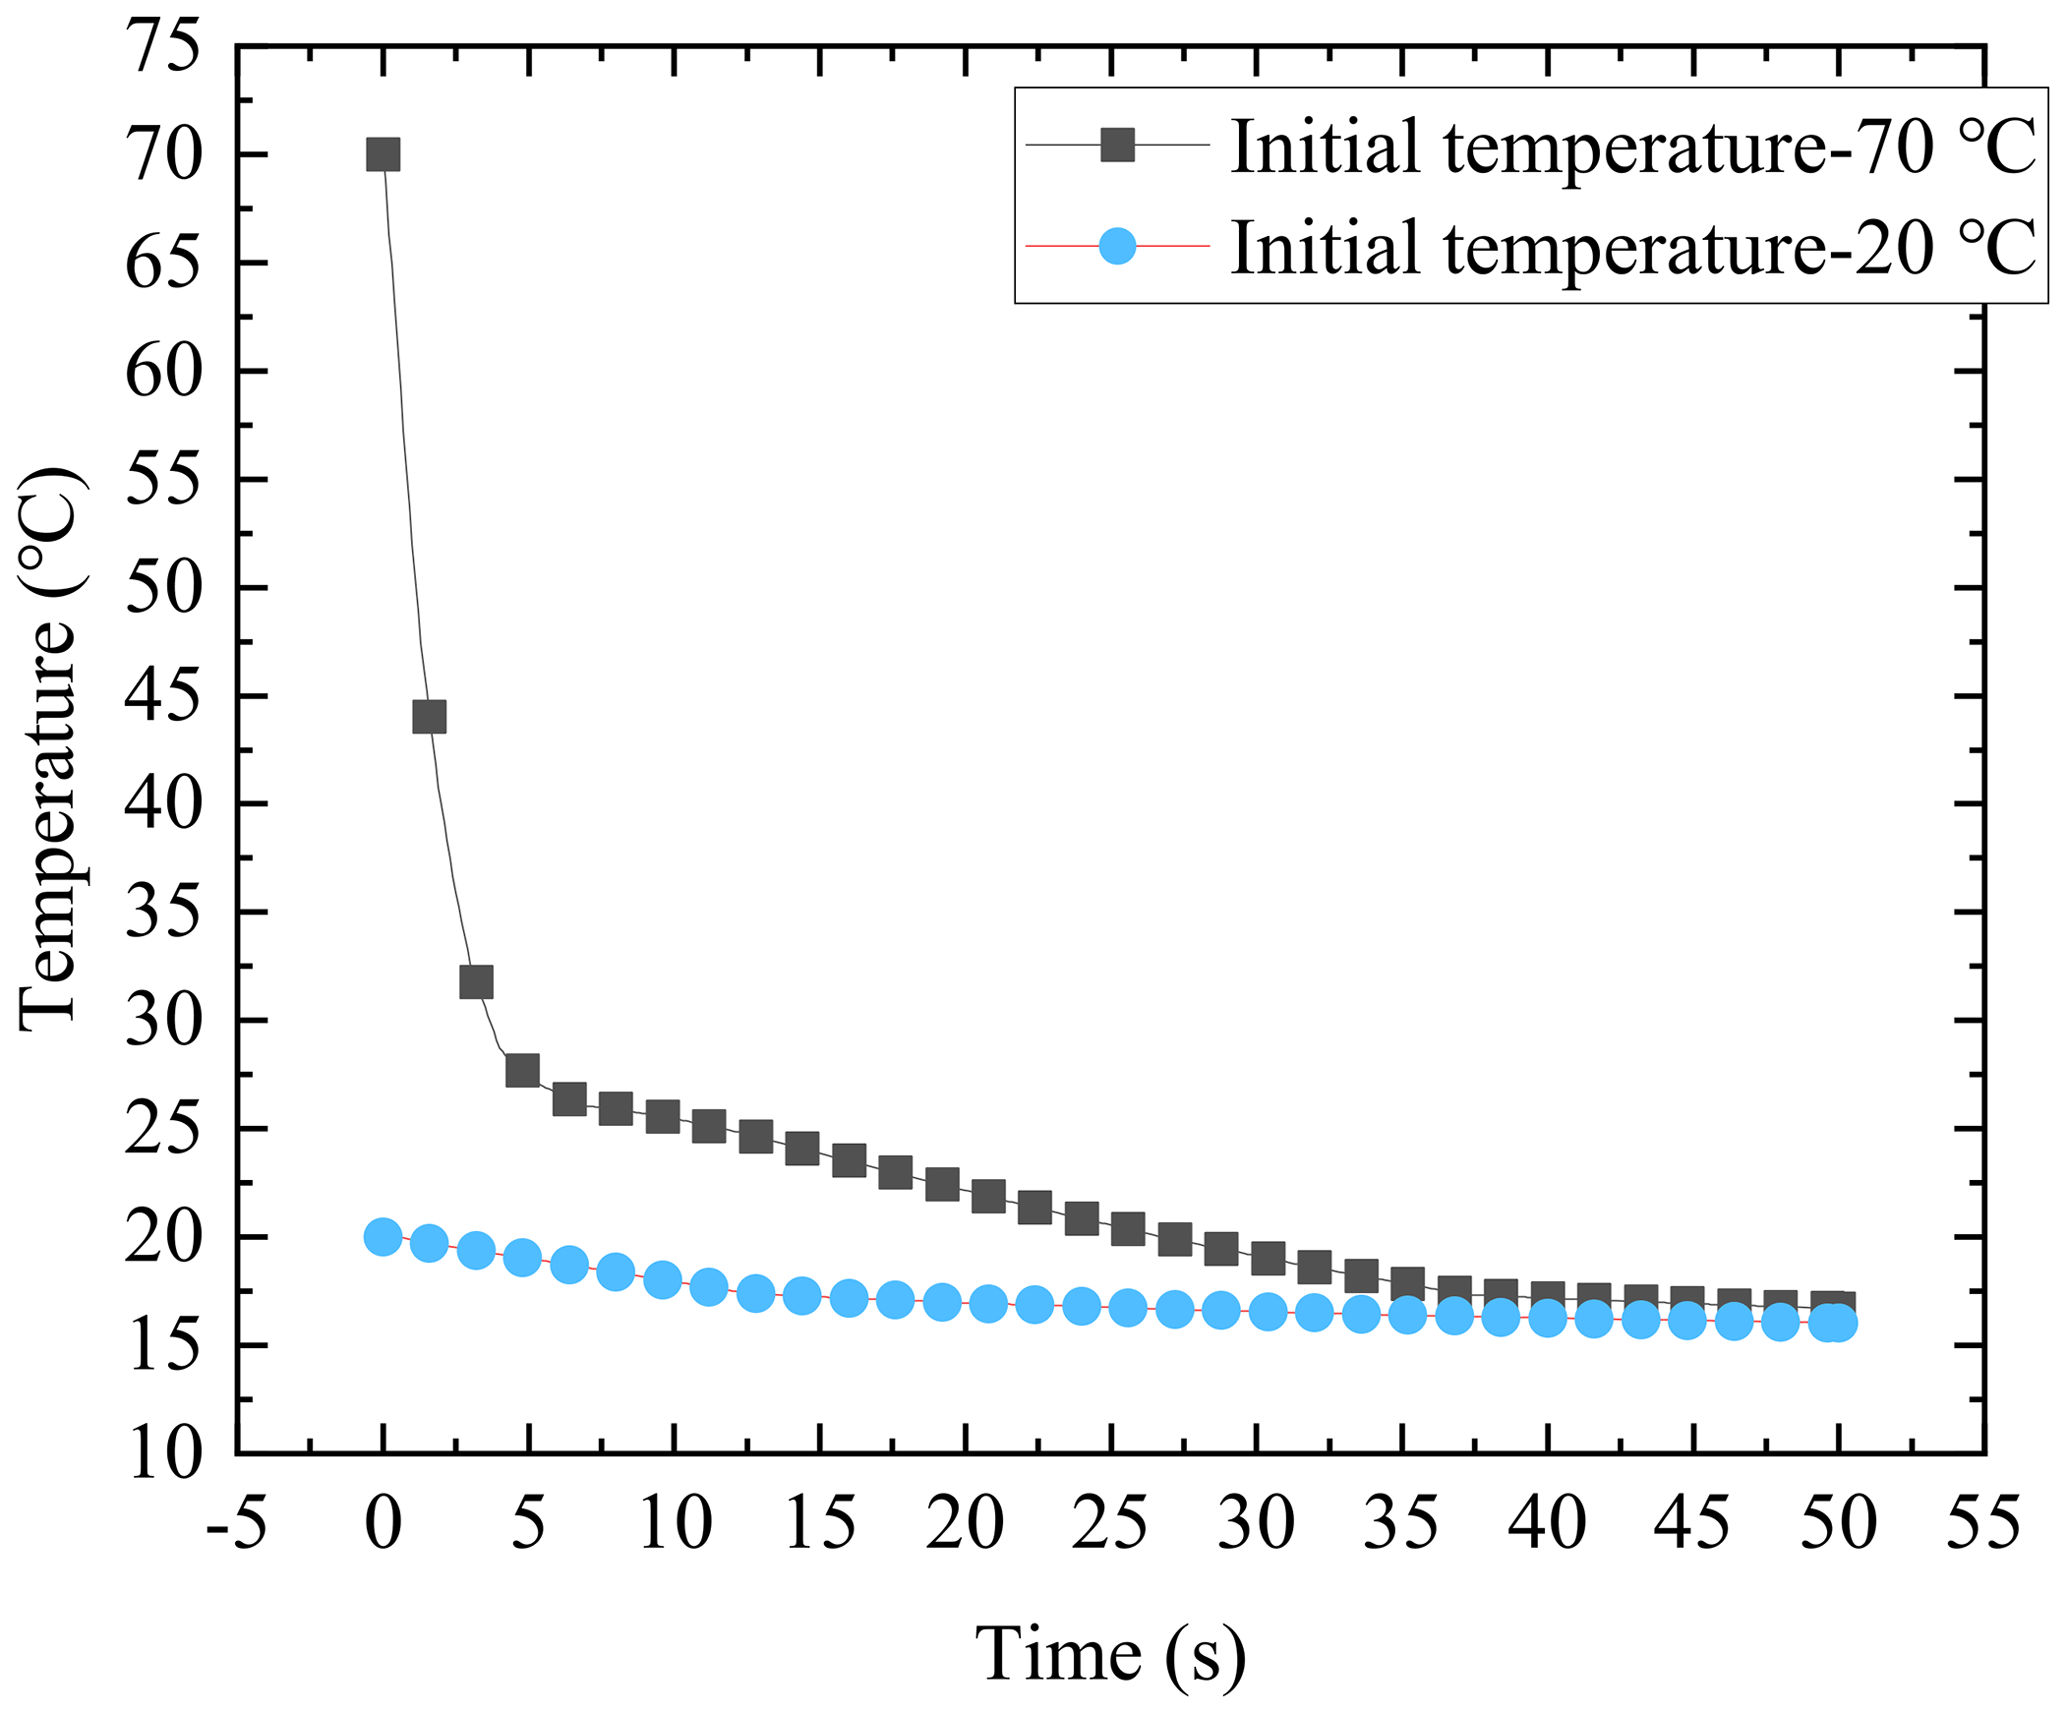
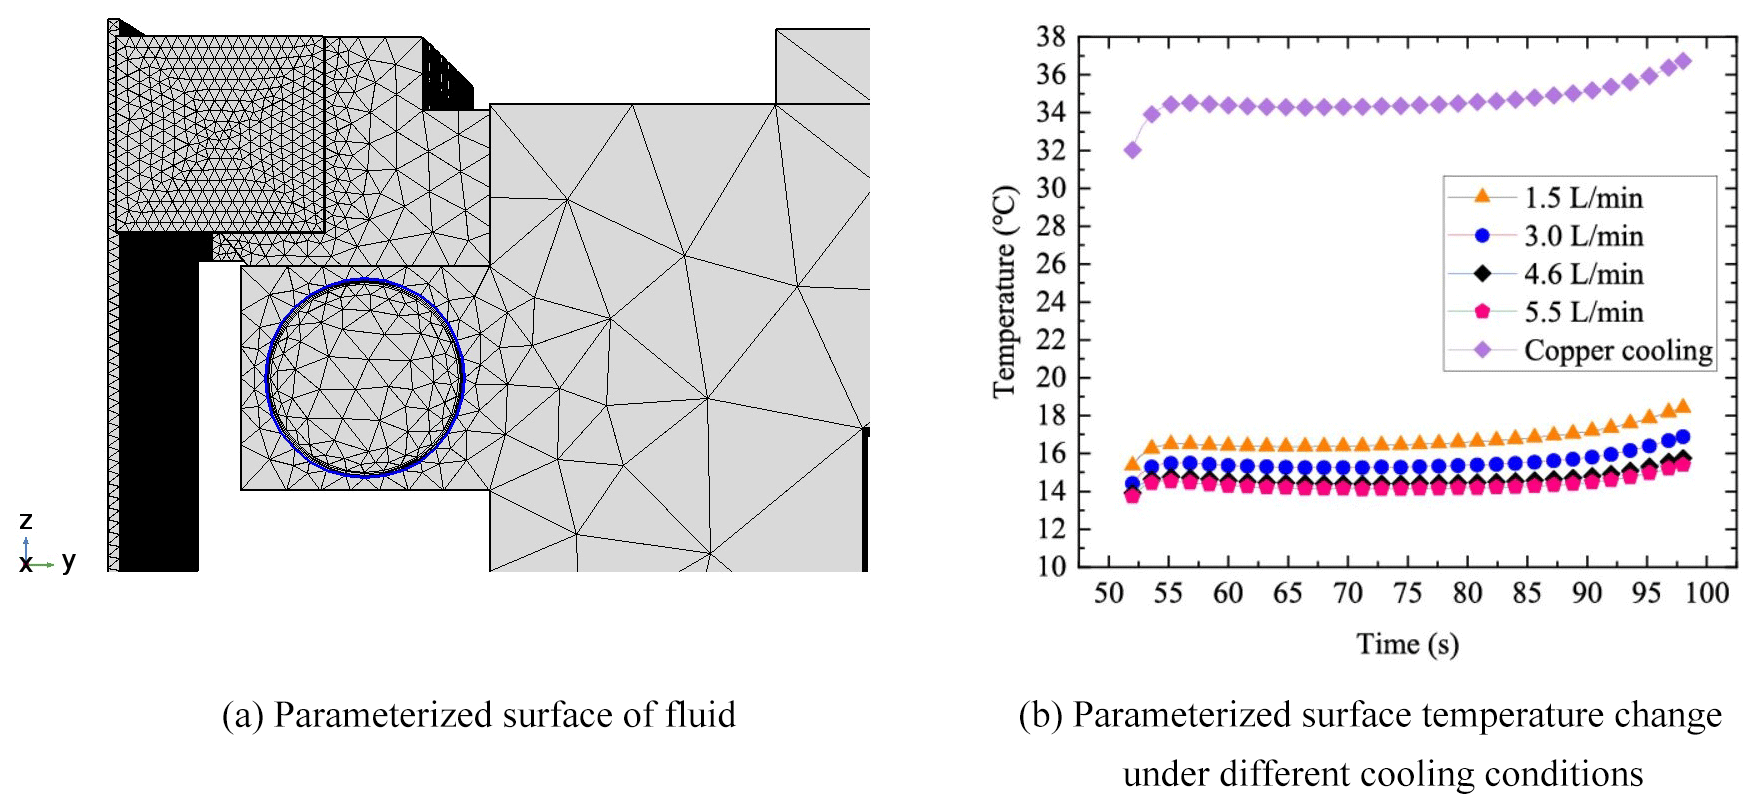
Figure 11The parameterized surface of the fluid. (a) Parameterized surface of fluid. (b) Parameterized surface temperature change under different cooling conditions.
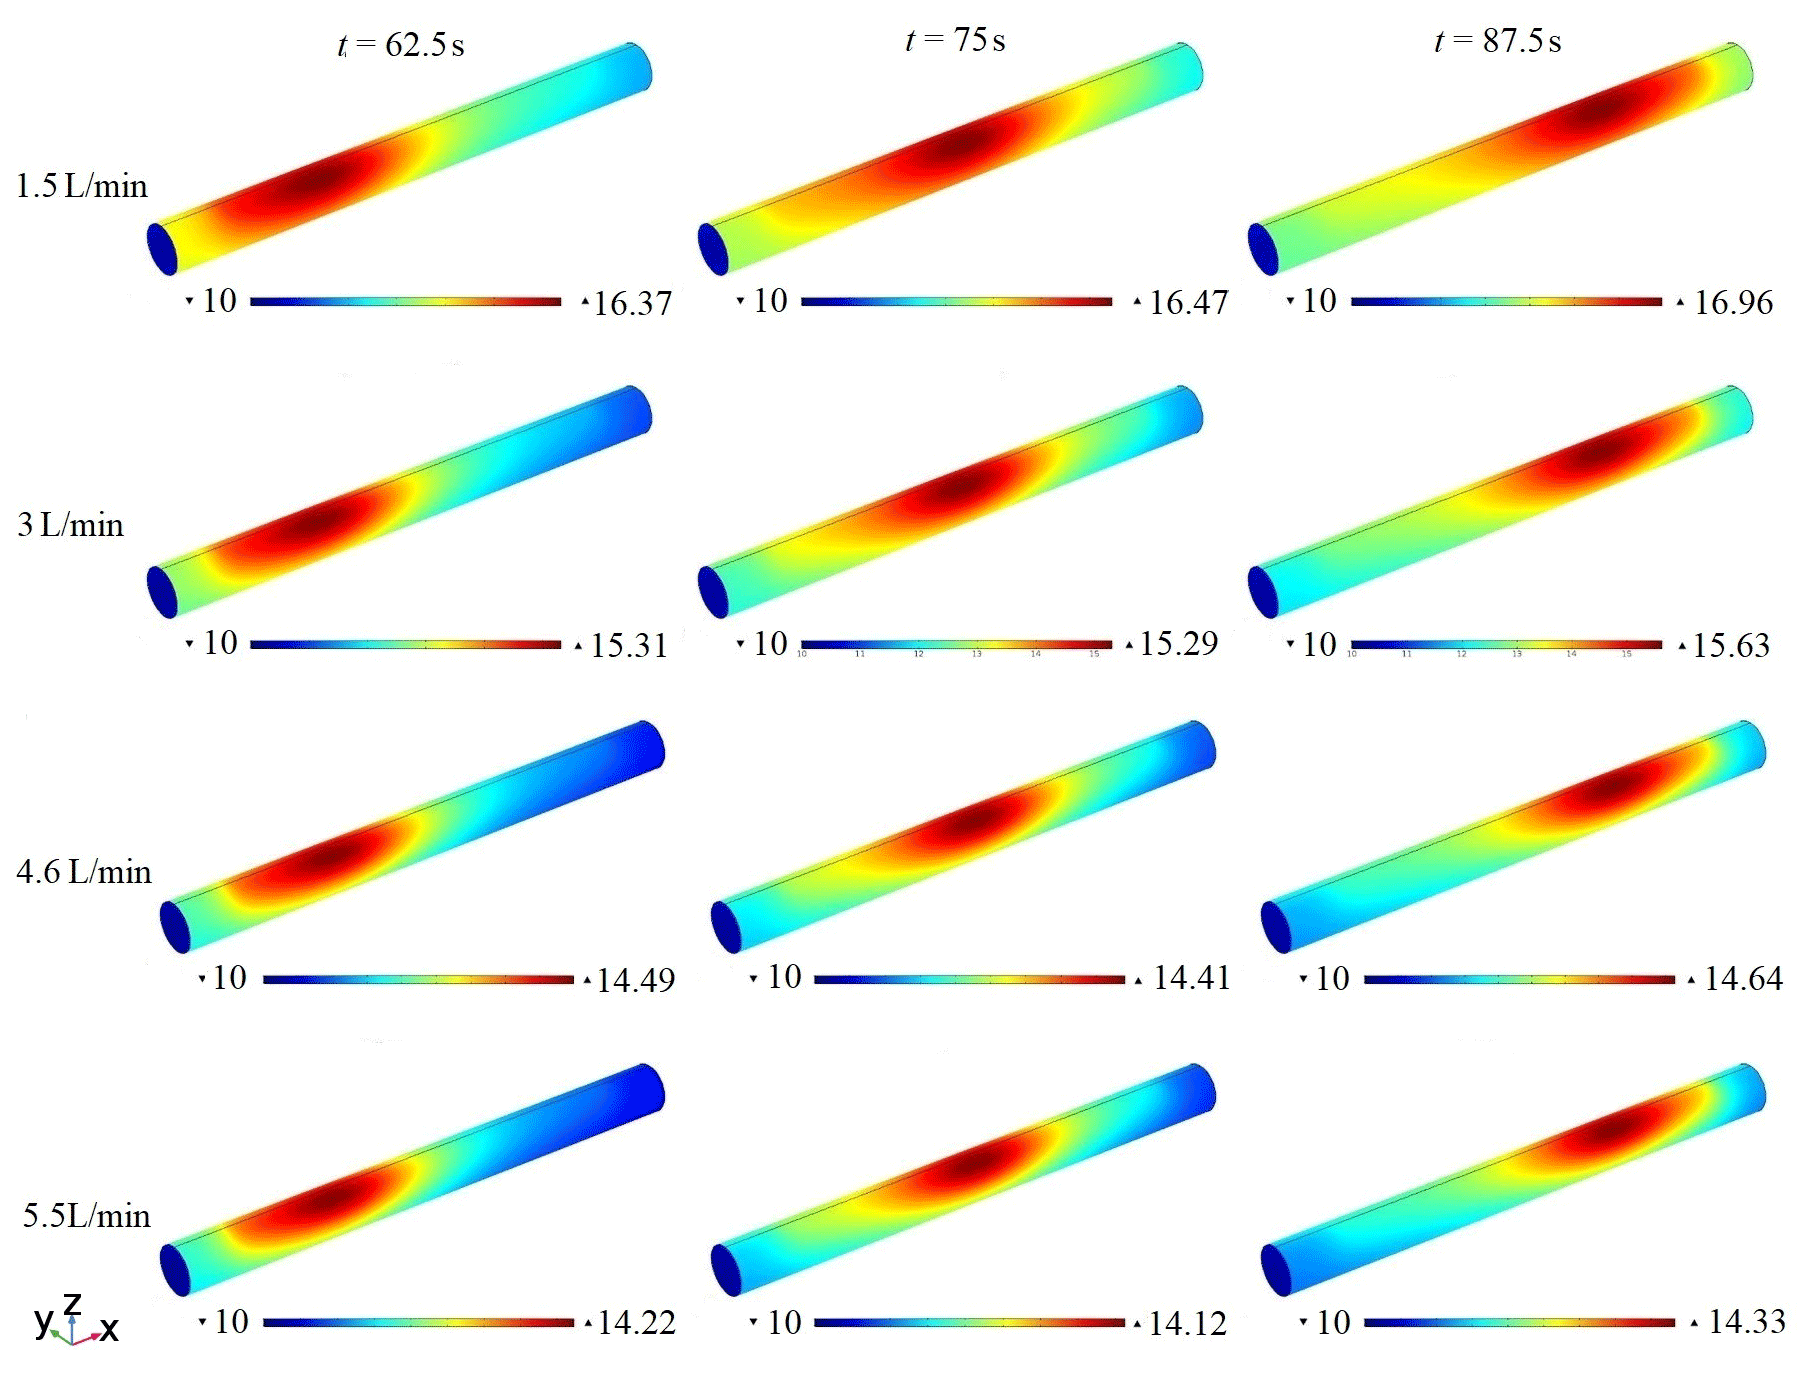
Figure 12Typical transient temperature distribution of fluid surface at different flow rates.
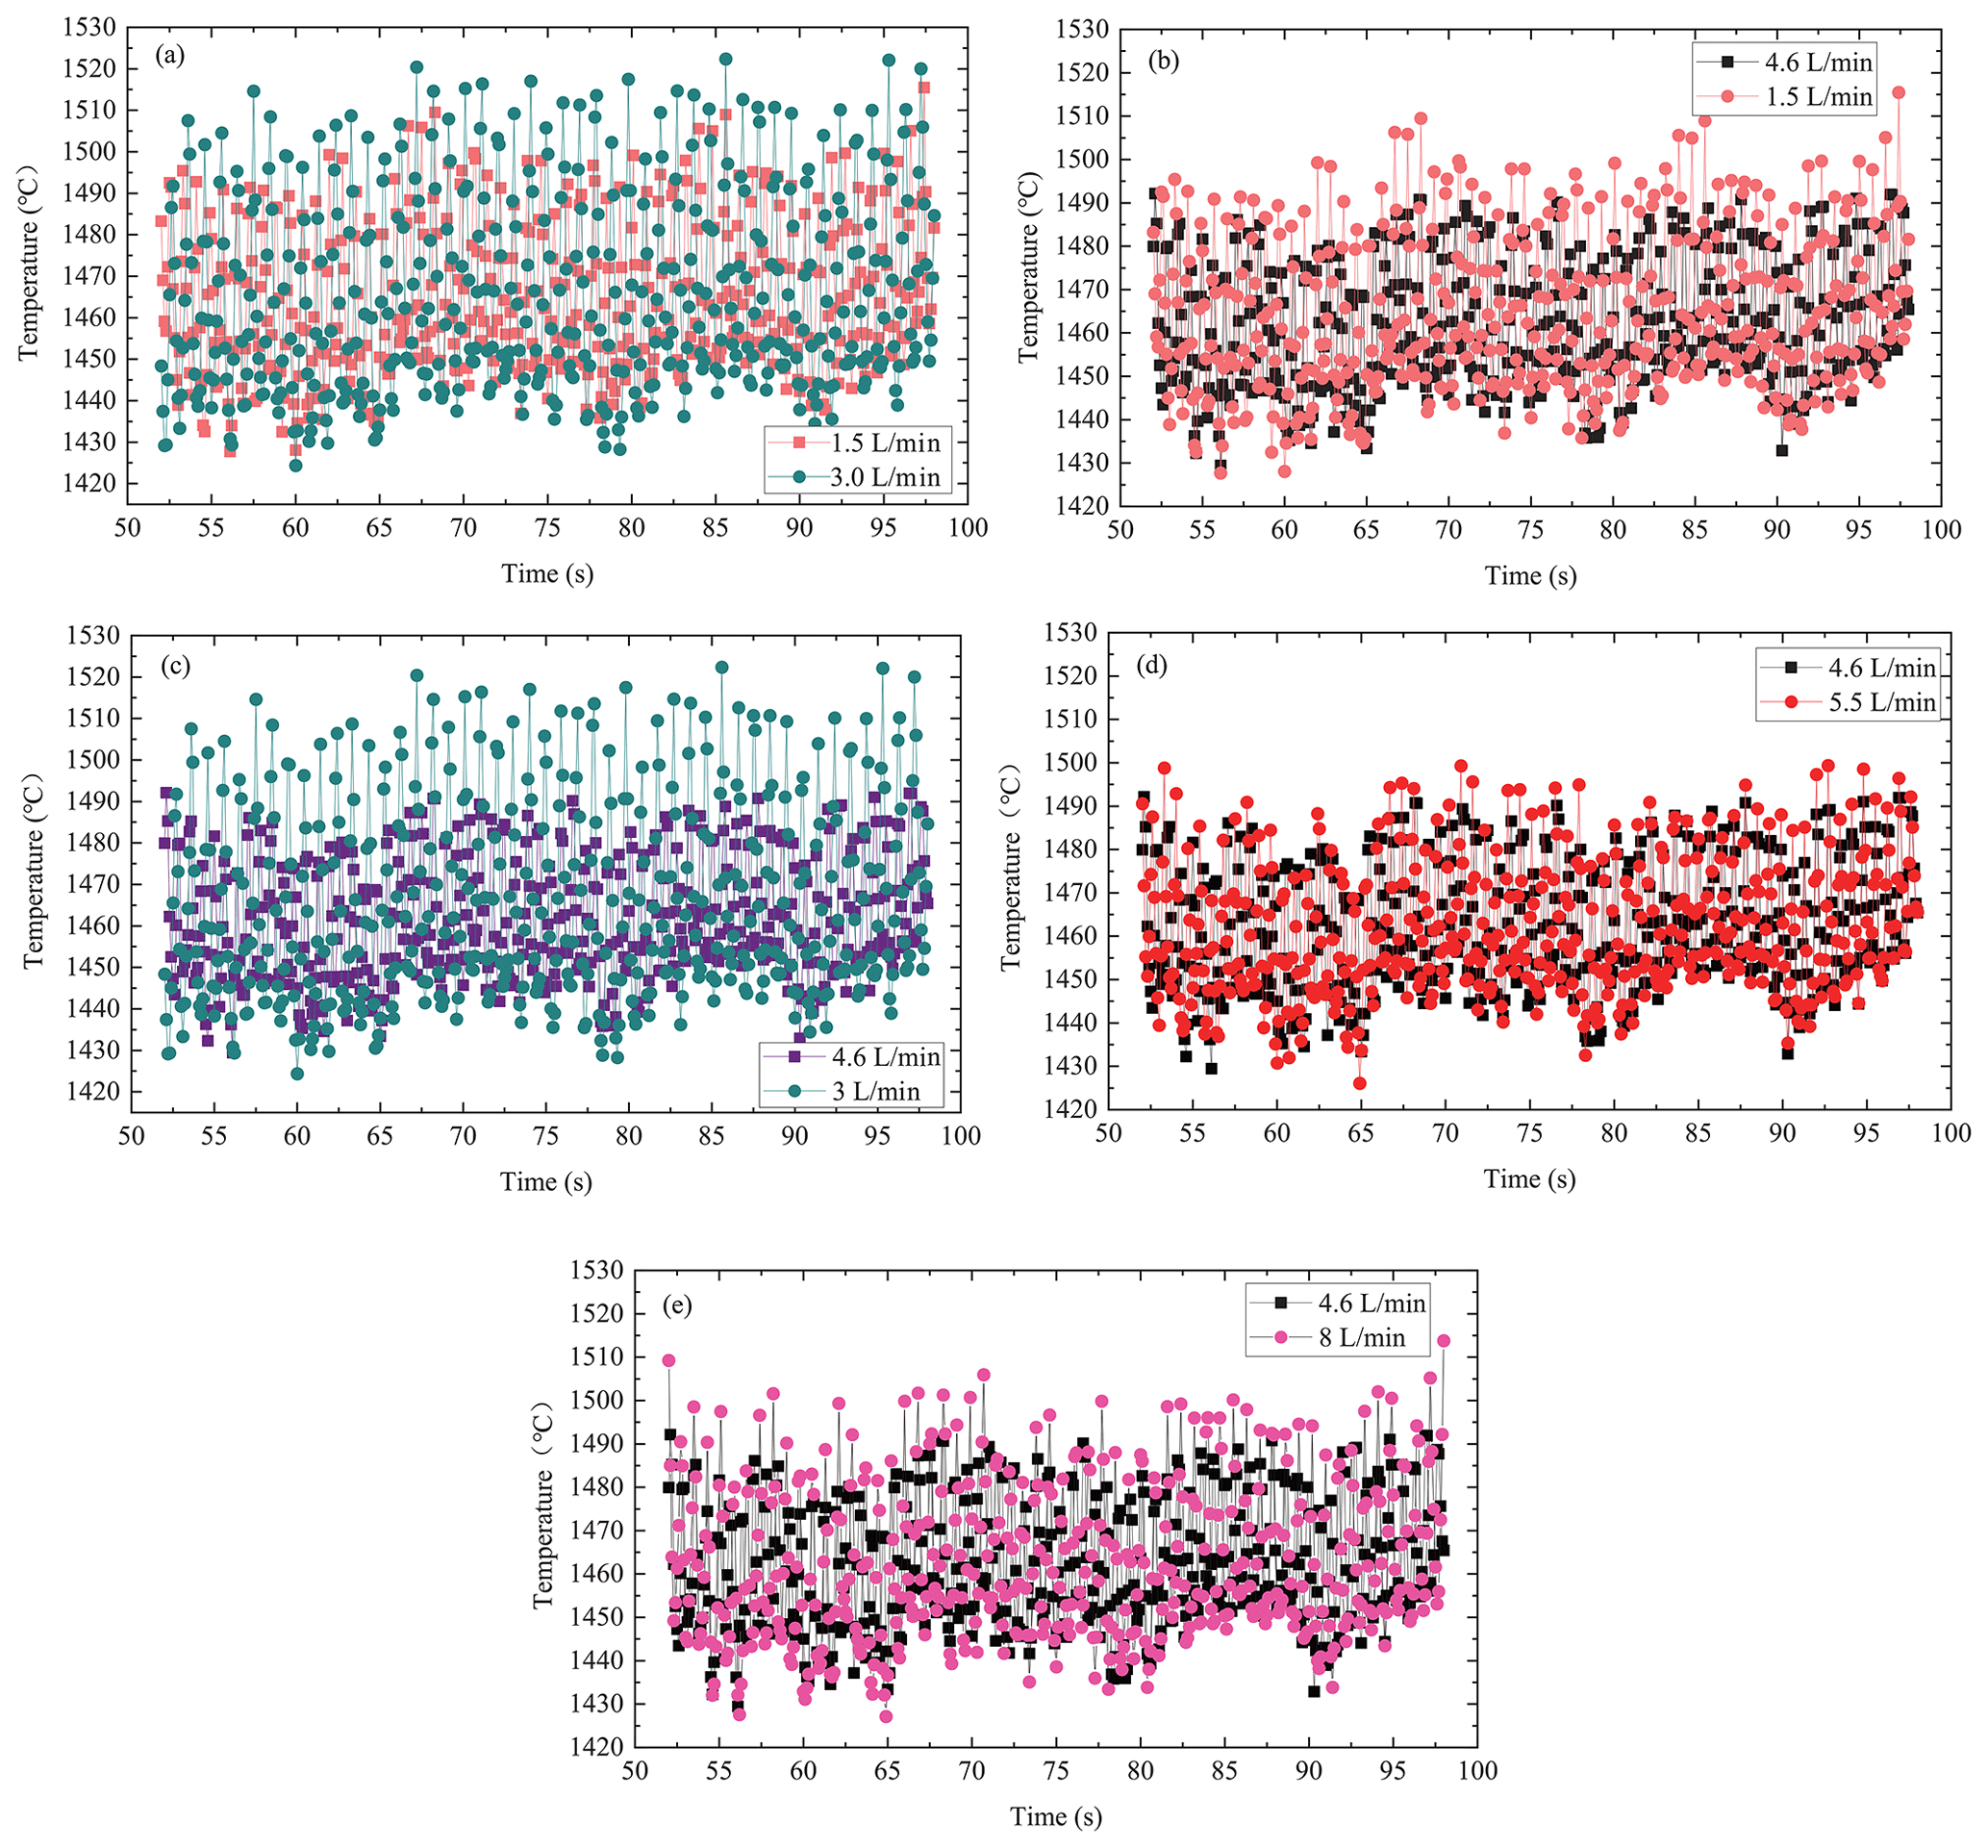
Figure 13Temperature comparison of the welding of the micro-section at different flow rates.
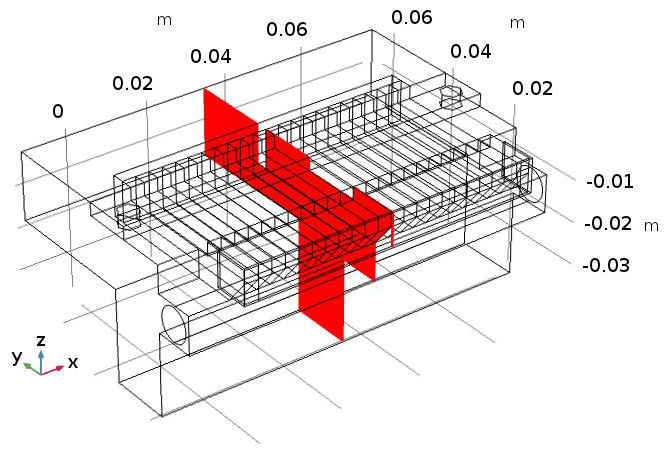
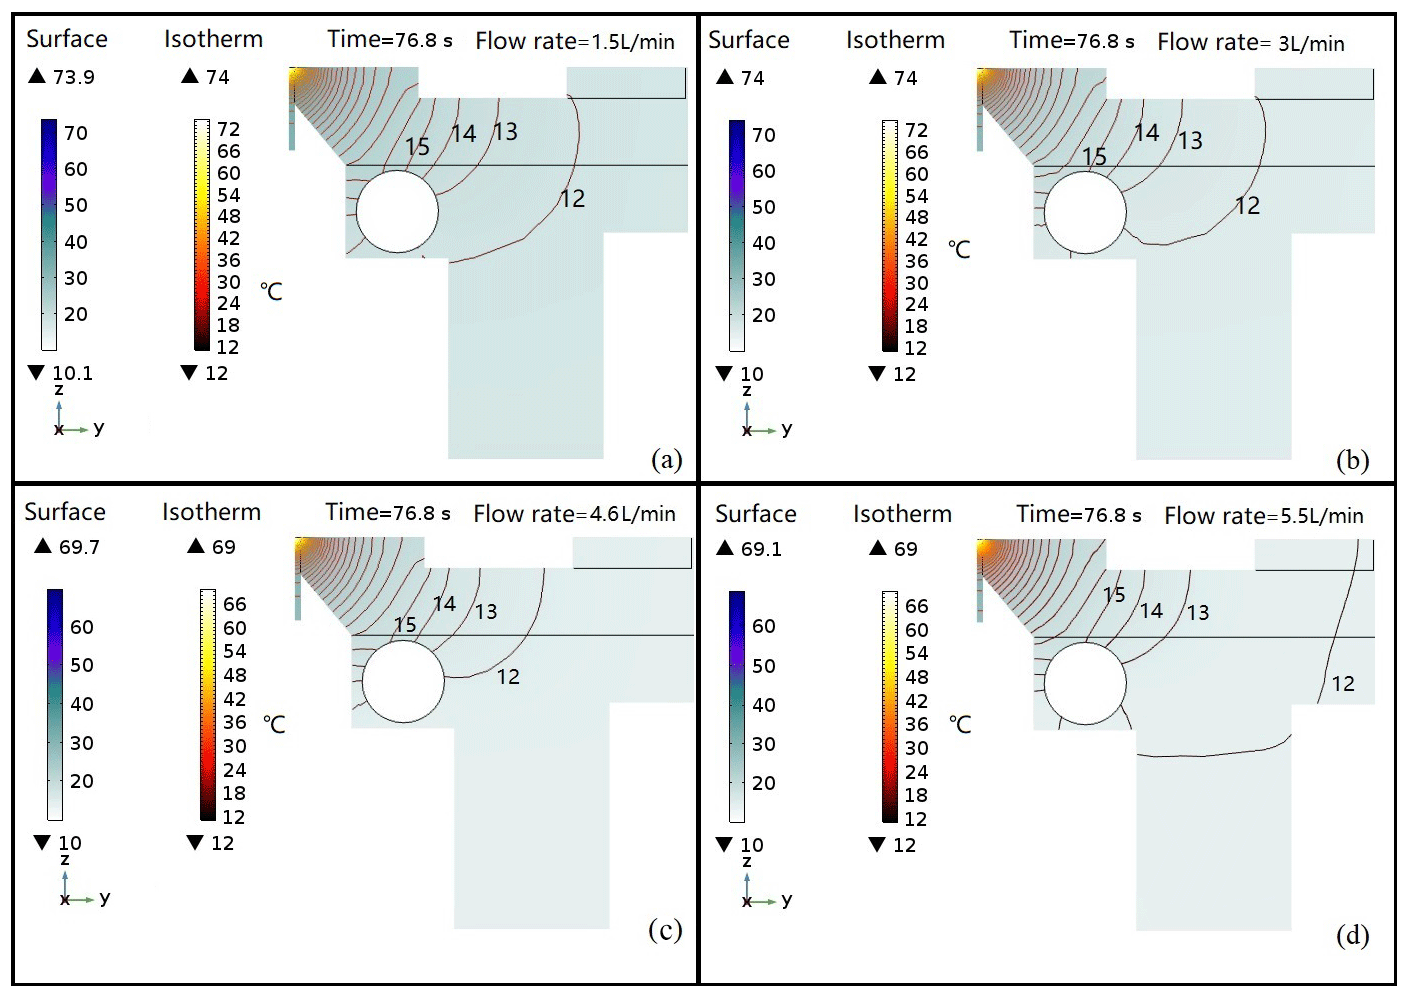
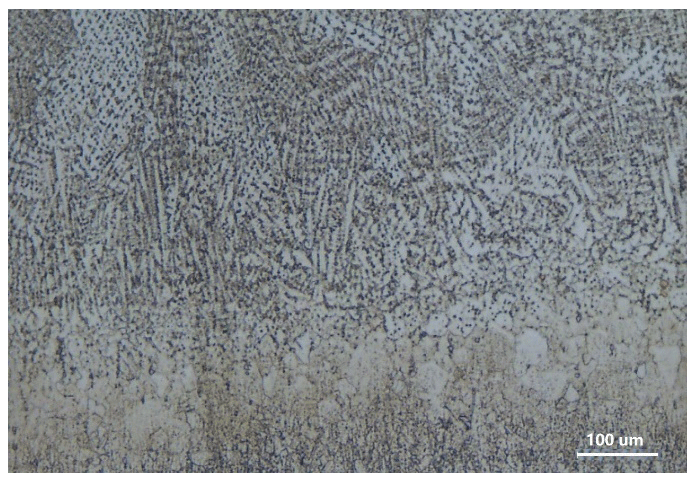


Figure 18Inspection results of the high-definition backscattered electron detector (HDBSD) and energy-dispersive X-ray spectrometer (EDS) in the weld seam.
Table 2The chemical composition of the base metal and welding wire of the experiment (weight percentage; wt %).
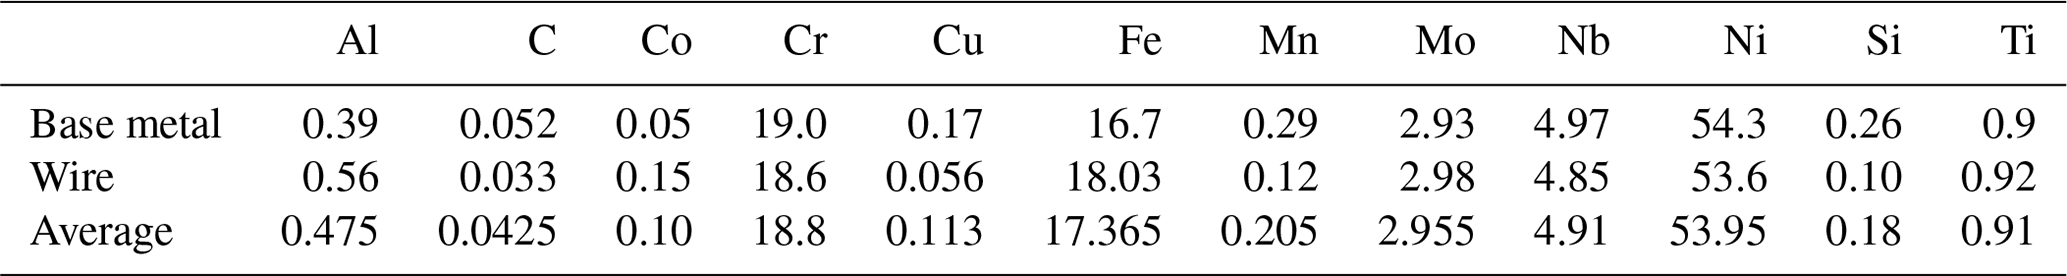
Table 3Mass percentages of the chemical composition of the ARM-repair zone (weight percentage; wt %).
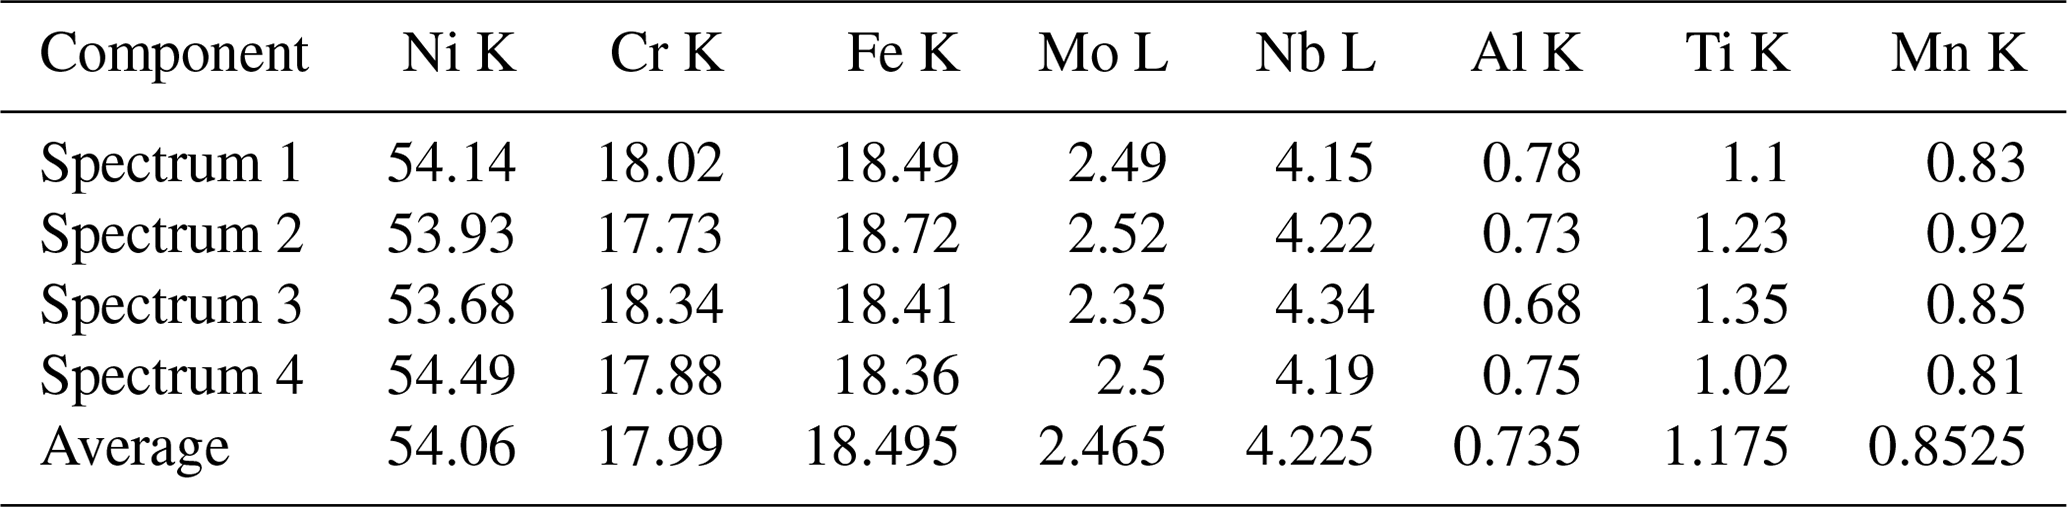
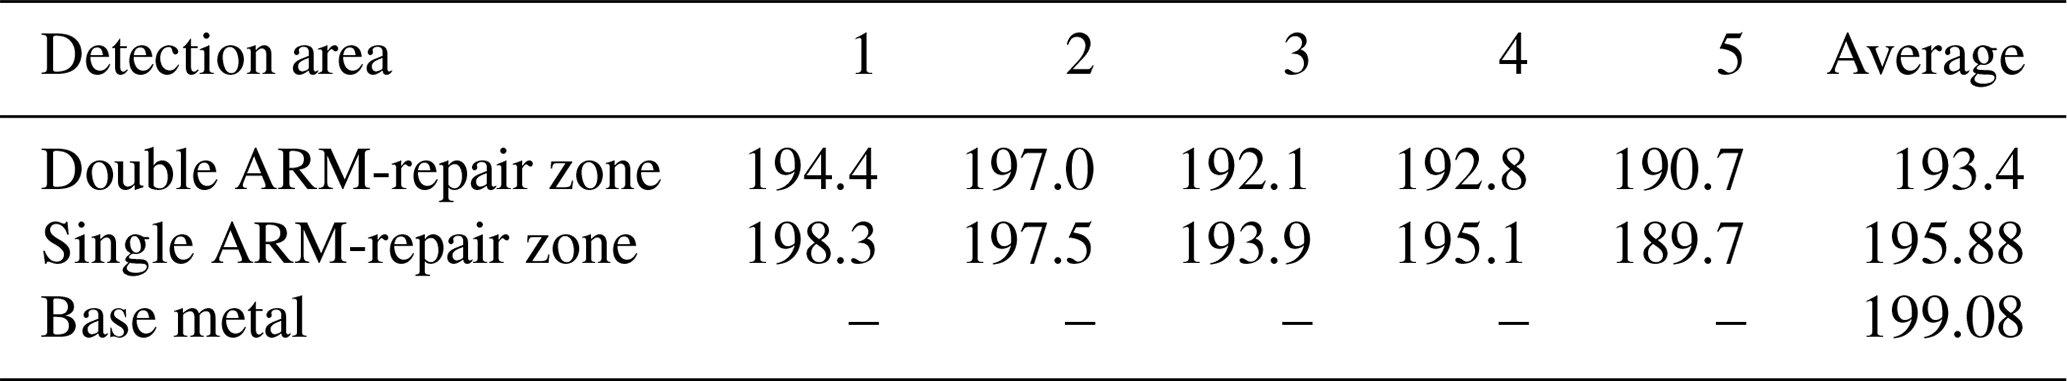
Table 4Comparison of the Vickers hardness test results (HV0.1).
7.1 The heat transfer process and pre-cooling time of the fixture
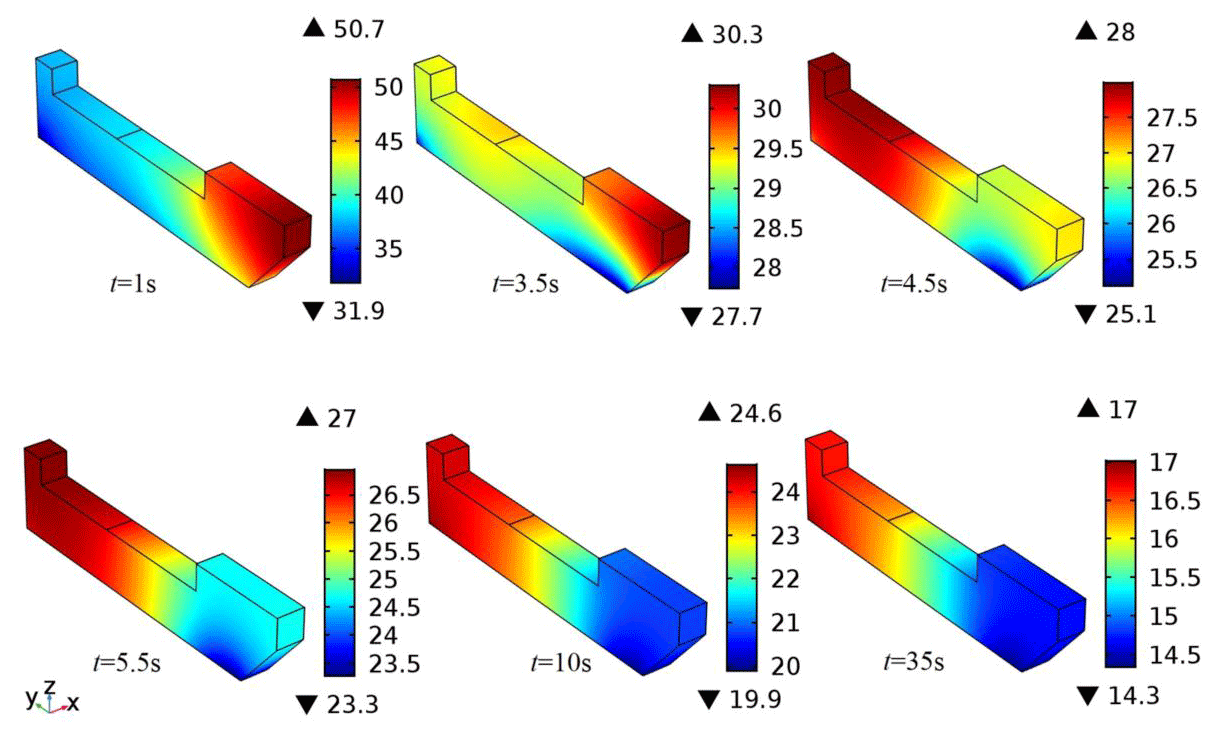
After several times of welding, the copper bond temperature can reach above 70 ∘C. The heat transfer process of the copper bond with the water cooling method at an initial temperature of 70 ∘C is shown in Fig. 9. It shows that the time of the fluid cooling intervention is relatively lagged. Within 3.5 s after the start, the copper bond is almost in a naturally cool state, and then the fluid cooling begins to intervene with the heat exchange. It is shown that the y–z plane of the copper bond is the primary heat transfer direction. The enhanced heat transfer of the y–z plane will be helpful to improve the cooling efficiency.
The cooling curves of the copper bonds at the initial temperature of 70 and 20 ∘C are shown in Fig. 10. It can be seen that at the initial temperature of 20 ∘C, due to the slight temperature difference between the copper bonds and fluid, the temperature drop rate is relatively slow, and the two curves begin to coincide at 35 s. It can be inferred that when the initial temperature of the copper bond is between 20 and 70 ∘C, 35 s can be set as the pre-cooling time of the fixture in the MPAW system.
7.2 Temperature distribution of the wall and fluid surface
The fluid contact wall is selected as a fluid parameterized surface, as shown in Fig. 11a. The variation in the peak temperature of the wall with time under different cooling conditions was compared. Taking the relatively stable time period of 50–98 s after heat source loading, the variation in the maximum temperature of the fluid parameterized surface with time is calculated, as shown in Fig. 11b. The curve change in the figure can be seen as the wall temperature change in the whole process of additive repair. It can be seen that the maximum temperature of the wall is significantly lower than that of the natural cooling after the passage cooling. At different flow rates, the temperature curve of the fluid is basically the same. Before the start of welding until 55 s, the turbulent length of the channel corresponding to the heat source coordinate is smaller, and the heat transfer on the x–y plane is weaker than it was. Then, as the heat source moves to the middle, the heat conduction and transfer of the fluid on the x–y plane promote the heat conduction between the copper bond and the fluid on the y–z plane and between the copper bonds on the x–y plane, and the maximum wall temperature begins to decrease. Near the end of welding, the wall temperature increases due to the rise in the overall temperature of the clamp and the unequal heat conduction distance between the heat source and the cooling surface at both ends. From the temperature distribution of the entire period of the wall surface, the cooling effect of 4.6 L min−1 is close to that of 5.5 L min−1, which is better than others.
Take three coordinate positions with equal distance from the upper surface of the Inconel 718 sheet as the sampling points. According to the coordinate position and heat source moving speed, the time of the heat source moving to the three typical positions is 62.5, 75, and 87.5 s, respectively. The calculated temperature distribution on the liquid surface is shown in Fig. 12. The results of the transient solution show that the instantaneous maximum temperature of the fluid upper surface decreases with the increase in the flow velocity at different times. It indicates that the area of the crimson region with higher temperature decreases significantly, and the heat exchange increases with the increase in the flow velocity. The heat exchange effect of 4.6 L min−1 is close to that of 5.5 L min−1, which is better than others.
According to the fluid temperature distribution in Fig. 12, the heat transfer is mainly concentrated in the upper part of the fluid under the limitation of the current structure. The fluid is not fully involved in the heat transfer. Therefore, although the turbulence intensity and Reynolds coefficient increase significantly when the flow rate increases to 5.5 L min−1, the heat transfer efficiency does not increase linearly compared with that at 1.5 L min−1. For ARM-repair with a higher cooling demand, the fixture structure needs to be redesigned and tested.
7.3 Comparison of temperature distribution of weld seam
The temperature variation in and fluctuation of the molten pool can reflect the transient accumulation of heat, which affects the cooling rate and the quality of the surfacing zone (Näsström et al., 2019; Wahab et al., 1998). Based on the calculation results of the single and double ARM-repair height models, the double ARM-repair height is set as the z axis coordinate of the weld seam cross section. We set flow rates at 1.5, 3, 4.6, 5.5, and 8 L min−1, respectively, to calculate the average temperature change of the welding micro-section corresponding to the heat source under different flow rates. We wet the pre-cooling time to 35 s. The calculation results are shown in Fig. 13a–e. In order to clearly and intuitively compare the temperature distribution of the welding micro-section under several flow rates, 2 s after the start of ARM-repair and 2 s before the end of ARM-repair are removed. The 52–98 s after welding is selected, and the sampling interval is set at 0.02 s.
Figure 13a shows the comparison of the welding micro-section temperatures of 1.5 and 3.0 L min−1. According to the relevant results of the point line diagram, the average temperature lines of the two flow rates are close, which is about 1465 ∘C. At the flow rate of 3 L min−1, the minimum temperature of the welding micro-section is lower than 1.5 L min−1. However, the temperature fluctuation range at 3 L min−1 is obviously larger than that at 1.5 L min−1, which will have adverse effects on the segregation inhibition of elements. Therefore, from the overall cooling effect, the cooling effect of 1.5 L min−1 is a little better than that of 3 L min−1.
Figure 13b and c show the comparison of the welding micro-section temperatures of 1.5 and 4.6 L min−1 and 3 and 4.6 L min−1, respectively. From the comparison of the point and line diagram, the weld temperature and temperature fluctuation under the flow rate of 1.5 and 3.0 L min−1 are significantly greater than the flow rate of 4.6 L min−1.
Figure 13d shows the comparison of the welding micro-section temperature at flow rates of 5.5 and 4.6 L min−1. It is shown that the average temperature of the welding micro-section at 5.5 L min−1 is close to that at 4.6 L min−1. However, from the temperature fluctuation range, the fluctuation of weld temperature at 4.6 L min−1 is obviously less than that of 5.5 L min−1.
For further verification, the flow rate is set at 8 L min−1, and the average temperature distribution cross section of the welding micro-section is calculated and compared with the point line diagram of 4.6 L min−1, as shown in Fig. 13e. The numerical analysis results show that the average temperature of the welding micro-section at 8 L min−1 is significantly higher than that at 4.6 L min−1 in the selected time interval, and the fluctuation range is greater than that of 4.6 L min−1.
At the flow rate of 8 L min−1, the turbulence intensity in the channel continues to increase. However, because the channel is located on the fixture base, the turbulent heat transfer effect is not entirely achieved, as only part of the fluid is involved in the cooling, and the larger turbulence brings greater temperature fluctuation. Through comparison, the flow rate of 4.6 L min−1 is still an ideal parameter for water cooling under several flow rates.
7.4 Isotherm simulation of the middle section of the fixture
In order to further verify the results, the test piece is hidden, and the middle section on x=0.0325 m is taken as the research object in the specific x axis direction, as shown in Fig. 14. According to the calculation, 76.8 s of the average time point when the molten pool is cooled to 980 ∘C is taken as the research node. The isotherm distribution of the fixture section at this time node under different flow rates is calculated. The starting temperature of the isotherm is set as 12 ∘C, the marking interval is 1 ∘C, and the end temperature is the highest temperature of the corresponding fixture section. The transient calculation results are shown in Fig. 15a–d.
From the isotherm distribution of the y–z middle section of the half fixture, the fluid is not fully involved in the heat transfer under different flow rates due to the limitation of the channel position, so the cooling effect is different. At the cooling time of 76.8 s, the peak temperature of the clamp section at the flow rate of 1.5 and 3 L min−1 is 73.9 and 74 ∘C, respectively, and the peak temperature of the clamp section corresponding to the flow rate of 4.6 and 5.5 L min−1 is 69.7 and 69.1 ∘C, respectively. In terms of the cooling effect, the cooling effect of 4.6 and 5.5 L min−1 is similar, which is better than the other two flow rates. The isotherm interval of 4.6 L min−1 is denser than that of 5.5 L min−1, and the isotherm of 12 ∘C moves forward, which has a better heat transfer stability and cooling effect.
According to the above analysis and the mechanism research of heat transfer, it is expected that a better cooling effect can be achieved when the pre-cooling time is 35 s and the flow rate is close to 4.6 L min−1. However, due to the limitation of the position of the base channel, the y–z section of the channel is not fully involved in cooling. Therefore, the heat transfer efficiency does not increase with the increasing flow rate. For some ARM-repairs that need to be done three or more times, it is necessary to optimize the fixture structure and flow channel form to further improve the heat transfer efficiency in further work.
According to the calculation results, the flow rate of the runner is set to 4.6 L min−1, the heat source loading time is 35 s after water cooling, the heat source power is 431 W, the welding speed is 3 in min−1 (1.27 m s−1), and the wire-feeding speed is 9 in min−1 (3.81 m s−1). Since the MPAW multi-channel additive also involves fine upper-surface polishing and welding torch trajectory planning, the method of increasing the clamping height of the test piece, whose upper surface is polished to a smooth mirror surface, is used to simulate the additive repair height in the numerical model, mainly for the detection and analysis of the cooling effect. The weight percentage (wt %) of the chemical composition of the base metal and welding wire used in the experiment is shown in Table 2.
After welding, cutting and sample preparation is carried out. The results of the optical microscope inspection of weld seam are shown in Fig. 16. The additive area is observed by high-definition backscattered electron detector (HDBSD) of the scanning electron microscopy (SEM), and the results are shown in Fig. 17. The metallographic experiment follows the standard of the testing method for the microstructure of superalloys (taken from the industry standard of the People's Republic of China – GB/T 1499.4), the testing method for metallographic microstructure (GB/T 13298), and the detection method for chemical composition and surface morphology (GB/T 17359). It is shown that, due to the forced cooling, the growth of grains tends to be columnar grains in the cooling direction, and the grains are dispersed. This is consistent with the effect of the cooling rate on the grain formation described in the solidification diagram of Inconel 718 alloy proposed by Nastac et al. (2001).
We select a different Guinier–Preston zone for energy spectrum detection, as shown in Fig. 18a, and remove elements with a content of less than 1 % and C elements that affect the error. The mass percentages of the chemical composition of the ARM-repair zone are shown in Table 3. It is shown that the weight percentage of Nb in the Guinier–Preston zone is about 4.15 %–4.34 %, and the Laves precipitation phenomenon discussed in the literature (Wang et al., 2010) is not observed (Fig. 18b). It can be inferred that the strengthening ratio of Nb in the Guinier–Preston zone is better, and the proportion of Nb lost in the strengthening phase of the weld zone is within a reasonable range, which helps to maintain the mechanical properties of the ARM-repair zone. In addition, compared with the base metal, Nb content in Guinier–Preston zone is slightly lower. However, after the later heat treatment, the Nb content will easily reach the ideal level, effectively reducing the time and difficulty of the whole heat treatment in the subsequent repair step (Croft et al., 2010).
According to the Vickers hardness test method of metallic materials (GB/T 4340.1-2009), a Vickers hardness of the additive zone of the double ARM-repair was detected. A total of five sampling points (vertical and upward) were taken from the weld seam to detect the hardness of the ARM-repair part. The comparison of Vickers hardness test results is shown in Table 4. In the single ARM-repair, only a copper bond was used for cooling, so the hardness decreased. In double ARM-repair, fluid cooling is involved in making the cooling effect better. However, the turbulence also causes the nonuniformity of heat dissipation, so the hardness change of the second repair does not show a fixed rule. It is shown that the average Vickers hardness value of a double ARM-repair zone is 193.4, which is about 1.27 % lower than that of the single ARM-repair zone and 2.82 % lower than that of the base metal.
With establishing the mathematical model of the height of ARM-repair, the precise position with the theoretical basis of the weld seam under different wire-feeding speeds is obtained. The cooling effect is analyzed by numerical analysis and verified by experiments.
-
The mathematical model of the single ARM-repair height and wire-feeding speed was established, and the numerical values of additive height under different wire-feeding rates were solved. The results show that when the moving speed is 3 in min−1 (1.27 mm s−1), better repair height can be achieved by using 6 in min−1 (2.54 mm s−1) and 8 in min−1 (3.39 mm s−1) of wire-feeding speed. The experimental results verify the validity of the theoretical model.
-
Based on the mathematical model of the single ARM-repair, the model of the double ARM-repair was established. Under the condition of covering the single ARM-repair radius, when the height of the double ARM-repair is 0.8 mm, the corresponding wire-feeding speed is about 9 in min−1 (3.8 mm s−1), the radius of the cross section circle is about 0.862 mm, and the center of the circle is located in the section circle of single ARM-repair zone.
-
The heat flow coupling model of double ARM-repair was established, the model equation was deduced, and the heat transfer mechanism of blade fixture was explained. The numerical analysis indicated that when the initial temperature of the clamping copper bond is between 20 and 70 ∘C, a pre-cooling time could be set to 35 s in the MPAW system.
-
The thermal conductivity in the y–z plane is the key factor affecting the thermal conductivity of copper bonds. According to the comparison of the temperature distribution of fixture section and the cross section of the weld micro-section under different flow rates, when the flow rate is 4.6 L min−1, the comprehensive index of the heat transfer stability and cooling rate is better than other flow conditions, which can achieve a better cooling effect.
Future work
This research is based on the current MPAW fixture structure of aviation maintenance. However, the fluid is not fully involved in the heat exchange due to the current structural limitations of the fixture. The redesign and test of the fixture structure are complex subjects worthy of study. Future work will focus on the design and improvement of flexible cooling fixtures and the precise temperature control in ARM-repair.
All the data used in this paper can be obtained from the corresponding author on request.
Conceptualization was by MG and SD. Data curation was done by MG. Formal analysis was made by LW. Investigations were carried out by MG. The methodology was by MG and SD. Project administration was performed by LW. Resources came from SD. Software came from TW. Supervision was by TW. MG wrote the original draft. Writing, review, and editing were done by MG and SD.
The authors declare that they have no conflict of interest.
Publisher's note: Copernicus Publications remains neutral with regard to jurisdictional claims in published maps and institutional affiliations.
We thank the Tianjin Key Laboratory for Civil Aircraft Airworthiness and Maintenance staff for their support.
This research has been supported by the National Key Research and Development Program of China (grant no. 2019YFB1311104), and the Special Project of Central Government for Local Science and Technology Development of Hubei Province (grant no. 19941603G).
This paper was edited by Jeong Hoon Ko and reviewed by four anonymous referees.
Bahrami, M., Culham, J. R., and Yovanovich, M. M.: Thermal resistances of gaseous gap for conforming rough contacts, 42nd AIAA Aerospace Sciences Meeting and Exhibit, 5–8 January 2004, Reno, Nevada, USA, 2004a.
Bahrami, M., Yovanovich, M. M., and Culham, J. R.: Thermal joint resistances of nonconforming rough surfaces with gas-filled gaps, J. Thermophys. Heat Tr., 18, 326–332, https://doi.org/10.2514/1.5482, 2004b.
Baruah, M. and Bag, S.: Influence of heat input in microwelding of titanium alloy by micro plasma arc, Journal of Materials Processing Technology, 231, 100–112, https://doi.org/10.1016/j.jmatprotec.2015.12.014, 2016.
Chai, Q., Li, J. S., Yang, B. Y., Li, C, W., Wu, X. L., and Zhang, Z. P.: Influence of shape of foreign objects on impact damage of aero-engine compressor rotor blades, Chinese Journal of Applied Mechanics, 31, 825–829, 989, https://doi.org/10.11776/cjam.31.06.B101, 2014.
Croft, J.: CFM56 “Evolution” in work for A320, Flight International, 177, 11 pp., 2010.
Dai, S. J., Gong, M., Wang, L. W., and Wang, T.: Research on Cooling Method in Surfacing Repair Process of Aero Compressor Blade, Math. Probl. Eng., 06, 1–19, https://doi.org/10.1155/2020/1208313, 2020a.
Dai, S. J., Wang, D., Zhang, H. B., Li, S. B., and Wang, Z. P.: Thermal Contact Resistance between Aero Engine Compressor Blade and Flexible Fixture, J. Therm. Sci., 30, 530–539, https://doi.org/10.1007/s11630-020-1316-0, 2020b.
Ding, D. H., Pan, Z. G., Dominic, C., and Li, H. J.: A multi-bead overlapping model for robotic wire and arc additive manufacturing (WAAM), Robot. Comput. Integr. Manuf., 31, 101–110, https://doi.org/10.1016/j.rcim.2014.08.008, 2015.
Ding, D. H., Pan, Z. X., Dominic, C., Li, H. J., Stephen, V. D., and Nathan, L.: Bead modelling and implementation of adaptive MAT path in wire and arc additive manufacturing, Robot. Comput. Integr. Manuf., 39, 32–42, https://doi.org/10.1016/j.rcim.2015.12.004, 2016.
Desai, R. S. and Bag, S.: Influence of displacement constraints in thermomechanical analysis of laser micro-spot welding process, Journal of Manufacturing Processes, 16, 264–275, https://doi.org/10.1016/j.jmapro.2013.10.002, 2014.
Gao, X. L., Zhang, L. J., Liu, J., and Zhang, J. X.: Effects of weld cross-section profiles and microstructure on properties of pulsed Nd: YAG laser welding of ti6al4v sheet, Int. J. Adv. Manuf. Tech., 72, 895–903, https://doi.org/10.1007/s00170-014-5722-x, 2014.
Gong, M., Dai, S. J., Jia, P., and Wang, D.: Heat transfer modeling and cooling method for aeroengine blade MPAW Repair, Transactions of The China Welding Institution, 40, 24–30, 162, 2019.
Gong, M., Dai, S. J., Wang, L. W., and Wang, T.: An Advanced Flexible Multiflow Path Fixture Cooling Method for Additive Manufacturing Repair of Aero Blades, IEEE Access, 09, 33349–33368, https://doi.org/10.1109/ACCESS.2021.3058969, 2021.
Grujicic, C. L., Zhao, E. C., and Dusel, E.: The effect of thermal contact resistance on heat management in the electronic packaging, Appl. Surf. Sci., 246, 290–302, https://doi.org/10.1016/j.apsusc.2004.11.030, 2005.
Karimzadeh, F. and Ebnonnasir, A., and Foroughi, A.: Artificial neural network modeling for evaluating of epitaxial growth of Ti6Al4V weldment, Mat. Sci. Eng. A-Struct., 432, 184–190, https://doi.org/10.1016/j.msea.2006.05.141, 2006.
Liu, H. H., Chen, H. J., Liu, W. W., Tian, Q. Y., and Jian, F.: Numerical analysis of flow-thermal coupling in micro-plasma welding pool of thin-wall part, China Welding, 27, 13–18, 2018.
Manikandan, S. G. K., Sivakumar, D., Rao, K. P., and Kamaraj, M.: Effect of weld cooling rate on Laves phase formation in Inconel718 fusion zone, Journal of Materials Processing Technology, 214, 358–364, https://doi.org/10.1016/j.jmatprotec.2013.09.006, 2014a.
Manikandan, S. G. K., Sivakumar, D., Rao, K. P., and Kamaraj, M.: Microstructural characterization of liquid nitrogen cooled Alloy 718 fusion zone, Journal of Materials Processing Technology, 214, 3141–3149, https://doi.org/10.1016/j.jmatprotec.2014.07.022, 2014b.
Manvatkar, V., De, A., Svensson, L. E., and Debroy, T.: Cooling rates and peak temperatures during friction stir welding of a high-carbon steel, Scripta Mater., 94, 36–39, https://doi.org/10.1016/j.scriptamat.2014.09.012, 2015.
Näsström, J., Brückner, F., and Kaplan, A. F. H.: Measuring the effects of a laser beam on melt pool fluctuation in arc additive manufacturing, Rapid Prototyping J., 25, 488–495, https://doi.org/10.1108/RPJ-01-2018-0033, 2019.
Nastac, L., Valencia, J. J., Tims, M. L., and Dax, F. R.: Advances in the solidification of IN718 and RS5 alloys, Superalloys, 718, 103–112, 2001.
Neela, V. and De, A.: Three-dimensional heat transfer analysis of LENSTM process using finite element method, Int. J. Adv. Manuf. Tech., 45, 935–943, https://doi.org/10.1007/s00170-009-2024-9, 2009.
Ouyang, J. H., Wang, H., and Kovacevic, R.: Rapid prototyping of 5356-aluminum alloy based on variable polarity gas tungsten arc welding process control and microstructure, Mater. Manuf. Process., 17, 103–124, https://doi.org/10.1081/AMP-120002801, 2002.
Panchagnula, J. S., and Simhambhatla, S.: Feature based Weld-Deposition for Additive Manufacturing of Complex Shapes, Journal of the Institution of Engineers (India): Series C, 99, 285–292, https://doi.org/10.1007/s40032-016-0339-5, 2018a.
Panchagnula, J. S. and Simhambhatla, S.: Manufacture of complex thin-walled metallic objects using weld-deposition based additive manufacturing, Robot. Comput. Integr. Manuf., 49, 194–203, https://doi.org/10.1016/j.rcim.2017.06.003, 2018b.
Qu, W. L. and Mudawar, I.: Experimental and numerical study of pressure drop and heat transfer in a single-phase micro-channel heat sink, Int. J. Heat Mass. Tran., 45, 2549–2565, https://doi.org/10.1016/S0017-9310(01)00337-4, 2002.
Ram, G. J., Reddy, A. V., Rao, K. P., Reddy, G. M., and Sundar, J. S.: Microstructure and tensile properties of Inconel 718 pulsed Nd-YAG laser welds, Journal of Materials Processing Technology, 167, 73–82, https://doi.org/10.1016/j.jmatprotec.2004.09.081, 2005.
Shen, H. Y., Deng, R. X., Liu, B., Tang, S., and Li, S.: Study of the Mechanism of a Stable Deposited Height During GMAW-Based Additive Manufacturing, Applied Sciences, 10, 4322, https://doi.org/10.3390/app10124322, 2020.
Shi, B., Zhang, H., Qi, Y. J., and Yang, L. L.: Calculation model of effective thermal conductivity of a spiral-wound lithium ion battery, J. Therm. Sci., 27, 572–579, https://doi.org/10.1007/s11630-018-1060-x, 2018.
Sun, J. M., He, J., and Deng, D. A.: Numerical simulation of the influence of forced cooling on the temperature field of electro slag welding joint, Transactions of The China Welding Institution, 37, 63–66, 132, 2016.
Tariq, A. and Asif, M.: Experimental investigation of thermal contact conductance for nominally flat metallic contact, Heat Mass Transfer, 52, 291–307, https://doi.org/10.1007/s00231-015-1551-1, 2016.
Wahab, M. A., Painter, M. J., and Davies, M. H.: The prediction of the temperature distribution and weld pool geometry in the gas metal arc welding process, Journal of Materials Processing Technology, 300, 233–239, https://doi.org/10.1016/S0924-0136(97)00422-6, 1998.
Wang, L., Yao, Y. J., Dong, J. X., and Zhang, M. C.: Effect of cooling rates on segregation and density variation in the mushy zone during solidification of superalloy Inconel718, Chem. Eng. Commun., 197, 1571–1585, https://doi.org/10.1080/00986445.2010.493101, 2010.
Wang, A. Y., He, J. P., Pei, and Lin, Y. S.: The dynamic distribution characteristics of optical radiation intensity of pulsed microbeam plasma arc welding arc, Transactions of The China Welding Institution, 37, 70–74, 2016.
Wang, J. X., Li, Y. Z., Li, J. X., Li, C., Zhang, Y., and Ning, X. W.: A gas-atomized spray cooling system integrated with an ejector loop: Ejector modeling and thermal performance analysis, Energ. Convers. Manage., 180, 106–118, https://doi.org/10.1016/j.enconman.2018.10.095, 2018.
Wang, J. X., Guo, W., Xiong, K., and Wang, S. N.: Review of aerospace-oriented spray cooling technology, Prog. Aerosp. Sci., 116, 100635, https://doi.org/10.1016/j.paerosci.2020.100635, 2020a.
Wang, J. X., Li, Y. Z., Liu, X. D., Shen, C. Q., Zhang, H. S., and Xiong, K.: Recent active thermal management technologies for the development of energy-optimized aerospace vehicles in China, Chinese J. Aeronaut., 34, 1–27, https://doi.org/10.1016/j.cja.2020.06.021, 2020b.
Wang, J. X., Li, Y. Z., Zhong, M. L., and Zhang, H. S.: Investigation on a gas-atomized spray cooling upon flat and micro-structured surfaces, Int. J. Therm. Sci., 161, 106751, https://doi.org/10.1016/j.ijthermalsci.2020.106751, 2020c.
Wang, J. X., Birbarah, P., Docimo, D., Yang, T., and Miljkovic, N.: Nanostructured jumping-droplet thermal rectifier, Phys. Rev. E, 103, 023110, https://doi.org/10.1103/PhysRevE.103.023110, 2021.
Wu, Q. R., Lu, J. P., Liu, C. M., Fan, H. L., Shi, X. Z., Fu, J., and Ma, S. Y.: Effect of molten pool size on microstructure and tensile properties of wire arc additive manufacturing of Ti-6Al-4V alloy, Materials, 10, 749, https://doi.org/10.3390/ma10070749, 2017.
Wu, H. H., Hsiao, Y. Y., Huang, H. S., Tang, P. H., and Chen, S. L.: A practical plate-fin heat sink mode, Appl. Therm. Eng., 31, 984–992, https://doi.org/10.1016/j.applthermaleng.2010.10.014, 2011.
Yovanovich, M. M.: Micro and macro hardness measurements, correlations, and contact models, 44th AIAA Aerospace Sciences Meeting and Exhibit, 9–12 January 2006, Reno, Nevada, America, AIAA 2006-979, https://doi.org/10.2514/6.2006-979, 2006.
Zhang, D. M., Cui, H. C., Yang, S. L., and Tuo, W. H.: Microstructures and Micro fissuring in the HAZ of Inconel718 Welds by Laser Welding, Materials Reports, 30, 96–99, 2016.
Zhao, H. H., Zhang, G. J., Yin, Z. Q., and Wu, L.: A 3D dynamic analysis of thermal behavior during single-pass multi-layer weld-based rapid prototyping, Journal of Materials Processing Technology, 211, 488–495, https://doi.org/10.1016/j.jmatprotec.2010.11.002, 2011.
Zheng, J., Li, Y. Z., Wang, L., and Tan, H. B.: An improved thermal contact resistance model for pressed contacts and its application analysis of bonded joints, Cryogenics, 61, 133–142, https://doi.org/10.1016/j.cryogenics.2013.11.002, 2014.
- Abstract
- Introduction
- Mathematical model and solutions of single ARM-repair height
- Experimental results and discussion of single ARM-repair
- Calculation of welding parameters of double ARM-repair
- Finite element model
- Model equations and boundary conditions
- Numerical analysis and discussion
- Metallographic experiment
- Conclusions
- Data availability
- Author contributions
- Competing interests
- Disclaimer
- Acknowledgements
- Financial support
- Review statement
- References