the Creative Commons Attribution 4.0 License.
the Creative Commons Attribution 4.0 License.
 | 06 Aug 2021
An applied methodology for tolerance design based on concurrent engineering
Jianzhong Zhu
Ye Wang
Meng Zou
Tolerance design is an important part of the product development and manufacturing process. Studies show that using a reliable and efficient tolerance design method can effectively improve product quality and reduce manufacturing costs. Although numerous studies have been carried out in the area of tolerance analysis, combining the tolerance analysis with the concurrent engineering theory has been rarely studied so far. In order to resolve this shortcoming, a comprehensive tolerance design methodology based on concurrent engineering was proposed in the present study to shorten the product development cycle, improve product quality, and reduce manufacturing costs. To this end, experts from different engineering fields were employed to form a concurrent engineering team that works together. The tolerance design activities were divided into seven stages, including design requirements definition, dimension chain identification, initial geometric dimensioning and tolerancing, variation analysis, release technical specification, validation, and continuous improvement. Then the detailed work process of each stage is presented. Based on the Monte Carlo theory and 3D computer-aided tolerance software, a variation analysis framework was proposed. Finally, the gap between taillight and bodyside was considered a test case, and a specific operation method of tolerance design using this framework is expounded. In the studied cases, the calculated and measured mean value of the gap was 1.5 and 1.5368 mm, respectively, indicating the simulation error of 2.5 %. The obtained results show that the gap tolerance by the proposed method is consistent with the tolerance fluctuation in actual production.
- Article
(6161 KB) - Full-text XML
- BibTeX
- EndNote


In today's highly competitive automobile markets, quality is one of the most affecting parameters on the consumers' choice to buy. Studies show that almost 67 %–70 % of all design changes and failures in the automotive industry are in the field of dimensions and outer geometries, indicating a lack of technological expertise and knowledge of accurate analysis for process variations during the design process of the product (Ceglarek et al., 2004). Therefore, automobile manufacturers are sparing no effort to improve the quality of products. This is especially more pronounced in the aesthetic of interior and exterior trims. In this regard, applying a reliable and efficient tolerance design method can improve the product quality and shorten the development cycle of the product (Cao et al., 2018).
As an important part of the product development process, tolerances determine the range of dimensional and geometric variations of each feature to ensure that the product has an appropriate performance and function (Lu et al., 2011). Tolerance is affected by numerous factors, including geometric information, locating schemes, assembly sequence, and fixtures (Khodaygan et al., 2010; Zhang et al., 2011; Zhu and Qiao, 2015). Tolerance design requires deep knowledge of geometric dimensioning and tolerancing (GD&T) standards, manufacturing process, and manufacturing costs. Therefore, it is a challenge to obtain a consistent tolerance design by independent designers. Moreover, contradictory requirements of different departments affect the tolerance design. For example, both design engineers and manufacturing personnel are concerned about the tolerances. However, design engineers prefer tight tolerances to guarantee design requirements (DRs), while manufacturing engineers prefer relatively loose tolerance (Chase and Parkinson, 1991). It should be indicated that the former aspect increases manufacturing costs, while the latter aspects reduce the manufacturing expenses. In actual product development, tolerance design is an engineering trade-off between quality and manufacturing cost. Recently, tolerance design has been proposed as an effective scheme to resolve the abovementioned problem and has become the research hot spot in the past few years.
Concurrent engineering is defined as an effective way to concurrently develop products. In this regard, manufacturing processes are designed in multifunctional teams with specialists in diverse fields, including marketing, styling, design, purchase, manufacturing, assembly, and quality aspects that work together from the earliest stages of the design (Anderson, 2020). All specialists cooperate as a team to reach DRs. To this end, it is necessary to constantly and directly exchange data in all stages of a product life cycle (Rihar et al., 2021). In the concurrent design, requirements of the design, manufacturing, and inspection stages are integrated to balance the final tolerance. Al-Ashaab et al. (2013) integrated the principles of set-based concurrent engineering into an existing product development model and applied the model into a set of well-defined activities and related tools. Based on the concepts of concurrent engineering, Ngoi and Teck (1997) proposed a tolerance optimization method for process tolerance allocation. Moreover, Jeang (2004) developed a quantitative analysis model to combine design target, design tolerance, the process mean, and process tolerance into one expression to determine the optimal values of design tolerance, the process mean, and process tolerance. Alansary and Deiab (1997) proposed a procedure for concurrently allocating both design and machining tolerances through the worst-case stack-up analysis. In order to fulfill the product's functional requirements, Peng and Peng (2019) extended the concurrent tolerance model and considered the combination of expected quality loss and manufacturing costs as the target function. Moreover, functional, geometrical, and process constraints were considered the constraint conditions.
Reviewing the literature indicates that numerous investigations have been carried out over the past few decades in the area of tolerance design (Korbi et al., 2018; Zeng et al., 2017; Ameta et al., 2015; Haghighi et al., 2015; Sarigecili et al., 2014). This research mainly focuses on one aspect or several aspects of tolerance design, allocation, quality, manufacturing cost, and concurrent engineering. However, the tolerance design based on the concurrent engineering within the whole product development cycle has so far been rarely studied. It is worth noting that in the product development cycle with concurrent considerations, the development cycle and the manufacturing costs are significantly reduced. Accordingly, this issue has attracted many researchers and has become a research hot spot.
The performed literature survey reveals that although the effects of tolerances on the aesthetic quality and functionality of the product have been studied extensively, only a few companies follow the concepts of tolerance engineering (Walter et al., 2021). This mainly originates from challenges in dealing with highly complex deviations and tolerances. Accordingly, it is of significant importance to establish an easy-to-apply tolerance analysis framework. The framework should include the theoretical basis of different tolerance analysis methods, specific tolerance analysis processes, and implementation methods. Moreover, this framework should reduce the development cycle and manufacturing costs and improve product quality.
In this regard, it was intended to construct a tolerance design framework based on concurrent engineering. The proposed framework can make fundamental changes to the existing organization of the company and employs specialists from different departments to form a concurrent design team. The tolerance design cycle in the whole development cycle can be divided into seven stages. The inputs and outputs of each department at each stage are defined in detail. Specialists from different departments form a concurrent engineering team to work together and quickly solve problems. Then the proposed design method was applied to the gap tolerance design of the taillight and side body of an automobile.
This article can be organized as follows: Sect. 2 begins with an overview of the concurrent tolerance design, and then the detailed work process of each stage, including the definition of DRs, dimension chain identification, GD&T design, variation analysis, and validation, is discussed. In Sect. 3, the applications of the proposed method in the tolerance design of automobile taillights are introduced. The obtained results are discussed in Sect. 4. Finally, the conclusions and main achievements are summarized in Sect. 5.
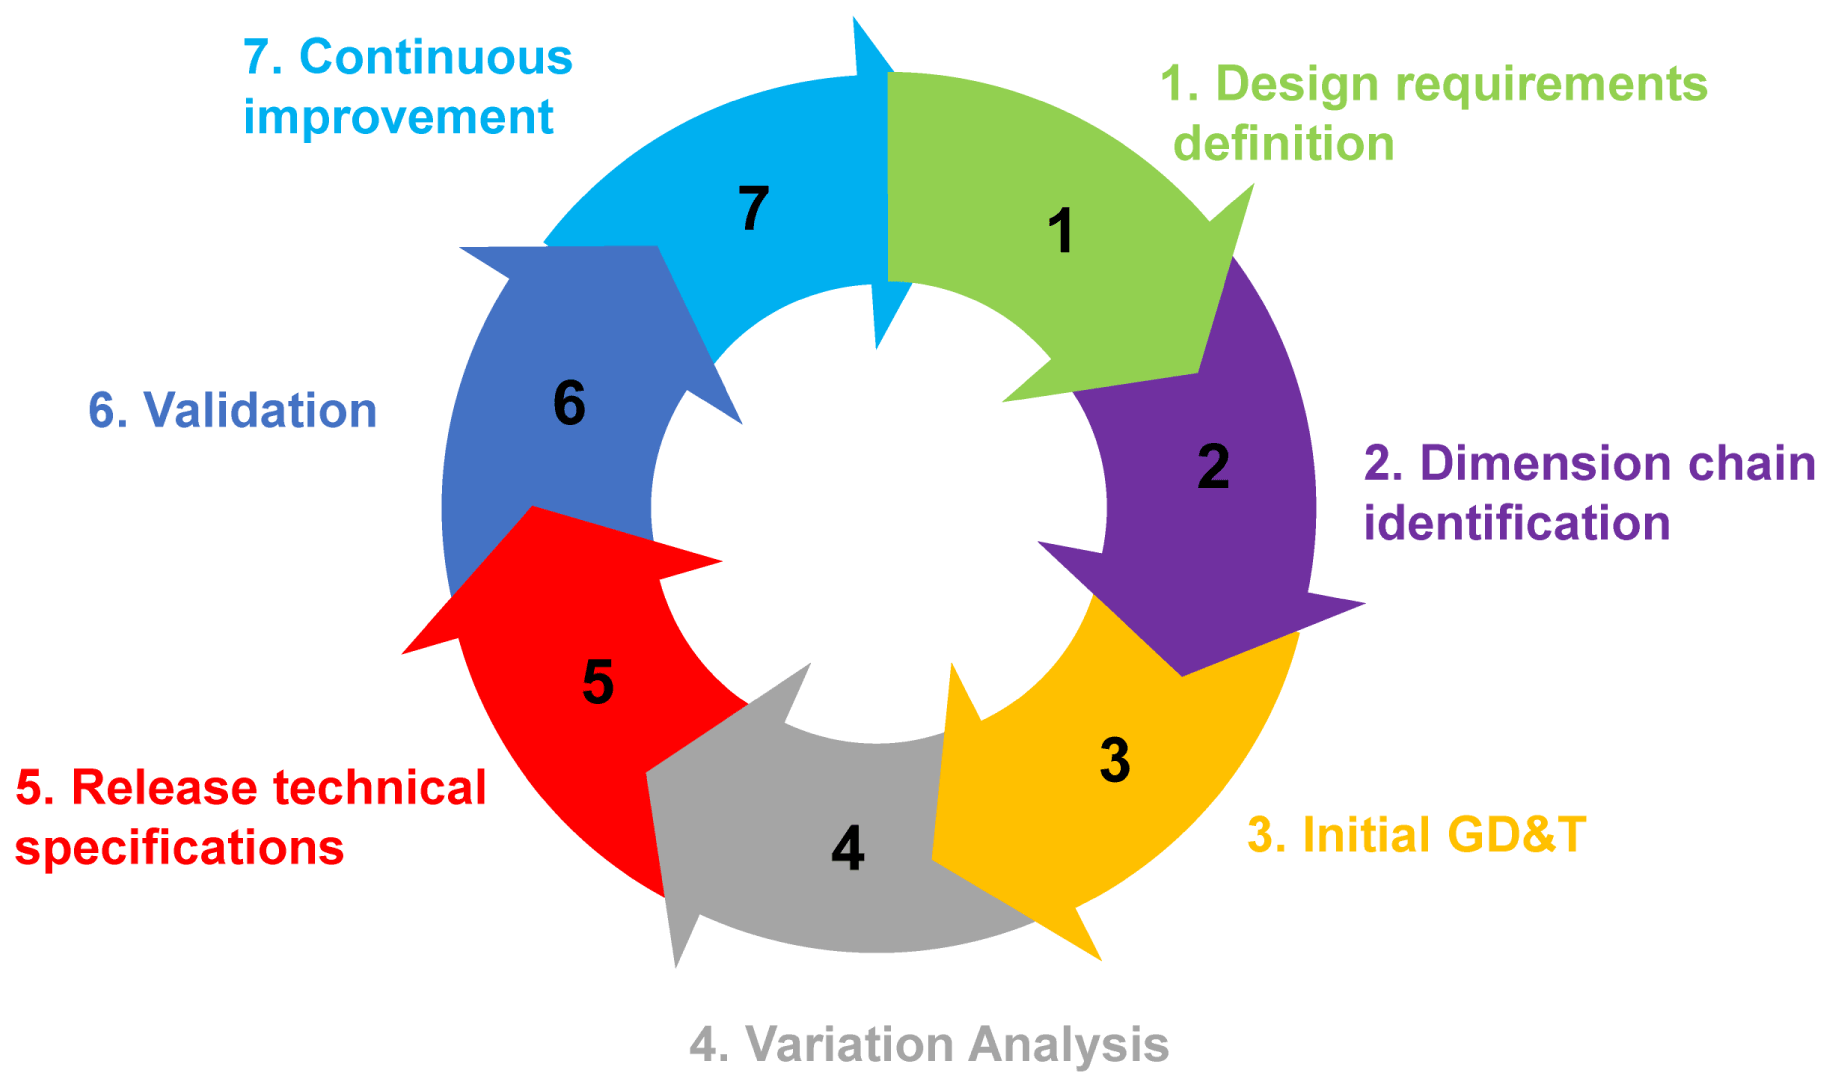
Figure 1 shows the main tasks at each stage of the tolerance design cycle. These tasks include the definition of DRs, dimension chain identification, initial GD&T, variation analysis, releasing technical specification, calculation validation, and continuous improvement. Performing these tolerance activities requires comprehensive expertise and skills in tolerance, manufacturing, quality, and manufacturing costs to select appropriate tolerance specifications.
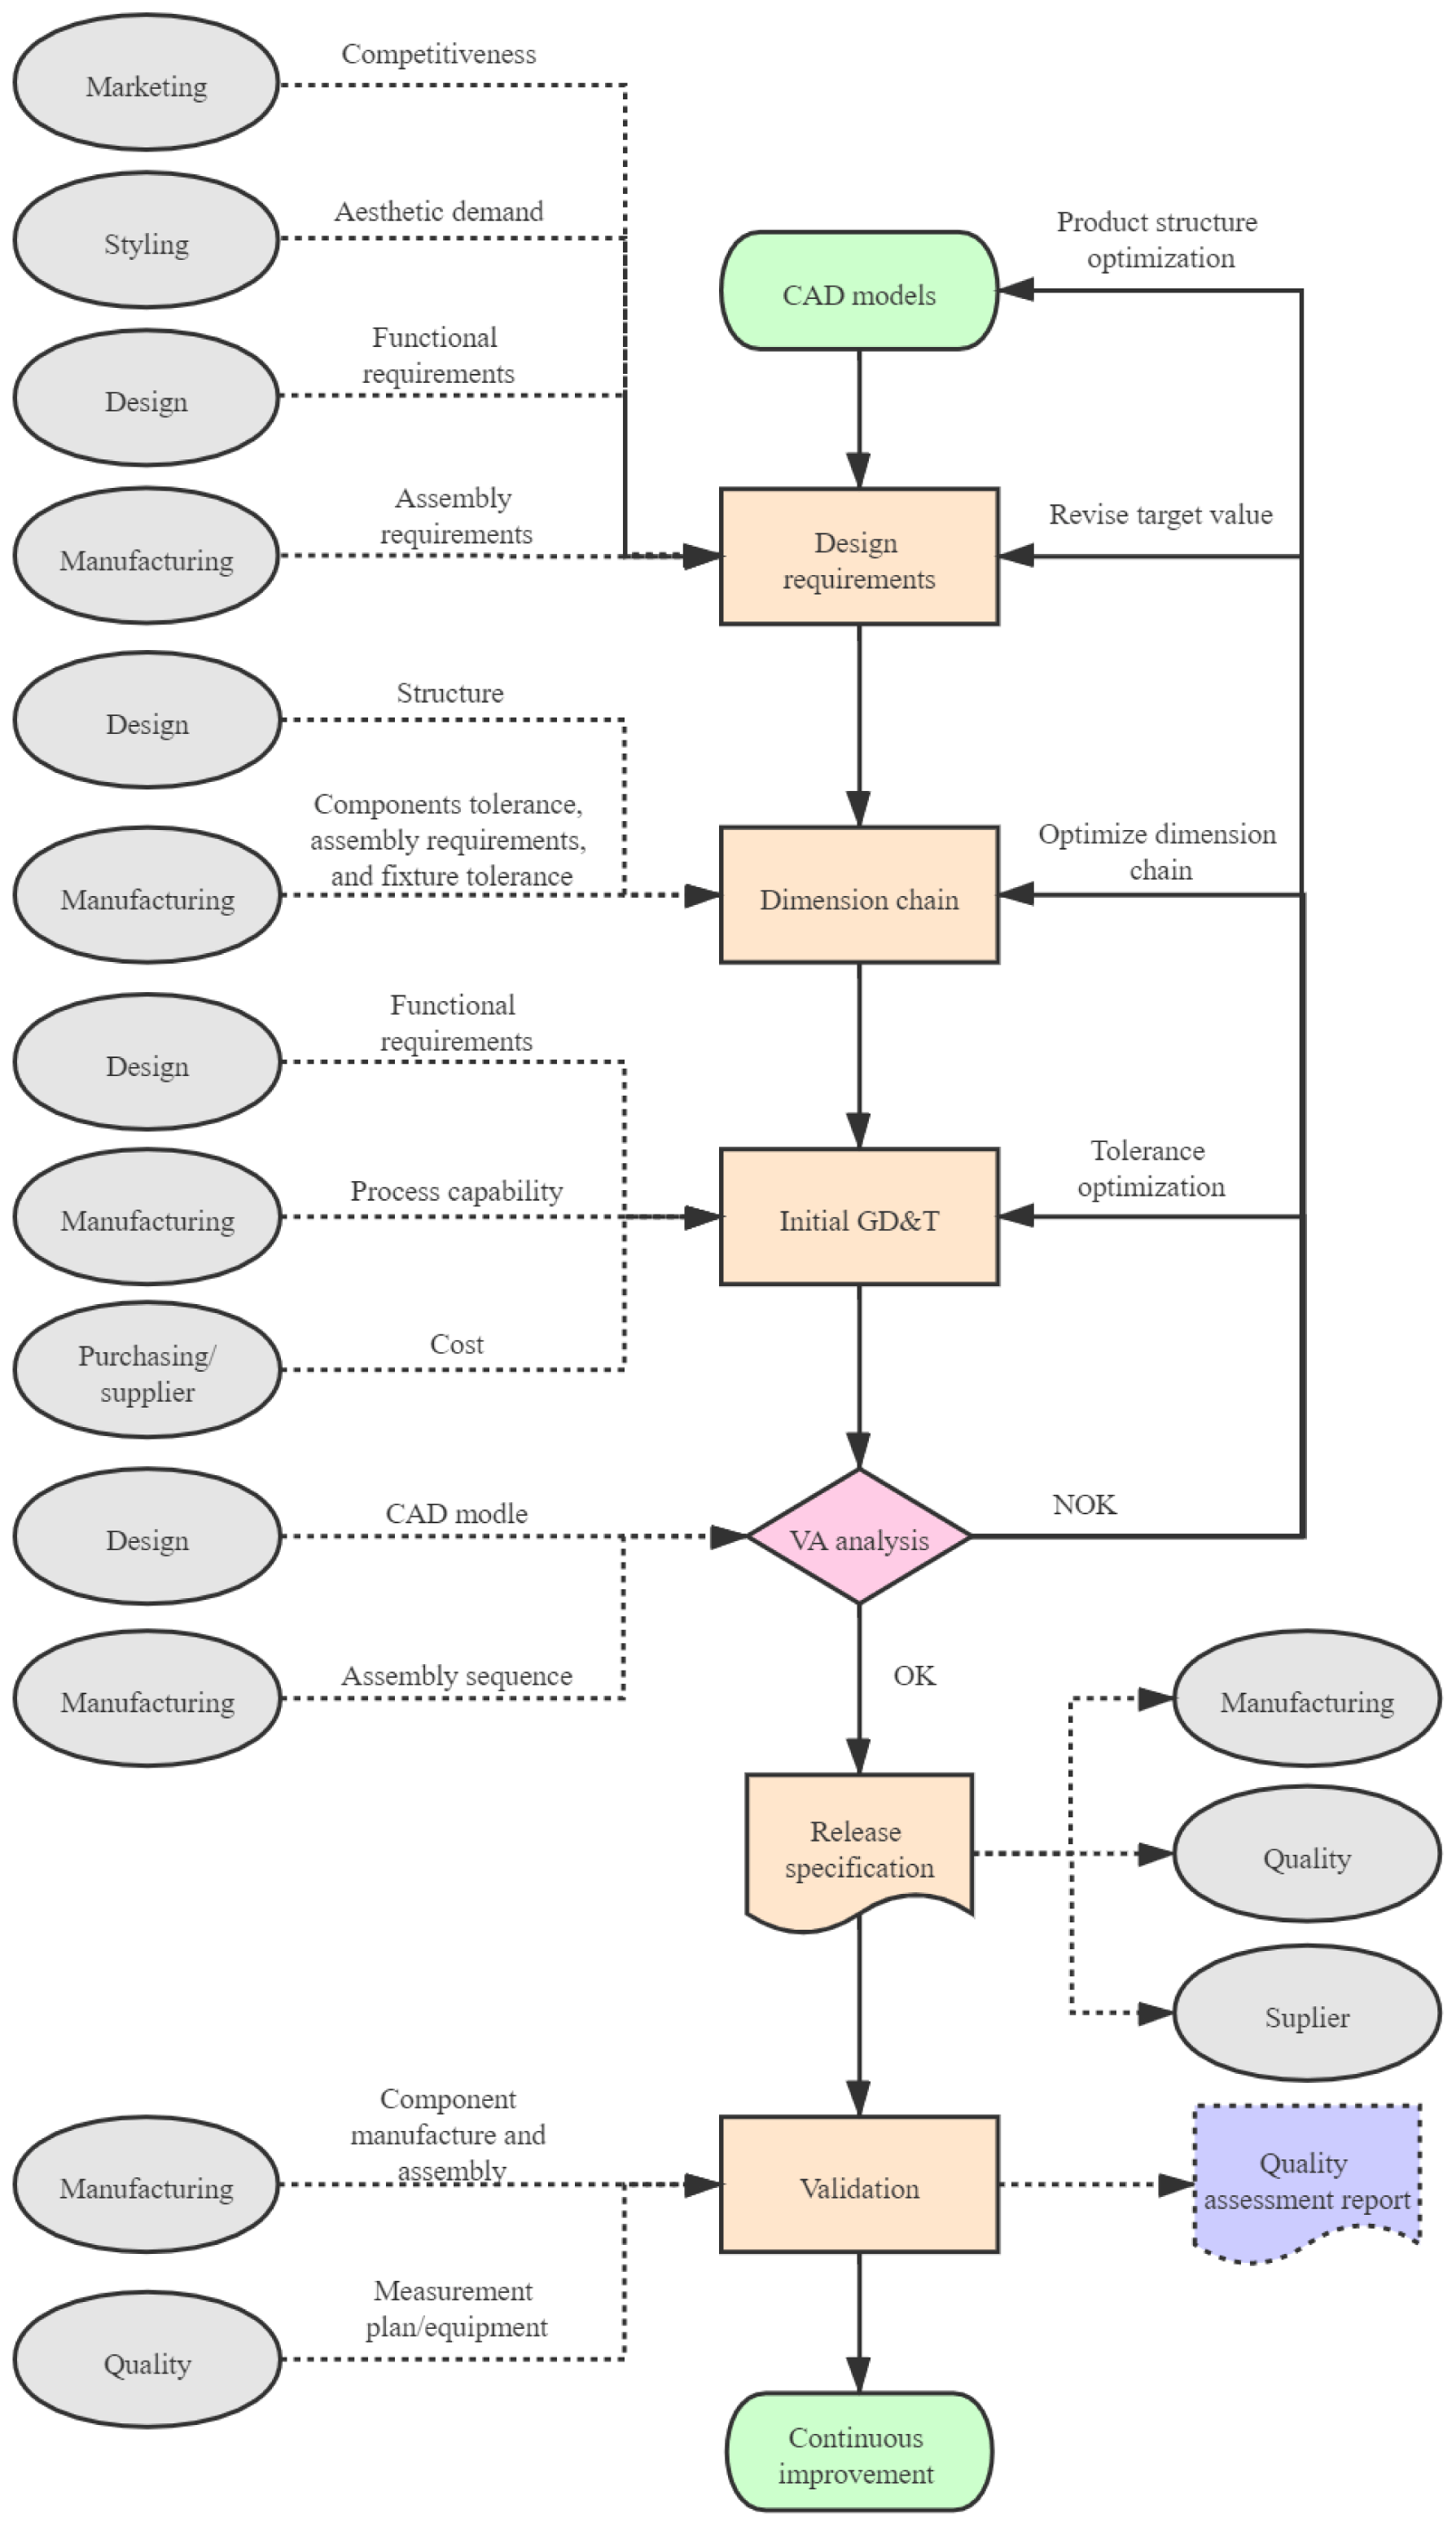
The main objective of the present study is to propose an improved tolerance design methodology based on concurrent engineering. In this regard, it is necessary to form a cross-functional development team before starting the project. The minimum required specialists are stylist, designer, manufacturing engineer, quality engineer, marketing specialist, and purchaser. The subsequent tolerance design activities are determined by this concurrent engineering team. Figure 2 illustrates the framework of the proposed methodology. The DRs, obtained from the marketing, styling, design, and manufacturing departments are the resultant of several indicators such as market competitiveness, aesthetic, and functional and assembly requirements. It should be indicated that the development of a new product starts with the definition of DRs in the form of technical specifications (e.g., the definition of gap or flush between two different parts). Then the next step is to identify the dimension chains. The main purpose of this step is to find out the sources of variations such as tolerance of different components, assembly sequence, and fixture tolerance. Once the dimension chain is identified, the GD&T drawings for each component should be designed. The initial values of the tolerances are normally set based on the process capabilities and cost targets of the firm. Then the variation analysis (VA) is performed through the 3D computer-aided tolerance (CAT) analysis software to simulate the assembly process. If the estimated variation meets the predefined DRs, initial specifications such as DRs and GD&T drawings will be updated as the official version and released to the relevant departments. On the other hand, if the estimated variation does not meet the predefined DRs, then composition loops of the dimension chain should be optimized. The possible factors that may affect the variation include the part tolerance, product structure, assembly sequence, and fixture structure. Optimization is repeated for other factors until the results of the variation analysis meet the requirements.
When components are manufactured, the measurement of the parts should be carried out on the checking fixture first, and then matching certification on the matching fixture. The qualified parts will be used for the assembly of the automobile. The quality department will monitor the production data of the functional dimension and issue quality assessment reports. Finally, the design engineer, manufacturing engineer, and quality engineer will continuously improve the product quality according to the results of quality assessment reports.
2.1 Definition of DRs
Three different types of DRs need to be defined: aesthetic requirements, functional requirements, and assembly requirements.
Considering the intensification of commercial competition in the market and continuous improvement of the consumption levels, the aesthetic appearance of automobiles has become a parameter influencing the purchaser's choice. Aesthetic appearance plays an increasingly important role in improving the exchange value, competitiveness, and sale of the product. Aesthetic requirements refer to the design requirements such as gap, flush, symmetry, and alignment that improve the aesthetic appearance of the product. Among these design requirements, the design of the gap, flush, and alignment of interior and exterior trim have an undeniable impact on the aesthetic quality of automobiles. On one hand, different areas of the automobile have different sensitivities to aesthetic appearance, resulting in different aesthetic requirements. For example, customers pay little attention to the gap and flush in the roof area, indicating that the aesthetic requirements of this area can be reduced. On the other hand, due to the manufacturing and assembly tolerances of the parts, the visual effect of the final product differs from the designed model. This difference is especially more pronounced for small features. For example, under the same variation, the visual difference of interior buttons is higher than that of doors. Therefore, these parameters should be considered when determining the aesthetic requirements to ensure the aesthetics of important areas and reduce the requirements of other areas.
Assembly requirements refer to the requirements that ensure the smooth assembly of parts. Studies show that assembly tolerance plays an important role in improving assembly accuracy and shortening the production time. Strict tolerances guarantee the assembly accuracy and facilitate the assembly, but they increase the manufacturing costs. Accordingly, the tolerance requirements of parts should be reduced as much as possible to cut costs.
Functional requirements refer to the requirements that enable the product to perform certain functions such as sealing, noise reduction, and aligning four-wheel parameters. Compared with the aesthetic requirements, the number of these functional requirements is relatively small, indicating fewer tolerance design challenges.
2.2 Dimension chain identification
Since many factors affect the tolerance of DRs, it is necessary to analyze the tolerance stack-up. Dimensions in the tolerance stack-up are arranged similarly to links in a chain. Accordingly, each dimension in the dimension chain is called a composition loop. The total number of composition loops depends on the total number of components and the assembly complexity. The more the total number of components and the more complex the assembly process, the more the composition loops.
Identification of the dimension chain is one of the most challenging tasks in tolerance design. The main objective of this process is to find variables that affect the tolerance of DRs. These variables can be mainly classified into two categories. Variables of the first category can be directly identified from the 3D model. Feature tolerance and the fitting gap between different parts are in the first category. Variables of the second category are related to the manufacturing process so that they cannot be obtained directly from the 3D model of the product. For example, fixture scheme, assembly sequence, manufacturing tolerance of tools, and the fitting gap between tools and parts fall in the second category. Latter variables affect the tolerance of DRs to a different extent. Moreover, they have different adjustment costs compared to the former parameters. For example, small adjustments in the assembly sequence of parts in some cases may greatly reduce the variation in the target tolerance without any additional cost. Therefore, the optimization of assembly sequence has a high priority in tolerance optimization.
2.3 GD&T design
With the rapid advancement of science and technology, the way of specifying tolerances has progressively changed during the last two decades. In the traditional linear tolerancing method, allowable tolerances are simply assigned to dimensions of features in the form of positive and negative tolerances. Despite the simplicity of this tolerancing method, it cannot reflect the actual mating relationship between different parts. With the continuous improvement of precision requirements in industrial products, intrinsic uncertainties and inefficiency issues of this method become apparent (Voelcker, 1993, 1998). In order to resolve these limitations, the GD&T approach has been proposed.
GD&T sets the values of certain attributes of a feature and allows the designers to specify the maximum available tolerance and consequently design the most economical parts. The types of tolerances are classified into six categories: size, form (flatness, straightness, circularity, and cylindricity), orientation (parallelism, perpendicularity, and angularity), position (location and concentricity), runout (circular and total), and profile (line and surface) (Shah et al., 1998). Applying GD&T techniques properly in the product development process will improve product quality and reduce manufacturing costs.
Generally, the marking of GD&T in different industries is mainly performed based on ASME Y14.5-2018 or ISO 1101 standards (Rong et al., 2010; Anselmetti et al., 2010). To ensure consistent tolerance in the manufacturing and inspection processes, it is necessary to define a uniform locating scheme and the part tolerance. At the initial stage of the product development, almost most of the affecting parameters such as detailed structure, assembly process, and tooling of the parts are not yet defined. Accordingly, the initial tolerances of each component are normally determined based on processing limitations, cost target, and previous experience of the company. It is worth noting that a tight tolerance leads to high quality, but it increases the manufacturing costs. Moreover, the locating schemes and tolerances of parts affect the design, manufacturing costs, and cost of jigs and checking fixtures. Applying concurrent engineering is an appropriate solution to determine the locating scheme and tolerances. After analysis and optimization of tolerances, the draft GD&T is updated and the official version is issued for the manufacture, quality departments, and suppliers.
The initial tolerance of each composition loop can be adopted from the previous experiences and manufacturing limitations. Generally, tolerance design requires expert designers who have mastered the assembly process and have rich manufacturing experiences. However, manufacturing engineers are more professional in these areas than design engineers. Consequently, one good alternative is to integrate design with manufacturing through concurrent tolerance design to reduce design changes.
2.4 Variation analysis process
Variation analysis refers to the process of determining the accumulative variations between different features. This analysis is an essential step to evaluate the target tolerances of design requirements. The first step in predicting the accumulative variations is to build an analytical model. Currently, three analytical models are used in this regard. These models are discussed in the following subsections.
2.4.1 Worst-case analysis
Worst-case (WC) analysis is a manual analysis approach that can calculate the tolerance in only one direction at a time (Fortini and Fortini, 1967). This model can be mathematically expressed as the following:
where TASM is predicted assembly variation, Ti is the component tolerance, n is the number of components.
WC method assumes that all dimensions in the dimension chain are at their maximum or minimum limit simultaneously, resulting in the worst possible assembly limit (Khodaygan et al., 2010). In actual production, however, the tolerance will be different from what is predicted by the WC analysis. Most of the dimensions may be closer to their nominal values instead of either extreme value. Also, some of the dimensions that the WC model demands to be at their upper limit may be closer to their lower limit, and vice versa (Fischer, 2011). WC method is usually used by designers to assure that all assemblies are within the specified tolerance limit. However, as the total number of components in the assembly increases, the component tolerances must be greatly reduced to meet the final design requirements, resulting in higher production costs (Chase and Parkinson, 1991).
2.4.2 Root-sum-square method
The root-sum-square (RSS) method is commonly used in manual statistical tolerance calculations based on Excel spreadsheets. In this method, tolerances can be determined by the square root of the sum of the square tolerance values in the form below (Fortini and Fortini, 1967):
where TASM is the predicted assembly variation, Ti is the component tolerances, n is the number of components.
The predicted tolerance of the RSS method is usually less than that of the WC method for the same stack-up. This difference allows the designer to relax the tolerances of components or improve the design requirements. Studies reveal that the performance of the RSS method improves as the number of composition loops of a dimension chain increases.
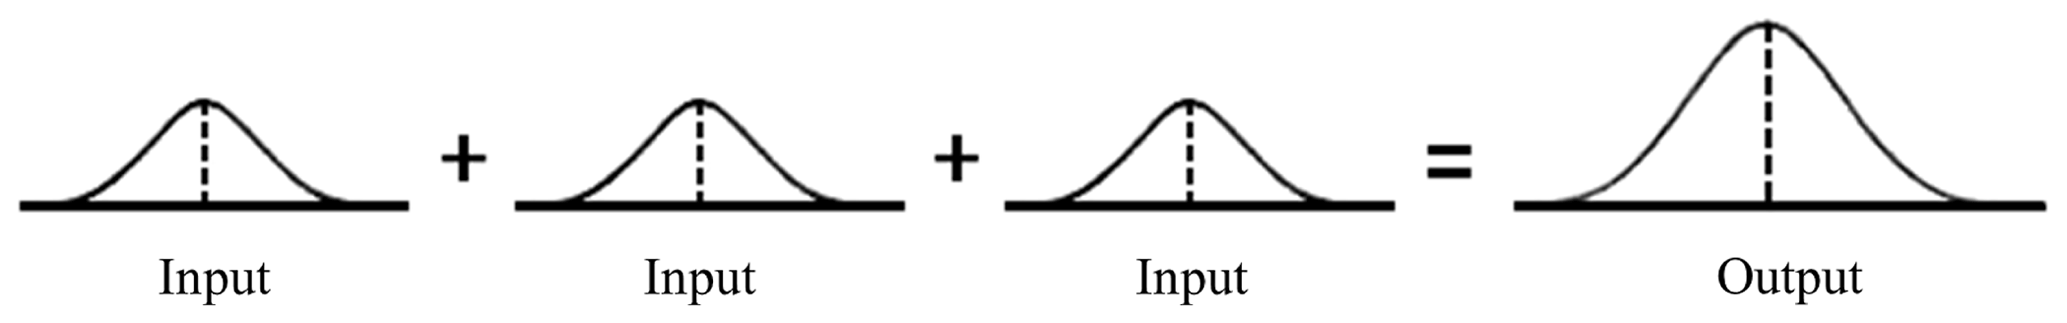
However, the main drawback of the RSS approach is the strict constraints on the manufacturing process. As a result, the manufacturing process in the RSS model should be controlled, indicating that the dimensions after manufacturing are the same as the design values. Moreover, tolerances of all components in the dimension chain should obey a normal (Gaussian) distribution to ensure that the assembly also follows a normal (Gaussian) distribution. This issue is schematically shown in Fig. 3.
2.4.3 Monte Carlo simulation
The Monte Carlo method is the most popular method to simulate tolerances of assemblies in the 3D CAT analysis (Bruyère et al., 2007). Chase compared different tolerance analysis methods and concluded that the most satisfactory results can be achieved from the Monte Carlo method (Chase and Parkinson, 1991). This method has been widely adopted as a powerful tool for 3D tolerance analysis. It allows the tolerance analyst to survey different combinations of translational and rotational variations. The main advantage of the Monte Carlo simulation is that it can be used in all types of distributions. In other words, it is not restricted to normal distributions. Some of the most widely used statistical distributions in the Monte Carlo simulation are beta, gamma, normal, triangular, uniform, and Weibull distributions (Barbero et al., 2014). Figure 4 illustrates the simulation flowchart of the Monte Carlo method, indicating that the main workflows of this method are as follows:
-
Specify the distribution type and tolerance values of each dimension variation and define the assembly function.
-
Formulate the measurement function and specify the design limits according to the target tolerance of DRs.
-
Apply a random number generator to generate the dimensions of each component. Then the dimension of DRs is calculated using the assembly function. The calculated dimension is compared with the limits of DRs to determine if it meets the specification.
-
Go to step 3 until the defined number of assemblies are simulated to estimate the percent of assemblies rejected based on the specified tolerances.

2.4.4 Tolerance analysis software
Currently, numerous commercial 3D CAT software programs such as VisVSA, 3DCS, CETOL, and Sigmund are available in the market. These applications are based on either the linear method or the Monte Carlo method.
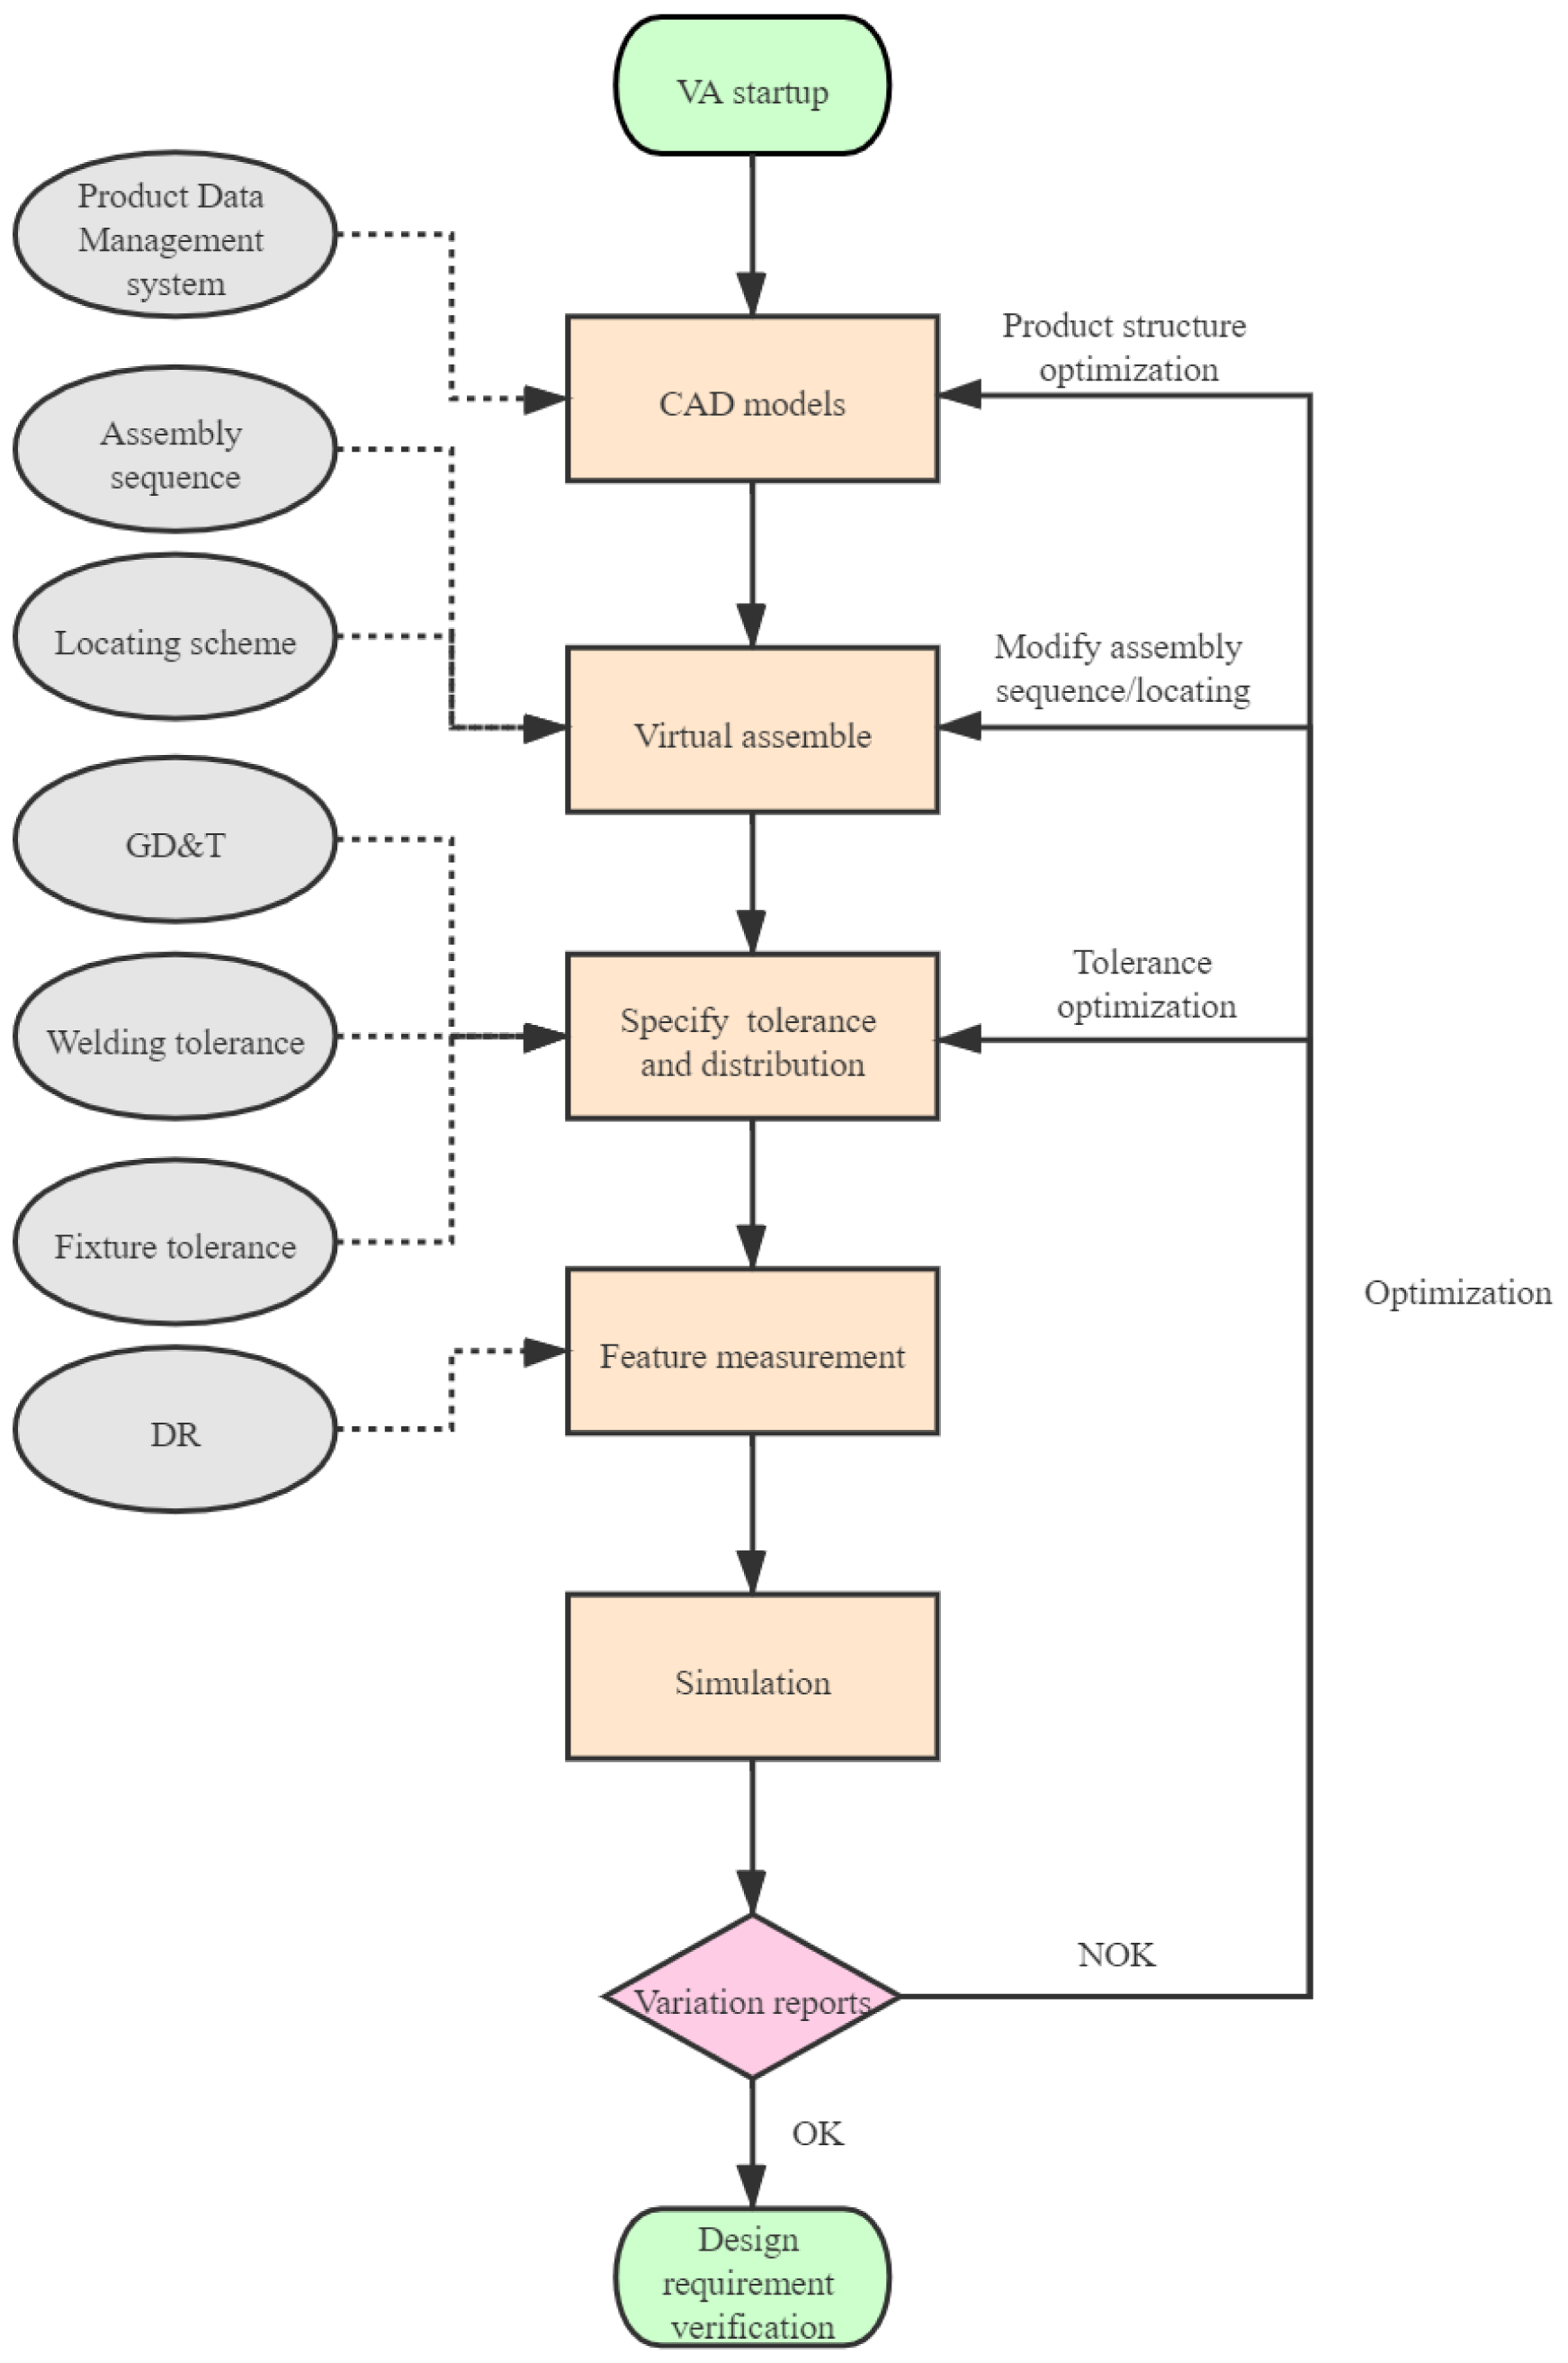
Figure 5 shows the variation simulation process in 3D CAT software. It is observed that the CAD models obtained from the product data management system are initially imported into the CAT software. Then, the virtual assembly is performed according to the assembly sequence to establish the mating relationships between the parts. In the third step, locating systems and tolerances of components are defined based on the GD&T drawings, process capability, and fixture tolerance. In this step, the tolerances of all composition loops related to the design requirement are specified. Moreover, statistical distribution is simultaneously specified for each tolerance. The next step is to formulate the measurement function, which refers to the dimension of the target variation according to DRs. Subsequently, a set of component dimensions is generated using a random number generator to simulate the dimensions of the components. The generation process should be repeated many times to estimate the standard deviation. Finally, the percent of assemblies that will be rejected based on the specified tolerances can be obtained. The number of iterations required depends on the desired output accuracy (Cvetko et al., 1998). A large number of samples may be required for accurate results. The typical sample size used in the automotive industry ranges from 5000 to 10 000. When the simulation converges to the solution, variation reports can be generated. The reports usually contain the mean, the standard deviation, and the percentile rejection of the output variable.
Variation analysis, a decision-making process, is used to determine the variations of the DRs. The numeric information obtained from the variation analysis helps to answer the question of a specific tolerance design. When a variation analysis is completed, the results can be used to determine if the design satisfies the DRs. If the estimated variation does not meet the DRs, an optimization design is required. The commonly used optimization methods include modifying product structure, optimizing locating and tolerance, changing assembly sequence, and adding assembly fixtures, etc. If these measures fail to satisfy the DRs, modifications of the target values of the DRs are needed.
2.5 Validation
When all components are manufactured, the quality engineer should check the dimensions of the components using appropriate gauges or the coordinate measuring machine and prepare verification reports. If there are unqualified measuring points, rectification should be made. Meanwhile, qualified parts can be used for subsequent assembly.
The main purpose of automobile matching is to verify the mating relationship between different parts, including interior and exterior dimensional technical specification (DTS) matching, product function matching, and process matching. Meanwhile, automobile matching verifies the assembly risk in advance for online mass production. It is worth noting that although all individual parts meet the tolerance requirements, the overall tolerance of the product may exceed the DR. This is because the tolerance accumulation can cause the target dimension to exceed the tolerance when multiple parts simultaneously approach the maximum or minimum limit size. The main purpose of the vehicle matching process is to prevent these problems before formal production and reduce the risk of producing unqualified products. By analyzing the dimensions, assembly sequence, and tool schemes of the parts, this problem can be identified. Then the production equipment such as molds and fixtures are adjusted within the tolerance range specified in the technical specifications to meet the target tolerance.
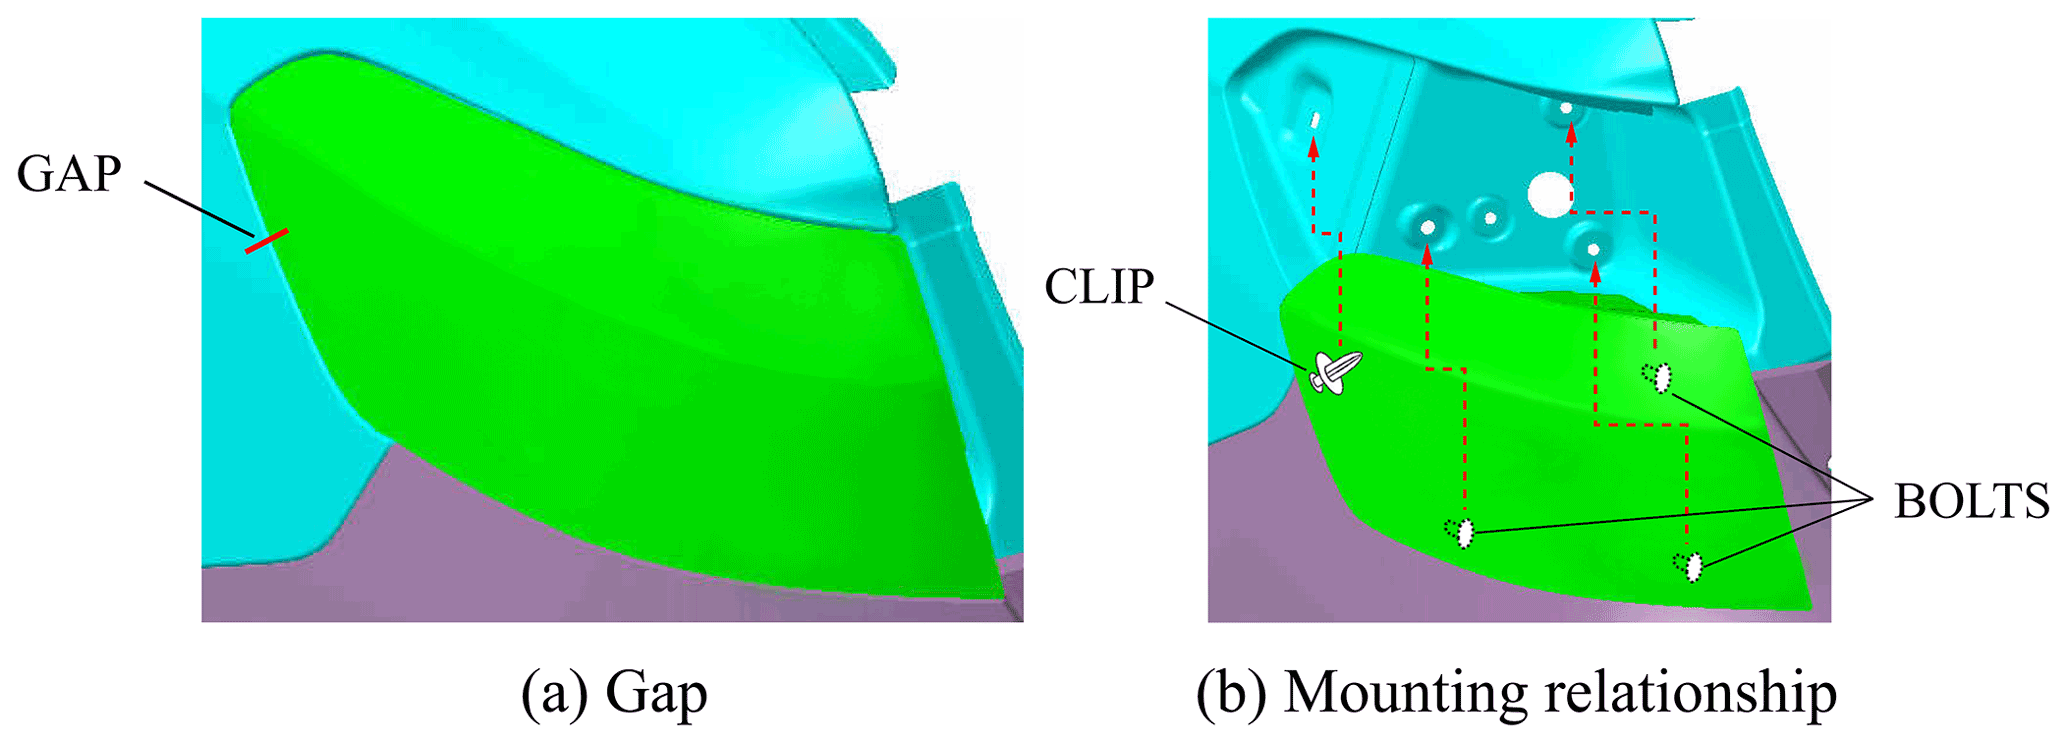
In this section, it is intended to apply the proposed methodology to the tolerance design project of a taillight. The matching quality between the taillight and the bodyside has always been the focus of the aesthetic quality design. Figure. 6a illustrates the design requirement (the gap between taillight and bodyside). Moreover, Fig. 6b illustrates the mounting relationship between the taillight and bodyside. There are one clip and three preset bolts on the taillight, where two bolts are used for locating and mounting and the third one is used for mounting only. The construction of concurrent tolerance design can be summarized as follows.
3.1 Step 1 – defining DRs
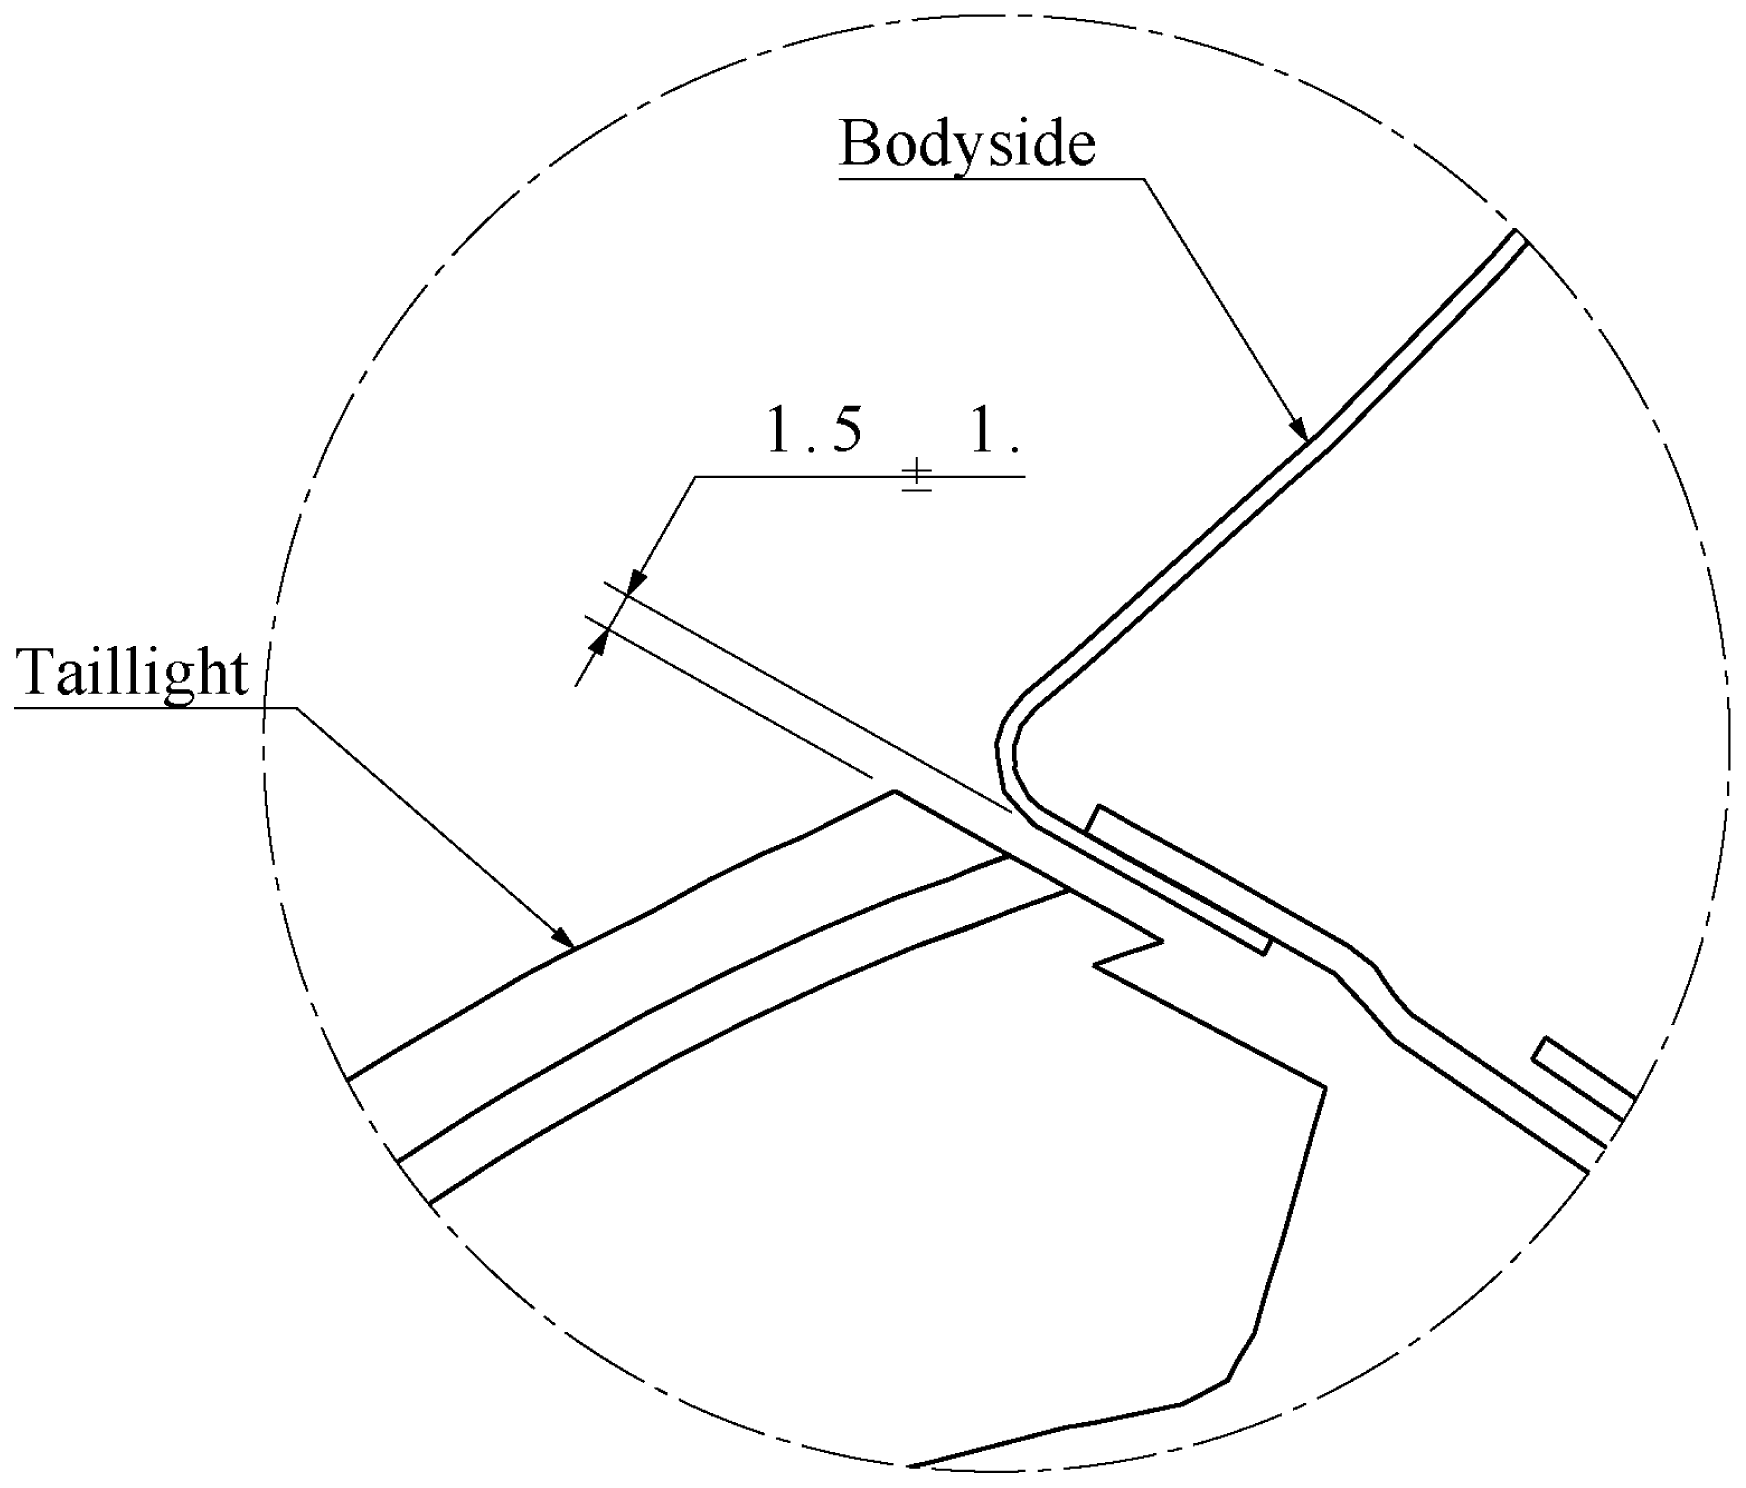
DRs for the matching of taillight and bodyside mainly include the gap and flush that affect the aesthetics. The higher the fluctuation of the gap and flush, the lower the aesthetic quality, thereby the lower the product sale. Accordingly, marketing, styling, and design personnel prefer to reduce the gap and flush as small as possible to improve the aesthetic quality. However, a smaller gap and flush will inevitably increase the manufacturing complexity, thereby increasing the manufacturing costs. In the present study, the optimal DRs are obtained by setting up a concurrent design team, holding regular group meetings, and balancing the product competitiveness, cost, and manufacturing capacity. Accordingly, the nominal bodyside–taillight gap and the corresponding tolerance were set to 1.5 and ±1.0 mm, respectively, as shown in Fig. 7.
3.2 Step 2 – identifying the dimension chain from DRs
The concurrent design team determines the positioning, fixtures, assembly sequence, and fastening methods of the taillight and bodyside. Then the composition loops can be determined as follows:
-
the profile tolerance of the gap matching surface of the taillight
-
the float between the pin and pinhole
-
the profile tolerance of gap matching surface of the bodyside.
3.3 Step 3 – defining the GD&T for taillight and bodyside, including the datum reference system, tolerance types, and tolerance values
To avoid the tolerance accumulation caused by datum transfer, the design, manufacturing, and inspection data of parts should be consistent. It should be indicated that the determination of these data will affect the design of molds, jigs, and checking fixtures. Therefore, these data should be jointly determined by design, manufacturing, and quality engineers. In this study, deviations of mating surfaces of the taillight and bodyside were more concerned. Accordingly, GD&T drawings of the taillight and bodyside were designed according to the ASME Y14.5-2018 standard. Table 1 presents the tolerance information in this regard. The surface profile of the taillight and bodyside and the float between pin and pinhole are set to 1.4 and 0.5 mm, respectively.
Table 1Tolerance of the composition loop.
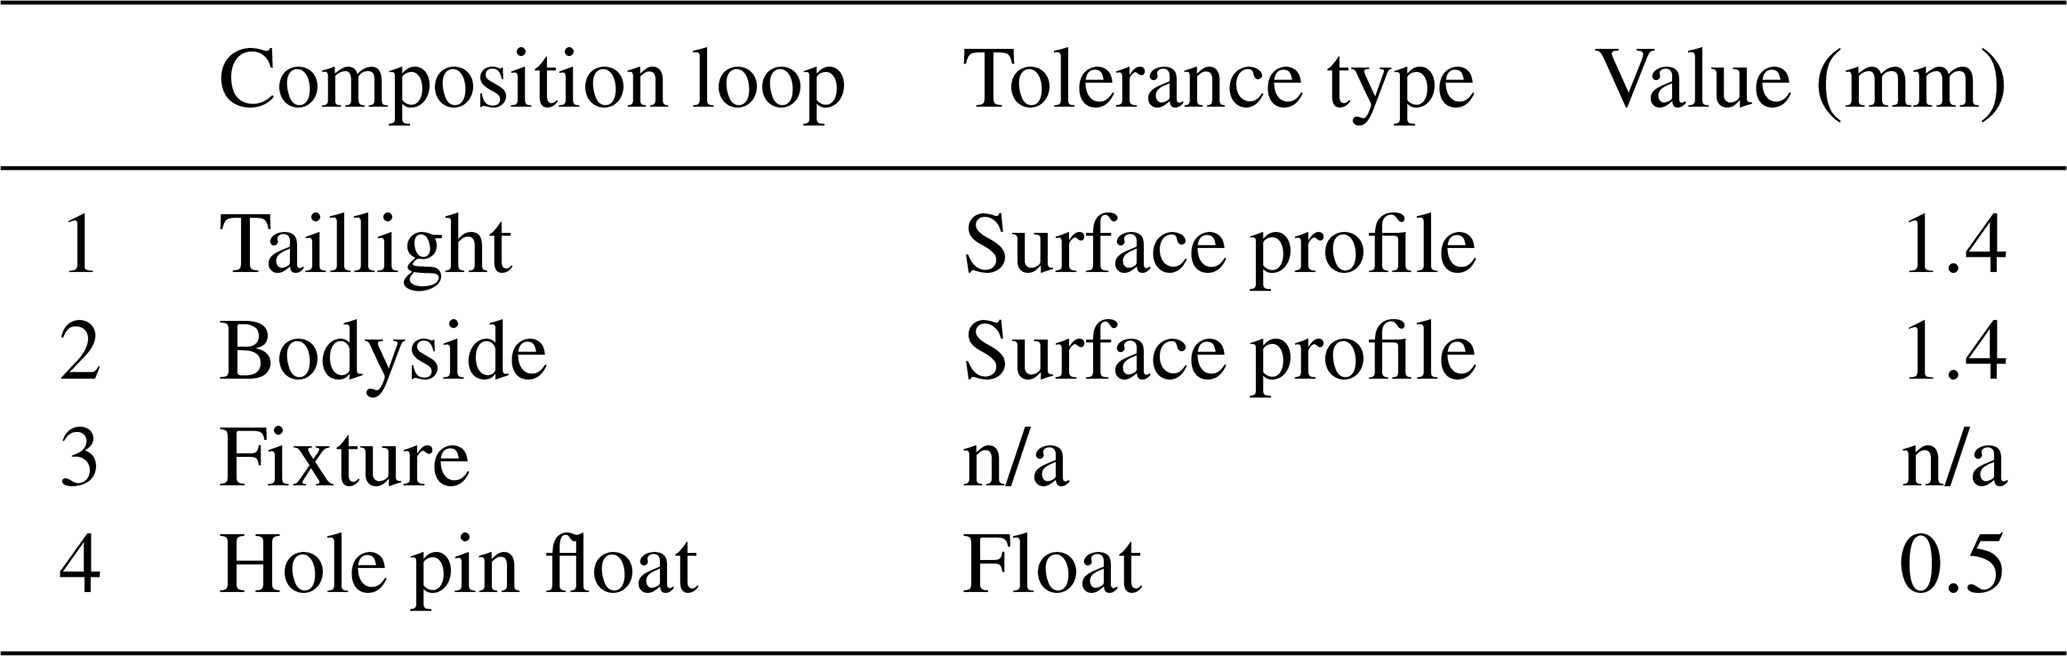
n/a – not applicable.
3.4 Step 4 – variation analysis
In this article, 3DCS software was used to perform the tolerance analysis. The main steps in this regard are as follows:
-
Virtual assembling consists of mounting the taillight on the bodyside by the “move” operation according to the designed assembly sequence. The locating system of taillight was set according to the GD&T defined in Step 3.
-
Tolerance of the parts is defined. Dimensions and tolerances of the mounting holes and mating surfaces of the taillight and bodyside were defined based on GD&T drawings.
-
Measurements are defined. The main objective of the measurement definition in 3DCS is to monitor the variation of the target dimension.
-
The number of Monte Carlo iterations is set to 5000.
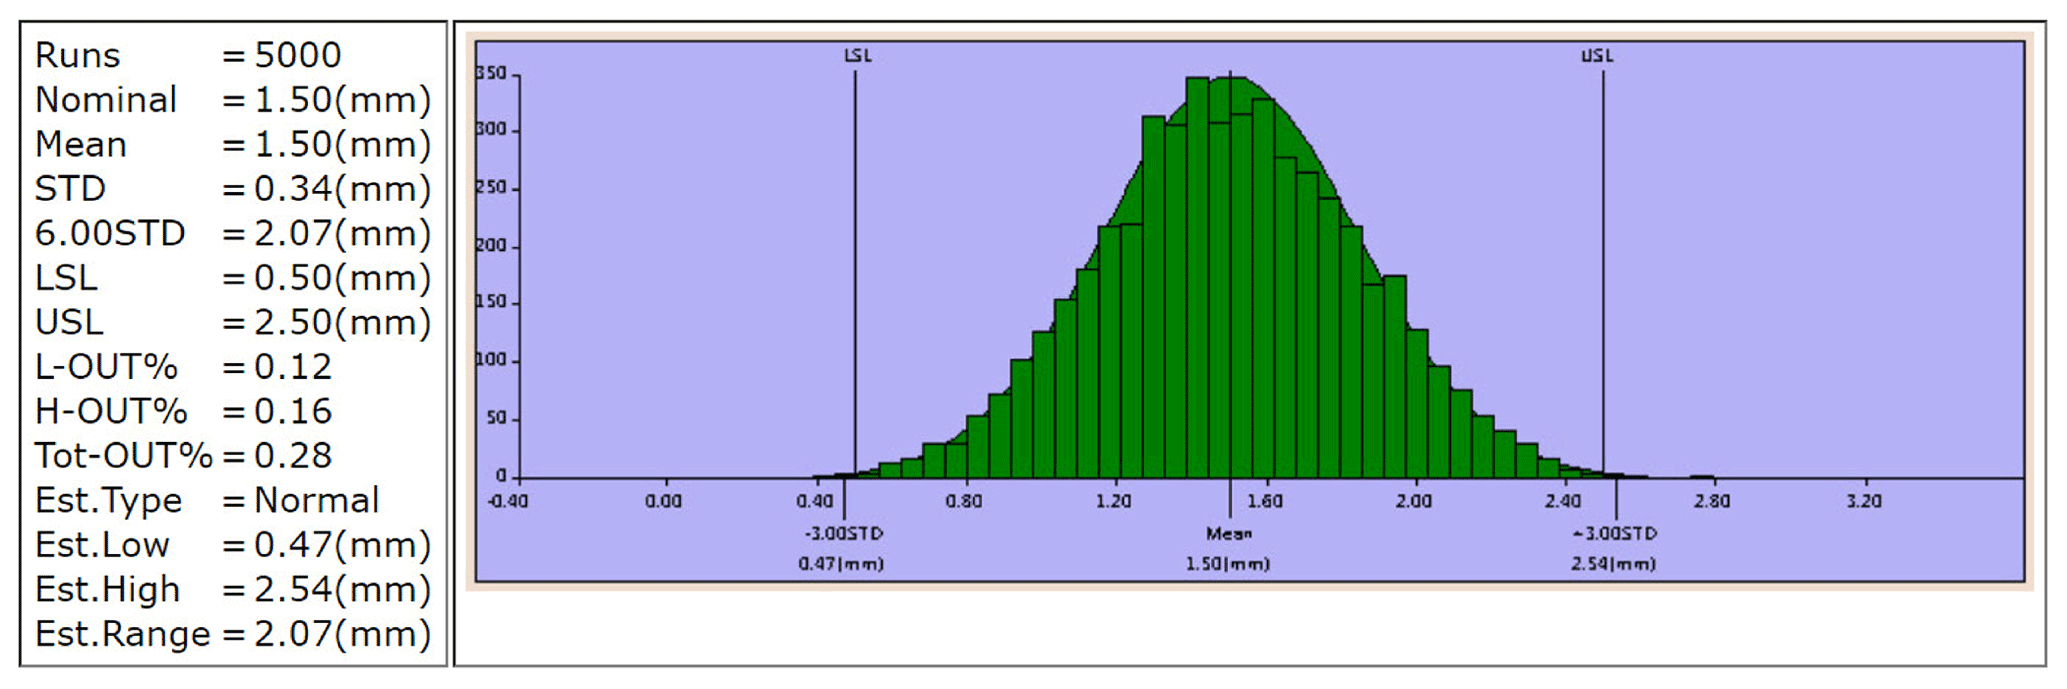
Figure 8 illustrates the predicted quality. The mean value of the predicted gap and estimated upper and lower limits are 1.50, 0.47, and 2.54 mm, respectively. Moreover, the total out-of-tolerance gap accounted for 0.28 %.
3.5 Step 5 – validation
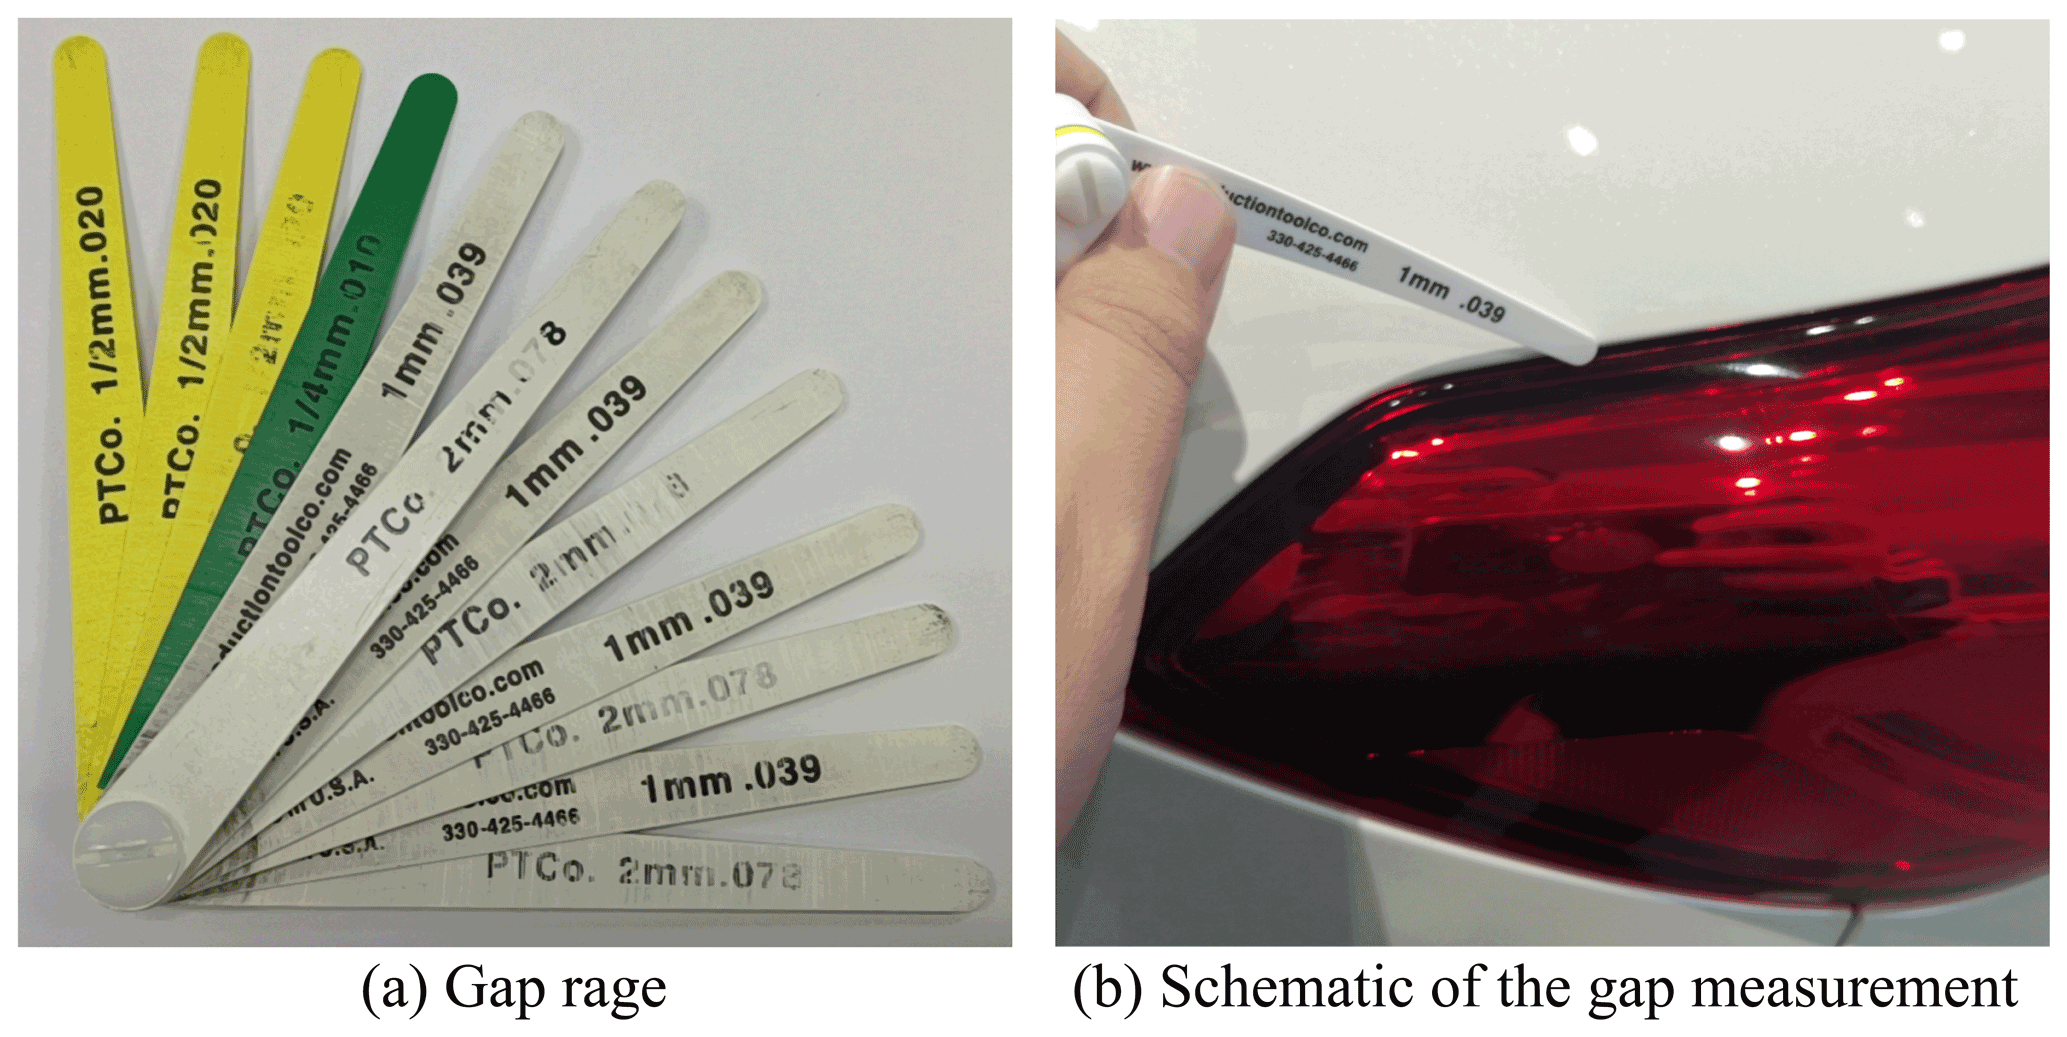
In order to evaluate the manufacturing quality and assemblability of taillights and bodyside, dimensions of mating features were measured using checking fixtures and a coordinate measuring machine. The measured results were recorded for subsequent analysis and debugging of probable matching problems. Figure 9 shows the gap between the taillight and bodyside measured by a gap gauge. Finally, 50 cars were randomly selected and measured in the production line and a statistical histogram was made. Figure 10 illustrates the statistical distribution of the gap. It is observed that the mean value of the gap is 1.5368 mm, which is close to the nominal value of 1.5 mm. Moreover, one measured gap is greater than the upper specification limit, which accounts for 2 % of the total measured gaps and falls within the allowable out-of-tolerance range. The unqualified product can meet the design requirements after repair.

In the present study, a structured tolerance design methodology was proposed to help engineers solve tolerance problems through step-by-step instructions. The concurrent-engineering-based method describes the tolerance design framework in detail and specifies the work content and responsibilities of members at each stage.
For highly complex products such as automobiles, the most challenging part in the production is not the manufacturing of the single parts but the quality control of the assembling and the trade-off between the product quality and the manufacturing cost (Kong et al., 2009). To this end, a development team consisting of engineers from relevant departments was established to balance the needs of each department at the onset of the product development.
In the proposed tolerance design framework, tolerance design activities were divided into seven stages. These tasks were carried out in sequence according to the project development schedule. The concurrent tolerance design method determines the responsibilities of the team members at each design stage. Team members work together, follow the same design process and methodology, and jointly determine the design targets for each stage. This new methodology integrates the product design with manufacturing and inspection considerations. In this way, the design requirements of different departments can be balanced while avoiding conflicts of requirements. The proposed approach and working mode significantly improve the development efficiency, reduce design changes, and reduce development costs.
The proposed methodology was applied to predict the gap variation between taillight and bodyside. By setting up a concurrent design team and weighing the requirements of different departments, the optimal gap is 1.5±1.0 mm. To maintain the consistency of the design, manufacturing, and measurement data of different parts, the datum schemes of parts were established jointly by design, manufacturing, and quality engineers.
Finally, based on the Monte Carlo algorithm, the gap between the taillight and the bodyside was simulated in the 3DCS software environment. The obtained results show that the total out-of-tolerance gap accounted for 0.28 %, implying that the target DR is well achieved. Then 50 cars were randomly selected to validate the simulation, and the gap was measured after the assembly. The calculated and measured mean values of the gap were 1.5 and 1.5368 mm, respectively, indicating the simulation error of 2.5 %. The obtained results demonstrate that the predicted tolerance is consistent with the tolerance distribution of actual production.
In the present study, a concurrent tolerance design methodology was proposed to predict the tolerance of DRs. In this regard, the product design is integrated with manufacturing and inspection indicators to balance the design tolerance, process tolerance, and manufacturing cost.
To this end, a concurrent tolerance design team, including stylist, design engineer, manufacturing engineer, quality engineer, marketing specialist, and market analyzer, is established to balance the competitive requirements of different departments in the tolerance development process. The specifications of DRs, dimension chain, and GD&T drawings are jointly determined by the concurrent engineering team. Finally, the proposed method was applied to the gap design between the taillight and bodyside of an automobile.
The main achievement of this article is that the strategies and methods of concurrent engineering are introduced in the process of tolerance development of new products. The proposed strategy shortens the development cycle, reduces the manufacturing cost, and results in a competitive advantage in the market. This method is easy to implement and manage. It is demonstrated that the establishment of a concurrent tolerance design team and clearly defining the responsibilities of each department at each stage results in direct and efficient communications, thereby solving problems quickly.
The achievements obtained during the tolerance design process are encouraging. However, some other issues such as the management of the concurrent engineering team and the decision rules for competitive requirements among participants should be further studied.
All data generated or analyzed during this study are available upon request by contacting the corresponding author.
JZ proposed the framework of tolerance analysis and was the major contributor in writing the manuscript. YW performed the 3D tolerance simulation and measured the parts and automobiles. MZ contributed to the review and supervision. All authors read and approved the final manuscript.
The authors declare that they have no conflict of interest.
Publisher's note: Copernicus Publications remains neutral with regard to jurisdictional claims in published maps and institutional affiliations.
The authors thank the reviewers for their critical and constructive review of the manuscript.
This research has been supported by the National Natural Science Foundation of China (grant nos. 51775233 and 52075217).
This paper was edited by Jeong Hoon Ko and reviewed by two anonymous referees.
Alansary, M. D. and Deiab, I. M.: Concurrent optimization of design and machining tolerances using the genetic algorithms method, Int. J. Mach. Tool. Manu., 37, 1721–1731, https://doi.org/10.1016/S0890-6955(97)00033-3, 1997.
Al-Ashaab, A., Golob, M., Attia, U. M., Khan, M., Parsons, J., Andino, A., Perez, A., Guzman, P., Onecha, A., and Kesavamoorthy, S. J. C. E.: The transformation of product development process into lean environment using set-based concurrent engineering: A case study from an aerospace industry, Concurrent Eng., 21, 268–285, https://doi.org/10.1177/1063293X13495220, 2013.
Ameta, G., Lipman, R., Moylan, S., and Witherell, P.: Investigating the Role of Geometric Dimensioning and Tolerancing in Additive Manufacturing, J. Mech. Design, 137, 111401, https://doi.org/10.1115/1.4031296, 2015.
Anderson, D. M.: Design for manufacturability: how to use concurrent engineering to rapidly develop low-cost, high-quality products for lean production, CRC press, New York, https://doi.org/10.4324/9780429285981, 2020.
Anselmetti, B., Chavanne, R., Yang, J.-X., and Anwer, N.: Quick GPS: A new CAT system for single-part tolerancing, Computer Aided Design, 42, 768–780, https://doi.org/10.1016/j.cad.2010.04.006, 2010.
Barbero, B. R., Aragón, A. C., and Pedrosa, C. M.: Validation of a tolerance analysis simulation procedure in assemblies, Int. J. Adv. Manuf. Tech., 76, 1297–1310, https://doi.org/10.1007/s00170-014-6229-1, 2014.
Bruyère, J., Dantan, J.-Y., Bigot, R., and Martin, P.: Statistical tolerance analysis of bevel gear by tooth contact analysis and Monte Carlo simulation, Mech. Mach. Theory, 42, 1326–1351, https://doi.org/10.1016/j.mechmachtheory.2006.11.003, 2007.
Cao, Y., Liu, T., and Yang, J.: A comprehensive review of tolerance analysis models, Int. J. Adv. Manuf. Tech., 97, 3055–3085, https://doi.org/10.1007/s00170-018-1920-2, 2018.
Ceglarek, D., Huang, W., Zhou, S., Ding, Y., Kumar, R., and Zhou, Y.: Time-Based Competition in Multistage Manufacturing: Stream-of-Variation Analysis (SOVA) Methodology – Review, Int. J. Flex. Manuf. Sys., 16, 11–44, https://doi.org/10.1023/B:FLEX.0000039171.25141.a4, 2004.
Chase, K. W. and Parkinson, A. R.: A survey of research in the application of tolerance analysis to the design of mechanical assemblies, Res. Eng. Des., 3, 23–37, https://doi.org/10.1007/bf01580066, 1991.
Cvetko, R., Chase, K. W., and Magleby, S. P.: New metrics for evaluating Monte Carlo tolerance analysis of assemblies, Proceedings of the ASME international mechanical engineering conference and exposition, 15–20 November 1998, Anaheim, California, 1998.
Fischer, B. R.: Mechanical Tolerance Stackup and Analysis, 2nd Edn., CRC Press, Boca Raton, ISBN 978-1-4398-1572-4, 2011.
Fortini, E. T. and Fortini, E. T.: Dimensioning for Interchangeable Manufacture, Industrial Press, New York, 1967.
Haghighi, P., Mohan, P., Kalish, N., Vemulapalli, P., Shah, J. J., and Davidson, J. K.: Toward Automatic Tolerancing of Mechanical Assemblies: First-Order GD&T Schema Development and Tolerance Allocation, J. Comput. Inf. Sci. Eng., 15, 041003, https://doi.org/10.1115/1.4030939, 2015.
Jeang, A.: Combined parameter and tolerance design optimization with quality and cost, Int. J. Prod. Res., 39, 923–952, https://doi.org/10.1080/00207540010006717, 2004.
Khodaygan, S., Movahhedy, M. R., and Saadat Fomani, M.: Tolerance analysis of mechanical assemblies based on modal interval and small degrees of freedom (MI-SDOF) concepts, Int. J. Adv. Manuf. Tech., 50, 1041–1061, https://doi.org/10.1007/s00170-010-2568-8, 2010.
Kong, Z., Huang, W., and Oztekin, A.: Variation Propagation Analysis for Multistation Assembly Process With Consideration of GD&T Factors, J. Manuf. Sci. E.-T. ASME, 131, 051010, https://doi.org/10.1115/1.4000094, 2009.
Korbi, A., Tlija, M., Louhichi, B., and BenAmara, A.: CAD/tolerancing integration: a new approach for tolerance analysis of non-rigid parts assemblies, Int. J. Adv. Manuf. Tech., 98, 2003–2013, 2018.
Lu, C., Zhao, W.-H., and Yu, S.-J.: Concurrent tolerance design for manufacture and assembly with a game theoretic approach, Int. J. Adv. Manuf. Tech., 62, 303–316, https://doi.org/10.1007/s00170-011-3783-7, 2011.
Ngoi, B. K. A. and Teck, O. C.: A tolerancing optimisation method for product design, Int. J. Adv. Manuf. Tech., 13, 290–299, https://doi.org/10.1007/BF01179611, 1997.
Peng, H. and Peng, Z.: Concurrent design and process tolerances determination in consideration of geometrical tolerances, P. I. Mech. Eng. C.-J. Mec. 233, 6727–6740, https://doi.org/10.1177/0954406219866866, 2019.
Rihar, L., Žužek, T., and Kušar, J.: How to successfully introduce concurrent engineering into new product development?, Concurrent Eng., 29, 87–101, https://doi.org/10.1177/1063293x20967929, 2021.
Rong, Y., Hu, W., Kang, Y., Zhang, Y., and Yen, D. W.: Locating error analysis and tolerance assignment for computer-aided fixture design, Int. J. Prod. Res., 39, 3529–3545, https://doi.org/10.1080/00207540110056243, 2010.
Sarigecili, M. I., Roy, U., and Rachuri, S.: Interpreting the semantics of GD&T specifications of a product for tolerance analysis, Computer Aided Design, 47, 72–84, https://doi.org/10.1016/j.cad.2013.09.002, 2014.
Shah, J. J., Yan, Y., and Zhang, B. C.: Dimension and tolerance modeling and transformations in feature based design and manufacturing, J. Intell. Manuf., 9, 475–488, 1998.
Voelcker, H.: A current perspective on tolerancing and metrology, Proceedings of 1993 International Forum on Dimensional Tolerancing and Metrology, New York, 27, 49–60, 1993.
Voelcker, H. B.: The current state of affairs in dimensional tolerancing: 1997, Integrated Manufacturing Systems, 9, 205–217, 1998.
Walter, M. S. J., Klein, C., Heling, B., and Wartzack, S.: Statistical Tolerance Analysis – A Survey on Awareness, Use and Need in German Industry, Appl. Sci., 11, 2622, 2021.
Zeng, W., Rao, Y., Wang, P., and Yi, W.: A solution of worst-case tolerance analysis for partial parallel chains based on the Unified Jacobian-Torsor model, Precis. Eng., 47, 276–291, https://doi.org/10.1016/j.precisioneng.2016.09.002, 2017.
Zhang, Y., Li, Z., Gao, J., and Hong, J.: New reasoning algorithm for assembly tolerance specifications and corresponding tolerance zone types, Computer Aided Design, 43, 1606–1628, https://doi.org/10.1016/j.cad.2011.06.008, 2011.
Zhu, Z. and Qiao, L.: Analysis and Control of Assembly Precision in Different Assembly Sequences, Proc. CIRP, 27, 117–123, https://doi.org/10.1016/j.procir.2015.04.053, 2015.