the Creative Commons Attribution 4.0 License.
the Creative Commons Attribution 4.0 License.
 | 24 Jun 2021
Dynamic characteristics of the gear-rotor system in compressed air energy storage considering friction effects
Xinran Wang
Wen Li
Dongxu Hu
Xingjian Dai
Haisheng Chen
The tooth surface friction effects and the resulting tooth surface contact temperature are important factors for the dynamic characteristics of a gear-rotor system in compressed air energy storage (CAES). Therefore, a 3∘ of freedom finite-element model of the system is set up in which the lubrication state of the gear pair, tooth surface friction, contact temperature of the tooth surface, backlash and unbalanced excitation are considered. The friction coefficient is calculated according to the variation of the lubrication state, and the tooth surface contact temperature is derived based on the friction coefficient. The tooth profile deformation caused by the change in the contact temperature is calculated, and the resulting effects on backlash and comprehensive meshing stiffness are considered. The influence of rotating speed, torque load and viscosity of lubricating oil on the system response is studied, and the variation of the friction coefficient, flash temperature of the tooth surface, pressure of the tooth surface and so on are discussed in detail. The results indicate that when the friction coefficient is derived according to the variation of the lubrication state, the variation of the contact temperature of the tooth surface with rotating speed is quite different from that calculated based on a friction coefficient which is set artificially. This leads to a new variation of the dynamic response of the gear-rotor system, and the method of stabilizing the operation of the system is put forward based on the optimization curve for the operation of the system. The results obtained in this paper will provide a reference for the study and design of a gear-rotor system in CAES.
- Article
(3522 KB) - Full-text XML
- BibTeX
- EndNote


Electric energy storage technology can improve the operation efficiency, security, and economy of a conventional power system and the utilization efficiency of renewable energy. The compressed air energy storage (CAES) technology can achieve large-scale, long-term energy storage, which is one of the most promising large-scale physical energy storage technologies (Zhang et al., 2012). CAES has a wide range of potential applications for the generation, transmission and utilization of electricity. The CAES works in that air is first compressed by a compressor, which is driven by excess electrical power in the grid. Then the excess electrical power in the grid is stored as the internal energy of high-pressure air. The high-pressure air is subsequently released through a expander to generate electrical power when needed (Chen et al., 2009, 2016). Because a multi-stage turbine has the advantages of high efficiency and a compact structure, the expander and compressor in CAES usually adopt a multi-stage expander and compressor. The gear-rotor system is the key equipment of the multi-stage expander. Due to the energy storage and release processes, the CAES exhibits frequently the characteristics of off-design operation, putting forward higher requirements for the safety and reliability of the gear-rotor system. An attempt to design and develop a gear-rotor system in CAES requires a good understanding of the dynamic characteristics of the system.
The friction effect is inevitable for the gear-rotor system in the actual working status of high rotating speed and high load. The energy consumed by friction will converse to heat, and it will lead the tooth contact temperature to increase, further leading to the change in the shape and stiffness of the gear tooth. It can be found from the above analysis that the friction and tooth contact temperature are critical factors for the gear-rotor system, and there is a certain correlation between them, but they are often studied separately in the existing literature. For the research of tooth surface friction, Kar et al. (2007, 2008) calculated the length of the contact line, friction force and friction torque of the helical gear. Chen et al. (2011) investigated the effects of the friction and dynamic backlash on the multi-degree of freedom nonlinear dynamic gear transmission system, which incorporates time-varying stiffness. Inaguma (2015) presented the friction torque in an internal gear pump, and the friction force between an outer circumference of an outer rotor and a body, which causes a significant loss, has been investigated. Zhou et al. (2018) proposed a novel prediction method where gear friction coefficients with or without lubrication are developed with a computational inverse technique. The friction coefficients of different gear-rotor systems under different operating conditions were calculated in the above studies, and the effects of friction on the dynamic characteristics of the systems were discussed, but the increasing contact temperature caused by friction was ignored in the above studies.
The tooth surface contact temperature of the gear-rotor system is discussed in the following studies. Shi et al. (2016) investigated the sliding velocity variation for the gear-meshing surface based on theories of gear tribology, heat transfer and Hertz contact and derived a model of contact stress considering friction force. Li et al. (2016) investigated the flash temperature rise of spur gear contacts under the tribodynamic condition. Mao (2007) described a detailed analysis of the flash temperature for polymer composite gears and the heat partition between gear teeth instead of Blok's solution. Gou et al. (2017) investigated the effect of the flash temperature of a tooth surface on the dynamics of a spur gear system and established a modified nonlinear dynamic model of a gear-rotor-bearing system. The above research discussed the effects of the contact temperature on the dynamic characteristics of the gear-rotor systems. However, the friction coefficient, which is an important parameter for the calculation of the contact temperature, is set artificially instead of calculated in the above studies, but the friction coefficient is significantly different in different gear-rotor systems under different operating conditions. Therefore, the artificial setting of the friction coefficient will lead to an inaccurate calculation of the contact temperature, which will adversely affect the analysis of the dynamic characteristics of the system.
Through the above analysis, it can be seen that the previous research of gear-rotor systems has some limitations. In the studies involving the friction effect, only the effect of friction is considered, and the resulting increase in the contact temperature is ignored. In the studies involving contact temperature, the friction coefficient is set artificially instead of calculated, leading to the inaccurate calculation of the contact temperature. In addition, the thermal deformation of the gear tooth caused by contact temperature will affect the backlash and the stiffness of the gear; some previous studies did not take them all into consideration.
The purpose of this paper is to propose a dynamic model for the gear-rotor system in CAES with the lubrication state of the gear pair, tooth surface friction, tooth surface contact temperature, backlash and unbalanced excitation considered. The friction coefficient is calculated according to the variation of lubrication state, and the tooth surface contact temperature is derived based on the friction coefficient. The tooth profile deformation caused by the change in the contact temperature is calculated, and the resulting effects on backlash and comprehensive meshing stiffness are considered. The influence of rotating speed, torque load and viscosity of lubricating oil on the system response is studied, and the variation of the friction coefficient, flash temperature of the tooth surface, pressure of the tooth surface and so on are discussed in detail. The method of stabilizing the operation of the system is put forward based on the optimization curve for the operation of the system.
2.1 Integral model of the gear-rotor system
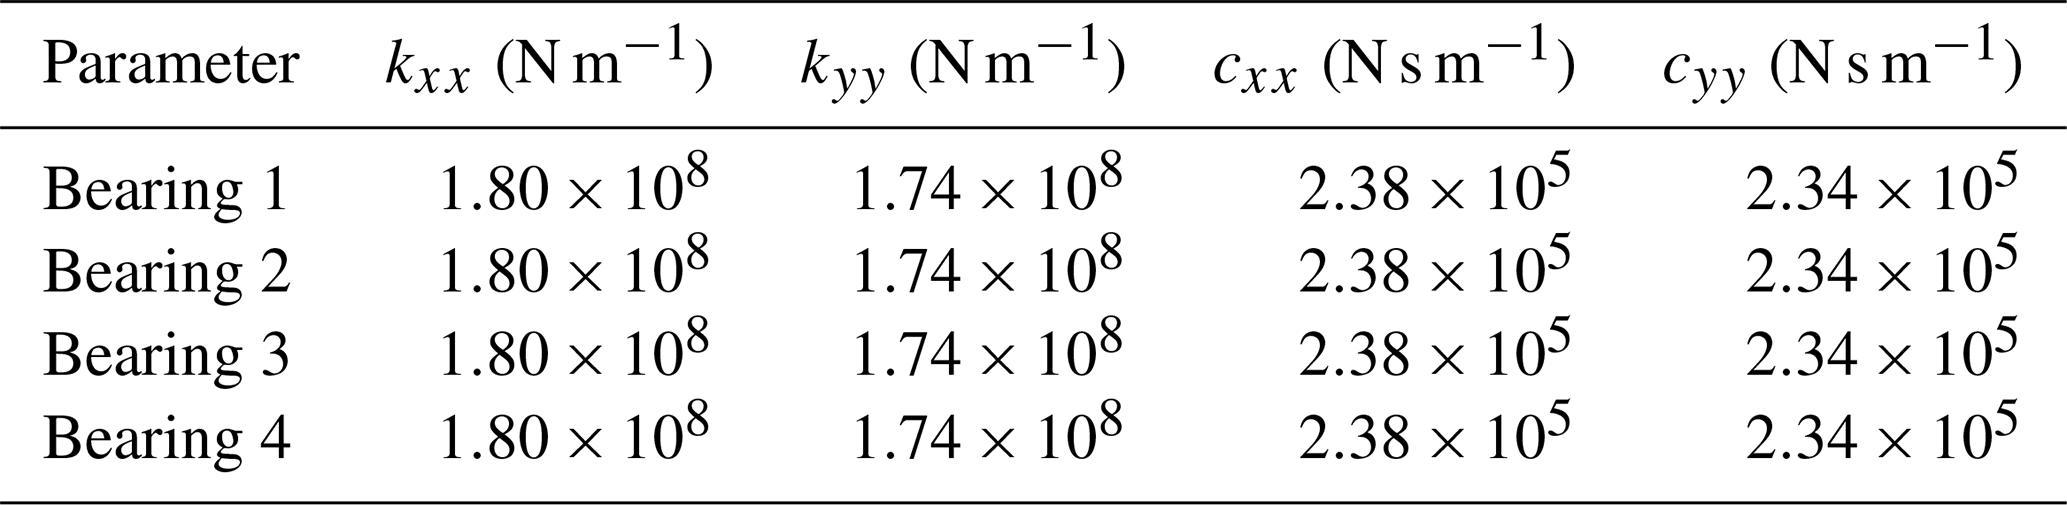
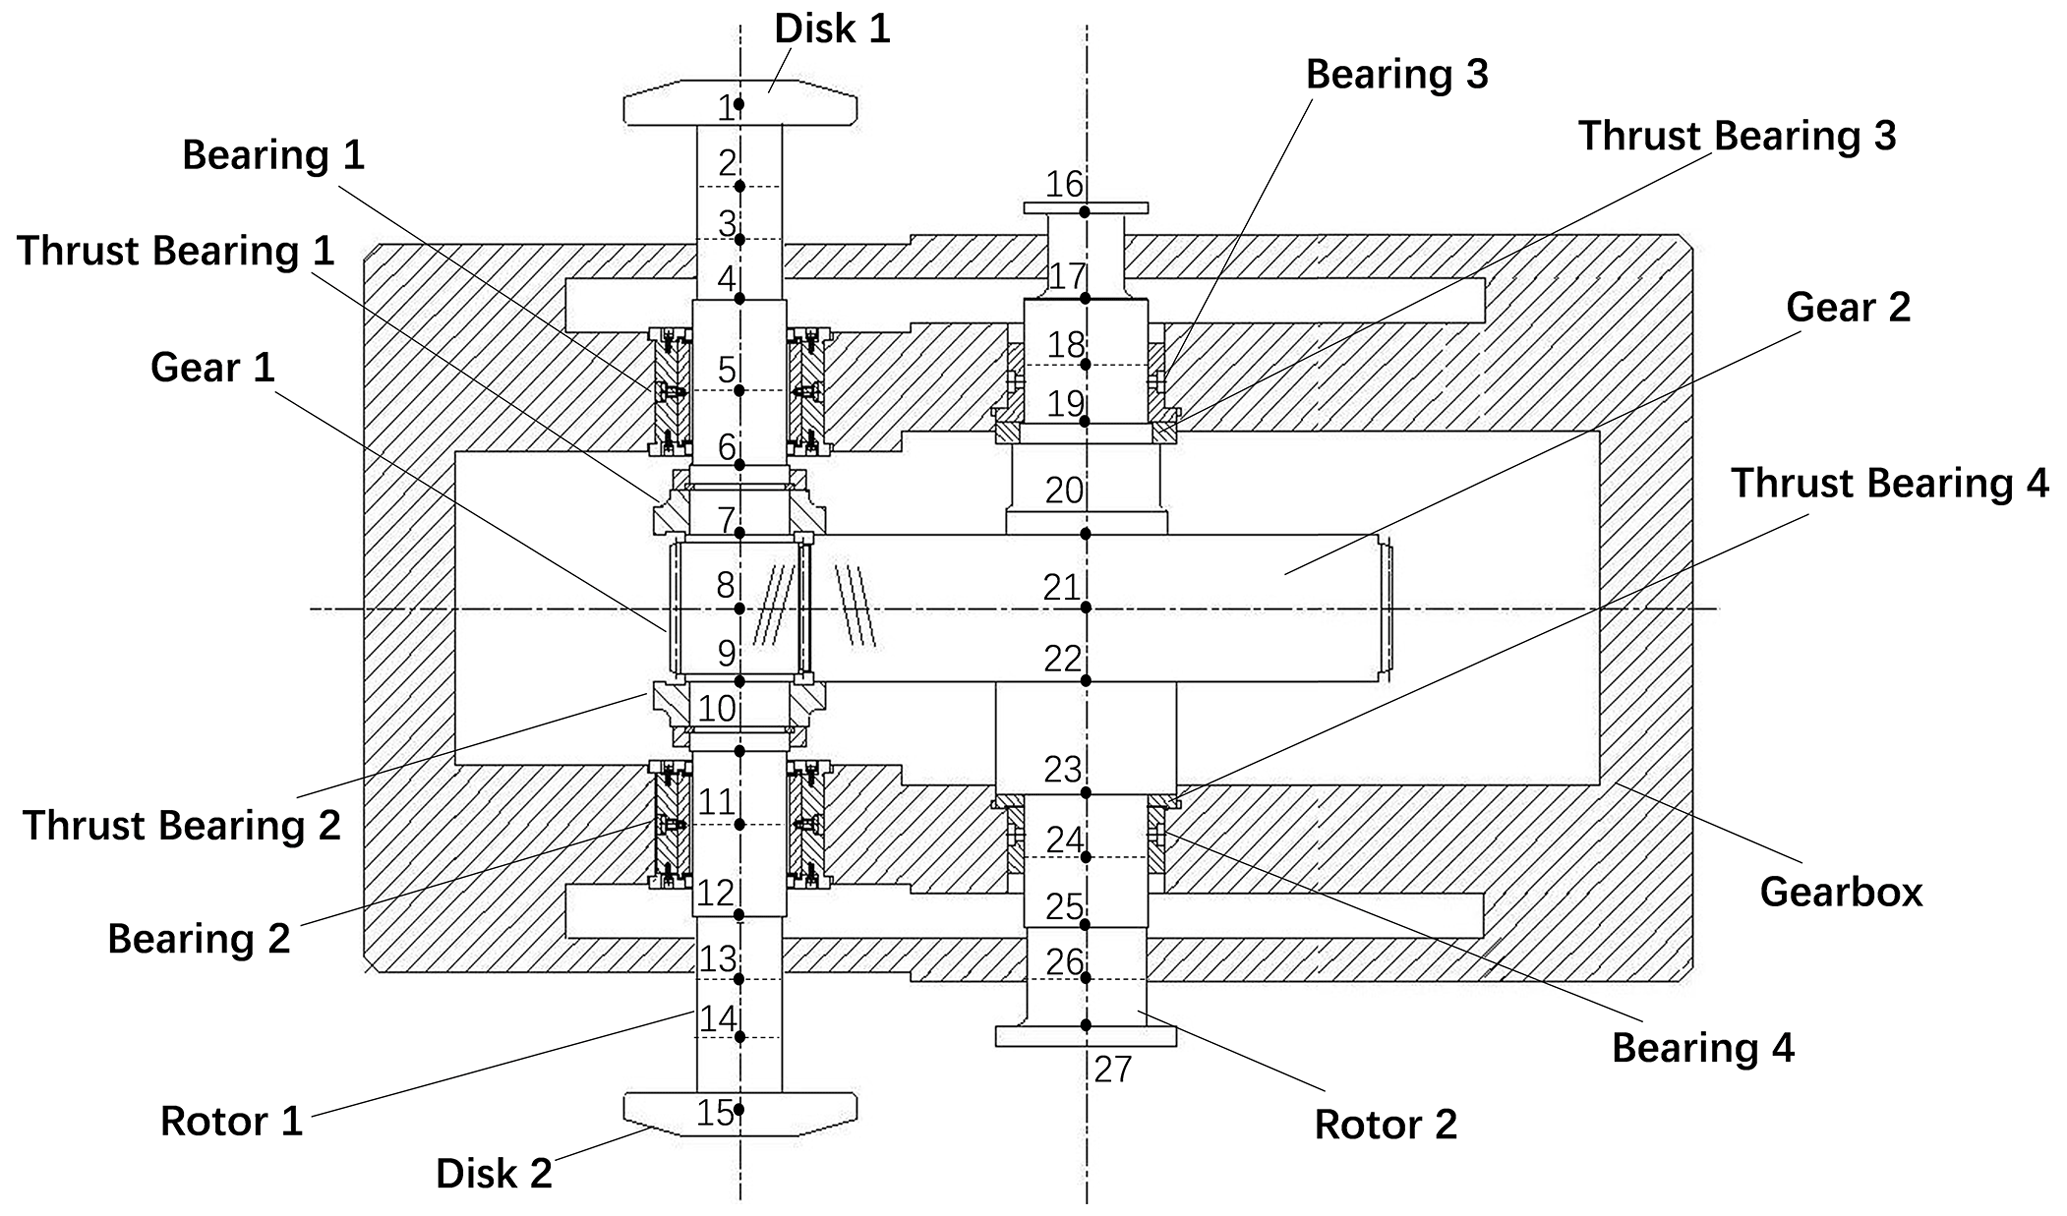
A finite-element model of a gear-rotor system is formulated according to the typical structure of a multi-stage expressor in CAES, which is shown in Fig. 1. The model consists of 27 nodes, where xn, yn, and θ represent the degrees of freedom of each node, and where xn and yn are the translations and θ is the torsional angle. The model consists of two gear rotors: the driven rotor (rotor 1) and the driving rotor (rotor 2). The rotating speed ratio of rotors 1 and 2 is 4.5:1. The axial force in the system is ignored since it is offset by the thrust bearings. Both ends of rotor 1 are equipped with disks, which represent the mass and moment of inertia of the turbine. The meshing force, friction effects, contact temperature effects, and input torque are applied to the nodes at the gear locations. There are four sliding bearings in the system, which are modeled as support stiffness and damping located at the nodes where the bearings are. The support stiffness or damping are not the focus of this paper; therefore, we simply adopted their specifications from the Journal Bearing Databook (1989) and show them in Table 1.
Table 1Support stiffness and damping of the gear-rotor system.
The mathematical model of the gear-rotor system is obtained as follows:
where is the resultant external force vector, including the meshing force, friction effects, contact temperature effects, input torque, and mass imbalance. M is the mass matrix, K is the stiffness matrix, C is the damping matrix, and G is the gyroscopic matrix. The methods for deriving the global mass, stiffness, damping, gyroscopic matrices, and displacement vector are well known and are, therefore, omitted. The following part focuses on the derivation of the resultant external force, and the software of MATLAB is used to solve the mathematic model by the Newmark step-by-step integration method.
2.2 Model of nonlinear factors of the gear-rotor system
The degrees of freedom of the gear pair are xi, yi, and θi, i=p, g, where xi and yi are the vibration translations, θi is the torsional angle, and p and g represent the gears of rotors 1 and 2, respectively. Set Δ(t) as the relative displacement of the gear pair, which can be expressed as follows:
where ri, is the radius of the base circle of the gear, and α is the meshing angle.
Denote the constant backlash of each gear pair along the meshing direction as 2bn when the vibration displacement of the gear pair is 0; then, the backlash displacement function can be defined as follows.
Then the meshing force can be defined as
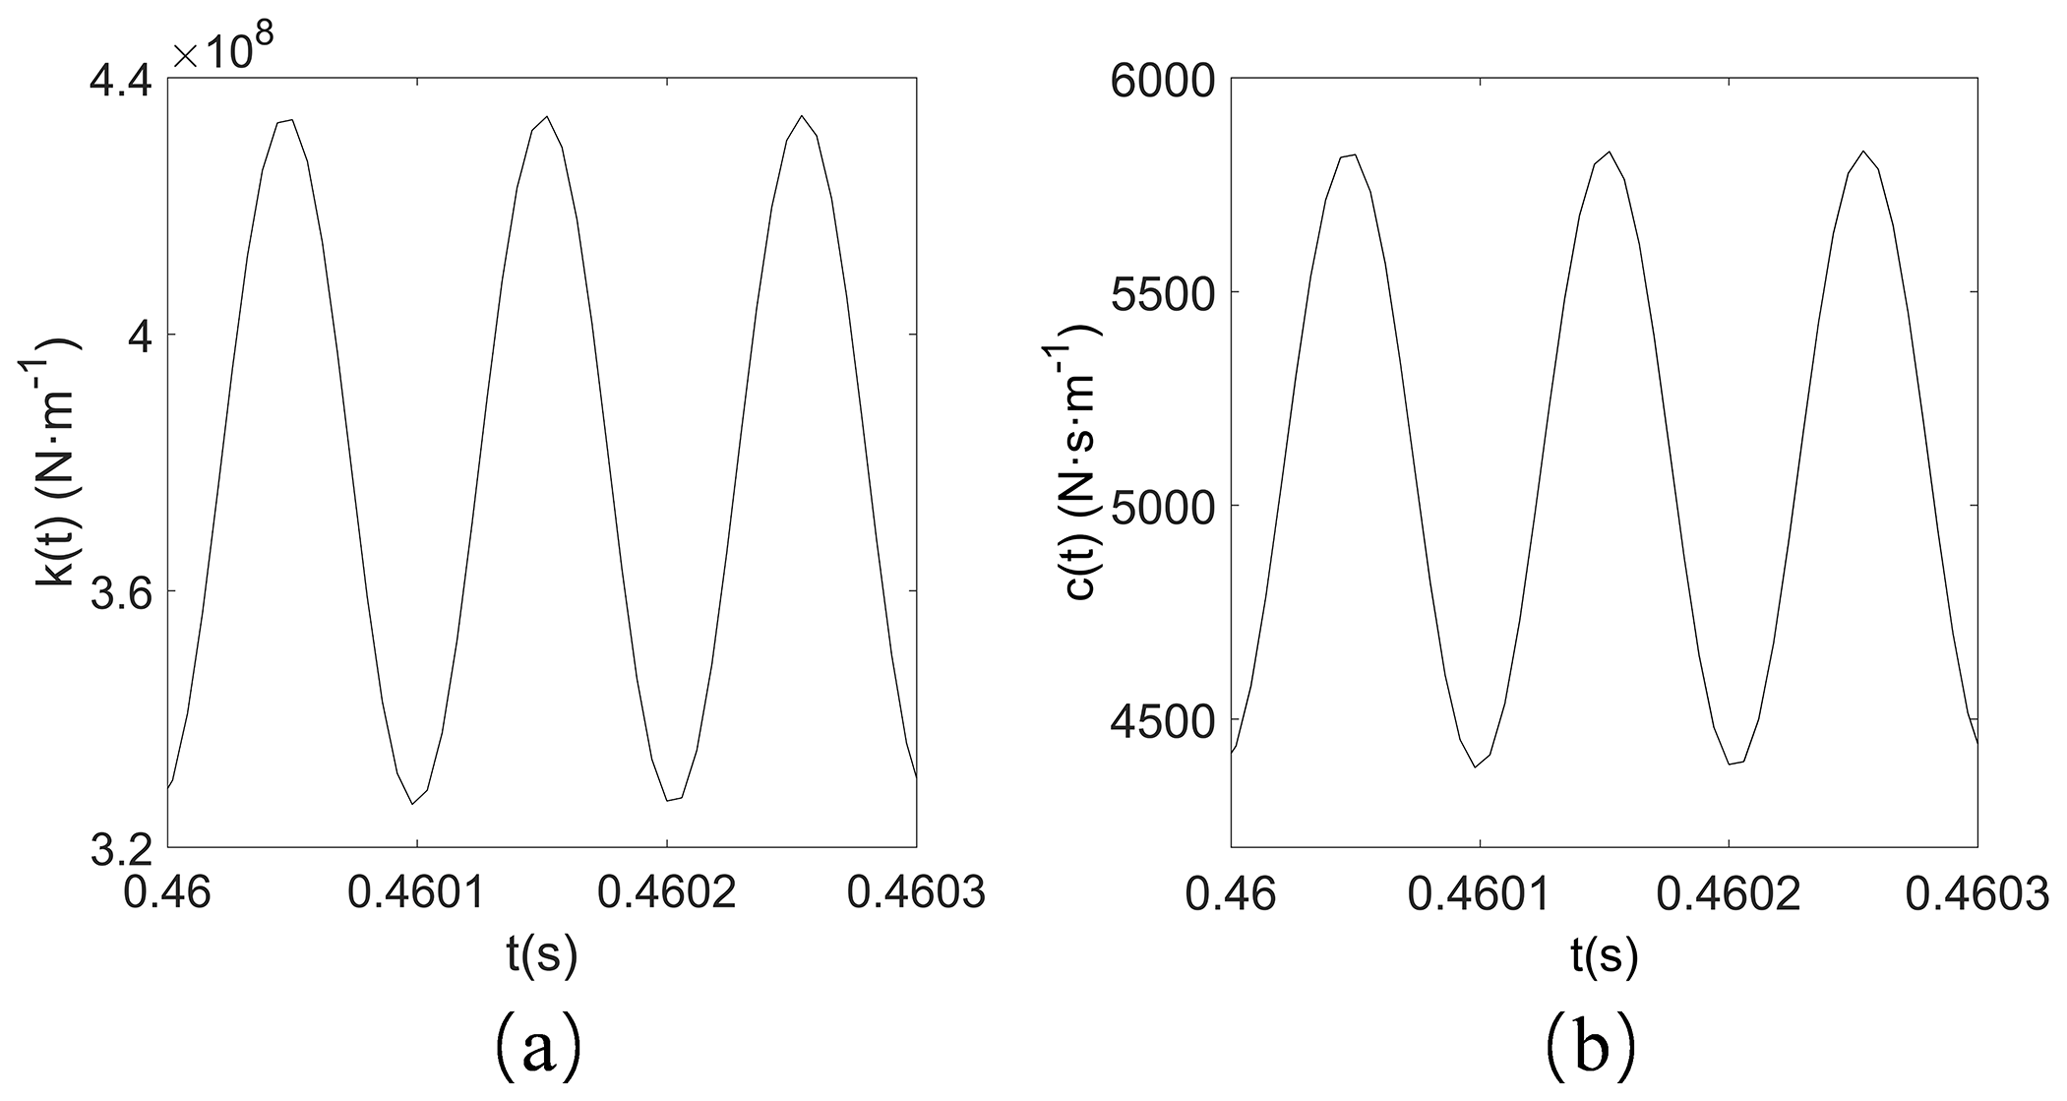
where k(t) is the comprehensive meshing stiffness of the gear tooth, and c(t) is the meshing damping of the gear tooth.
The International Organization for Standardization (ISO, 1996) proposed a method to calculate the meshing stiffness and damping, which allows expression of the meshing stiffness of a single pair of gear teeth as follows:
where x1 and x2 are the modification coefficients, z1=n1cos 3β and z2=n2cos 3β are the virtual number of teeth, and β is the helical angle.
For helical gears with the helix angle of no more than 30∘, the average meshing stiffness is given as
where ε is the transverse contact ratio, and B is the breadth of the tooth.
Considering the periodic fluctuation of meshing stiffness, Kahraman et al. (1991) proposed to expand the time-varying meshing stiffness of the gear pair into a Fourier series. Keeping only the first harmonic, it can be expressed as follows:
where k1 and k2 are the harmonic amplitudes of the meshing stiffness.
Then the comprehensive meshing stiffness can be expressed as follows:
where kT is the thermal stiffness, which is derived in the following.
Meshing damping of the gear teeth can be calculated by the method of the damping ratio, which is expressed as follows:
where ξ is the damping ratio, and Ii, is the moment of inertia of the gears.
The calculation results of meshing stiffness and damping are shown in Fig. 2.
The power load of CAES acts on the gear-rotor system in the form of torque load, which can be expressed as
where Mim and Mim, i=p, g are the average torque load, which is also called static torque load, Mir and Mir, i=p, g represent the fluctuations, and p and g represent parameters of rotor 1 and rotor 2.
Unbalanced excitation should be applied to every node of the model because unbalanced excitation is in every part of the system. The expression for the unbalanced excitation is as follows:
where Fn (n=1, 2, 3, …, 27) is the unbalanced excitation of each node of the system, mn (n=1, 2 , 3, …, 27) is the mass of the cell represented by each node, rn (n=1, 2, 3, …, 27) is the eccentric radius of each node, and ωi () is the rotating speed.
Friction coefficient is the key coefficient of friction force and contact temperature. In order to calculate the friction coefficient, it is necessary to judge the lubrication state of the gear pair. The lubrication state is usually judged by the film thickness ratio, which can be expressed as follows:
where Rq1, Rq2 is the root mean square deviation of the surface topography profile, and hmin is the minimum thickness of the oil film when the gear pair is in the elastohydrodynamic lubrication, which can be expressed as follows:
where η0 is the dynamic viscosity of lubrication oil, ur(t) is the entrainment speed, α is the pressure viscosity coefficient of lubrication oil, Rc is the comprehensive equivalent radius, l is the tooth width, Ec is the comprehensive elastic modulus, and P is the pressure of the tooth surface, which is derived in the following.
If the film thickness ratio contains λ<1, the lubrication state is boundary lubrication; if the film thickness ratio contains , the lubrication state is a mix of boundary lubrication and elastohydrodynamic lubrication; if the film thickness ratio contains 3<λ, the lubrication state is elastohydrodynamic lubrication. Then the load factor sc can be expressed as follows.
The friction coefficient can be calculated by load factor as follows:
where μc is the friction coefficient of boundary lubrication, which refers to the study reported by Wang et al. (2008). μl is the friction coefficient of elastohydrodynamic lubrication, which refers to the study reported by Xu et al. (2007).
Friction force is considered to be positive when the contact line segment is above the pitch line and negative otherwise. The direction of the friction force is perpendicular to the line of action in the transverse plane parallel to the cross section of the gears and pinion and perpendicular to the contact lines in the sectional plane showing the contact zone. The friction force is calculated by the sectional contact line, which can be expressed as follows:
where lci(t) is the time-varying sectional contact line, lc(t) is the time-varying total sectional line, and P is the pressure of the tooth surface, which is derived in the following. The calculation of the time-varying sectional contact line and the time-varying total sectional line refers to the study reported by Kar and Mohanty (2007).
The tooth contact temperature ΔT consists of bulk temperature ΔmT and tooth instantaneous flash temperature ΔfT:
Herein, the bulk temperatures of two meshing gears are equal since they will not change in steady working state. The tooth instantaneous flash temperature is due to the heat of conversing with the energy which was consumed by the friction between the two meshing gear teeth when they are sliding relative. Therefore, the variation of contact temperature is actually the variation of the flash temperature. The tooth instantaneous flash temperature, ΔfT, can be achieved according to Blok's flash temperature theory (Blok, 1963).
where u is the coefficient of temperature rising, and v1 and v2 are the tangential velocities of the two teeth surfaces, respectively. g1 and g2 are the thermal conductivity of the two teeth surfaces, respectively. ρ1 and ρ2 are the densities of the two teeth surfaces, respectively. c1 and c2 are the specific heat capacities of the two teeth, respectively. B is the semi-width of the Hertzian contact band. P is the pressure of the tooth surface, which is derived in the following. Then the profile deformation caused by contact temperature can be expressed as
where ubi is the thermal deformation quantity in the base circles of two gears in steady working state, which can be expressed as follows:
where λ is the linear expansion of the material, rbi, () is the base radius of the pinion and gear, α is the meshing angle, αki, () is the addendum pressure angle of the gear, r0i, () is the radius of the shafts of the two gears, and Tbi, () is the temperature of the shafts of the two gears in steady working state. T0i, () is the temperature in the base circles of the two gears in steady working state.
The profile deformation will affect the stiffness and the backlash of the gear, resulting in the thermal stress and thermal stiffness of the gear pair, which can be expressed as follows:
Then the pressure of the tooth surface can be expressed as follows:
Table 2 shows some key parameters of the helical gear pair model. The specific data refer to the parameters of the gear-rotor system in the multi-stage expander of the CAES with a power level of 10 000 kW.

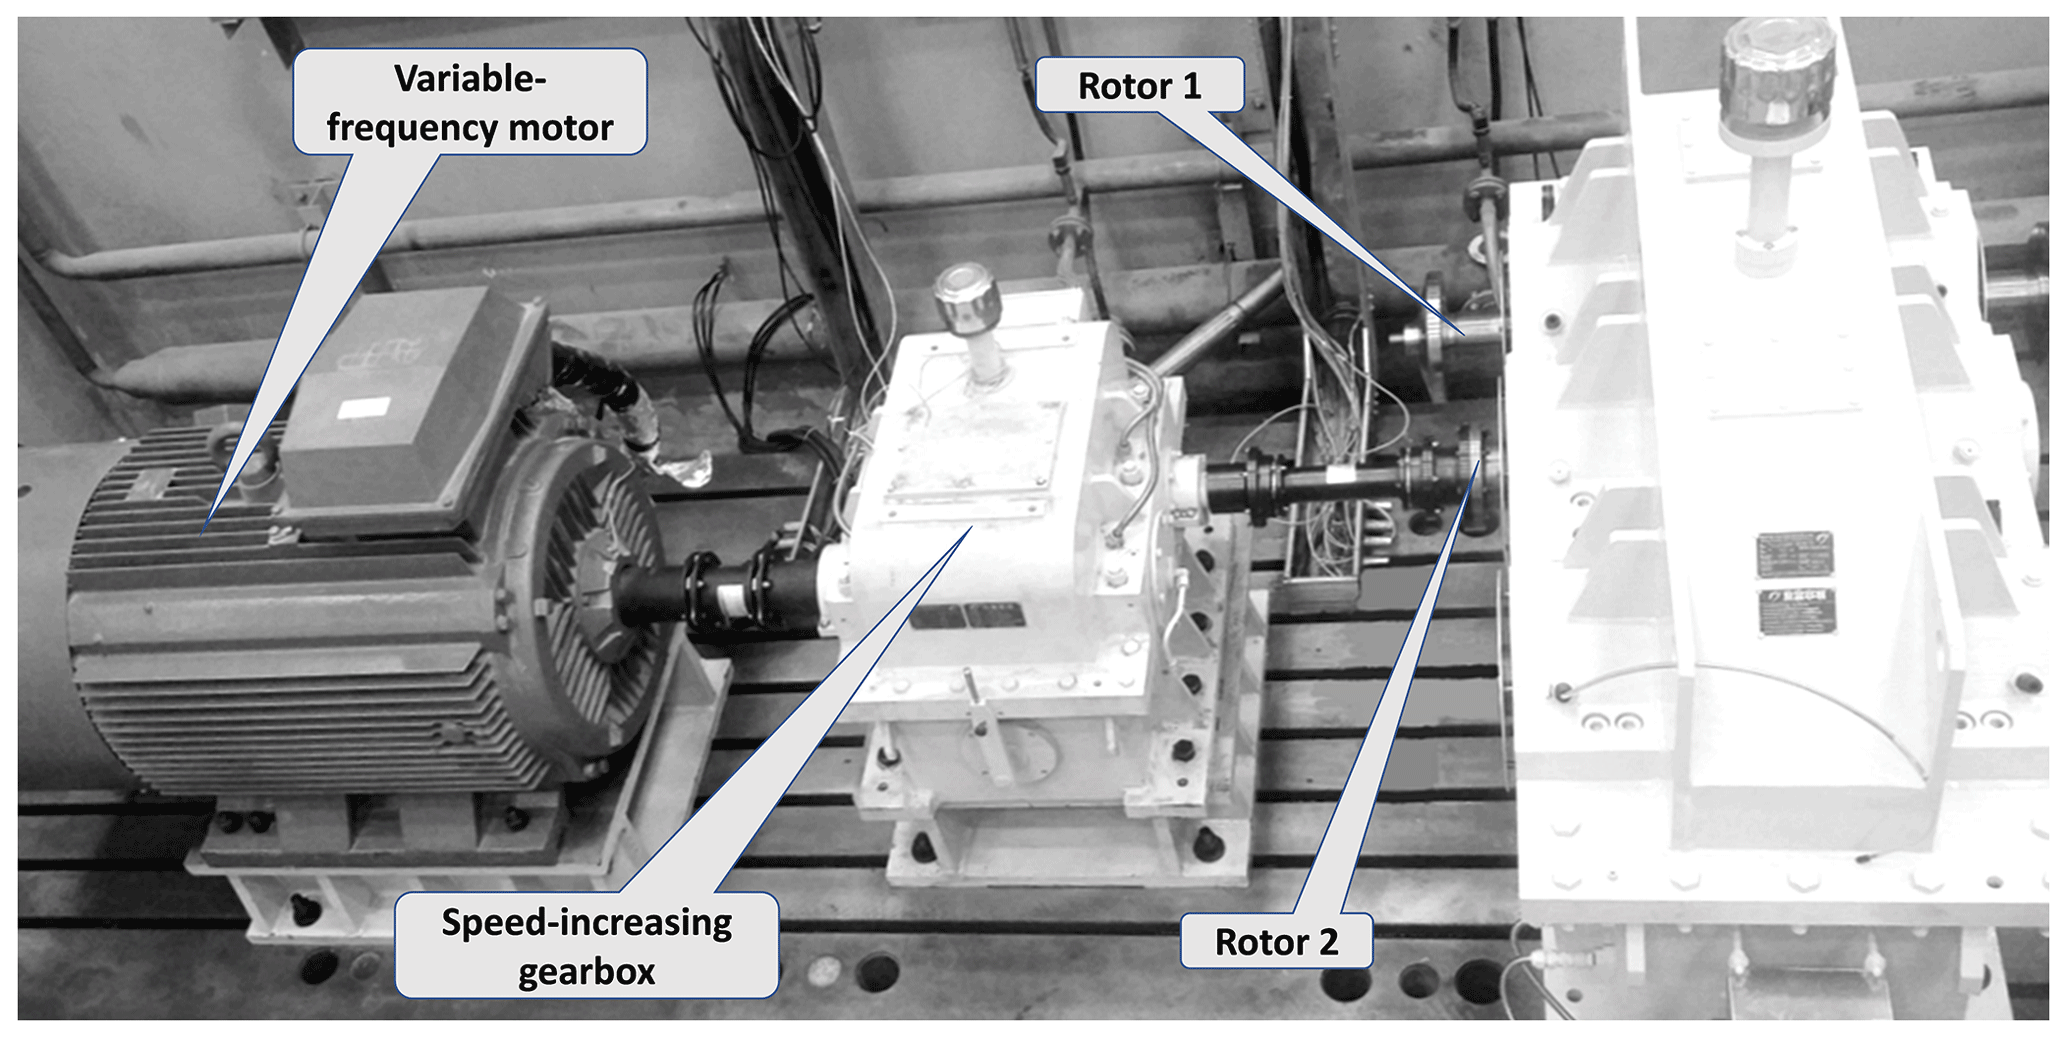
3.1 Structure of the gear-rotor test bench
A gear-rotor test bench was built according to the structure and size of the gear-rotor system in CAES, which is shown in Fig. 3. A variable-frequency motor with a rated power of 315 kW and a rated speed of 3500 rpm is used to drive the speed-increasing gear box, and its growth ratio is 2.7. The speed-increasing gear box has no critical speed in the rated speed range of the variable-frequency motor. The speed-increasing gear box is used to drive rotor 2, and rotor 2 is used to drive rotor 1. A constant torque is transmitted through the elastomer couplings among the variable-frequency motor, speed-increasing gear box and test system. It is of primary interest here to note that the test gear systems shown in Fig. 3 are well isolated from the speed-increasing gear box through elastomer couplings, such that the influence of the speed-increasing gear pair on the dynamic behavior of the test gear system is negligible. In addition, the bearing pedestals and the bed plate of the test machine are rigid. The lateral vibration displacement of the rotors is measured by displacement sensors, which are set close to the journals.
3.2 Verification of the mathematical model
Rotor 1 has disks on both its ends, and its rotating speed is much higher than that of rotor 2; therefore, the experimental results and the simulated results of rotor 1 are selected to verify the accuracy of the mathematical model. Sped-up experiment of the gear-rotor system was carried out on the gear-rotor test bench. Each time the rotating speed of rotor 1 was increased by 500 rpm, and the rotating speed of rotor 1 was increased from the lowest speed to the rated speed (20 000 rpm). Figure 4a shows the Bode diagram of the gear-rotor system obtained experimentally. The first-order critical speed of the system can be clearly reflected from the Bode diagram (Wang et al., 2011). It can be seen from Fig. 4a that the first-order critical speed of the system obtained experimentally is about 15 000 rpm. Figure 4b shows that the peak of the vibration displacement of the system obtained numerically is about 15 500 rpm, and the experimental result is about 15 000 rpm, which is almost consistent with the first-order critical speed. The difference of the peak of the vibration displacement between the numerical and experimental results is about 3.3 %; therefore, the mathematical model is relatively satisfactory.
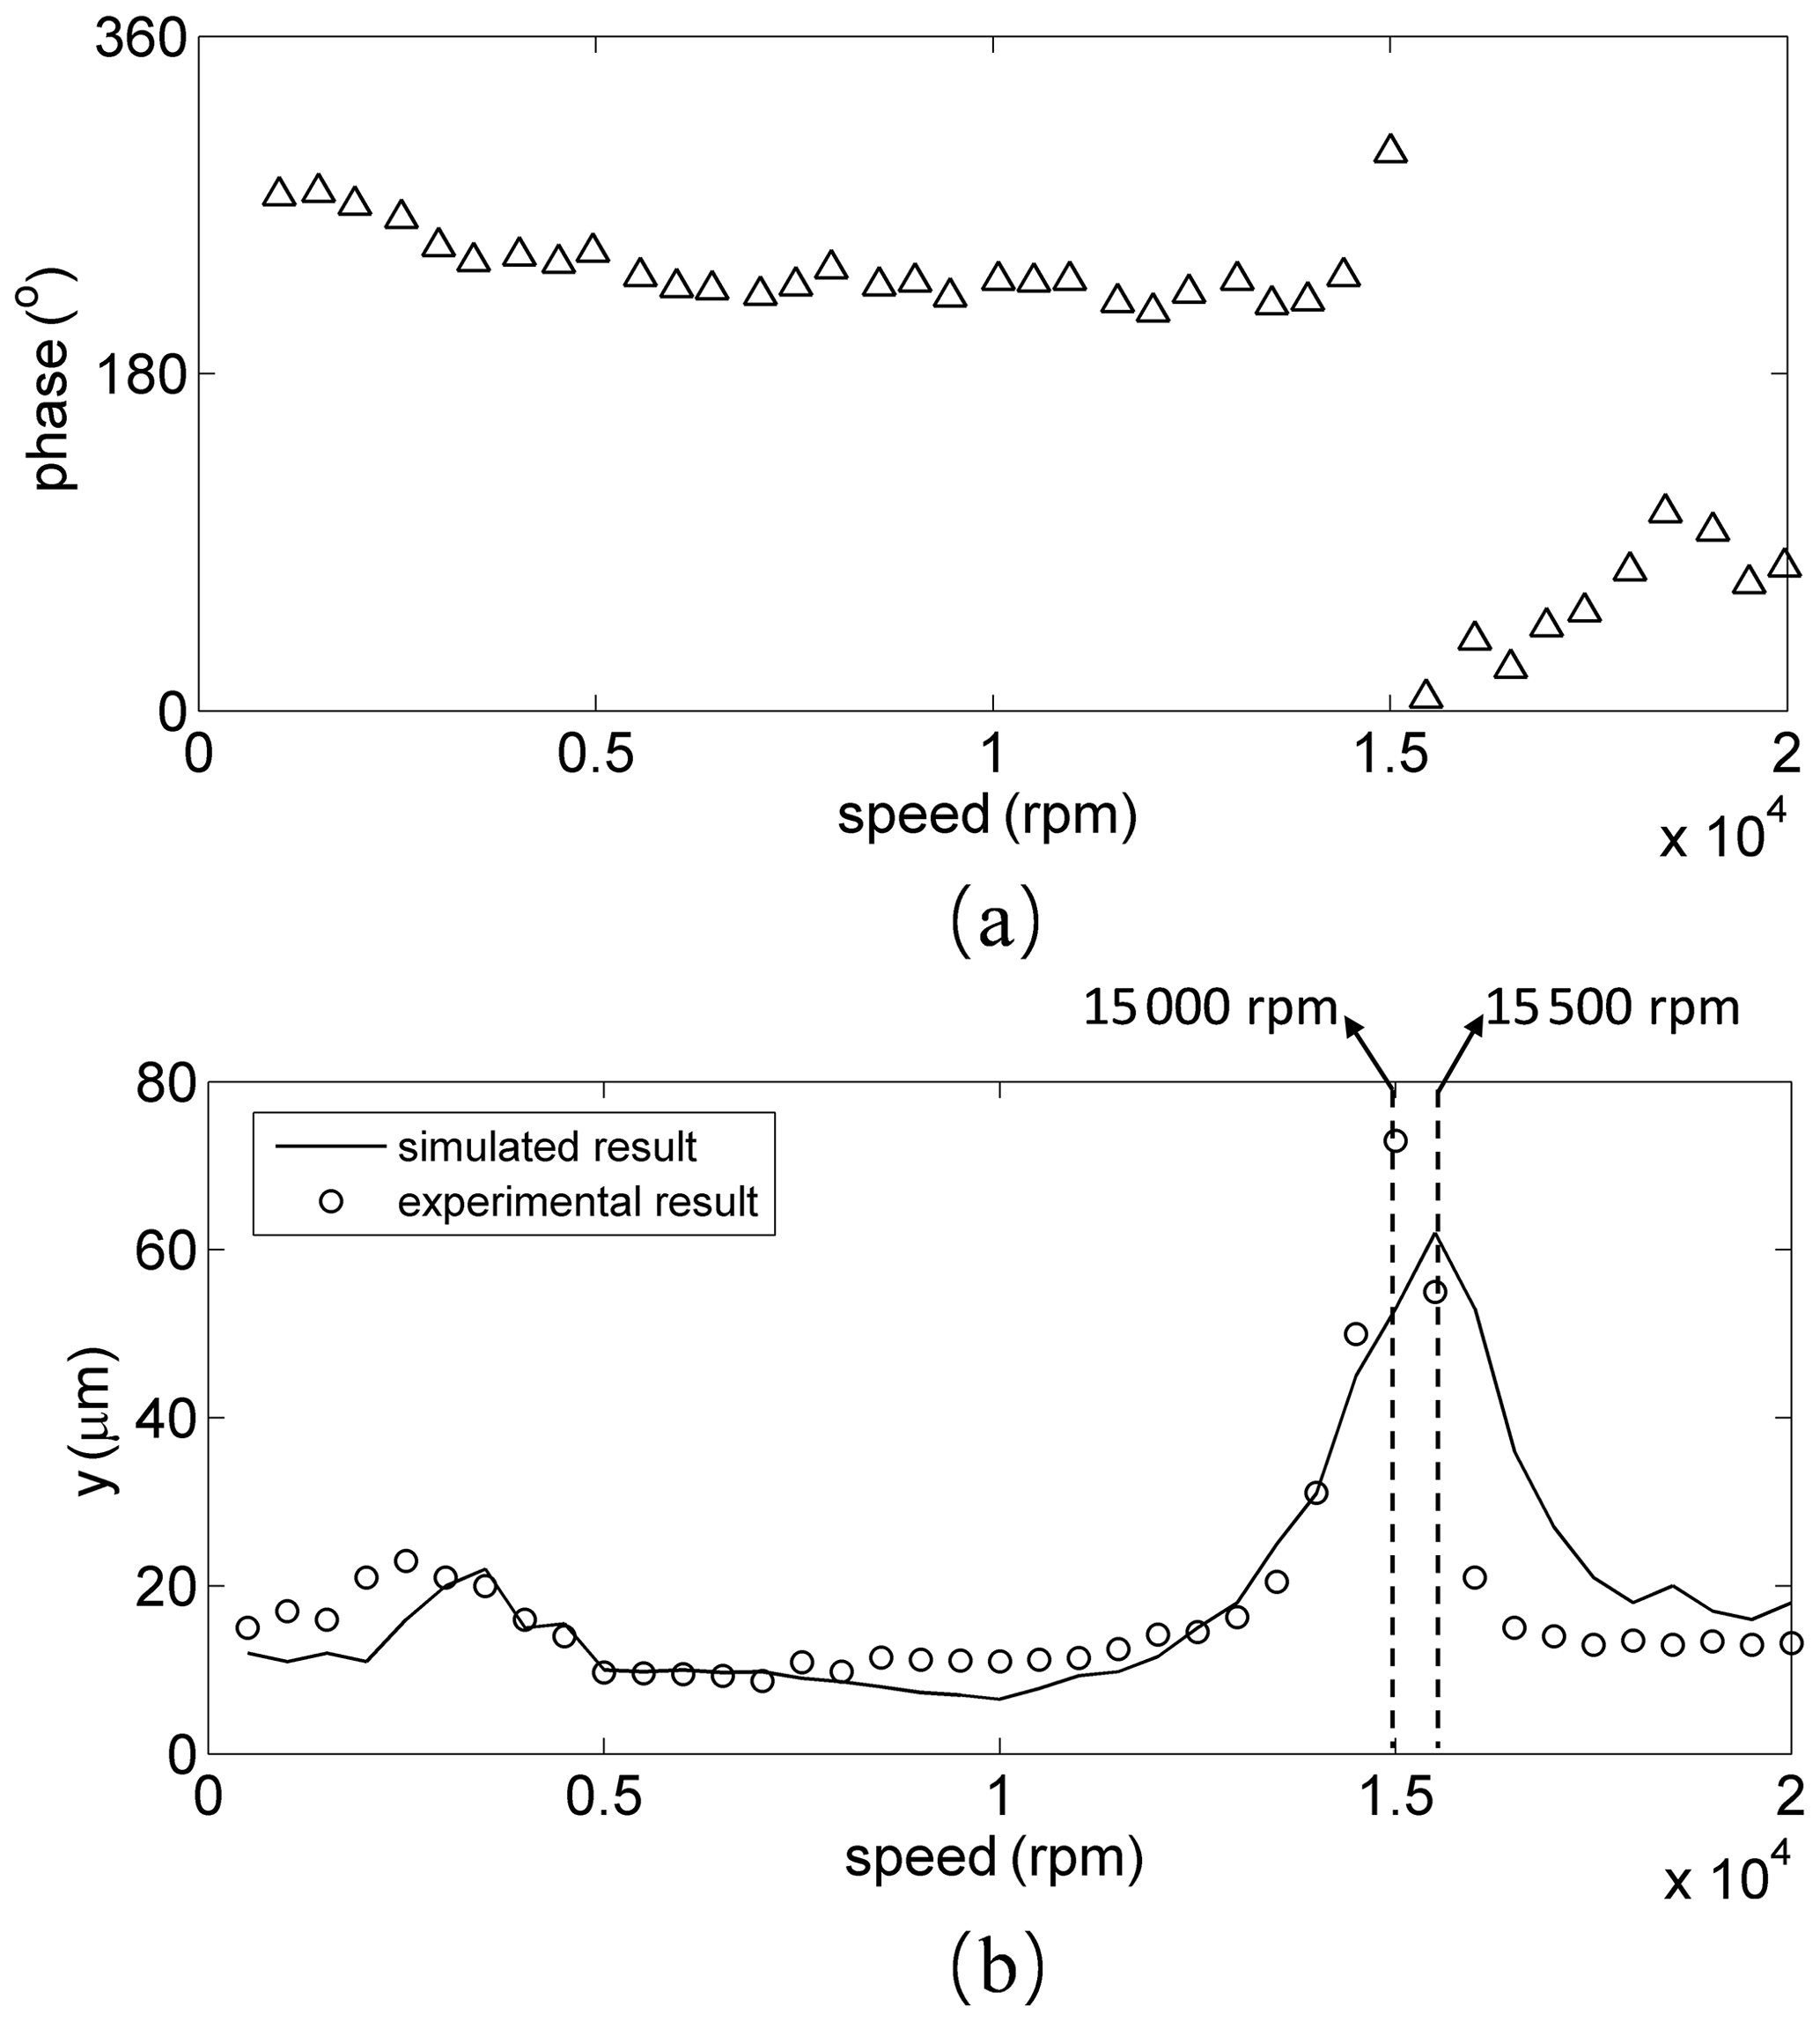
Figure 4Experimental results: (a) Bode diagram of the gear-rotor system obtained experimentally. (b) Comparison of experimental and numerical results.
Figure 5 shows the relationship between the influencing factors of the gear-rotor system, which is derived by the relationship of the parameters in Eqs. (12)–(23). In Fig. 5, the arrow represents the direction of the influence, the plus sign represents the positive correlation, and the minus sign represents the negative correlation. It can be seen from Fig. 5 that there is a negative correlation between friction coefficient and oil film thickness and a positive correlation between tooth surface pressure and meshing force. The flash temperature of the tooth surface is positively correlated with the friction coefficient and the tooth surface pressure. The thermal stress is positively correlated with the flash temperature of the tooth surface, and the tooth surface pressure is positively correlated with the thermal stress at the same time. The result indicates that the flash temperature, thermal stress and pressure on the tooth surface have a positive feedback on each other. Therefore, it is speculated that the flash temperature, thermal stress and pressure of the tooth surface have a similar variation.

Figure 6Bifurcation at the torque load of 5000 Nm and the lubricating oil viscosity of 30 cPs.
4.1 Response at the torque load of 5000 Nm and the lubricating oil viscosity of 30 cPs
The system response is analyzed when the torque load is 5000 Nm and the lubricating oil viscosity is 30 cPs. At this time, the torque load of the system is close to the torque load when the system is operating at the rated power. Figure 6 is a bifurcation diagram of the system response. The abscissa of the bifurcation diagram is the bifurcation parameter, and the ordinate of the bifurcation diagram is the projection of the system response corresponding to the research parameters on the Poincare section. If the bifurcation diagram shows a curve varying with the bifurcation parameter, the system moves approximately periodically. If the bifurcation diagram shows discrete points, then the system moves in chaos. From Fig. 6, it can be seen that the system response is dominated by chaos in the speed range of about – of the first-order critical speed, and the response is quasi-periodic in other speed ranges.
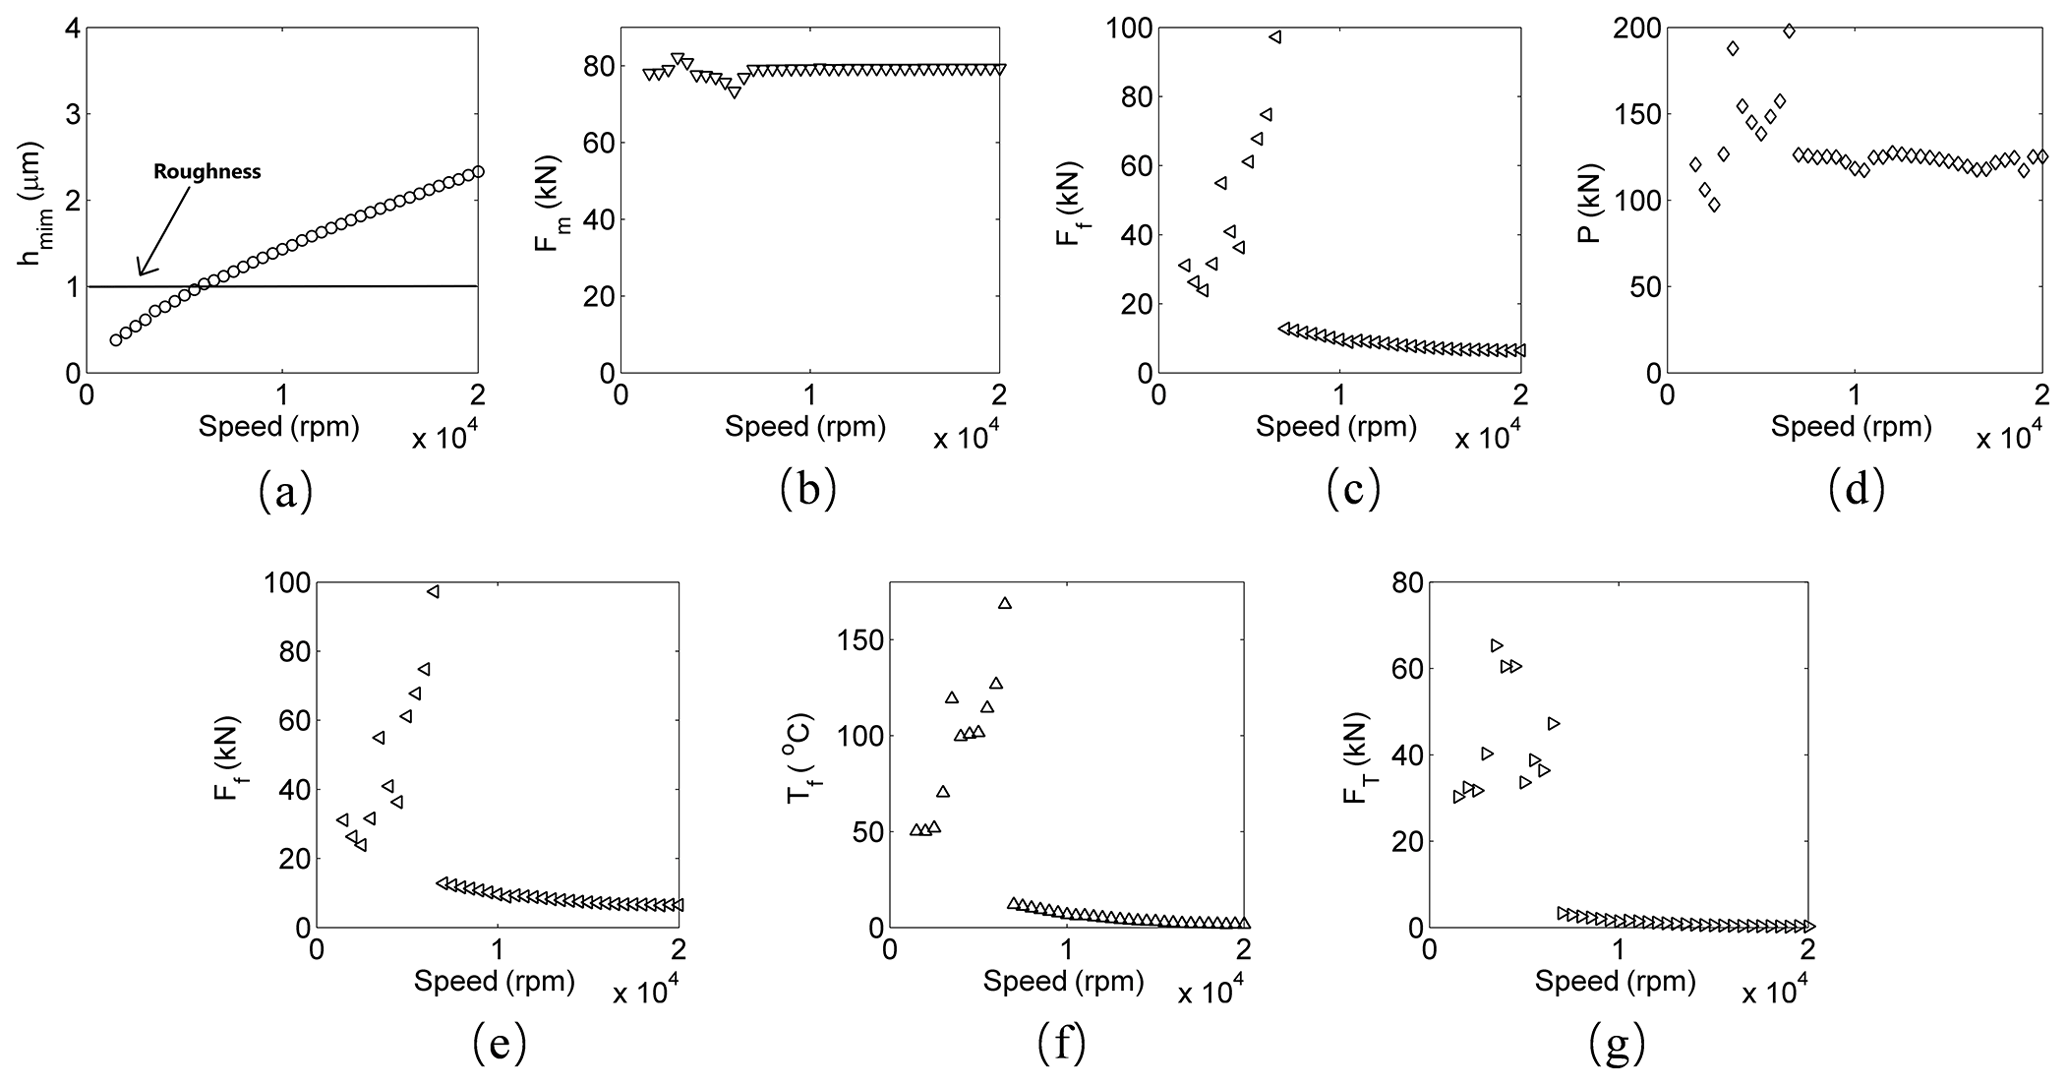
Figure 7Response at the torque load of 5000 Nm and the lubricating oil viscosity of 30 cPs. (a) Minimum thickness of the lubricating oil; (b) meshing force; (c) friction coefficient; (d) pressure of the tooth surface; (e) friction force; (f) flash temperature; (g) thermal stress.
It can be found from Fig. 7a that the minimum thickness of the oil film between the gear tooth increases with the increase in the rotating speed. This is because the minimum thickness of the lubricating oil is directly proportional to the entrainment speed of the gear, and the entrainment speed is directly proportional to the rotating speed, which can be seen in Eq. (13). Figure 7a shows that below about of the first-order critical speed, the tooth surface roughness is greater than the minimum oil film thickness; after about of the first-order critical speed, the minimum oil film thickness is greater than the tooth surface roughness. Therefore, with the rotating speed increases, the lubrication state of the gear pair gradually changes from boundary lubrication to a mixed state of boundary lubrication and elastohydrodynamic lubrication when the speed is close to of the first-order critical speed, and the proportion of elastohydrodynamic lubrication gets higher and higher after of the first-order critical speed. This phenomenon causes the friction coefficient to be mainly the friction coefficient of the boundary lubrication when below of the first-order critical speed, which almost remains constant. The friction coefficient drops sharply at of the critical speed because the friction coefficient of the mixed lubrication is much lower than that of the boundary lubrication, which is shown in Fig. 7c. Figure 7f shows the variation of the flash temperature with the rotating speed. It is reported by Gou et al. (2017) that the flash temperature is slightly increasing with the increase in rotating speed when the friction coefficient is constant; therefore, the flash temperature increases when below of the first-order critical speed, which is the speed range when the friction coefficient is almost constant. According to the analysis of Fig. 5, the friction coefficient is a positive coefficient of the flash temperature, and therefore the flash temperature sharply decreases at about of the first-order critical speed under the effects of the friction coefficient. It can be seen from Fig. 7d, e, f, g that the variation of the flash temperature, thermal stress, pressure of the tooth surface and the friction force are similar, which confirms the conjecture in the analysis of Fig. 5.
It can be found from Fig. 5 that the factors inside the dotted frame are mainly internal affecting factors of the gear-rotor system, which is hardly controlled artificially. The fluctuation of the meshing force is related to the dynamic characteristics of the system, but the overall order of the magnitude of the meshing force is mainly affected by the torque load, which can be controlled by adjusting the actual power of the system. Equation (13) shows that the viscosity coefficient of lubrication oil can affect the minimum thickness of the oil film, which is approximately consistent in the course of the operation, but it can be adjusted by changing the type of lubricating oil. Therefore, the viscosity coefficient of lubrication oil and torque load can be controlled artificially to exert influence on the dynamic characteristics of the system.

Figure 8Bifurcation at the torque load of 5000 Nm and the lubricating oil viscosity of 60 cPs.
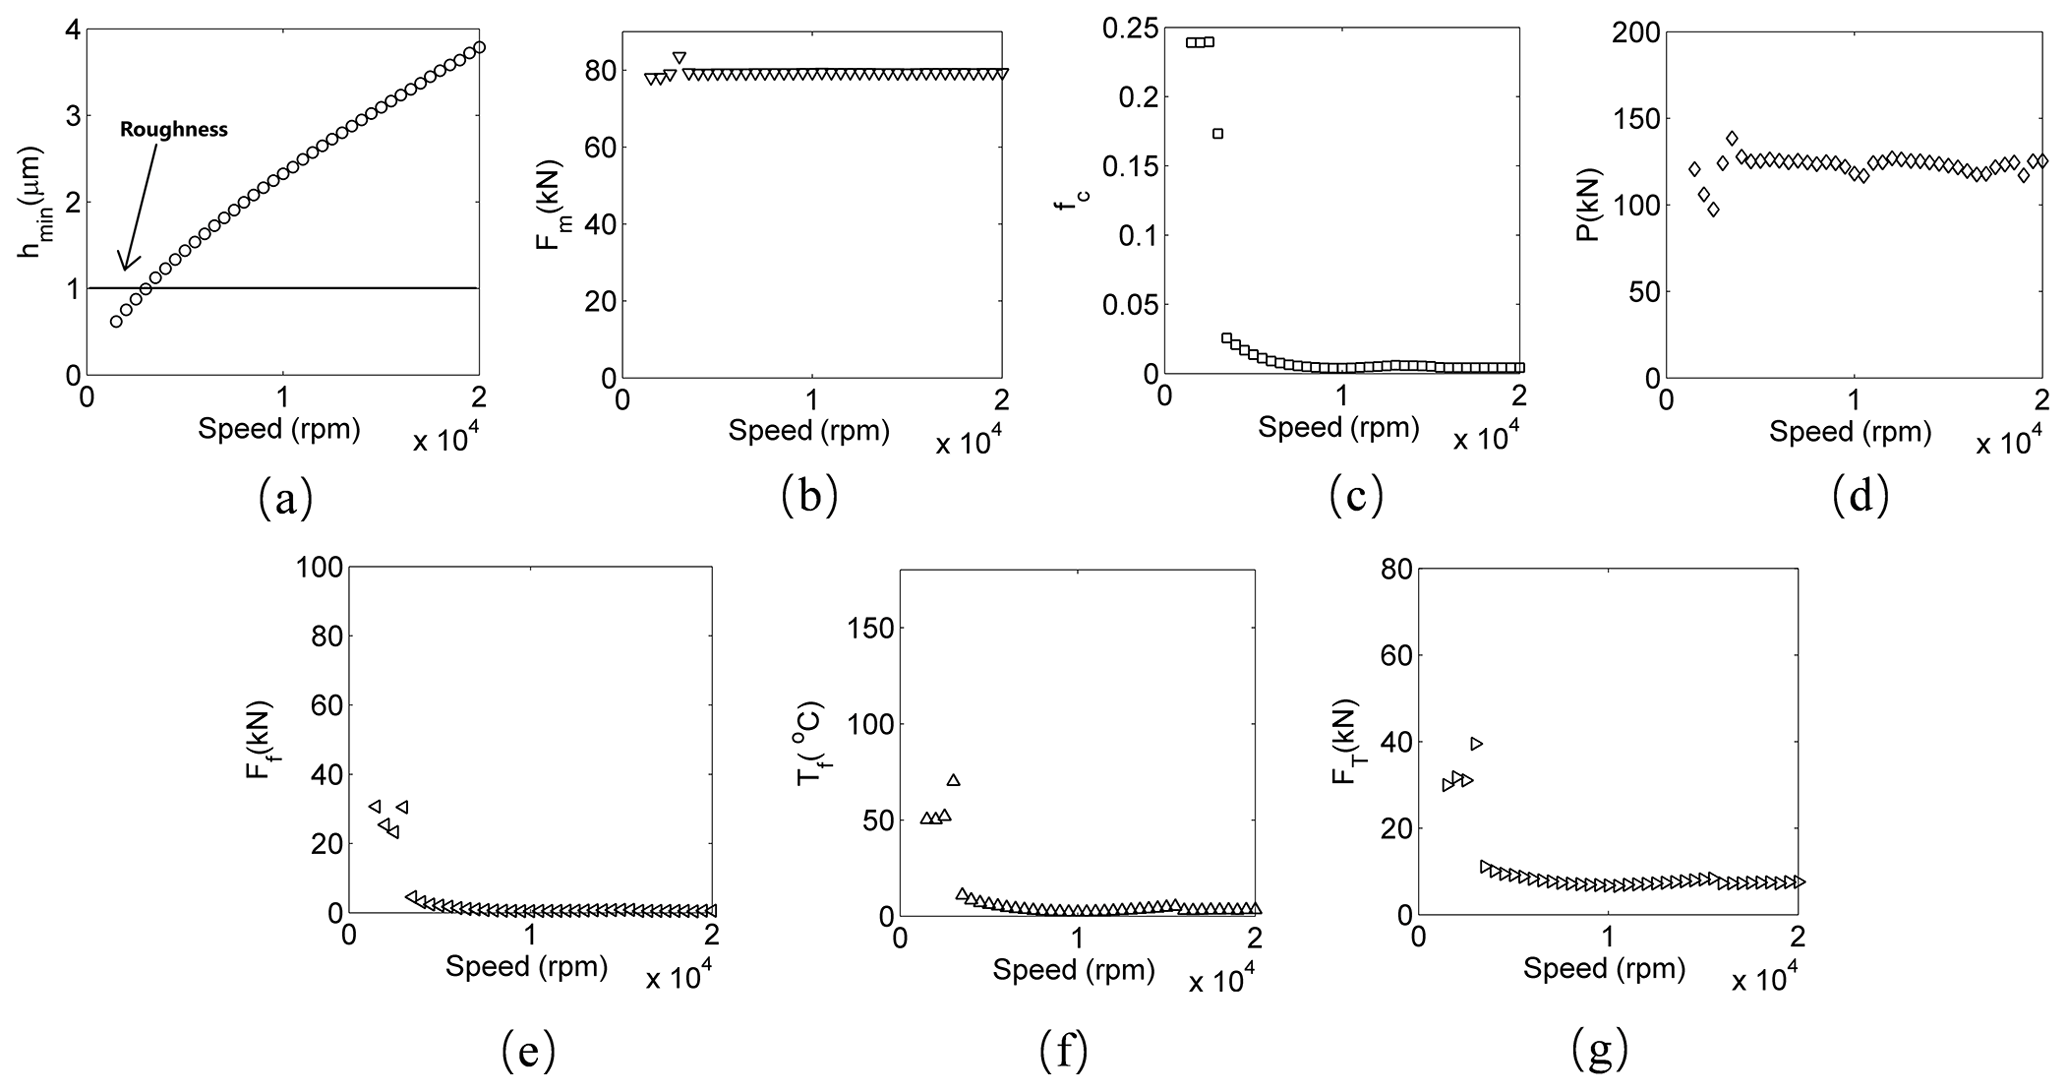
Figure 9Response at the torque load of 5000 Nm and the lubricating oil viscosity of 60 cPs. (a) Minimum thickness of the lubricating oil; (b) meshing force; (c) friction coefficient; (d) pressure of the tooth surface; (e) friction force; (f) flash temperature; (g) thermal stress.
4.2 Effect of the viscosity coefficient of lubrication oil
In order to study the effect of the viscosity coefficient of lubrication oil, the torque load is set as 5000 Nm (remains constant), and the lubricating oil viscosity is set as 60 cPs, which is twice that of before. Figure 8 is the bifurcation diagram of the system response, which is quasi-periodic motion in the entire speed range. The result indicates that the stability of the system response with the lubricating oil viscosity of 60 cPs is significantly improved compared with that when the lubricating oil viscosity is 30 cPs.
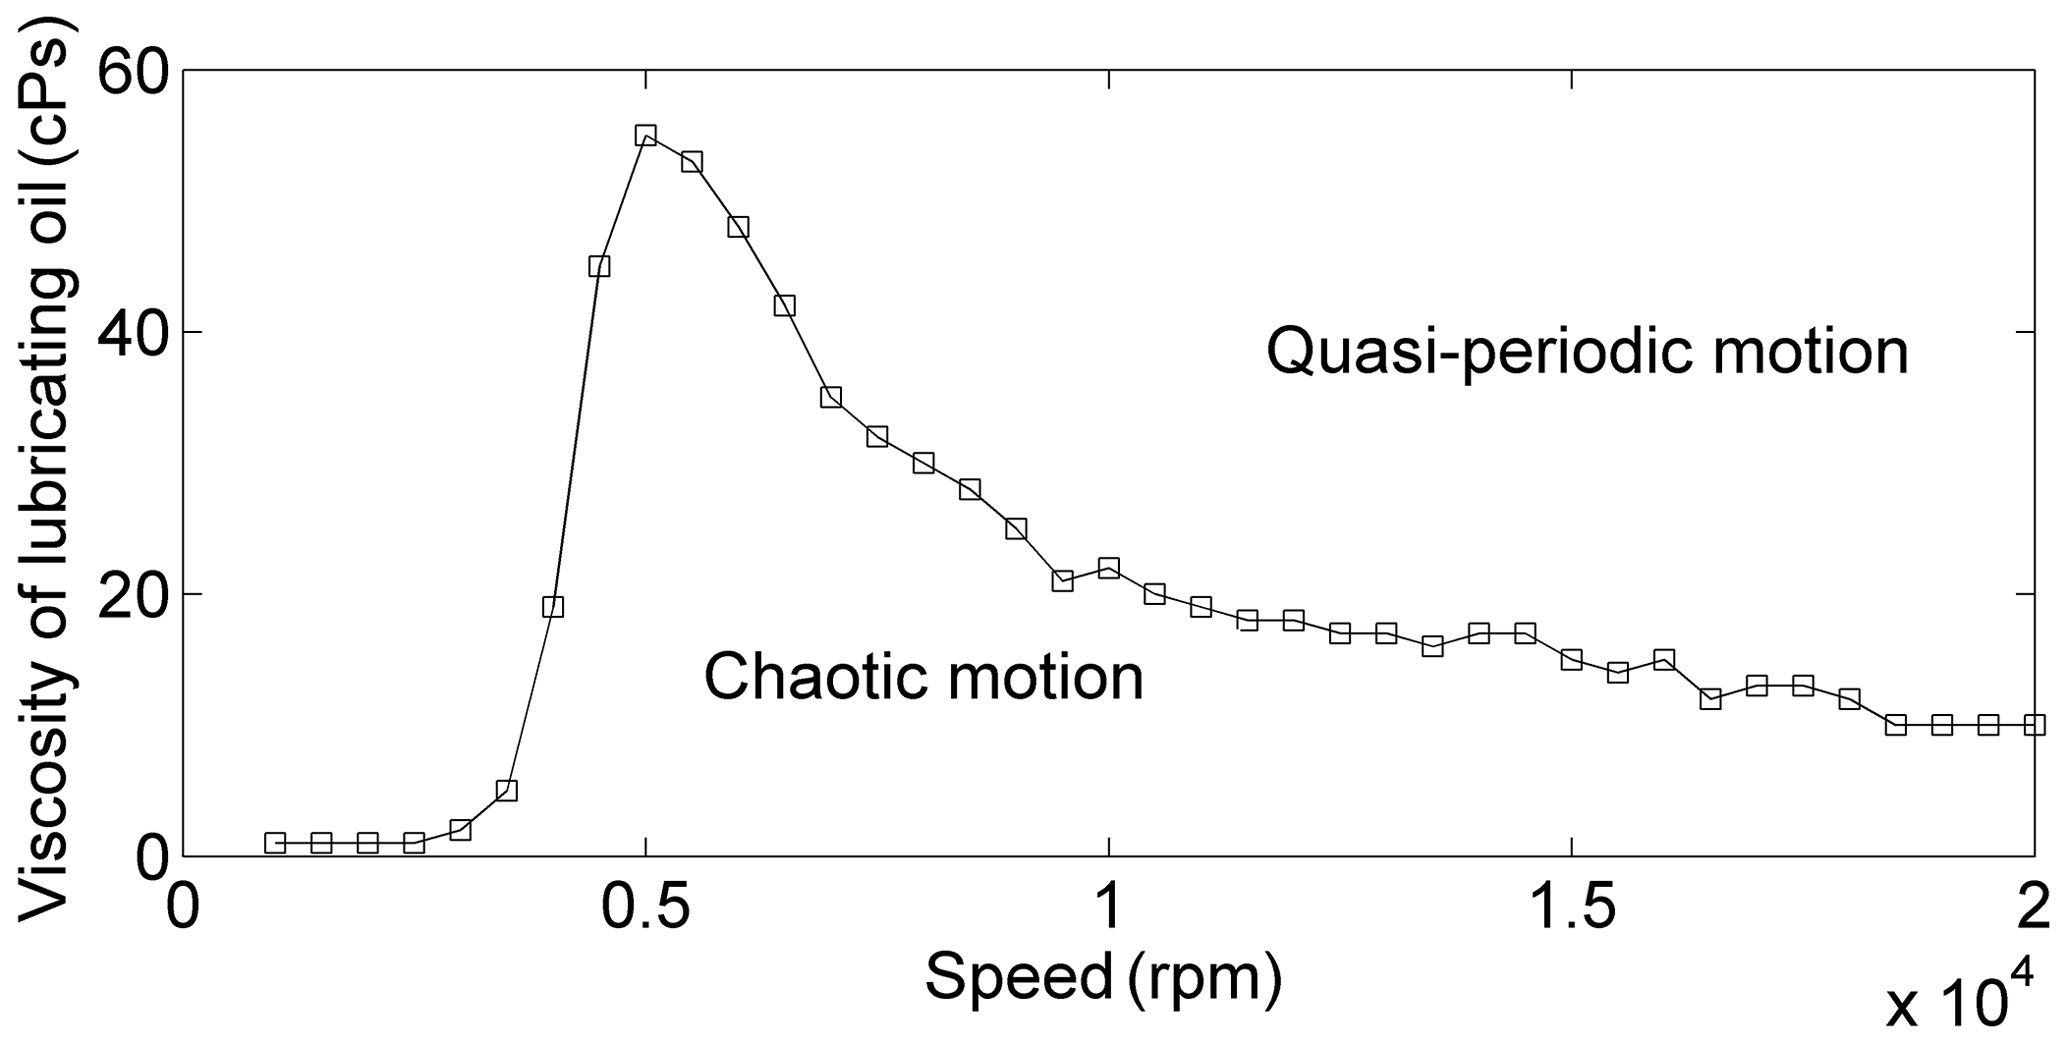
Figure 9 is the response at the torque load of 5000 Nm and the lubricating oil viscosity of 60 cPs. Figure 9b shows that the meshing force is the same as that before because the torque load remains unchanged, and the minimum thickness of the oil film increases compared with that when the lubricating oil viscosity is 30 cPs, which is seen in Fig. 9a. Therefore, the speed range of boundary lubrication is obviously shortened, and the mixed state of boundary lubrication and elastohydrodynamic lubrication changes to the state of elastohydrodynamic lubrication at around the first-order critical speed. This results in a significant reduction of the friction coefficient, leading to the reduction of the flash temperature, thermal stress, pressure of the tooth surface, and the friction force, which can be found in Fig. 9d, e, f, g. Then the increased stability of the system operating at a higher lubricating oil viscosity is explained.

Figure 11Bifurcation at the torque load of 2500 Nm and the lubricating oil viscosity of 30 cPs.
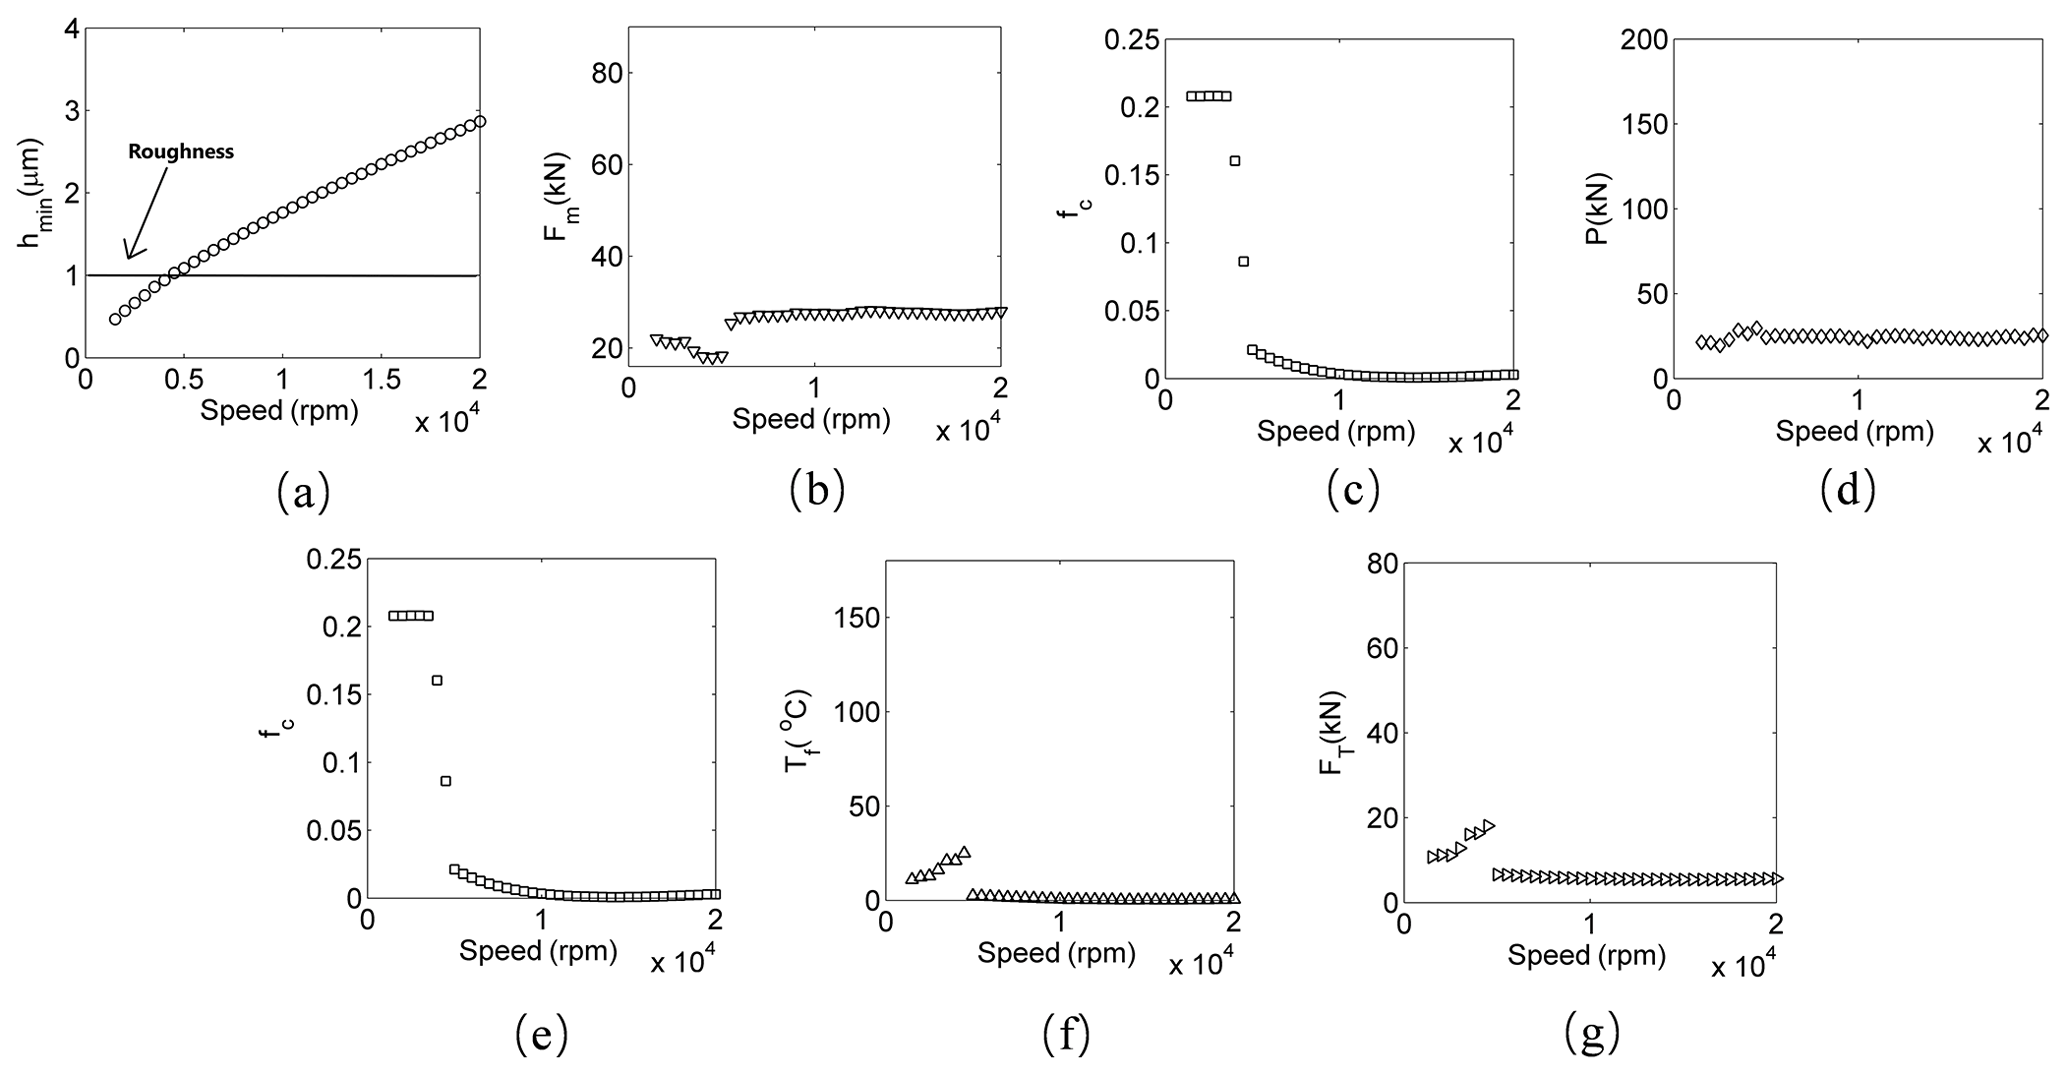
Figure 12Response at the torque load of 2500 Nm and the lubricating oil viscosity of 30 cPs. (a) Minimum thickness of the lubricating oil; (b) meshing force; (c) friction coefficient; (d) pressure of the tooth surface; (e) friction force; (f) flash temperature; (g) thermal stress.
In order to study the effect of the viscosity coefficient of lubrication oil, keep the torque load of the system constant and set the critical viscosity of the lubricating oil as the viscosity when the system response changes from the other motion state to the quasi-periodic state. The critical viscosity of lubricating oil is shown in Fig. 10. In Fig. 10, the system response which operates above the curve is quasi-periodic. Figure 10 shows that the critical viscosity of lubricating oil is relatively high in the speed range of 4000–7000 rpm, whose highest point is close to 60 cPs. The result indicates that one of the criteria for selecting the type of lubricating oil is that the viscosity should be relatively high, or the system needs to pass the speed range of 4000–7000 rpm quickly in order to reduce the operational risk. It is important to note that excessive viscosity of lubricating oil will lead to larger oil pump power and a smaller heat transfer coefficient; therefore, the type of lubricating oil should be carefully selected.
4.3 Effect of the torque load
In order to study the effect of the torque load, reset the lubricating oil viscosity to 30 cPs and set the torque load as 2500 Nm, which is half of that before. Figure 11 shows that the stability of the system response is significantly improved compared with that when the torque load is 5000 Nm, which is quasi-periodic motion in the entire speed range.

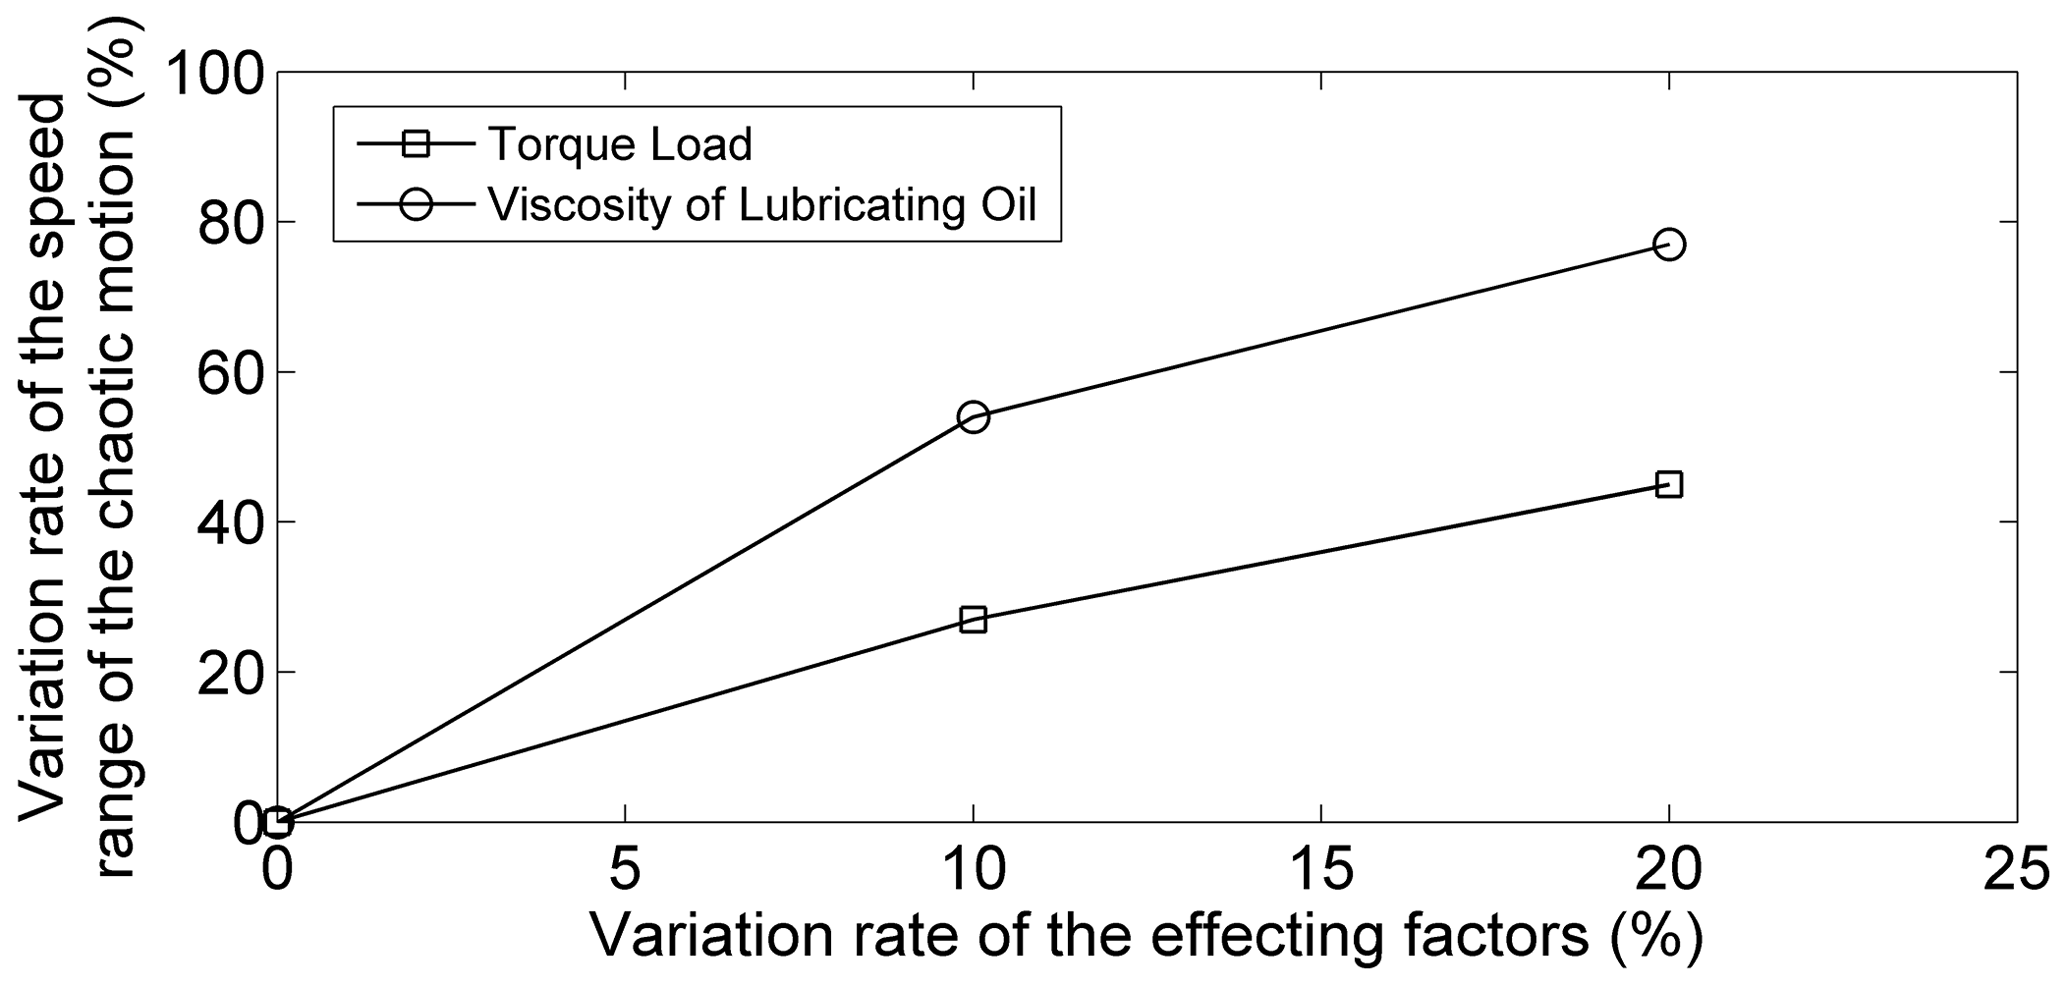
Figure 12a shows that the speed range of boundary lubrication is not much different from that when the torque load is 5000 Nm, which results in little change in the friction coefficient, which is shown in Fig. 12c. Figure 12b shows the meshing force is lower than that before, causing the pressure of the tooth surface to be significantly lower than that when the torque load is 5000 Nm in the entire speed range. Therefore, the flash temperature, thermal stress, and friction force have a significant reduction compared with that when the torque load is 5000 Nm. The increased stability of the system operating at lower torque load is explained.
In order to study the effect of the torque load, keep the viscosity of lubricating oil constant, set the critical torque load as the torque load which the system response changes from the other motion state to the quasi-periodic state, and set the dimensionless critical torque load as the ratio of the critical torque load to the rated torque load of the gear-rotor system in CAES. The dimensionless critical torque load is studied in Fig. 13. In Fig. 13, the system response which operates below the curve is quasi-periodic. Figure 13 shows that the dimensionless critical torque load is relatively low in the speed range of 4000–7000 rpm, whose lowest point is close to the 5 % rated load. The dimensionless critical torque load is close to the 100 % rated load in other speed ranges. The result indicates that the torque load of the system in actual operation needs to be reduced properly when the system is operated in the speed range of 4000–7000 rpm, or the system needs to pass the speed range of 4000–7000 rpm quickly in order to reduce the operational risk.
4.4 Sensitivity analysis
Sensitivity analysis is used to study the effecting level of various effecting factors in the system response and then determine the key effecting factors of the system. The sensitivity analysis of torque load and lubricating oil viscosity in the system response is carried out, which is shown in Fig. 14. In Fig. 14, the abscissa is the lubricating oil viscosity variation rate and torque load variation rate , where η0 is the initial viscosity of lubricating oil, and Δη is the variation of the viscosity of lubricating oil; M is the initial torque load, and ΔM is the variation of the torque load. The horizontal coordinate of Fig. 14 is the variation rate of the rotating speed range of the chaotic motion, which is presented as , where Q is the rotating speed range of the chaotic motion, and ΔQ is the variation of the rotating speed range of the chaotic motion. Figure 14 shows that both the lubricating oil viscosity and torque load have great effects on the response of the gear-rotor system, and the effect of lubricating oil viscosity on the system response is greater than that of torque load.
A finite-element model for the key equipment of CAES – the typical gear-rotor system – was established, and the dynamic characteristics of the system considering contact temperature were studied in detail. The conclusions can be summarized as follows.
-
The minimum oil film thickness of elastohydrodynamic lubrication will increase with the increase in the rotating speed, causing the gear pair lubrication state to change from boundary lubrication to a mixed state of boundary lubrication and elastohydrodynamic lubrication and then to an elastohydrodynamic lubrication state as the rotating speed increases. The variation of the gear pair lubrication state leads to the friction coefficient remaining at a high level at first and then decreasing with the increase in rotating speed.
-
With the increase in rotating speed, the flash temperature first increases when the friction coefficient remains unchanged and then decreases with the decrease in friction coefficient, leading to it being in a high level in the speed range around of the first-order critical speed. The contact temperature of the tooth surface, thermal stress, pressure of the tooth surface and friction force have a similar variation to the flash temperature. This will lead the system to maybe being in chaotic motion in the speed range around of the first-order critical speed.
-
The optimization curve of lubrication oil viscosity and load with respect to rotating speed is obtained, and the method of stabilizing the operation of the system is put forward. Increasing the viscosity of the lubricating oil can improve the stability of system operation by increasing the thickness of the lubricating oil, leading to the decrease in the speed range of the boundary lubrication state. Decreasing the torque load can improve the stability of system operation by decreasing the meshing force.
All data included in this study are available upon request from the corresponding author.
HC, WL and XW conceived of the presented idea. DH and XW carried out the experiments. XW made numerical analysis and wrote the paper. XD checked the article and made suggestions.
The authors declare that they have no conflict of interest.
The authors would like to thank the National Key R&D Plan (2017YFB0903602); the National Natural Science Foundation of China (51976218); the Transformational Technologies for Clean Energy and Demonstration, Strategic Priority Research Program of the Chinese Academy of Sciences (XDA21070303); the International Partnership Program, Bureau of International Cooperation of Chinese Academy of Sciences (182211KYSB20170029); and the Beijing Key Laboratory of Distributed Combined Cooling Heating and Power System.
This research has been supported by the National Key R&D Plan (2017YFB0903602), the National Natural Science Foundation of China (51976218), the Transformational Technologies for Clean Energy and Demonstration, Strategic Priority Research Program of the Chinese Academy of Sciences (XDA21070303), the International Partnership Program, Bureau of International Cooperation of Chinese Academy of Sciences (182211KYSB20170029), and the Beijing Key Laboratory of Distributed Combined Cooling Heating and Power System.
This paper was edited by Daniel Condurache and reviewed by three anonymous referees.
Blok, H.: The flash temperature concept, Wear, 6, 483–494, 1963.
Chen, H., Cong, T., Yang, W., Tan, C., Li, Y., and Ding, Y.: Progress in electrical energy storage system: A critical review, Prog. Nat. Sci., 19, 291–312, 2009.
Chen, H., Xu, Y., Liu, C., He, F., and Hu, S.: Storing Energy in China – An Overview, Storing Energy, 24, 509–527, 2016.
Chen, S., Tang, J., Luo, L., and Wang, Q.: Nonlinear dynamic characteristics of geared rotor bearing systems with dynamic backlash and friction, Mech. Mach. Theory, 46, 466–478, 2011.
Gou, X., Zhu, L., and Qi, C.: Nonlinear dynamic model of a gear-rotor-bearing system considering the flash temperature, J. Sound Vib., 410, 187–208, 2017.
Inaguma, Y.: Friction of outer rotor affecting friction torque characteristics in an internal gear pump, P. I. Mech. Eng. C-J. Mec., 229, 3013–3026, 2015.
ISO: ISO 6336-1-1996, Calculation of load Capacity of Spur and Helical Gears – Part 1: Basic Principles, Introduction and General Influence Factors, Geneva: ISO, 1996.
Kahraman, A. and Singh, R.: Interactions between Time-Varying Mesh Stiffness and Clearance Non-Linearities in a Geared System, J. Sound Vib., 146, 135–156, 1991.
Kar, C. and Mohanty, A. R.: An algorithm for determination of time-varying frictional force and torque in a helical gear system, Mech. Mach. Theory, 42, 482–496, 2007.
Kar, C. and Mohanty, A. R.: Determination of time-varying contact length, friction force, torque and forces at the bearings in a helical gear system, J. Sound Vib., 309, 307–319, 2008.
Li, S. and Anisetti, A.: On the flash temperature of gear contacts under the tribo-dynamic condition, Tribol. Int., 97, 6–13, 2016.
Mao, K.: A numerical method for polymer composite gear flash temperature prediction, Wear, 262, 1321–1329, 2007.
Shi, Y., Yao, Y., and Fei, J.: Analysis of bulk temperature field and flash temperature for locomotive traction gear, Applied Thermal Engineering Design Processes Equipment Economics, 99, 528–536, 2016.
Someya,T.: Journal Bearing Databook, Springer-Verlag, Berlin Heidelberg, 1989.
Wang, W. Z. and Ping, H.: A Numerical Model of Boundary Lubrication under Point Contacts, Tribology, 28, 240–243, 2008.
Wang, X., Zhuang M., Zhang Q., Li S., and Fu B.: Dynamic Stability Study of Static Gas Bearing for Small Cryogenic Turbo-Expander, Plasma Sci. Technol., 13, 506–512, 2011.
Xu, H., Kahraman, A., Anderson, N. E., and Maddock, D. G.: Prediction of mechanical efficiency of parallel-axis gear pairs, J. Mech. Design, 129, 58–68, 2007.
Zhang, X., Chen H., Liu J., Li W., and Tan C.: Research progress in compressed air energy storage system: A review, Energy Storage Science and Technology, 1, 26–40, 2012.
Zhou, C., Hu, B., and Qian, X.: A novel prediction method for gear friction coefficients based on a computational inverse technique, Tribol. Int., 127, 200–208, 2018.