the Creative Commons Attribution 4.0 License.
the Creative Commons Attribution 4.0 License.
 | 17 May 2021
Investigation on the size effect in micro end milling considering the cutting edge radius and the workpiece material
Yang Li
Xiang Cheng
Guangming Zheng
Huanbao Liu
Previous research has found that the peripheral and end cutting edges of the cutter had different cutting mechanisms in the micro end cutting process considering the size effect. This investigation is a further study on this point considering the cutting edge radius of the cutter and the material of the workpiece based on the methods of finite element simulation and the micro end cutting experiment. This study adopts a combination of simulation and experiment research methods and the cutting edge radius and the workpiece material as two variables. Considering the cutting mechanisms of the peripheral cutting edge and the end cutting edge are different, the peripheral cutting edge and the end cutting edge are studied respectively. Meanwhile, the minimum undeformed chip thickness (MUCT) value is determined in three ways, chip morphology, cutting force, and surface roughness, so the final result obtained by comparing three kinds of results has a very important reference value. Not only are the chip morphology obtained by finite element simulation and the surface roughness obtained by the micro end cutting experiment used to identify the MUCT value, but also the cutting force. The simulation and experimental results show that the cutting force can be used to identify the MUCT value for the peripheral cutting edge, but it cannot be used for the end cutting edge. The MUCT value increases with the increase of the cutting edge radius, no matter which process it is. The material property has some effects on the MUCT value; even the cutting parameters and the cutting edge radius remain unchanged for the peripheral cutting edge. However, the material property has no effect on the MUCT value for the end cutting edge. In this study, the influence of important variables on MUCT is studied as much as possible to reflect a real application situation.
- Article
(9966 KB) - Full-text XML
- BibTeX
- EndNote


Micro end milling is capable of manufacturing micro parts with relatively complex three-dimensional (3D) features in multifarious materials (Dornfeld et al., 2006). It is widely used in the fabrication of micro engine parts, micro medical parts, and micro optics devices because of the high efficiency, good flexibility, and low manufacturing process cost. The size effect is an extraordinary phenomenon that only appears in the micro cutting process, which is significantly different compared to the macro cutting process. It is very important that the size effect has a direct effect on the surface quality of the machined workpiece. Therefore, the size effect needs to be studied in depth in order to improve the surface quality of parts to be manufactured by the micro end milling process.
Aramcharoen et al. (2009) conducted an investigation on the influence of the ratio of the undeformed chip thickness (UCT) to the cutting edge radius through a micro milling experiment with the material H13 hardened tool steel. The result of this research indicated the size effect is remarkable when the ratio of UCT to the cutting edge radius is less than 1. It was also found that the best surface finish is obtained when the UCT is selected to be the same value as the cutting edge radius for the micro machining of H13 hardened tool steel. Meanwhile, the geometry of the cutting edge has a significant influence on the surface finish and burr size in micro milling. Vipindas et al. (2018) conducted a series of micro end milling experiments with the material Ti-6Al-4V titanium alloy in order to study the effect of the cutting edge radius on the cutting force, surface roughness, and chip formation. It was found that the critical feed per tooth value is about of the cutting edge radius. That means a greater plowing mechanism will appear when the feed per tooth is less than the critical value. Wu et al. (2016) conducted an investigation on the plowing force in the micro cutting process considering the cutting edge radius. They found that the larger cutting edge radius is accompanied by the greater plowing force because of more materials being removed by the cutting edge and because the plowing force increases when the UCT increases (Wu et al., 2016). Wojciechowski et al. (2019) have used a numerical–analytical approach to investigate the relationship between the minimum uncut chip thickness and the plowing force and ascertained the regimes that are burnishing-dominant and chip-formation-dominant. They found that the burnishing-dominant regime in micro end milling will take place when , but the chip-formation-dominant regime in micro end milling will take place when (Wojciechowski et al., 2019). Oliveira et al. (2015) have conducted micro milling experiments with the material AISI 4045 steel to study the relationship between the size effect and the tool edge radius. They found that the minimum undeformed chip thickness (MUCT) varied between 22 % and 36 % of the tool edge radius without considering the workpiece material, mechanical machining process, and tool geometry (Oliveira et al., 2015).
As stated above, the size effect has a close relationship with the MUCT and has a direct influence on the chip formation, cutting force, surface roughness, and burr size. Some researchers have selected different cutting edge radii to study, but they have not considered whether the workpiece material has an influence on the MUCT. Therefore, in order to study the relationship between the cutting edge radius, workpiece material, and the MUCT in depth, we conduct some simulations and experiments based on our previous studies, and we also add the cutting force as a judgment condition to assist in obtaining the MUCT. Meanwhile, both the peripheral cutting edge and end cutting edge need to be studied separately according to our previous research conclusion (Cheng et al., 2014). In order to reduce the influence of the geometric parameters on the experiment results, only the geometric parameter of the cutting edge radius is a variable for the selected cutting tool used in this study, and other geometric parameters are consistent (Cui et al., 2019, 2020a, b).
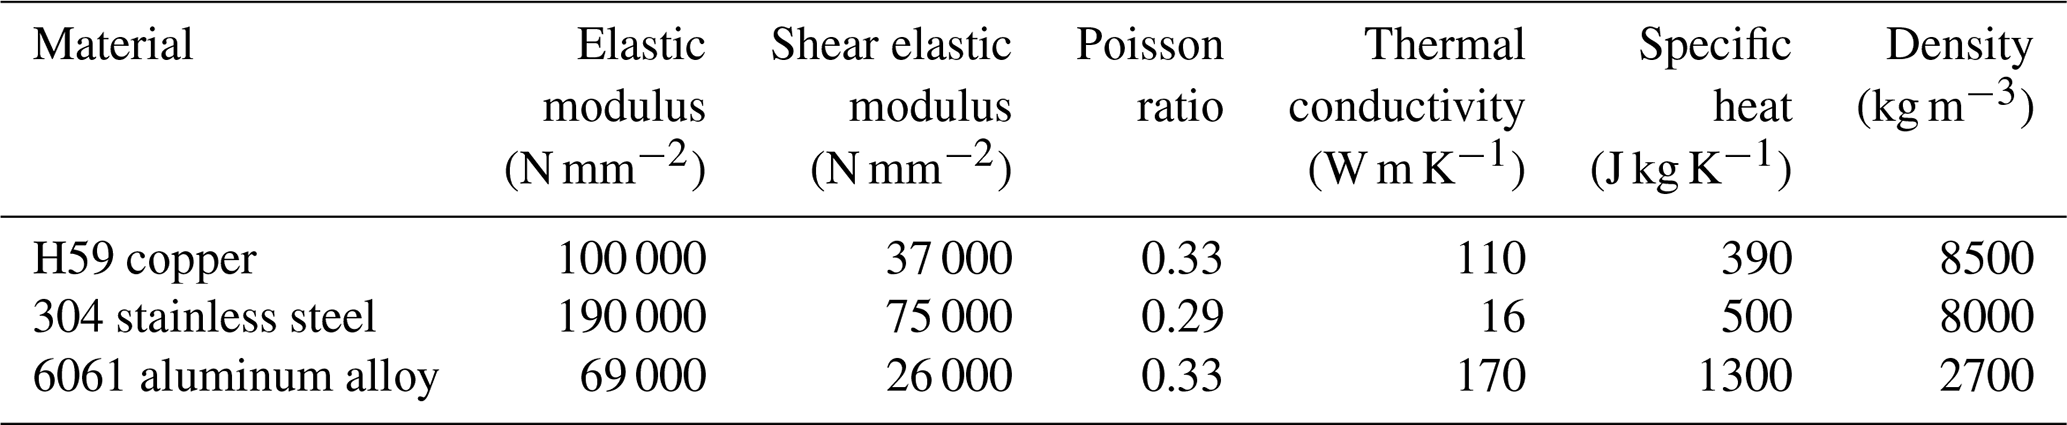
Three kinds of workpiece materials, H59 copper, 304 stainless steel, and 6061 aluminum alloy, are selected on the finite element simulations and micro milling experiments for both the peripheral cutting edge and the end cutting edge in this study. These three materials are commonly used in mechanical processing, and their material properties have some differences. Different workpiece materials can be selected to verify whether the material properties have an impact on MUCT. The properties of the three kinds of materials are shown in Table 1.
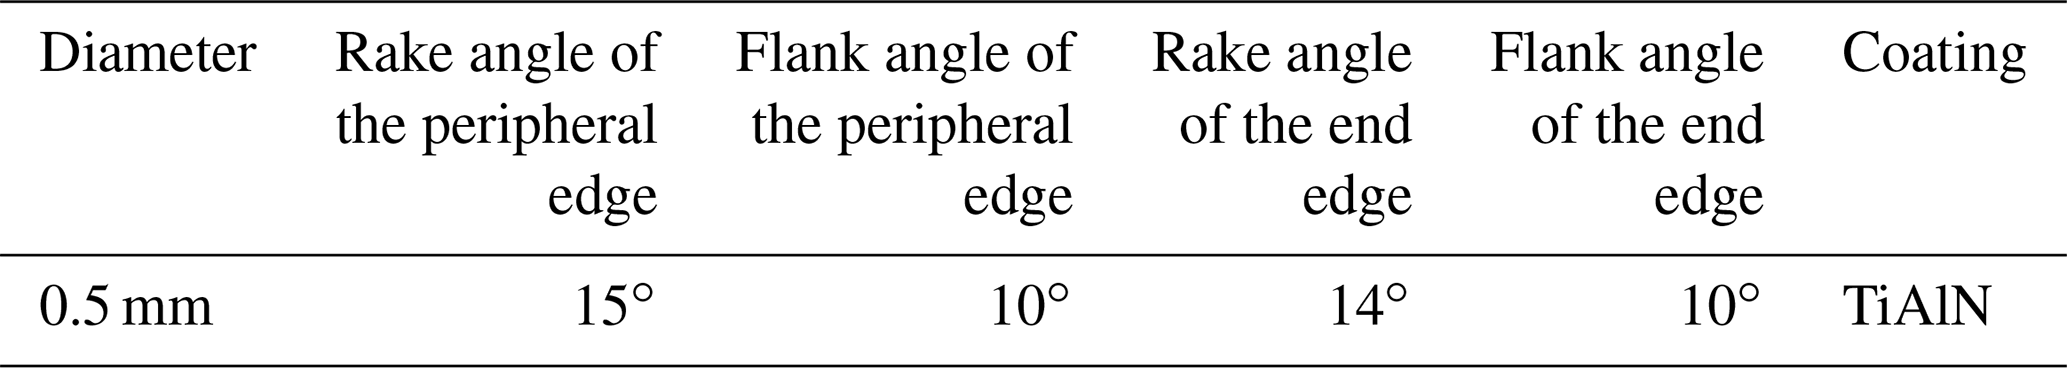
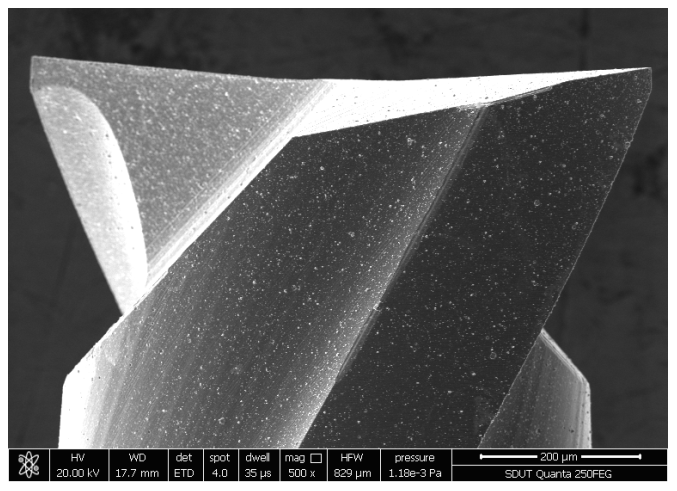
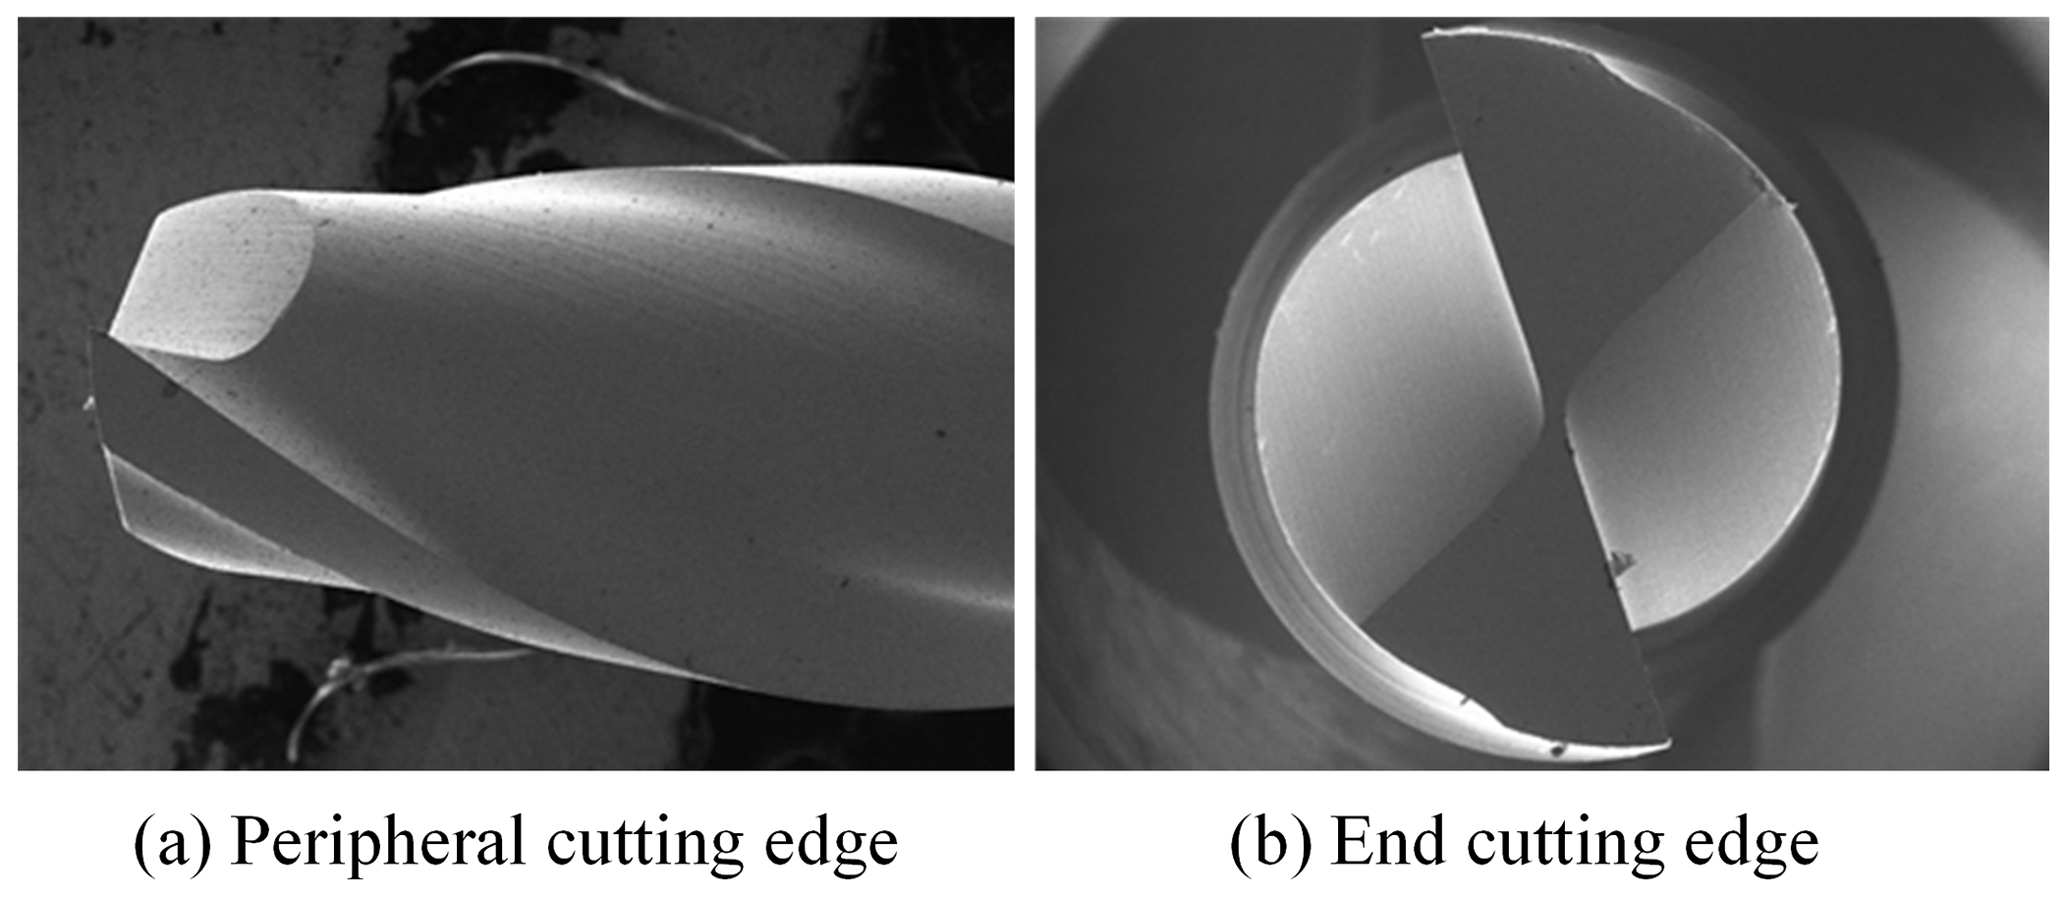
The cutter has the same macro geometries in the experiments as shown in Fig. 1, and the specific parameters are shown in Table 2. All micro end cutters used have identical geometries except the cutting edge radii. Based on our previous research, four kinds of micro end cutters with cutting edge radii of 1, 3, 5, and 7 µm are selected in this study.
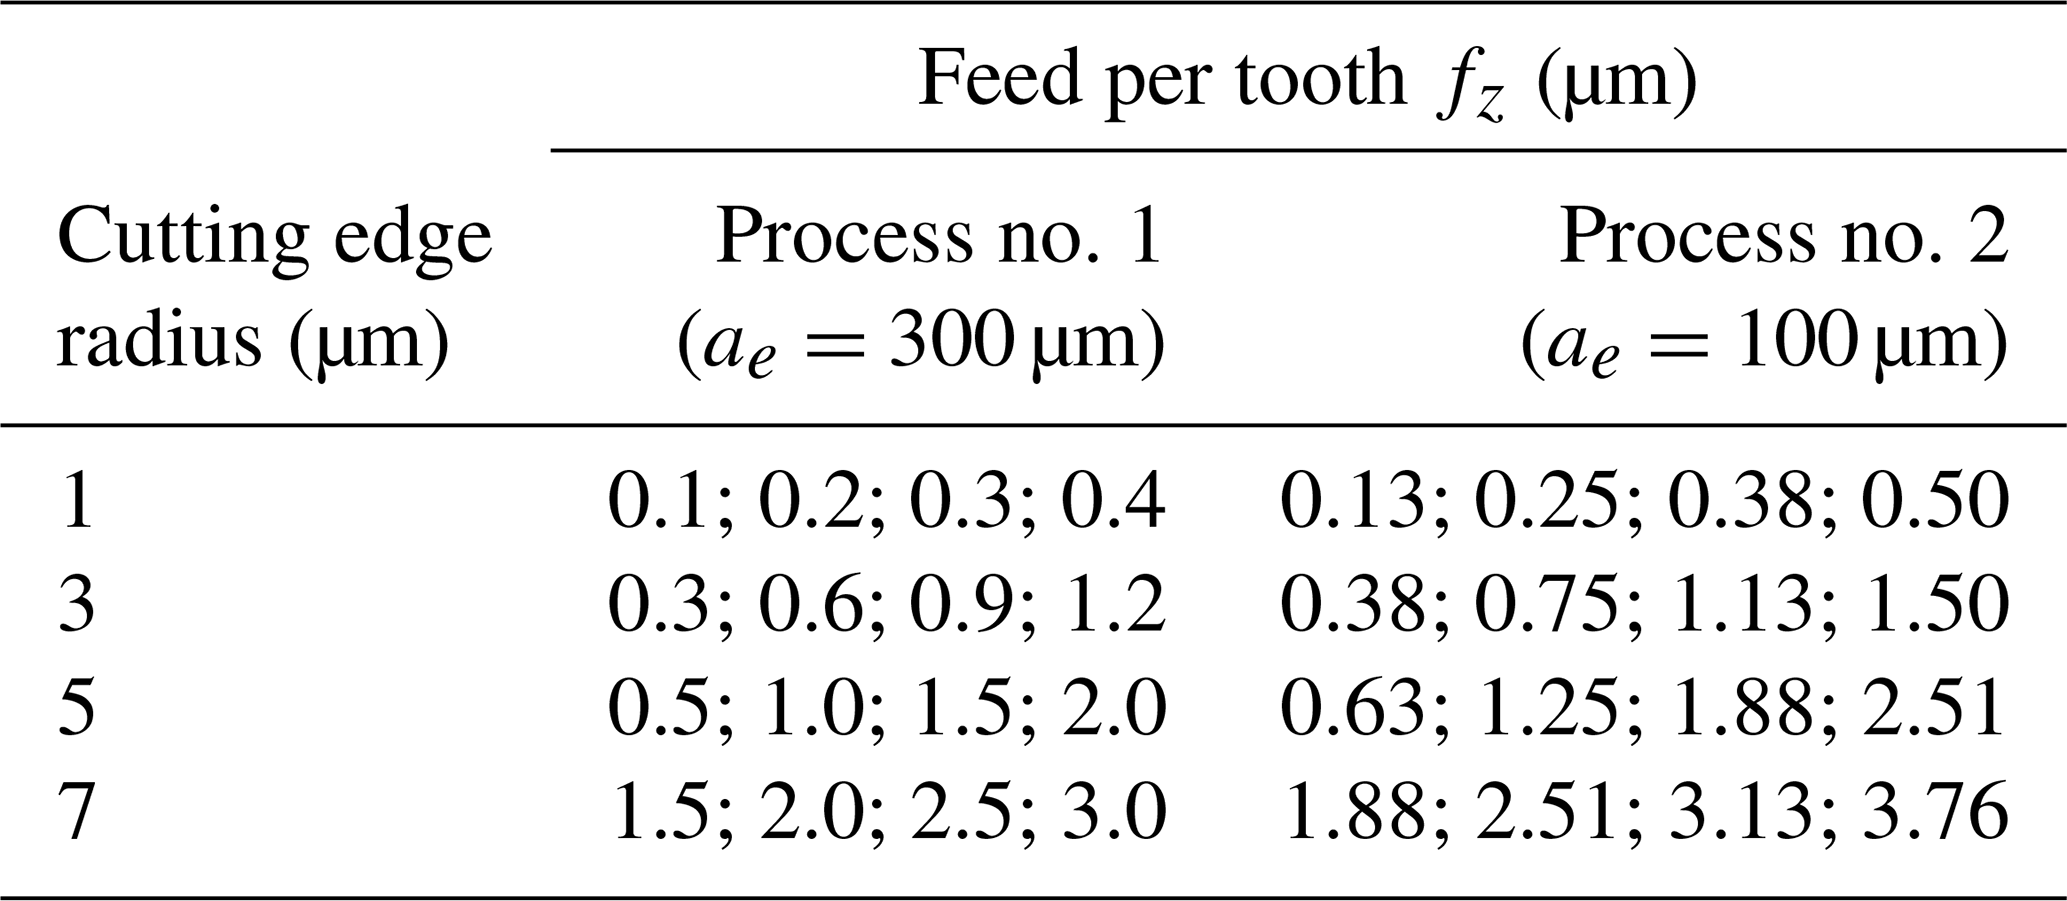
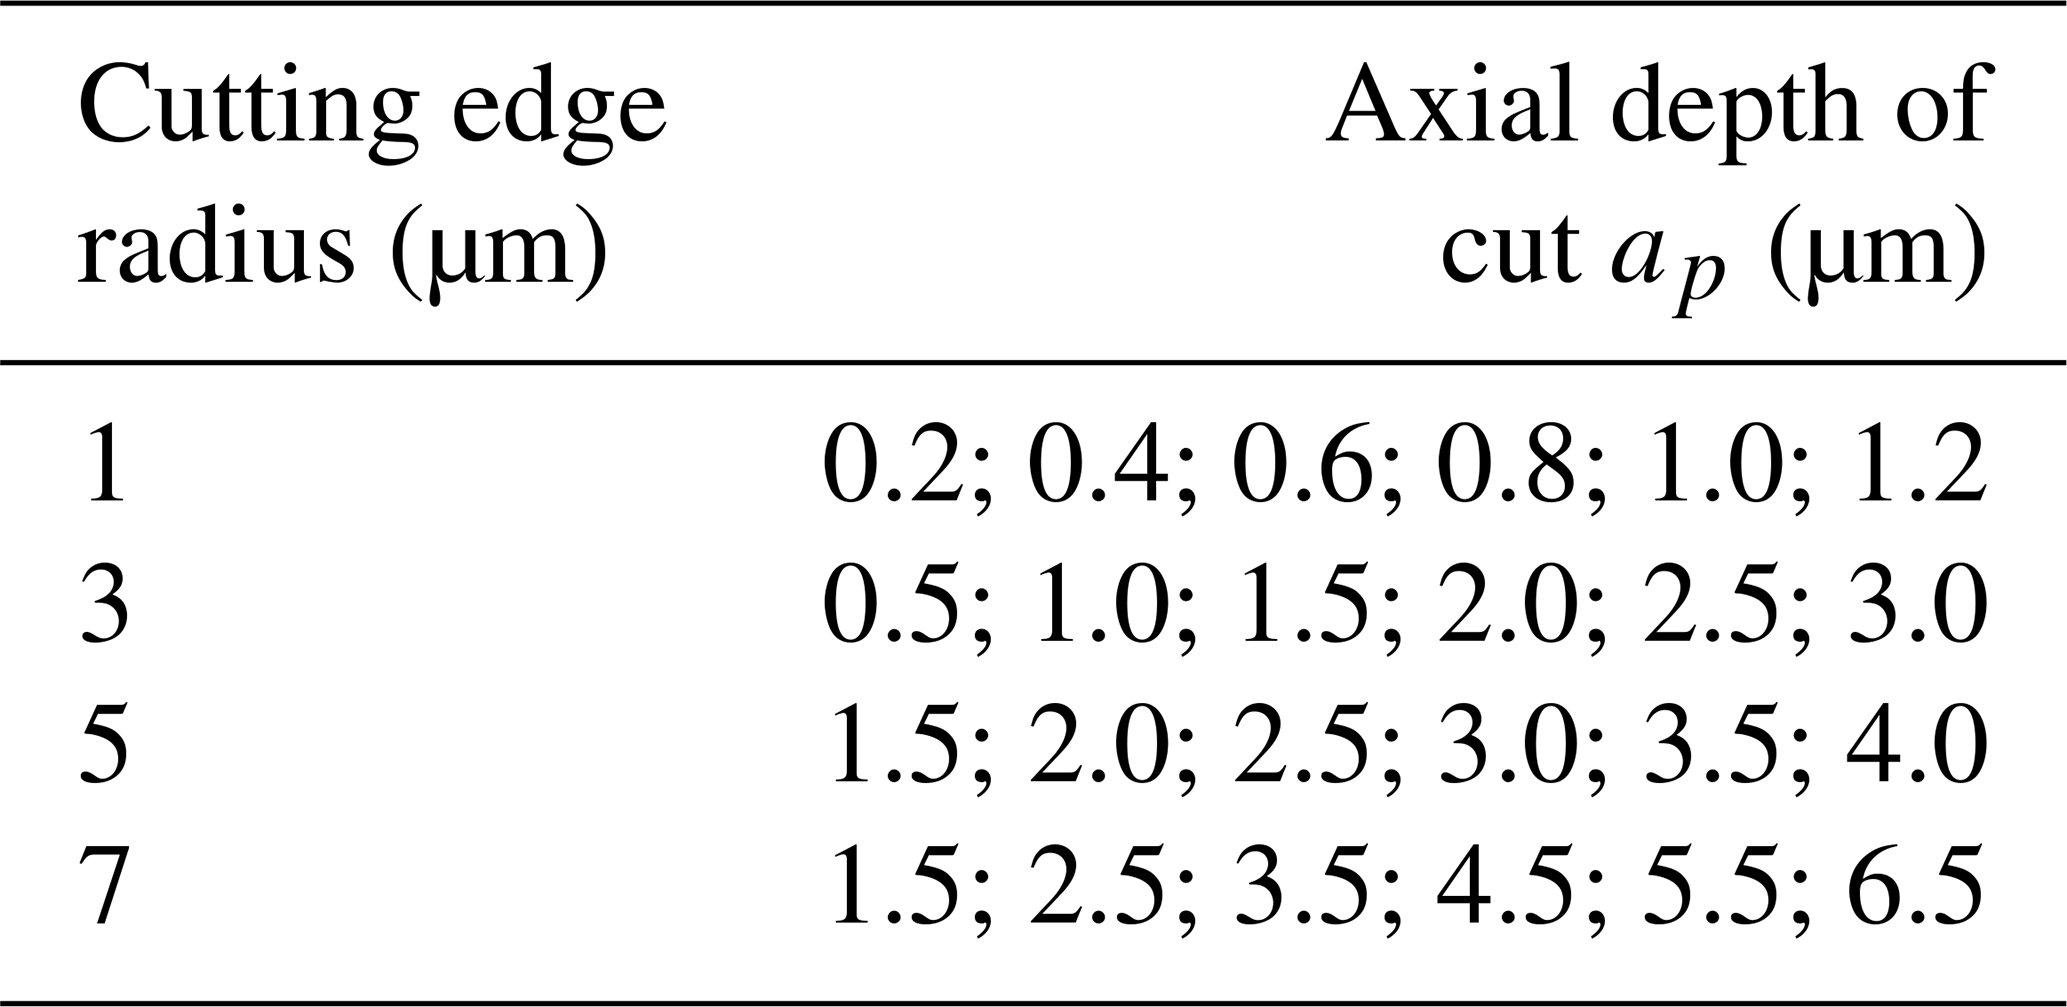
Based on the conclusions of literature (Cheng et al., 2018; Li et al., 2021), the cutting parameters are selected for the peripheral cutting edge and the end cutting edge, as shown in Tables 3 and 4, respectively.
Deform-3D software is selected to conduct the finite element simulation for the simulation of the peripheral cutting edge and the end cutting edge in micro milling. The 3D model is established by SolidWorks software and is then exported into Deform-3D software. The material properties of the cutting tool and workpiece are selected from the Deform-3D material database. In order to improve the accuracy of simulation, the mesh on the contact position of cutting edge and workpiece is subdivided.
According to the recognition condition for the size effect as mentioned in literature (Cheng et al., 2018), chip morphology can be used to judge the MUCT value; when the chip is generated along the entire cutting edge, we deem the UCT value to have attained the MUCT value. Meanwhile, the cutting force can also be used to judge the MUCT value. The cutting force does not always increase with the increase of cutting parameters due to the existence of the size effect. Therefore, the turning point of the cutting force can be used to determine the MUCT value (Wojciechowski et al., 2019).
3.1 Micro end milling simulation of peripheral cutting edge
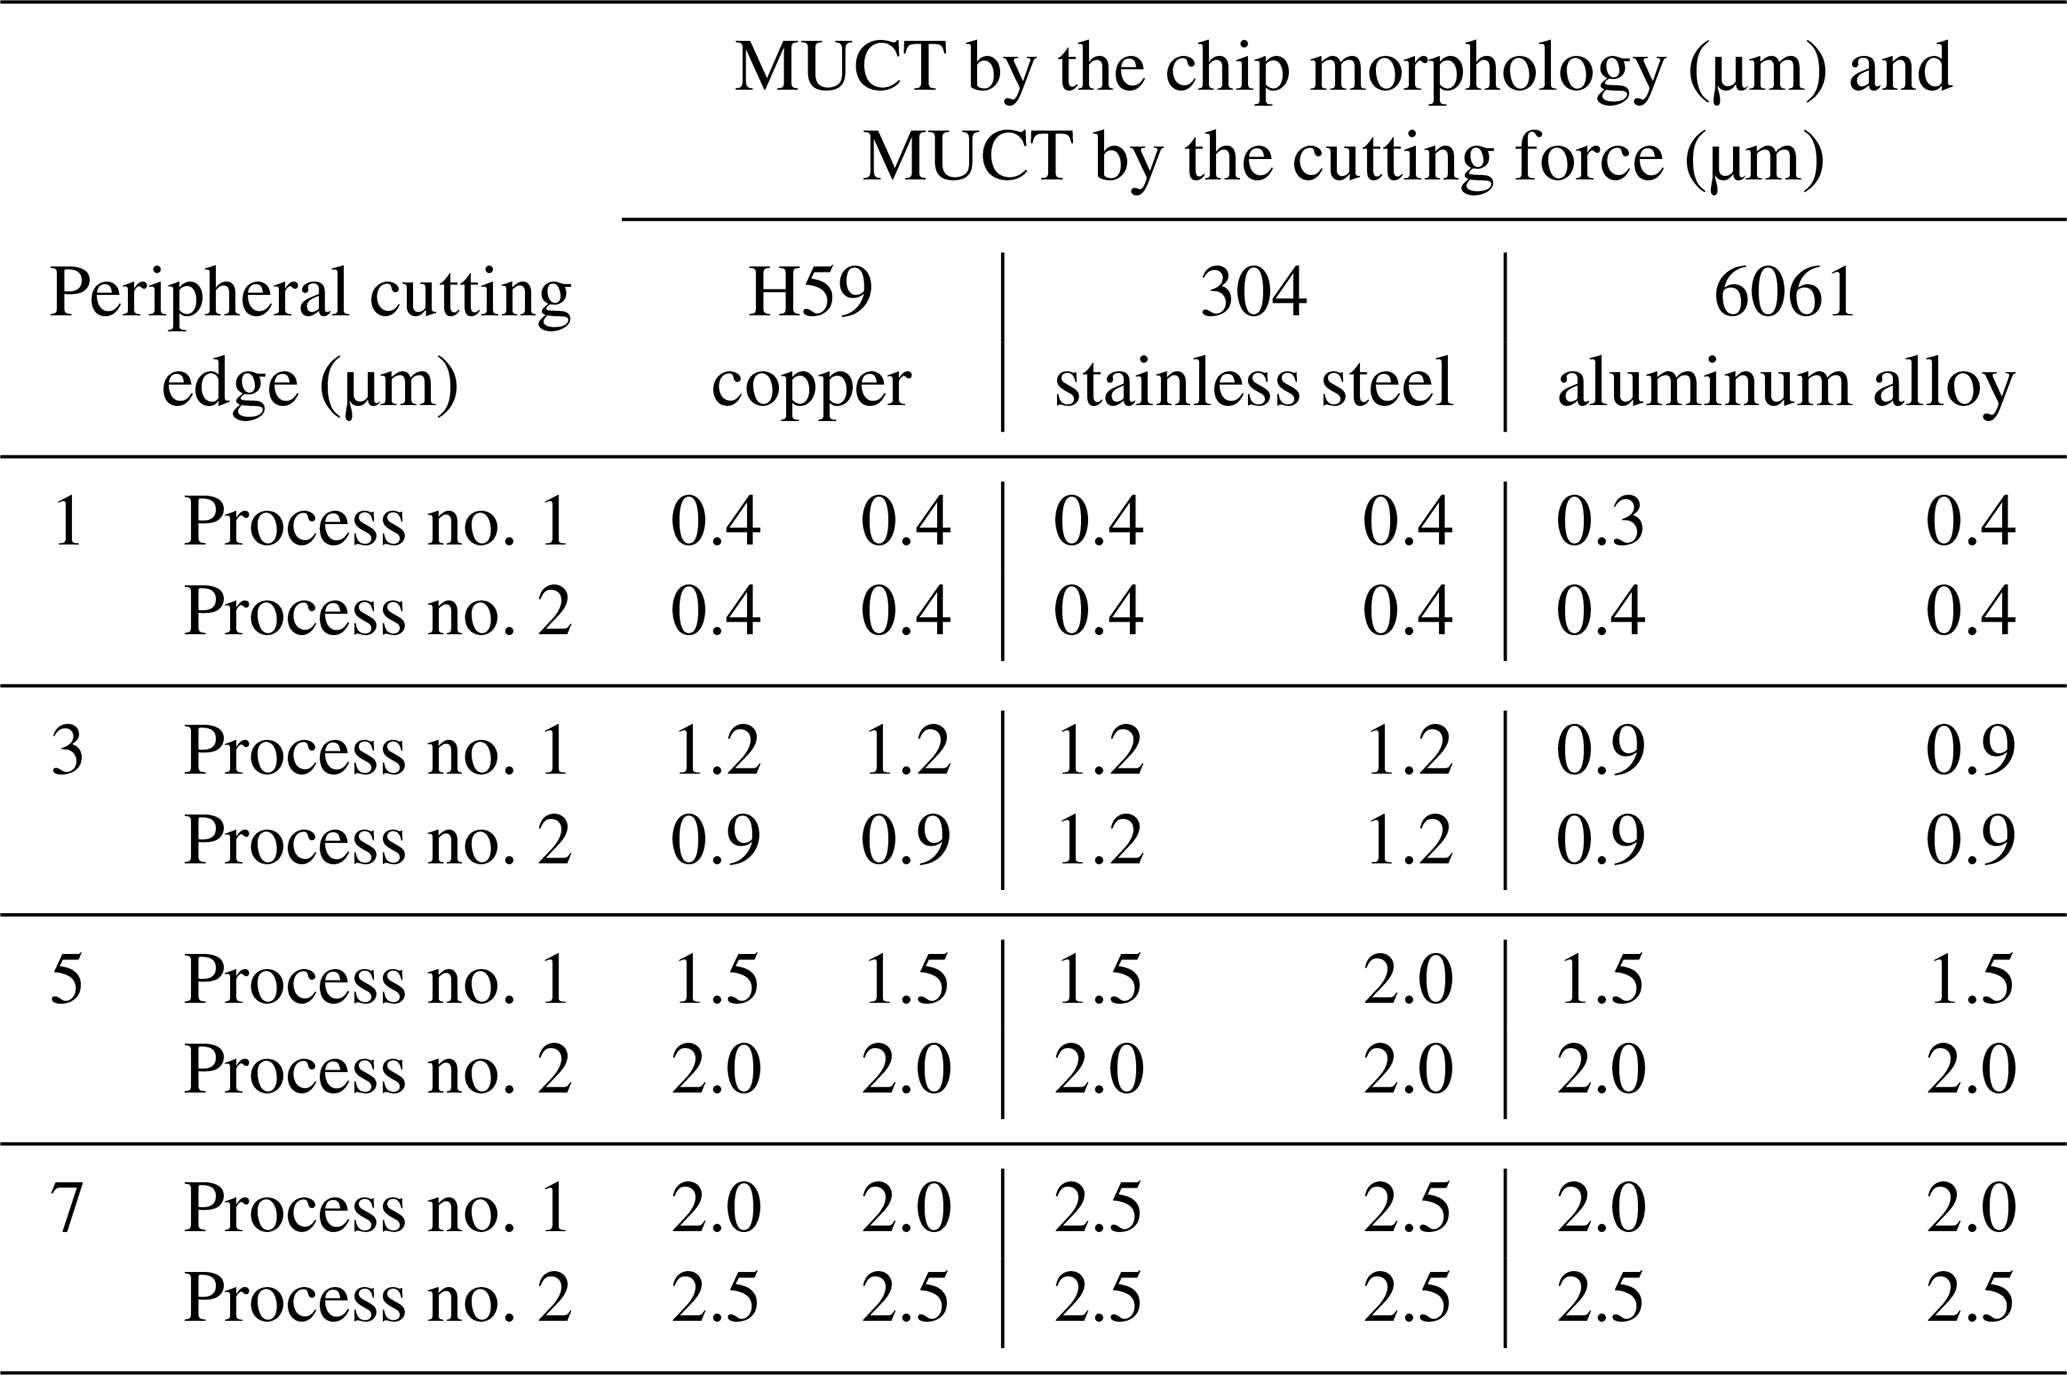
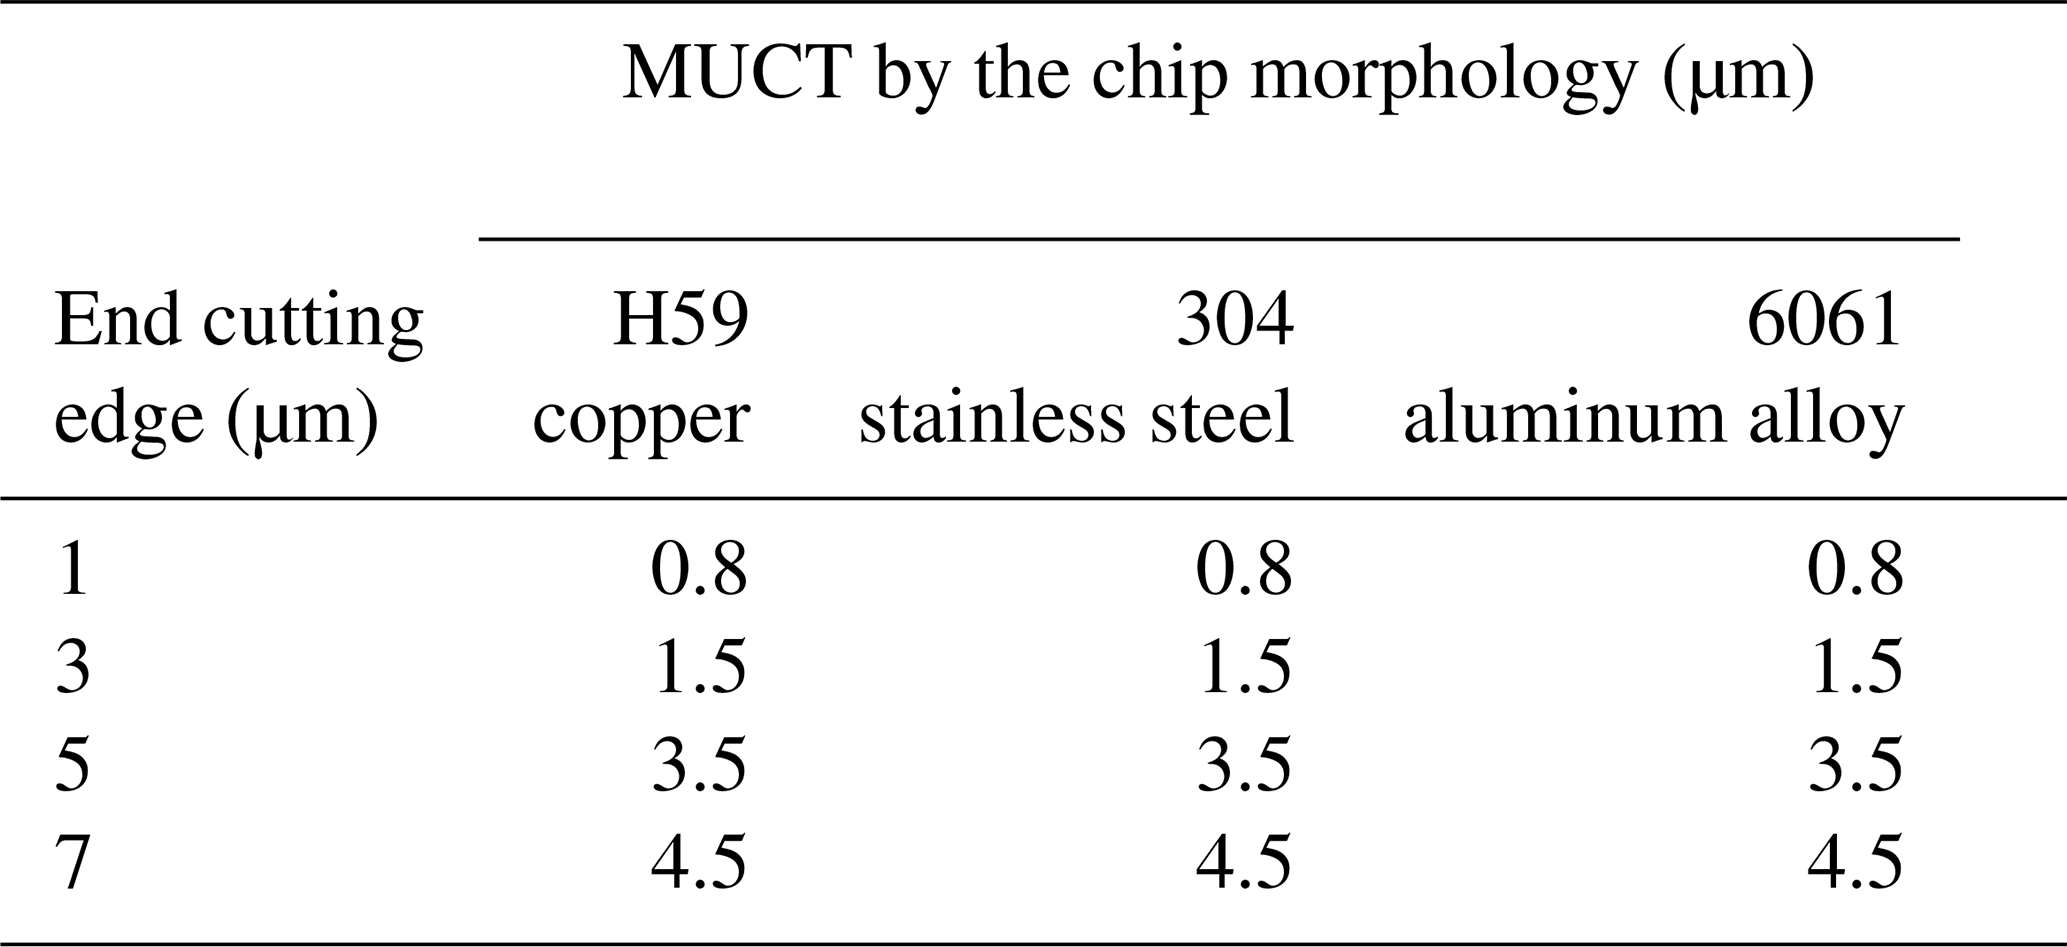
According to the MUCT identification method is mentioned above, the simulation results for when only the peripheral cutting edge is engaged are analyzed, and all MUCT values are concluded and shown in Table 5.
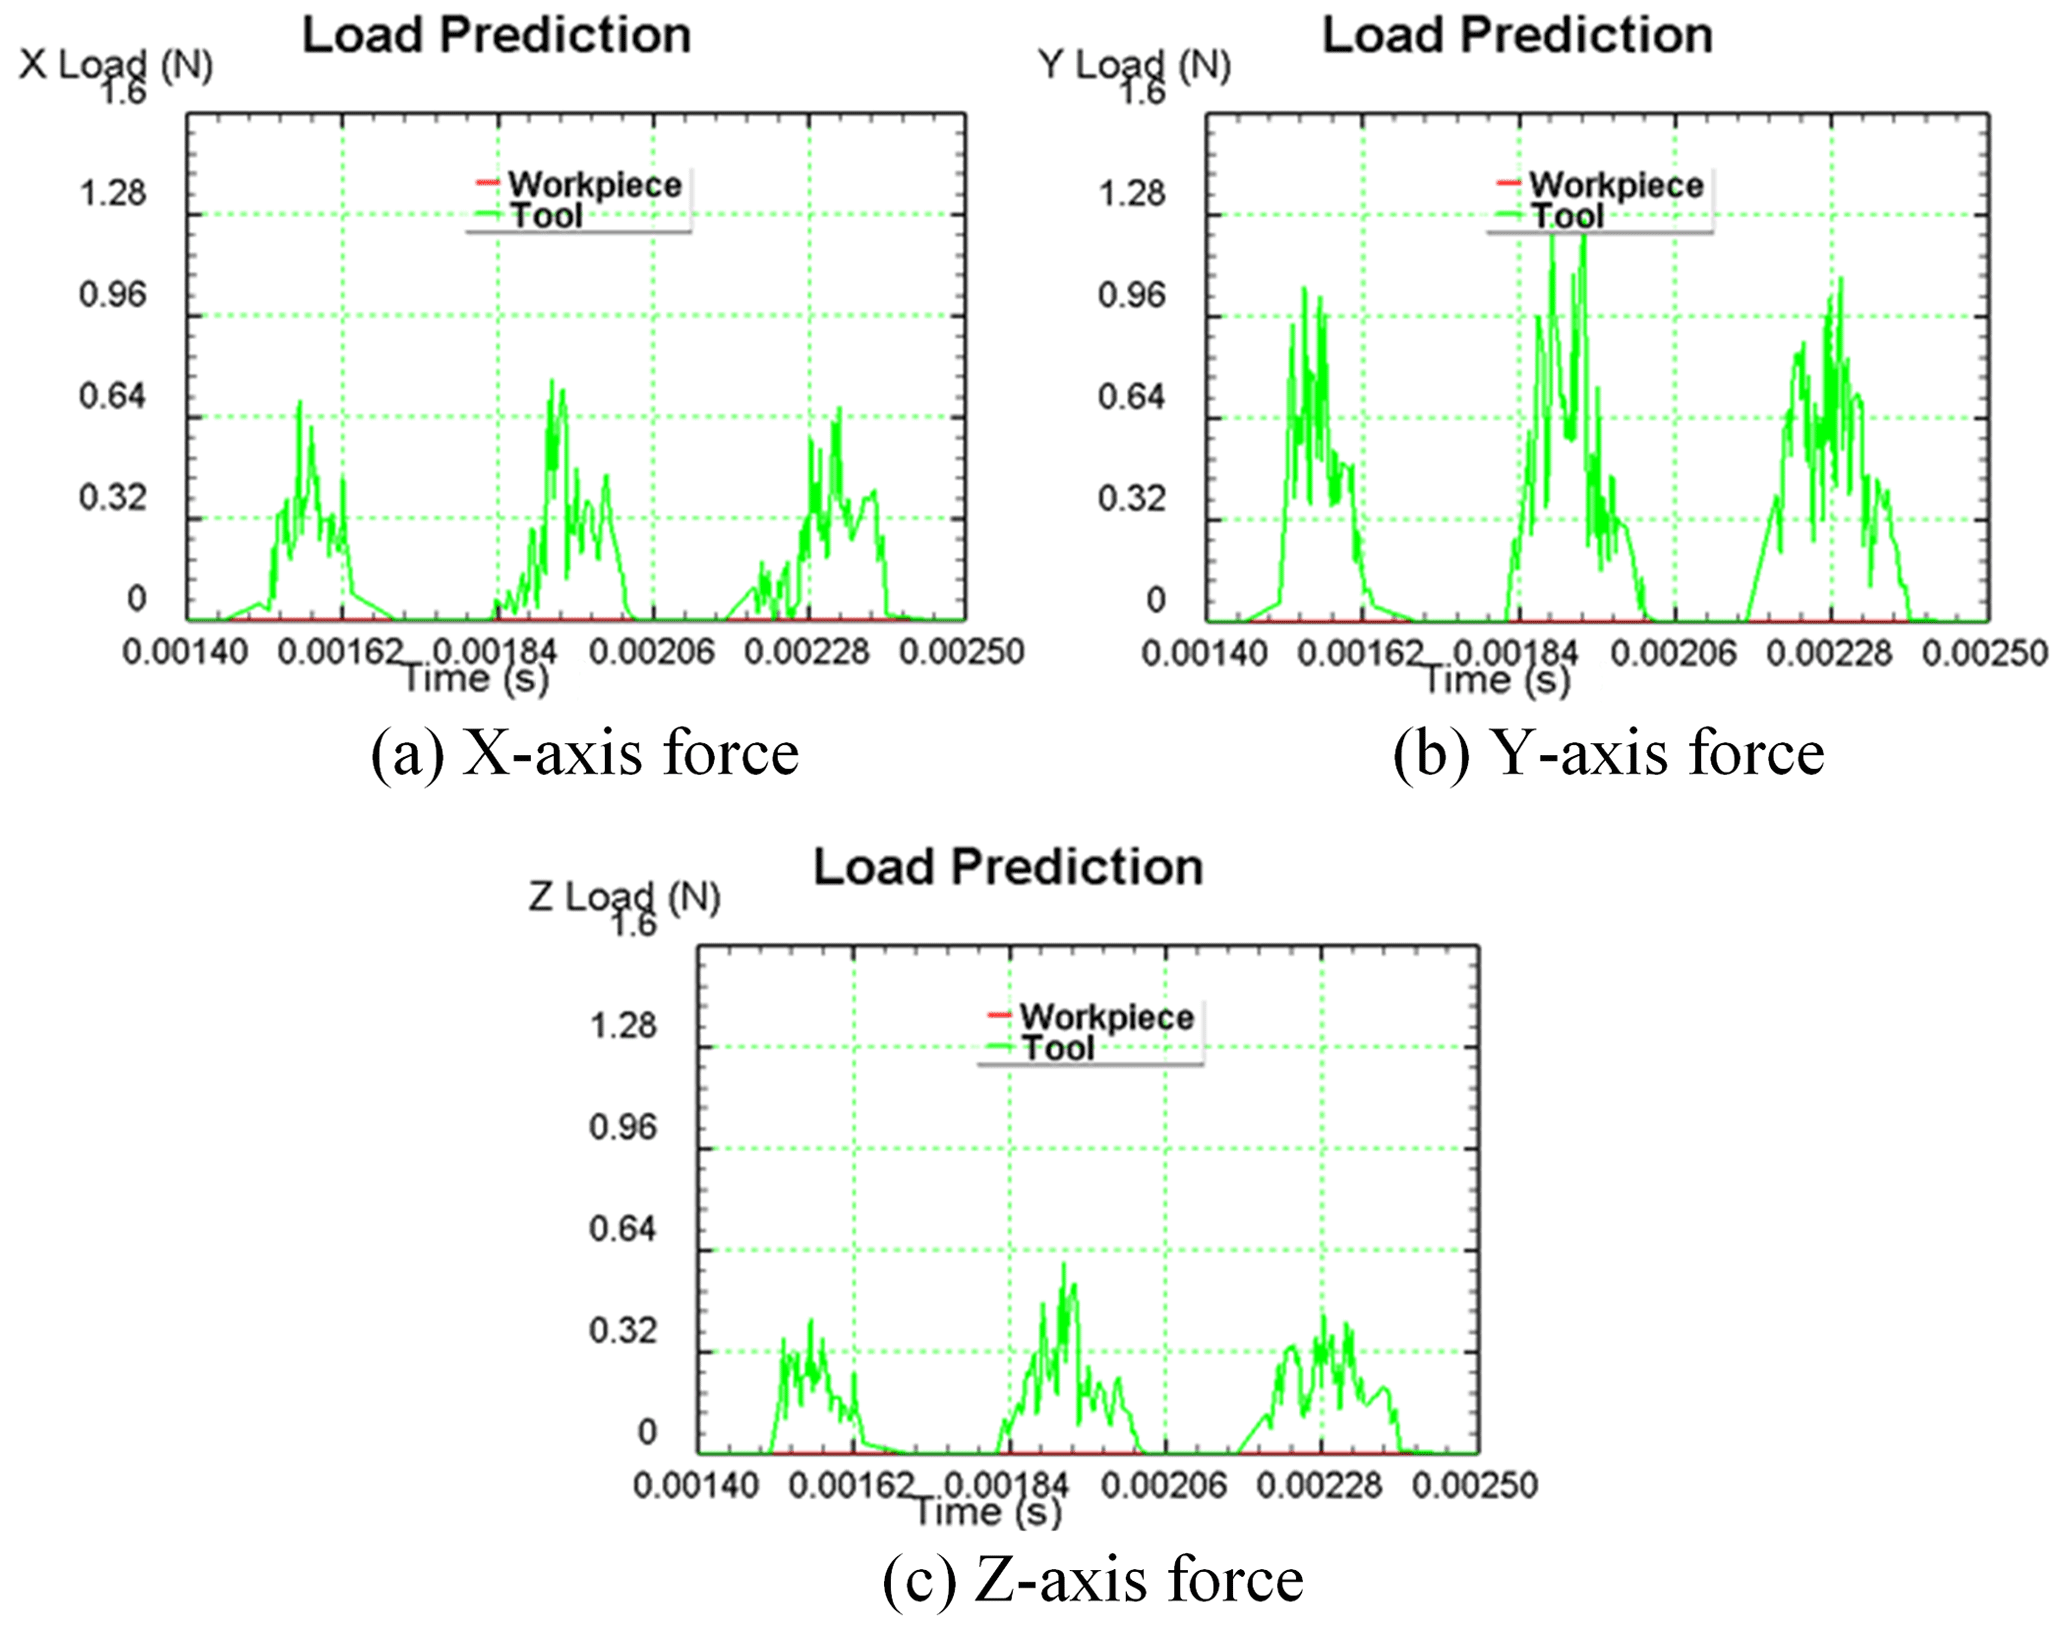
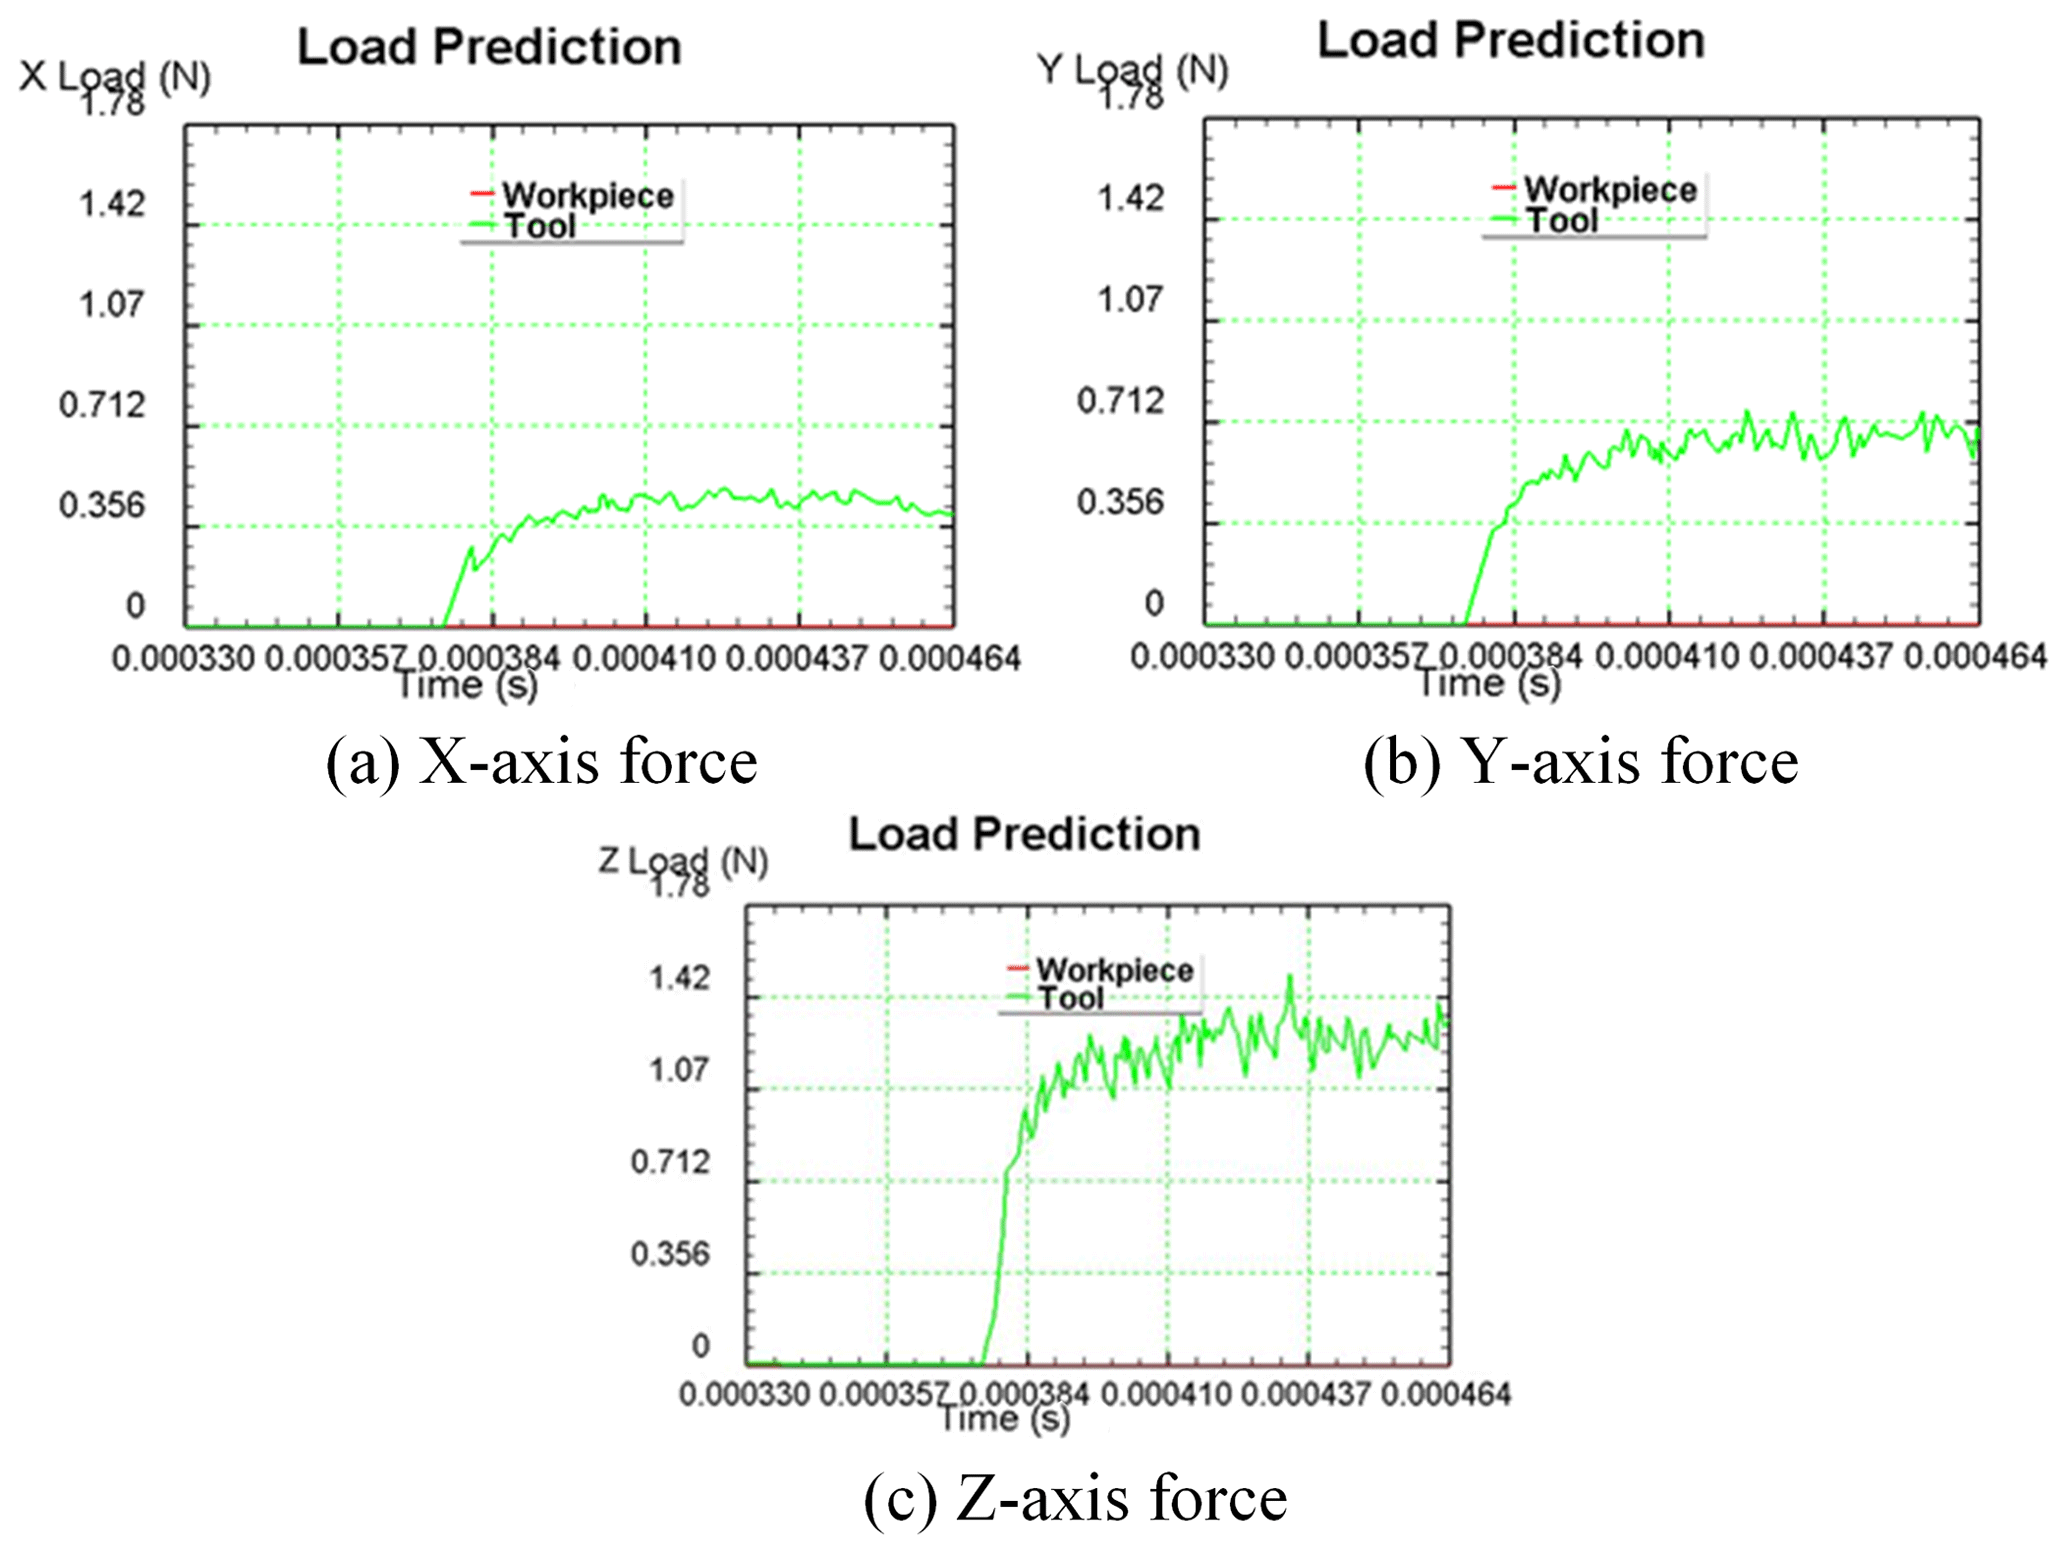
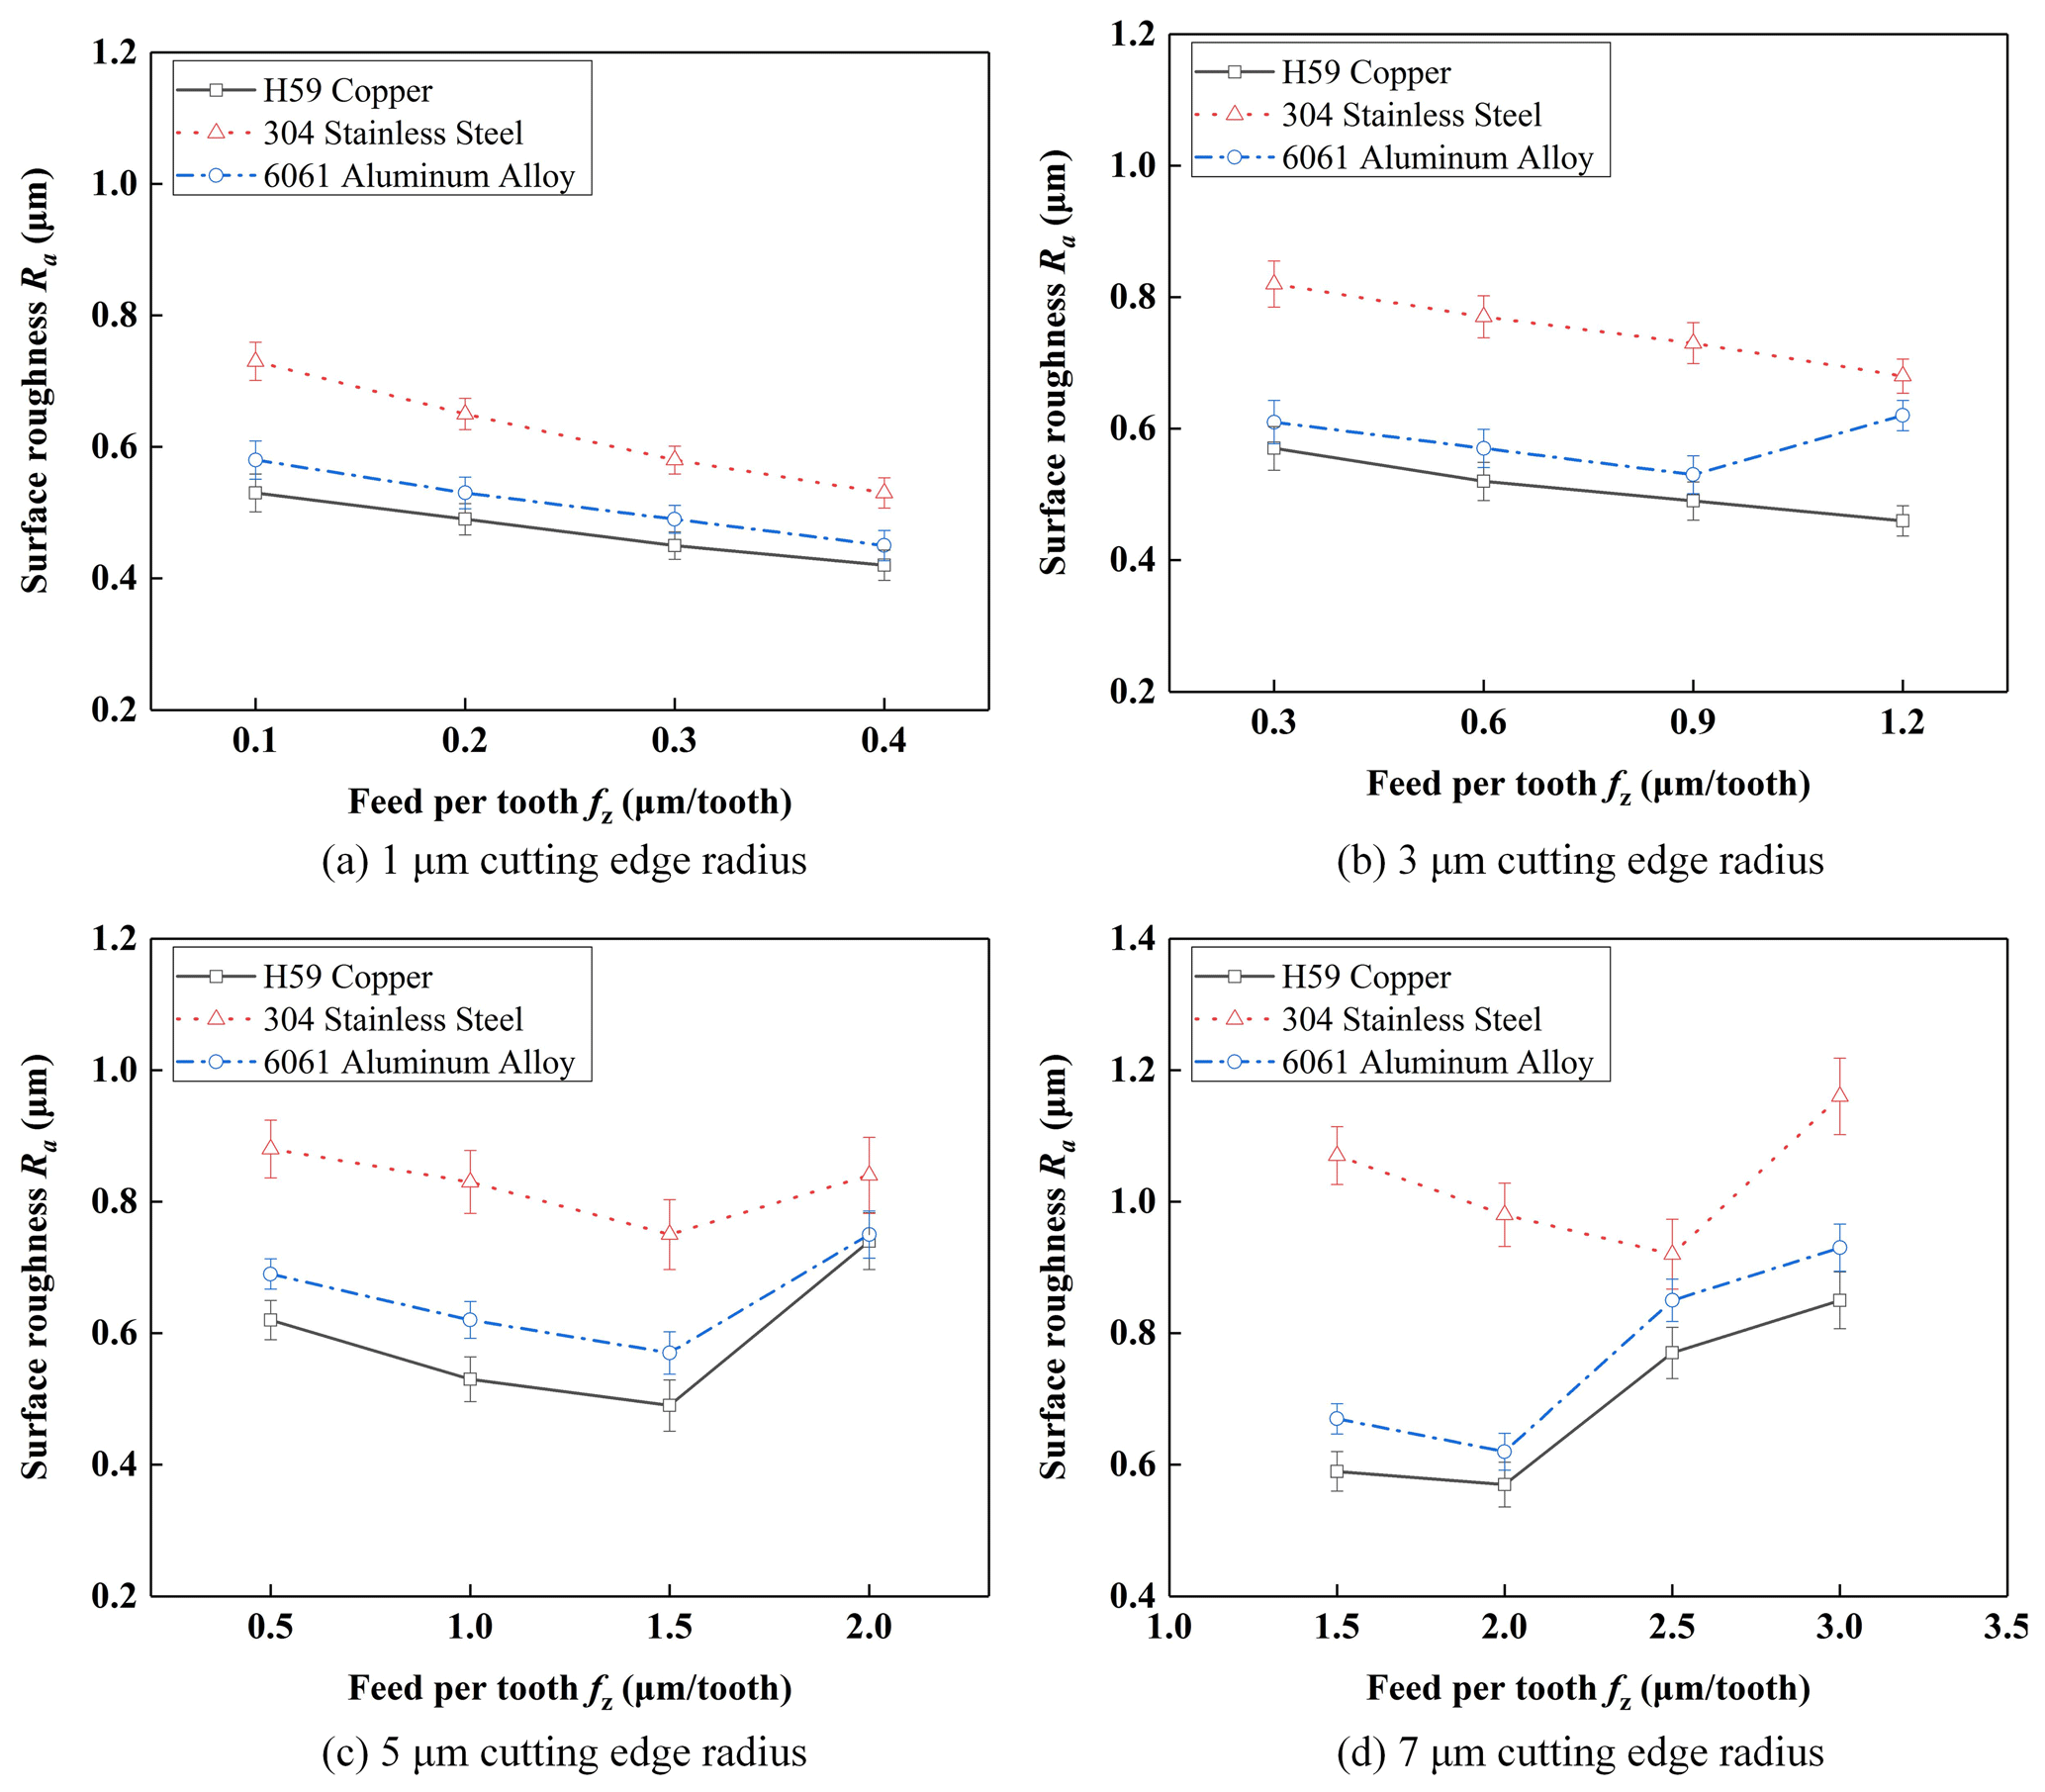
The simulated milling forces of peripheral cutting edge in the three directions are shown in Fig. 2. The numerical values of the milling forces in the three directions are exported by Deform-3D software, and then the milling resultant force F is calculated by Eq. (1).
The milling resultant force F of process no. 1 is shown in Fig. 3, and the milling resultant force F of process no. 2 is shown in Fig. 4.
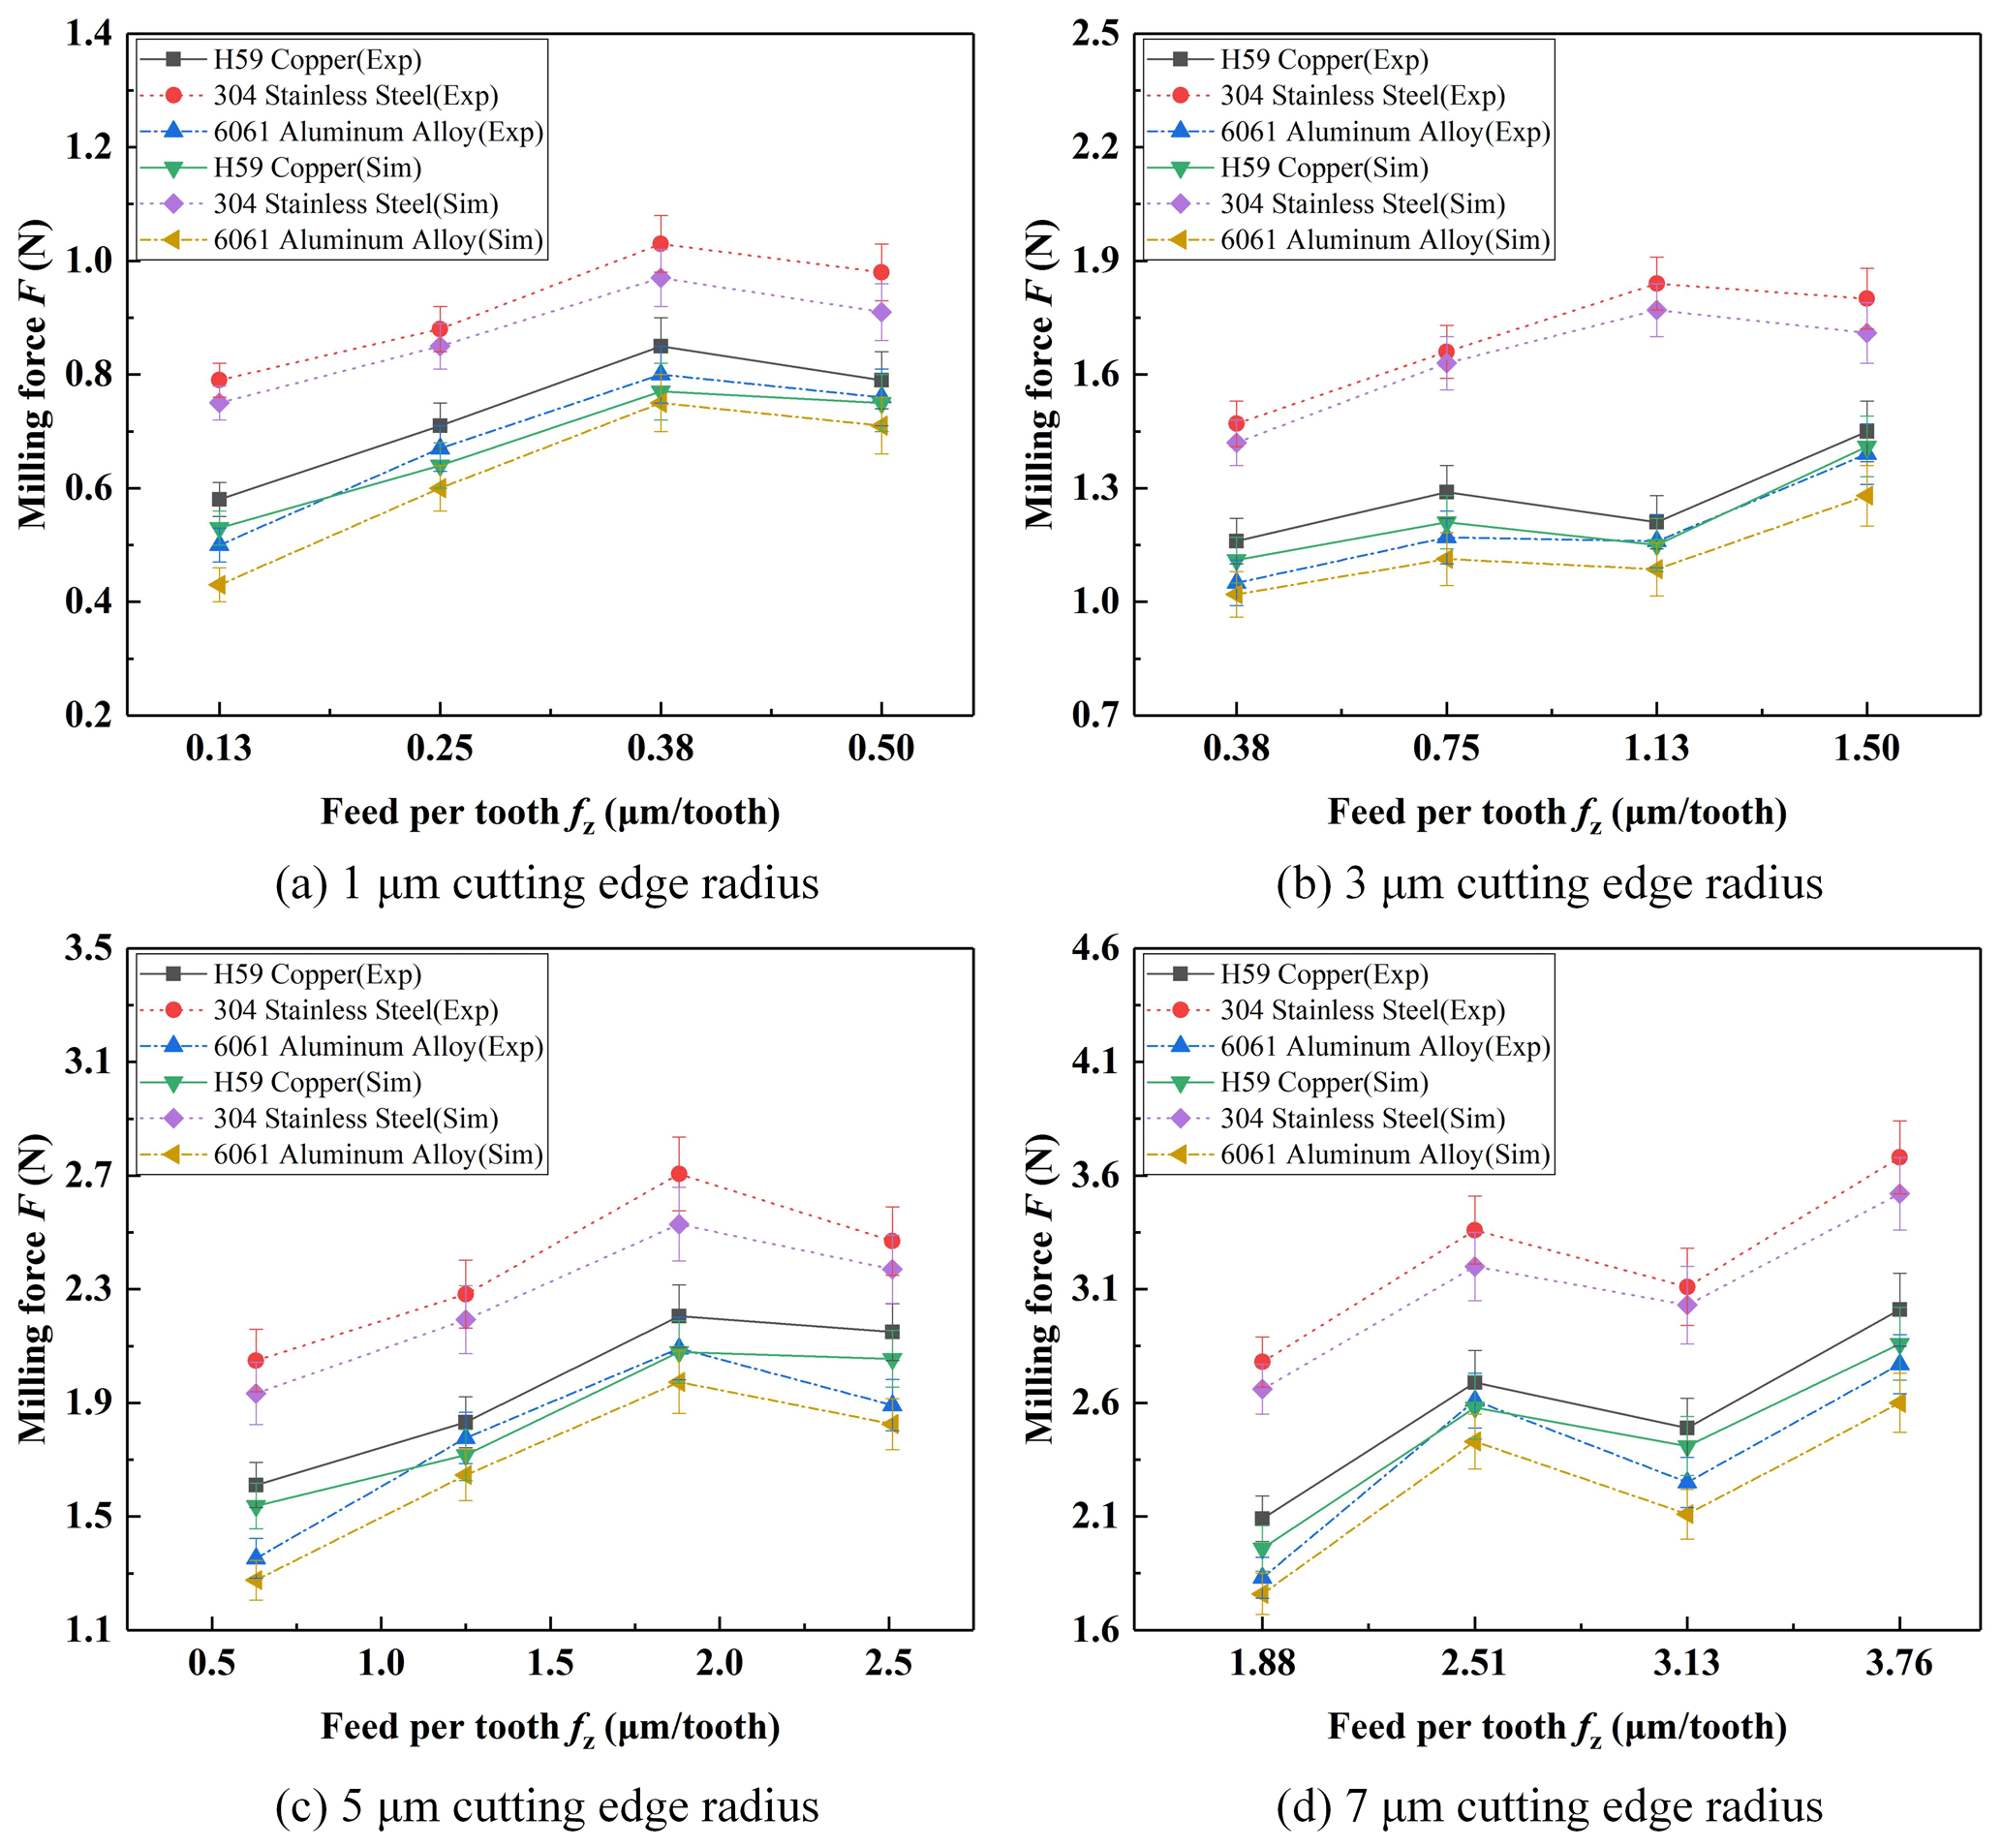
As shown in Fig. 3a, the milling force analysis for 6061 aluminum alloy material in micro end cutting when only the peripheral cutting edge is engaged can be found via process no. 1. The milling force presents a rising trend when feed per tooth fz increases from 0.1 to 0.3 µm, mainly because the cutting thickness has not obtained the minimum undeformed cutting thickness in that moment. Therefore, a continuous chip can not be generated. And the milling force increases due to the extrusion, friction, and plowing mechanism between the workpiece and the cutting edge. The milling force presents a downward trend when feed per tooth fz increases from 0.3 to 0.4 µm, mainly because the cutting thickness has obtained the minimum undeformed cutting thickness in that moment. Therefore, a continuous chip can be generated. And the milling force decreases due to the decrease of the plowing mechanism. Therefore, according to the changing trend of the cutting force, 6061 aluminum alloy material is used for the peripheral micro milling by process no. 1 when the radius of the edge circle is 1 µm, and the minimum undeformed cutting thickness is reached when the feed per tooth is 0.4 µm; the corresponding minimum undeformed cutting thickness is 0.4 µm.
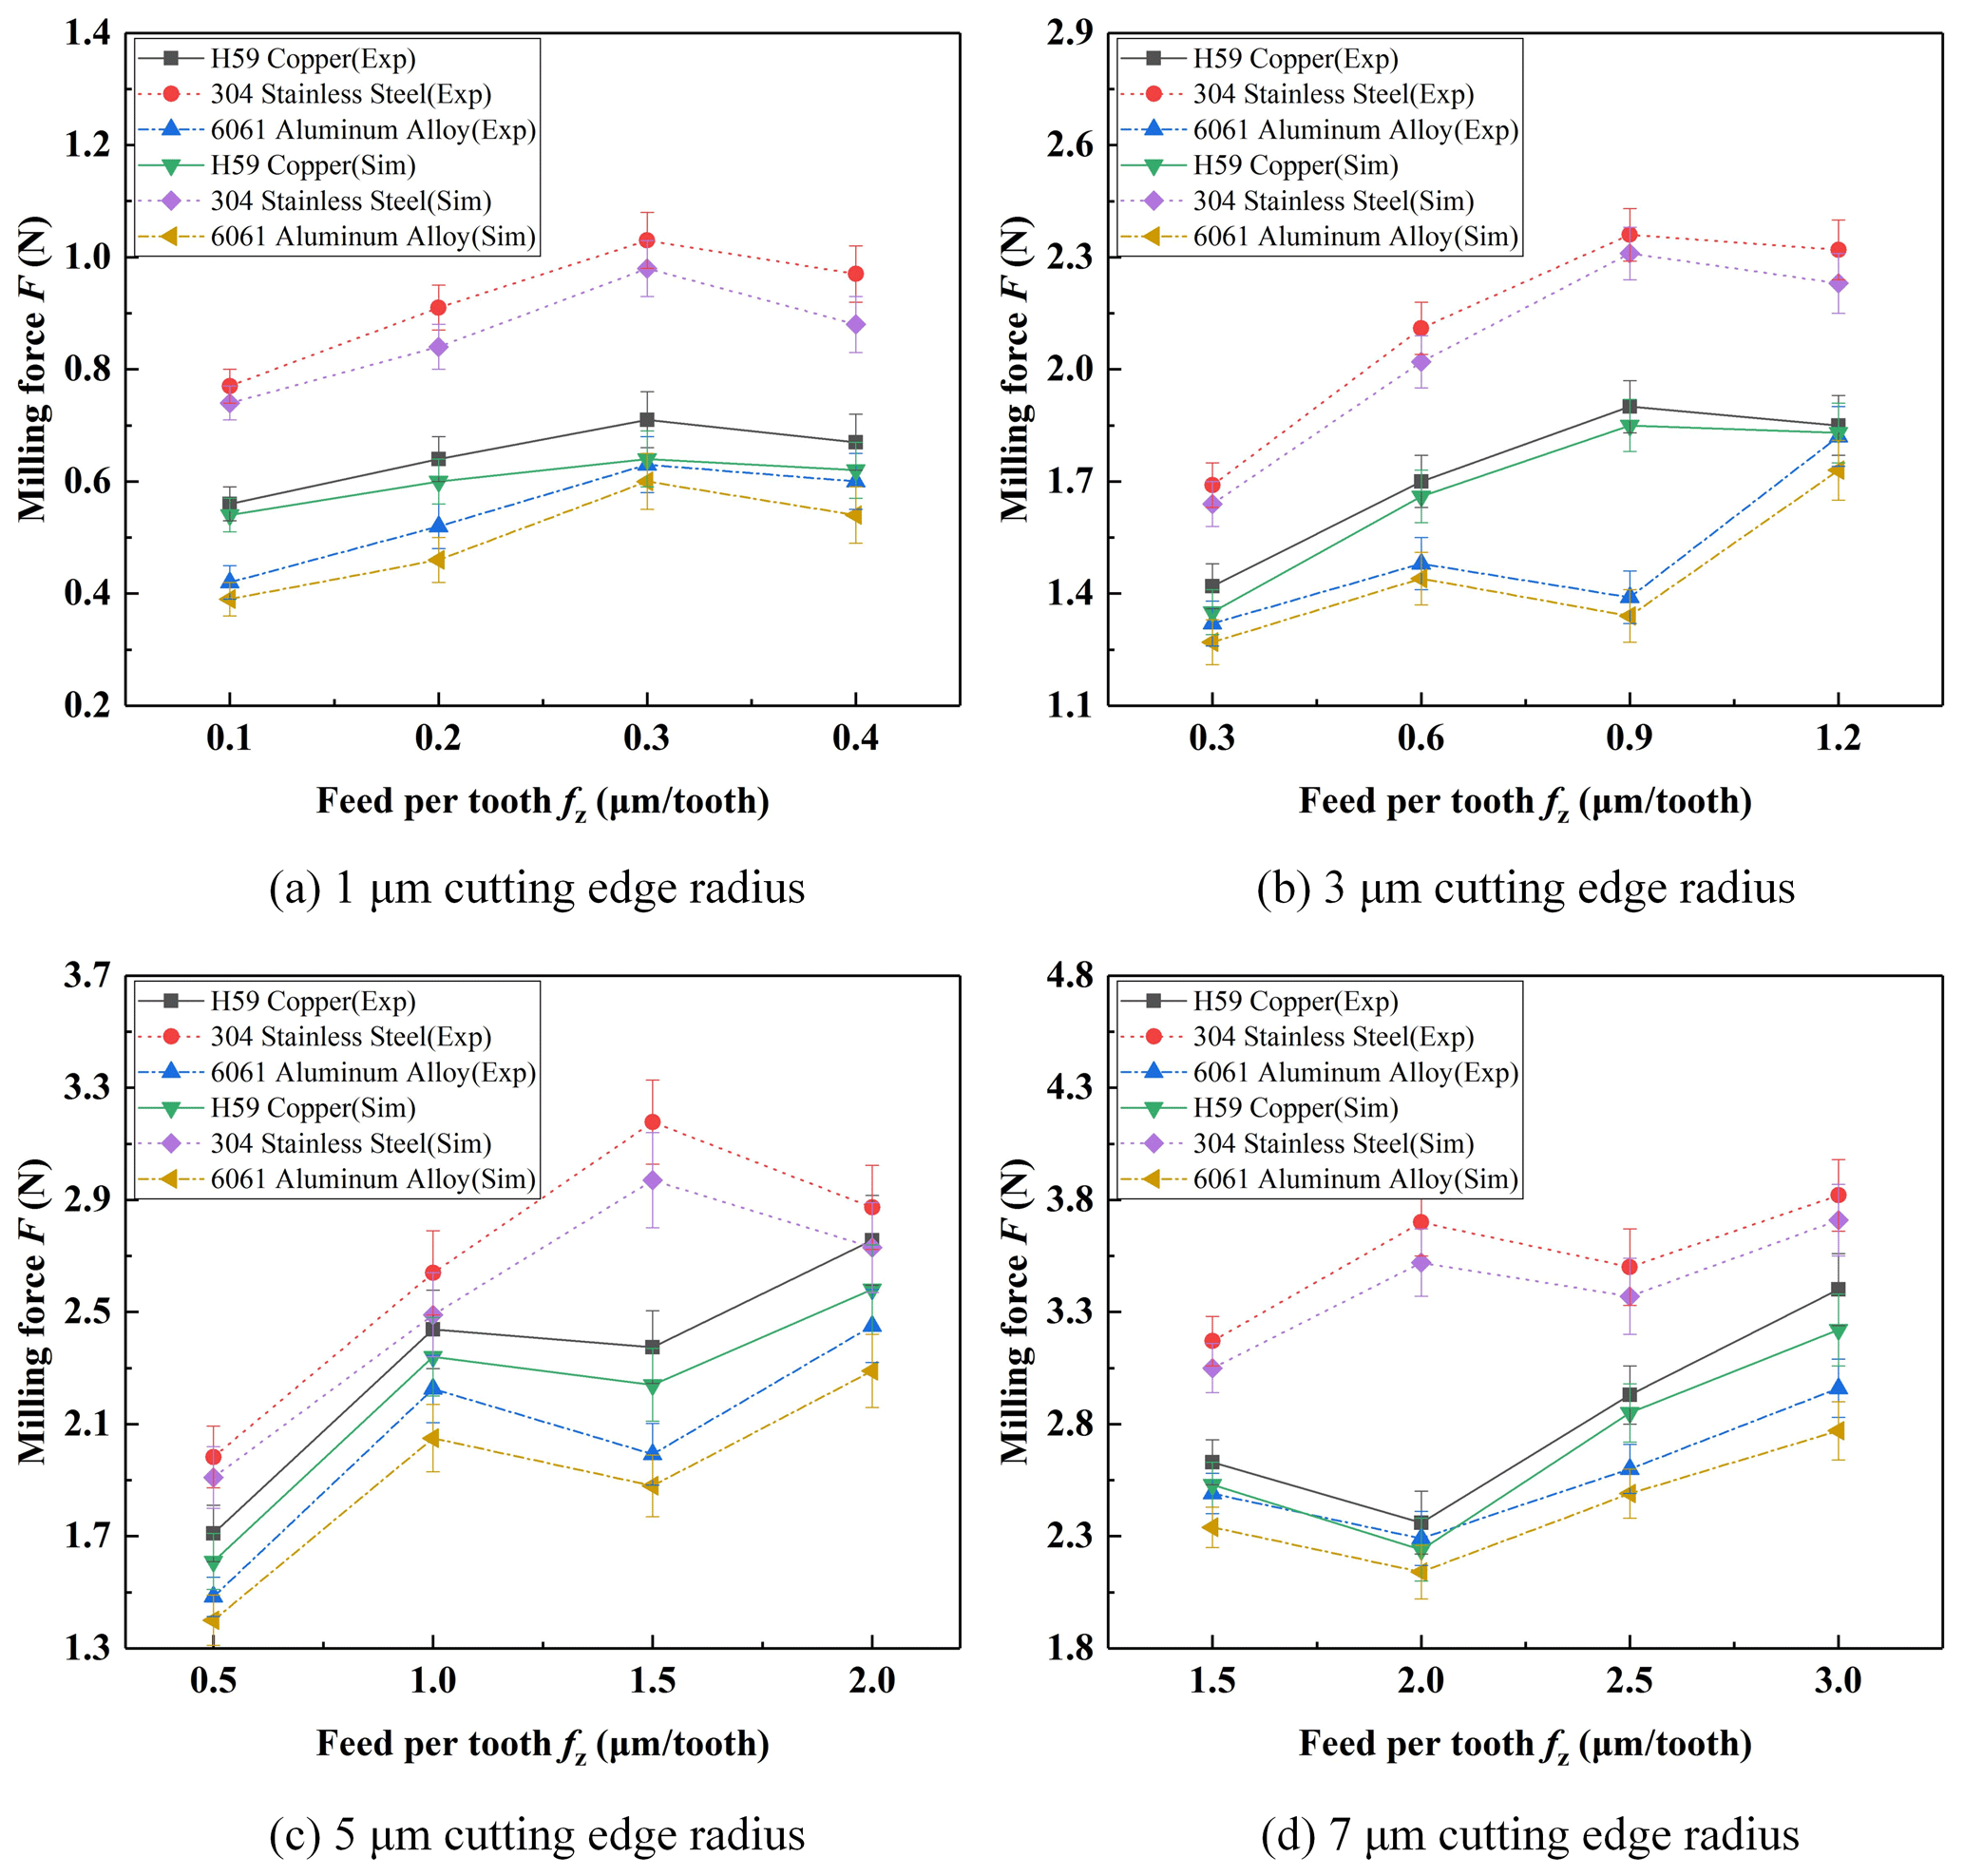
As shown in Fig. 3c, the milling force analysis for H59 copper material in micro end cutting when only the peripheral cutting edge is engaged can be found via process no. 1. The milling force presents a rising trend when feed per tooth fz increases from 0.5 to 1.0 µm, and the milling force presents a downward trend when feed per tooth fz increases from 1.0 to 1.5 µm. The reasons for this situation are consistent with Fig. 3a. However, the milling force presents an increasing trend again when the feed per tooth increases from 1.5 to 2.0 µm, mainly because with the increase of cutting parameters, the material removal rate increases per unit of time, leading to an increase in cutting force, which is consistent with the phenomenon of macro cutting (Li et al., 2020). Therefore, according to the changing trend of the cutting force, H59 copper material is used for the peripheral micro milling by process no. 1 when the radius of the edge circle is 5 µm, and the minimum undeformed cutting thickness is reached when the feed per tooth is 1.5 µm; the corresponding minimum undeformed cutting thickness is 1.5 µm.
Based on the above analysis methods, all simulation results of cutting force are analyzed and summarized, and all MUCT values are shown in Table 5.
According to the simulated results in Table 5, there is little difference between the MUCT values obtained by the chip morphology and the MUCT values obtained by the cutting force. In other words, both the chip morphology and the cutting force can be used to identify the MUCT values when only the peripheral cutting is engaged in micro end cutting. The MUCT values increase with the increase of the peripheral cutting edge radius. At the same time, there are some differences in the MUCT values of different workpiece materials, even though micro milling parameters remain invariant.
3.2 Micro end milling simulation of the end cutting edge
According to literature (Cheng et al., 2014), the axial depth of cut ap is the undeformed chip thickness for micro milling by the end cutting edge. In order to obtain a good surface quality, we also deem the critical cutting condition is satisfied when the chip is produced along the entire cutting edge. Similarly, the simulation results when only the end cutting edge is engaged are analyzed based on our previous analysis method, and all MUCT values are concluded and shown in Table 6 (Li et al., 2020).
The simulated cutting forces of the end cutting edge in the three directions are shown in Fig. 5. And the milling resultant force F is also calculated by Eq. (1). The milling resultant force F of the end cutting edge is shown in Fig. 6.
As shown in Fig. 6, the milling force F tends to increase with the increase of cutting parameters, which is inconsistent with the milling force result of the peripheral cutting edge. Therefore, the same method that was used in the analysis of the peripheral cutting edge of the cutting force cannot be used to determine the MUCT of the end cutting edge.

3.3 Discussion
As shown in Fig. 7, the peripheral edge is a spiral curve, while the end cutting edge is a straight line. In the cutting process, the peripheral edge presents a dynamic change of cutting in the workpiece and cutting out the workpiece when the cutter feeds along the direction of the radial. According to the change of cutting forces as shown in Fig. 2, it can be seen that the cutting forces generated are periodic. However, the end cutting edges are always in contact with the workpiece surface when the cutter feeds along the direction of the axis, so the cutting forces generated are not periodic and tend to a stable value, as shown in Fig. 5.
Therefore, the cutting mechanisms of the peripheral cutting edge and the end cutting edge are different, which needs to be studied separately. In the practical cutting process, it is of great significance to select different cutting parameters for different processes, such as axial feed and radial feed.
The surface roughness Ra of the machined surface is usually measured to recognize the MUCT value in micro end cutting experiments since it is very hard to monitor the chip during the micro milling process (Ng et al., 2006). At the same time, the milling forces in the cutting process are measured, and the reliability of the simulation is verified by comparing the experiment results with the simulation results.
4.1 Experiment
The three-axis micro milling machine tool 3A-S100 as shown in Fig. 8 is selected to conduct the micro end milling experiments. Workpiece materials are kept the same as that in simulations, but only the cutter with a 5 µm cutting edge radius is selected in the micro cutting experiment. The experiment parameters are also consistent with the simulations as shown in Tables 3 and 4.

The workpiece for the peripheral and end cutting experiment is planned as shown in Fig. 9.

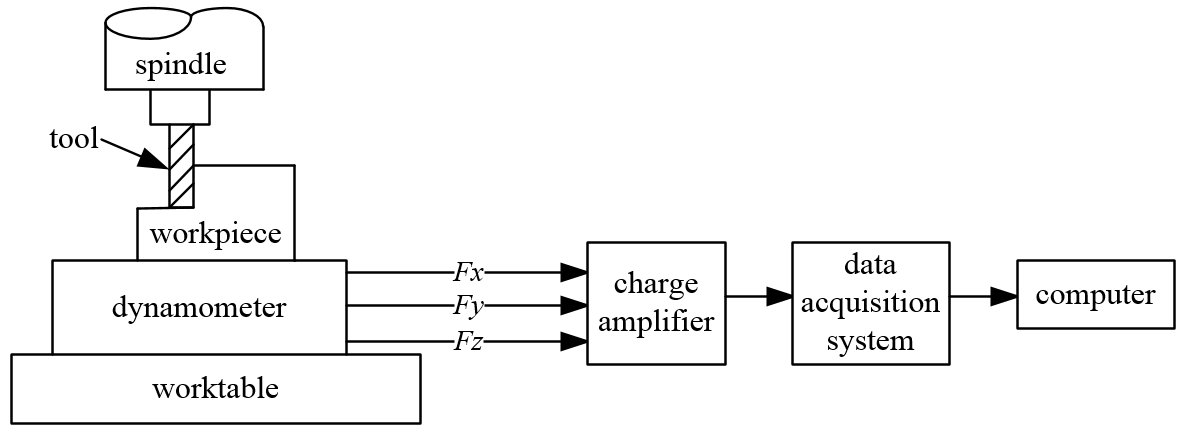
The Wyko NT9300 optical profilometer is selected to measure the surface roughness value, and each feature has been measured at least four times. Meanwhile, the average values of the measurements are calculated based on the four measurements and serve as the final measurement value. The Kistler dynamometer 9257B is used for the milling force measurement, which can simultaneously acquire the cutting forces in x, y, and z directions, with a resolution of 1 mN. A schematic diagram of the milling force measuring system is shown in Fig. 10. The lower part of the dynamometer is fixed on the work table of the machine tool, and then the workpiece is fixed on the upper part of the dynamometer.
4.2 Results
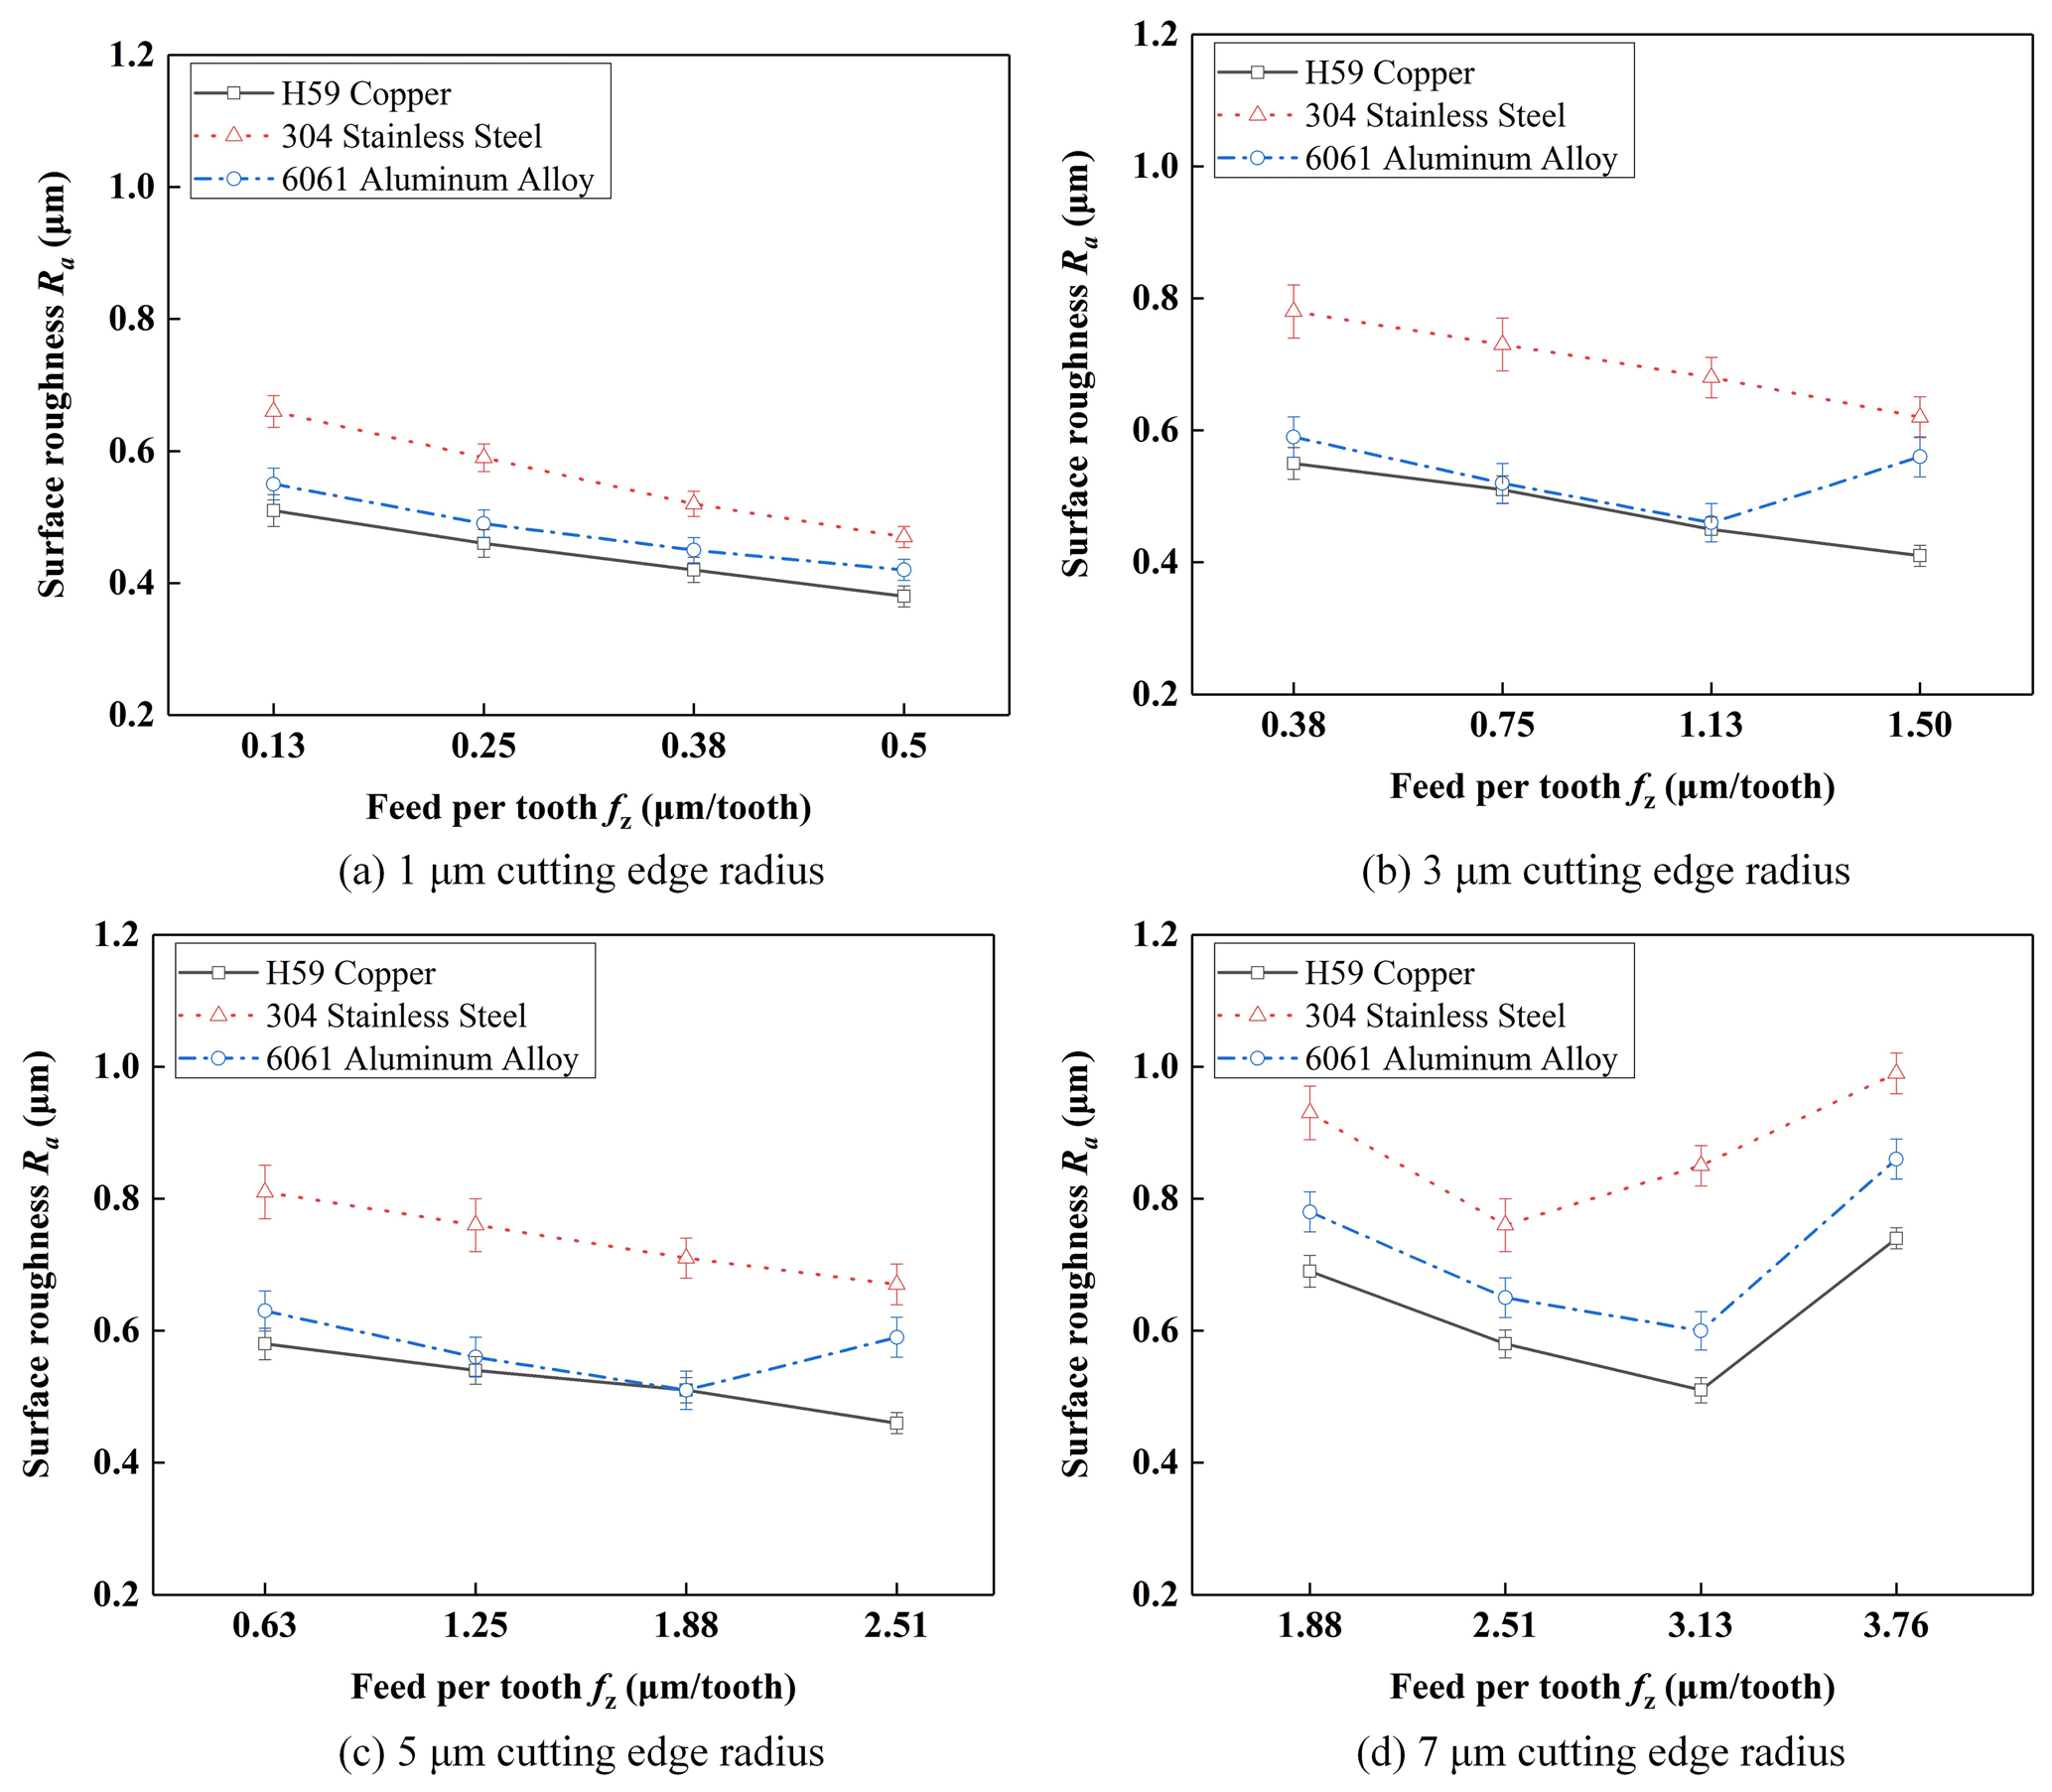
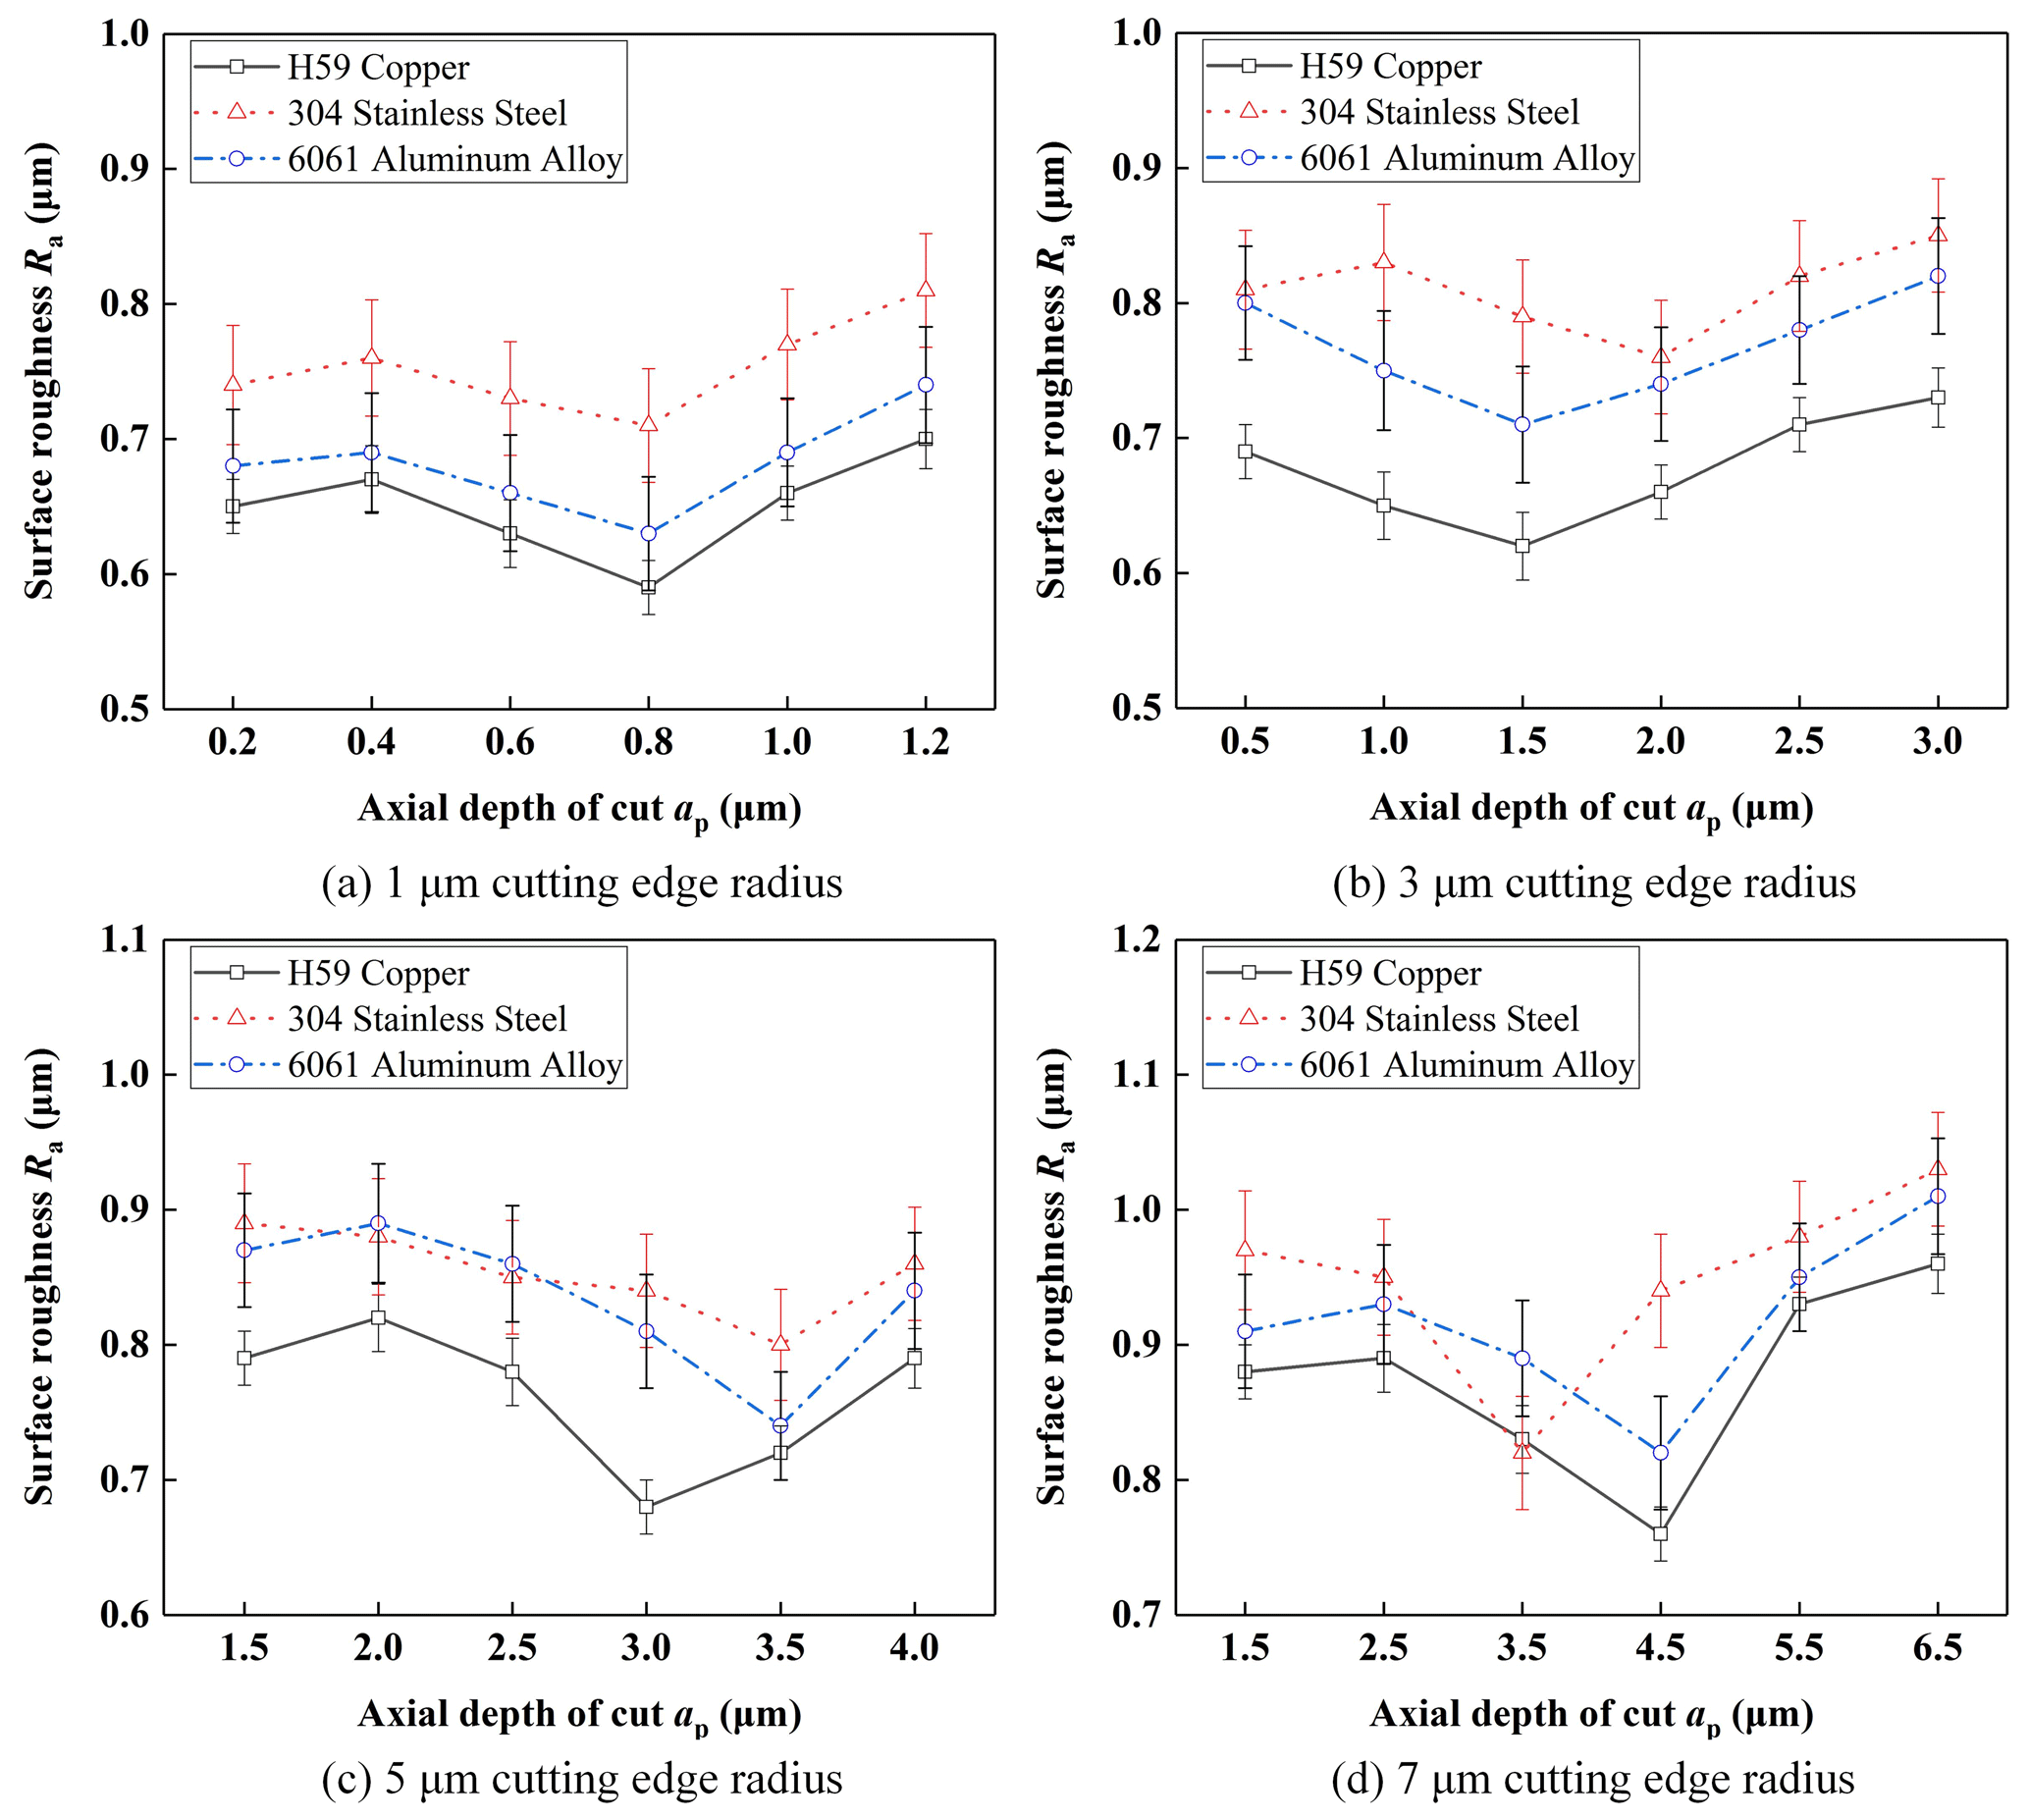
The experimental results of the surface roughness for the peripheral cutting edge via process no. 1 and no. 2 are shown in Figs. 11 and 12. The experimental results of the surface roughness for the end cutting edge are shown in Fig. 13.
From Fig. 11c, it is seen that all of the surface roughness values of the three materials reach the minimum at fz=1.5 µm z−1. This agrees with Eq. (2) in Li et al. (2020), which calculates the MUCT value to be about 1.5 µm for H59 copper, 304 stainless steel, and 6061 aluminum alloy via process no. 1. The surface roughness values of the three materials all show a tendency of decreasing first and then increasing. The elastic–plastic deformation of the workpiece material is transformed into shear deformation with the increase of the feed per tooth; the plowing mechanism and cutting force both decrease, so that the surface quality is improved.
From Fig. 12c, it is seen that the surface roughness values of the three materials reach the minimum= at fz=2.51, 2.51, and 1.88 µm z−1, respectively. This confirms Eq. (3) of Li et al. (2020) in which the MUCT value is about 2.0, 2.0, and 1.5 µm for H59 copper, 304 stainless steel, and 6061 aluminum alloy via process no. 2.
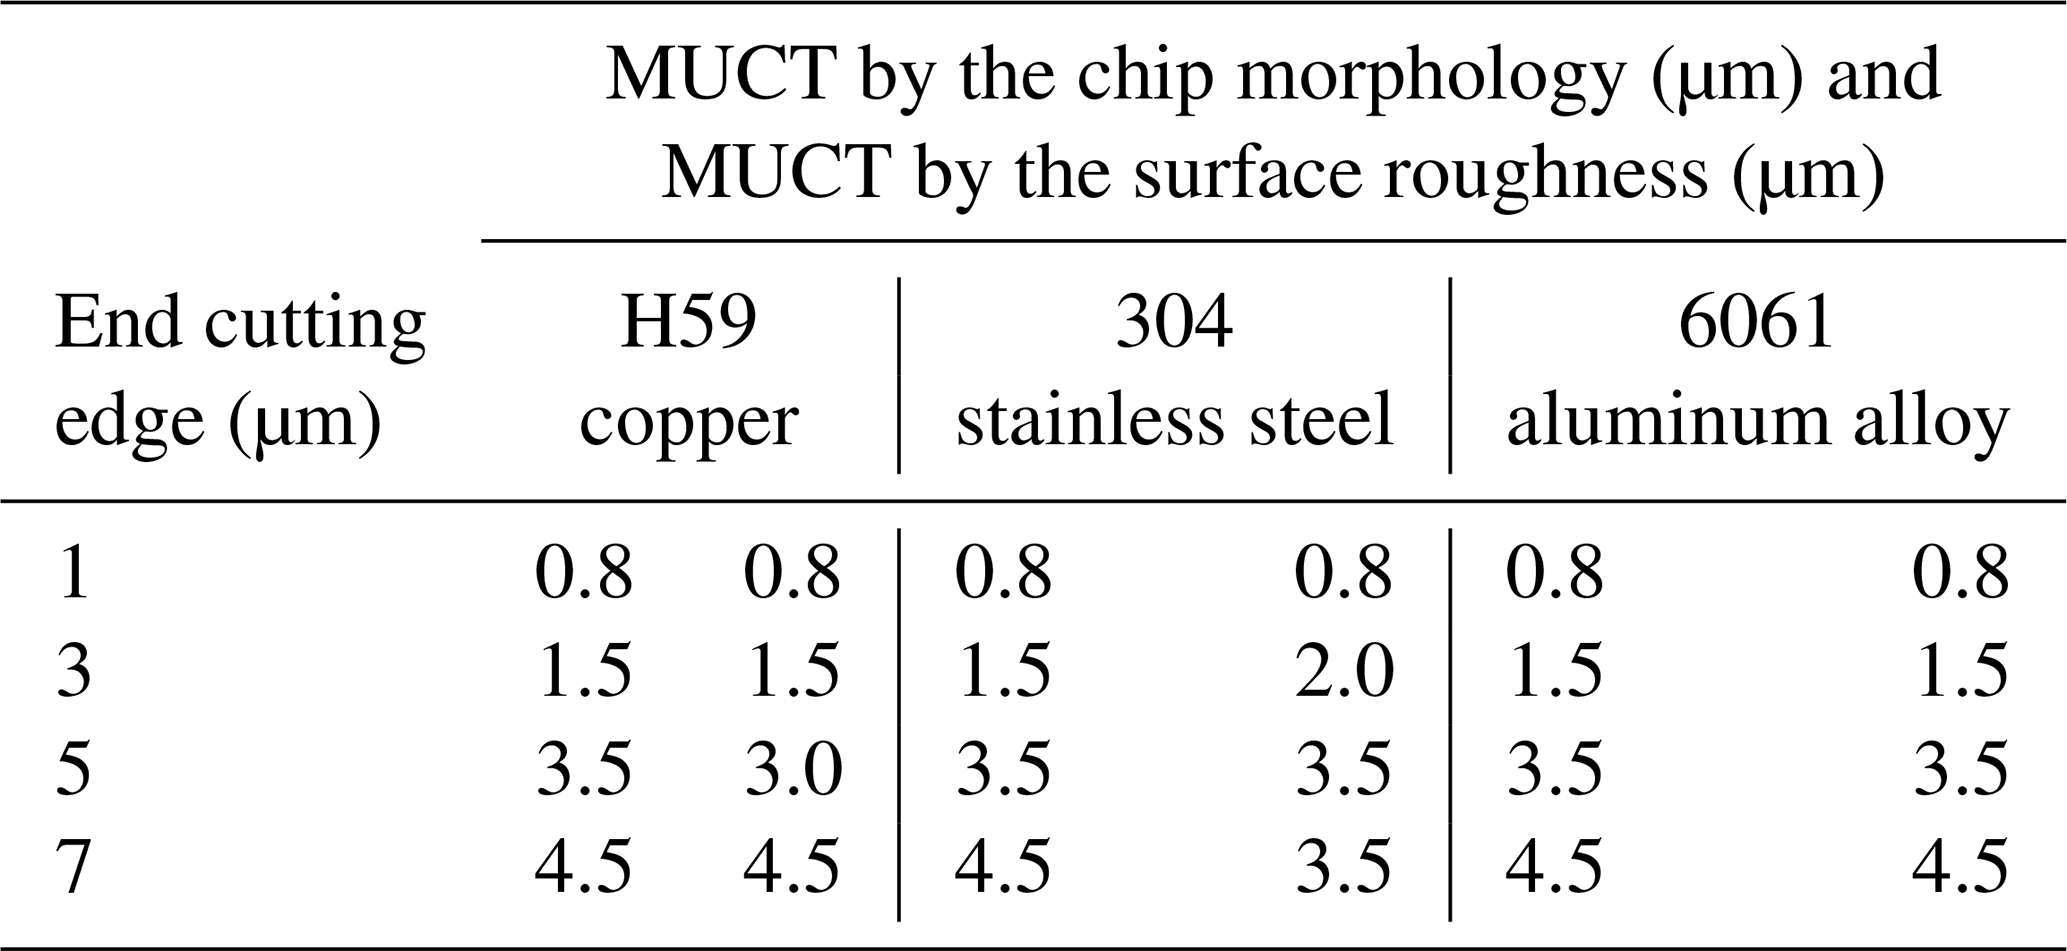
From Fig. 13c, it is seen that the surface roughness values of the three materials reach the minimum at ap=3.0, 3.5, and 3.5 µm, respectively; the MUCT value is about 3.0 µm for H59 copper, and the MUCT value is about 3.5 µm for 304 stainless steel and 6061 aluminum alloy.
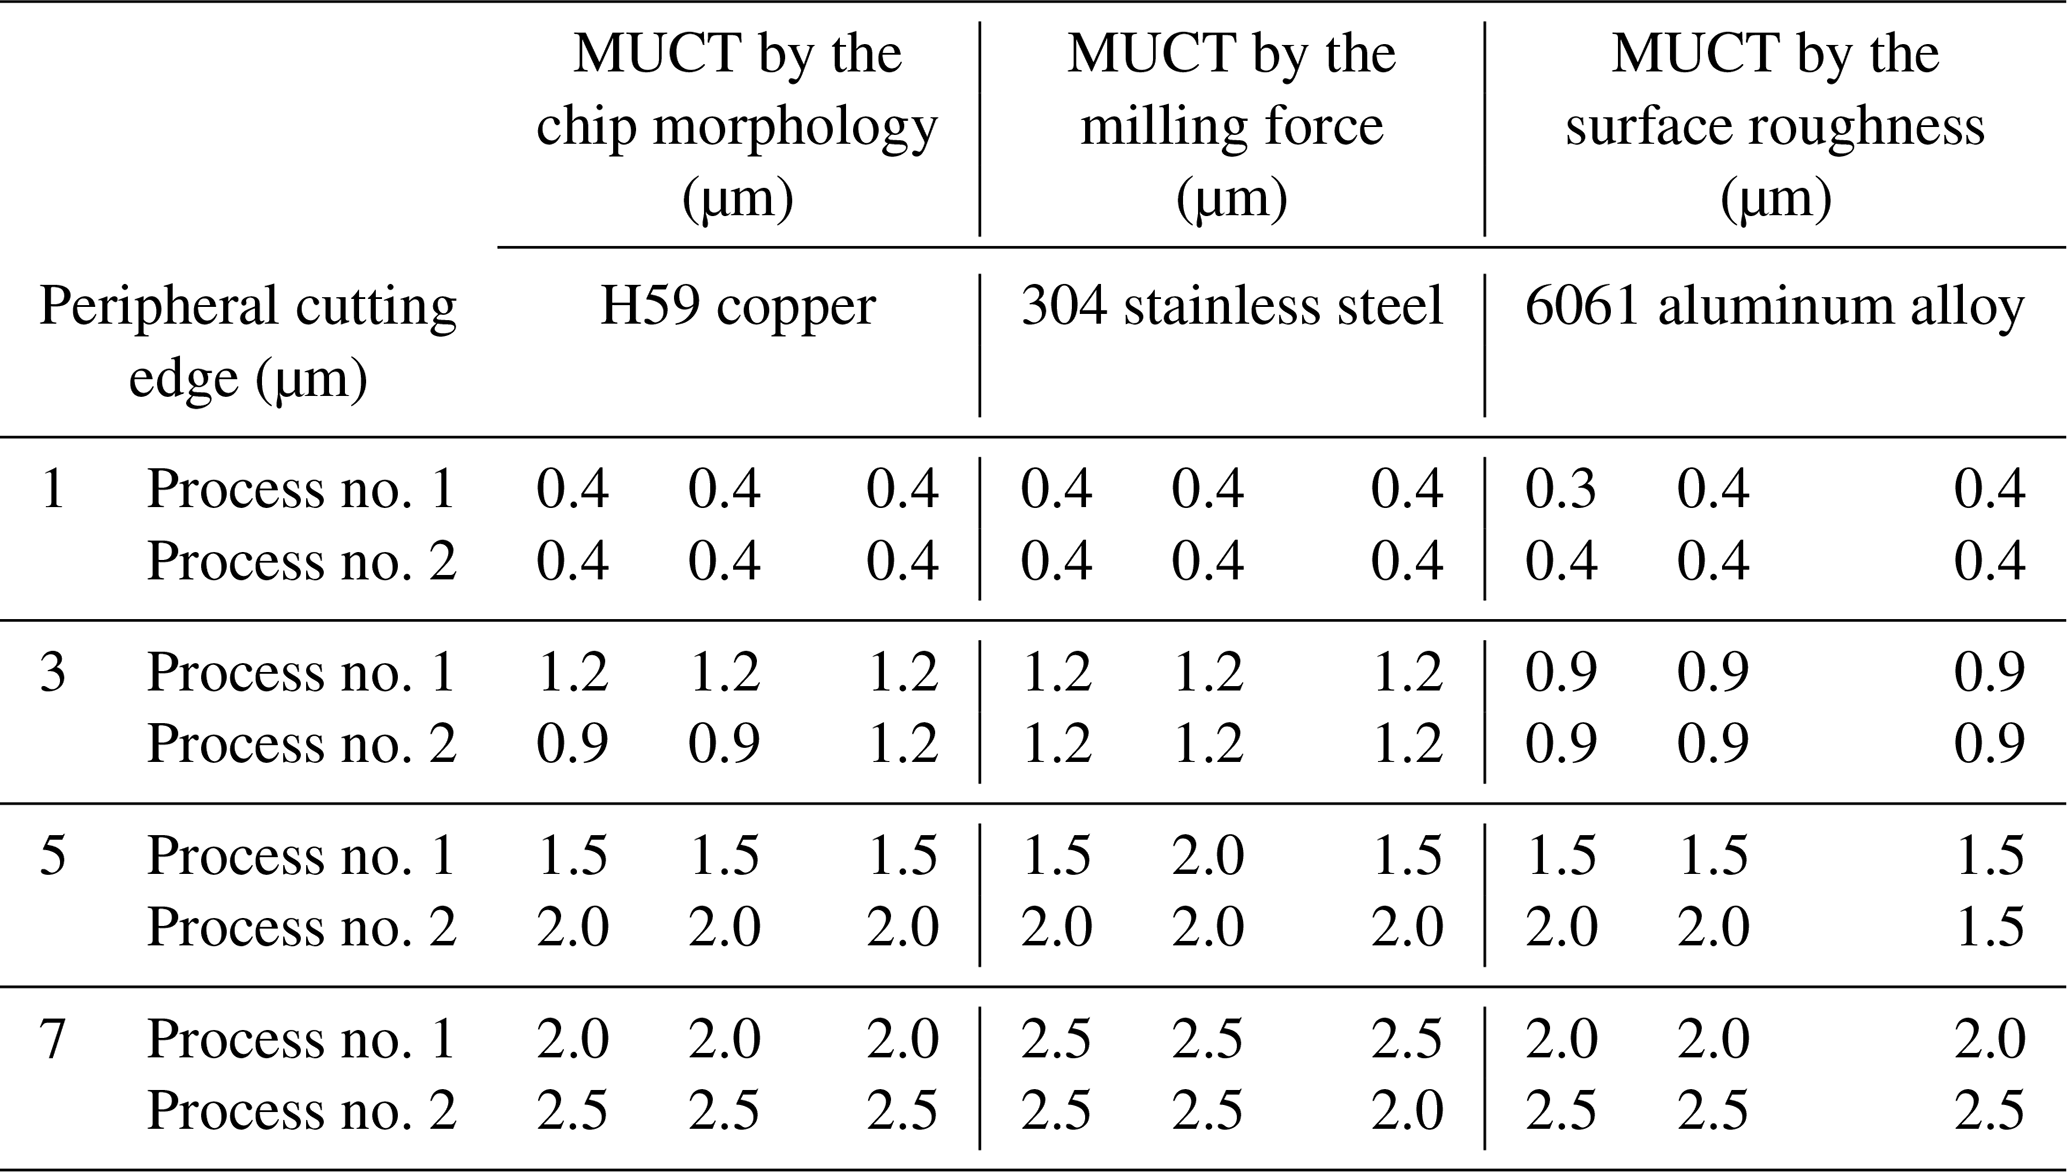
The experimental results from Figs. 11 to 13 are analyzed with the same method, and all MUCT values are summarized, as shown in Tables 7 and 8.
The experimental results of the milling force for the peripheral cutting edge via process no. 1 and no. 2 are shown in Figs. 3 and 4. The experimental results of the milling force for the end cutting edge are shown in Fig. 6.
According to the comparison between the cutting force obtained by the simulation and the cutting force obtained by the experiment, it is found that the trend of the two kinds of cutting force is basically in accordance with each other; only the amplitude shows a slight difference. The cutting force obtained by the experiment is slightly larger than that obtained by the simulation, and the error of cutting force may be caused by the vibration, noise of the machine tool, data processing, and other reasons. This is an acceptable error, so we can determine that the simulation model and results are reliable and can be used to guide the selection of parameters in actual cutting experiment.
4.3 Discussion
From Tables 7 and 8, it is seen that there are no obvious differences between the simulation MUCT value and the experimental one. In other word, two kinds of method based on the chip morphology and surface roughness for simulations and experiments can be used to judge the MUCT value. Meanwhile, the cutting force can also be used to judge the MUCT for the peripheral cutting edge. Since the selected feed engagements are discontinuous, there may be some error in the MUCT. Therefore, the MUCT is only an approximate value, not an accurate one. At the same time, in the process of simulation and experiment, there will be some accidental errors in the extraction of experiment results, which may affect the final results. According to the final comparison results, it can be seen that the overall results of the experiment and simulation are relatively consistent. The simulation results have high reliability, and their errors are within an acceptable range.
Based on simulated and experimental results, the MUCT values of peripheral cutting edge have little difference for the three kinds of workpiece materials. This conclusion is in accordance with the results from previous literature (Ramos et al., 2012). Meanwhile, the MUCT values of end cutting edge remain almost unchanged for the three kinds of workpiece materials.
According to the simulation results, there is an obvious difference of the MUCT value between the peripheral cutting edge and the end cutting edge. The MUCT value can be fitted by MATLAB software using the quadratic polynomial (−0.0187 0.4050 re+ 0.0488) based on the four kinds of cutting edge radii experimental results in Table 7 via the peripheral cutting edge process no. 1, and the quadratic polynomial (−0.0187 0.5050 re− 0.1012) can be fitted via the peripheral cutting edge process no. 2. It can be seen that the MUCT produced by the two processes is not significantly different. However, the MUCT value can be fitted by the quadratic polynomial (0.0188 0.5050 re+ 0.1613) based on the four kinds of cutting edge radii experimental results in Table 8 by the end cutting edge.
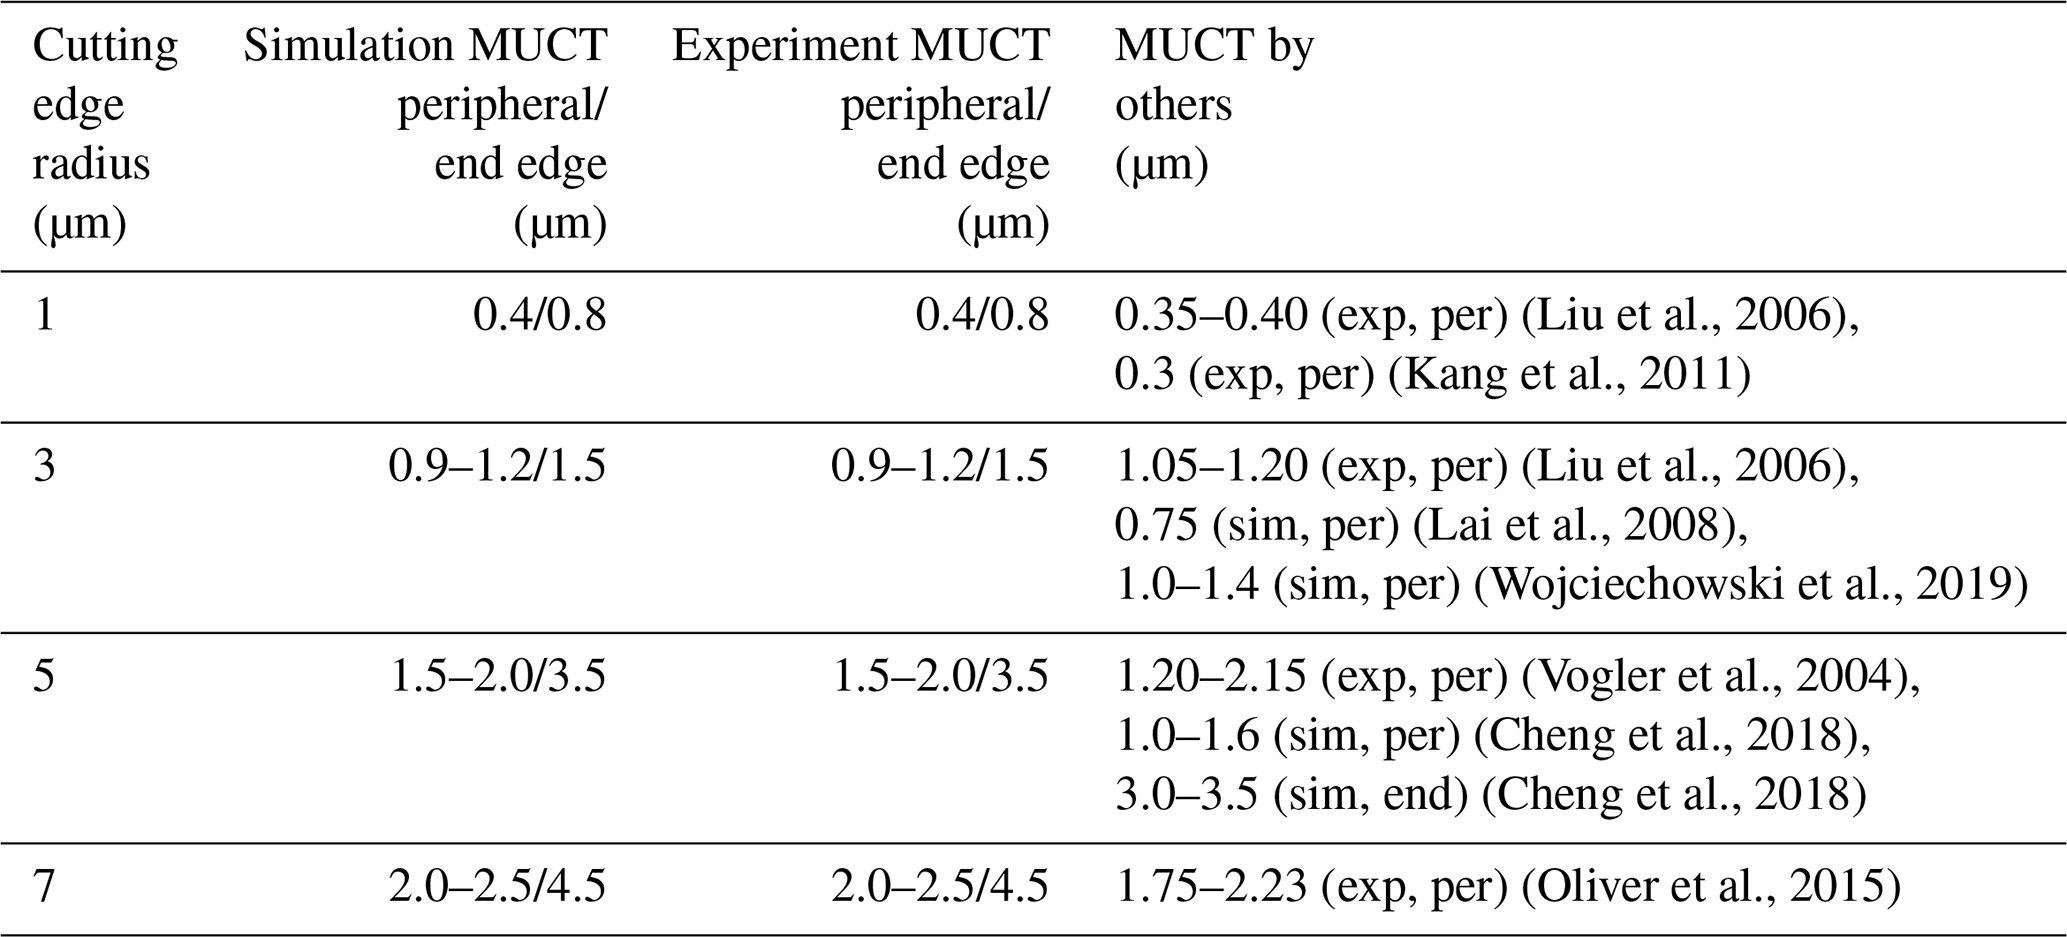
Table 9 provides a summary of the discrepancy between the simulation, experiments, and other articles' results regarding MUCT values. As shown in Table 9, there are certain differences between the MUCT values of different cutting edge radii in this study and other studies, which are mainly caused by different workpiece materials, tool geometric parameters, and cutting parameters used in the experiment or simulation. Obviously, this difference is normal and difficult to avoid.
However, according to the results in Table 9, it can be found that the value of MUCT in this study is not significantly different from that in other studies. Therefore, the method of obtaining MUCT in this study is reliable.
In the process of micro end milling, both peripheral and end cutting edges are engaged in cutting. Therefore, it is very necessary to study the cutting effects of peripheral and end cutting edges separately. According to the finite element simulation analyses and micro end milling experiments considering the cutting edge radius of the cutter and the material of the workpiece, some conclusions can be drawn in following.
The MUCT value is different for the peripheral and end cutting edges even though all micro end milling conditions remain uniform. The MUCT value increases with the increase of the cutting edge radius, regardless of the workpiece materials. The MUCT value is about −0.0187 0.4050 re+ 0.0488 for the process of micro end milling via the peripheral cutting edge process no. 1 only, and the MUCT value is about −0.0187 0.5050 re− 0.1012 for process no. 2. The MUCT value is about 0.0188 0.5050 re+ 0.1613 for the process of micro end milling by using the end cutting edge only.
The properties of the workpiece material have some influence on the MUCT value of peripheral cutting edges. However, they have little influence on the MUCT value of end cutting edges. According to the cutting force results, the greater the elastic modulus and shear modulus of the workpiece material, the greater the cutting force will be, and the higher the MUCT value will be, when the cutting parameters and the cutting edge radius are the same. Due to the differences in the structure of the peripheral cutting edge and the end cutting edge, the same conclusion was not made in the simulation and experimental results of the end cutting edge.
The change of the cutting force is a critical point for the size effect. Experiment and simulation results show that for the cutting force on the peripheral cutting edge and the end cutting edge in the cutting process, with the increase of feed per tooth, the tendency of the cutting force is not the same. Therefore, the peripheral cutting edge and the end cutting edge should be studied separately. The cutting force, chip morphology, and surface roughness values can be used to determine the MUCT of the peripheral cutting edge. However, the cutting force cannot be used to determine the MUCT of the end cutting edge. It is necessary to choose different methods to accurately identify the MUCT value.
It is necessary to select a variety of cutting edge radii and workpiece materials to study the size effect further. The experimental results show that the simulation model is reliable and can be used to guide the cutting experiment to select the cutting parameters and cutting processes.
All data are given in the paper. No further data sets were used.
YL and GZ conducted the simulations and experiments, XC and YL proposed the research methods, and HL and XC analyzed the simulation and experimental results. YL and GZ wrote the manuscript.
The authors declare that they have no conflict of interest.
This work was supported by the National Key Research and Development Program of China (grant no. 2018YFB2001400) and the SDUT & Zibo City Integration Development Project (grant no. 2017ZBXC189).
This paper was edited by Jeong Hoon Ko and reviewed by three anonymous referees.
Aramcharoen, A. and Mativenga, P. T.: Size effect and tool geometry in micromilling of tool steel, Precis. Eng., 3, 402–407, 2009.
Cheng, X., Wei, X. T., and Yang, X. H.: Unified criterion for brittle–ductile transition in mechanical microcutting of brittle materials, J. Manuf. Sci. Eng., 136, 051013–051011, 2014.
Cheng, X., Liu, J. C., and Zheng, G. M.: Study of micro-cutting fundamentals for peripheral and end cutting edges in micro-end-milling, J. Micromech. Microeng., 28, 015011, https://doi.org/10.1088/1361-6439/aa9a73, 2018.
Cui, X. B., Yan, K., and Guo, J. X.: Bio-inspired fabrication, mechanical characterization and cutting performance evaluation of Al2O3 TiC micro-nano-composite ceramic with varying microscopic surfaces, Ceram. Int., 45, 8286–8299, 2019.
Cui, X. B., Guo, Y. H., and Guo, J. X.: Performance analysis of laser-induced biomimetic ceramic tools in interrupted cutting, Int. J. Mech. Sci., 177, 105589, https://doi.org/10.1016/j.ijmecsci.2020.105589, 2020a.
Cui, X. B., Guo, Y. H., and Guo, J. X.: Bio-inspired design of cleaner interrupted turning and its effects on specific cutting energy and harmful gas emission, J. Clean. Prod., 271, 122354, https://doi.org/10.1016/j.jclepro.2020.122354, 2020b.
Dornfeld, D., Min, S., and Takeuchi, Y.: Recent advances in mechanical micromachining, CIRP. Ann. Manuf. Technol., 55, 745–768, 2006.
Kang, I. S., Kim, J. S., and Seo, Y. W.: Investigation of cutting force behaviour considering the effect of cutting edge radius in the micro-scale milling of AISI 1045 steel Proc. Inst. Mech. Eng. Pt. B, 225, 163–171, 2011.
Lai, X., Li, H., and Ni, J.: Modelling andanalysis of microscale milling considering size effect, micro cutter edge radius and minimum chip thickness, Int. J. Mach. Tools. Manuf., 48, 1–14, 2008.
Li, Y., Cheng, X., and Ling, S. Y.: Study of milling process basics for the biocompatible PEEK material, Mater. Res. Express., 7, 015412, https://doi.org/10.1088/2053-1591/ab6a5a, 2020.
Li, Y., Cheng, X., and Ling, S. Y.: Study on micro cutting fundamentals considering the cutting edge radius and the workpiece material in micro end milling, Proc. IMechE. Pt. E, 235, 93–102, 2021.
Liu, X., Devor, R. E., and Kapoor, S. G.: An analytical model for the prediction of minimum chip thickness in micromachining J. Manuf. Sci. Eng., 128, 474–481, 2006.
Ng, C. K., Melkote, S. N., and Rahman, M.: Experimental study of micro- and nano-scale cutting of aluminum 7075-T6, Int. J. Mach. Tools. Manuf., 46, 929–936, 2006.
Oliveira, F. B., Rodrigues, A. R., and Coelho, R. T.: Size effect and minimum chip thickness in micromilling, Int. J. Mach. Tools. Manuf., 89, 39–54, 2015.
Ramos, A. C., Autenrieth, H., and Strauß, T.: Characterization of the transition from ploughing to cutting in micro machining and evaluation of the minimum thickness of cut, J. Mater. Process. Technol., 212, 594–600, 2012.
Vipindas, K., Anand, K. N., and Mathew, J.: Effect of cutting edge radius on micro end milling: force analysis, surface roughness, and chip formation, Int. J. Adv. Manuf. Technol., 97, 711–722, 2018.
Vogler, M. P., Devor, R. E., and Kapoor, S. G.: On the modeling and analysis of machining performance in micro-endmilling, Part I: surface generation, J. Manuf. Sci. Eng., 126, 685–694, 2004.
Wojciechowski, S., Matuszak, M., and Powałka, B.: Prediction of cutting forces during micro end milling considering chip thickness accumulation, Int. J. Mach. Tools Manuf., 147, 103466, https://doi.org/10.1016/j.ijmachtools.2019.103466, 2019.
Wu, X., Li, L., and He, N.: Investigation on the ploughing force in microcutting considering the cutting edge radius, Int. J. Adv. Manuf. Technol., 86, 2441–2447, 2016.