the Creative Commons Attribution 4.0 License.
the Creative Commons Attribution 4.0 License.
 | 26 Mar 2021
Structural optimization of a new type of lever-assisted gear reducer based on a genetic algorithm
Zeyu Wang
Yuan Song
Xianjie Shan
Dongming Gan
Gear reducers are critical for speed and torque transmissions between motors and manipulators. With the development of robotic research, many new requirements, such as low speed and heavy load, have been proposed for the design of gear reducers used in the joints. To meet these challenges, here, we present the design of a new gear reducer based on a spherical motion sub-lever drive mechanism. Our lever-based gear reducer can transmit the speed and torque from the input shaft to the output shaft through a fixed-axis gear train transmission, lever transmission, and internal translational gear transmission. Compared with traditional gear reducers, our lever-based reducer has stronger load capacities and is suitable for low-speed and heavy-load scenarios. The design parameters of the lever drive mechanism were optimized via finite element analysis and a genetic algorithm, and the assembly of the lever drive mechanism was further simplified. We found the dimensions of the lever are critical for improving the overall performance of this reducer. In addition, the transmission ability of this reducer was demonstrated by a physical prototype. This reducer will find many applications in robotic joints, cranes, and mine hoists.
- Article
(5067 KB) - Full-text XML
- BibTeX
- EndNote


The gear reducer is a very important part of many machines, such as industrial robots and automatic transmissions. A precise and efficient reducer is one of the key technologies of robotic research. Currently, robots are being used widely in logistics, aerospace, industrial production, medical care, and the like. Therefore, the role of the reducer is becoming more and more important. To achieve good comprehensive performance under high-load conditions is one of the research focuses in the field of reducers. In order for the reducer to have high efficiency under high load, the structural design of the reducer is very important.
In terms of structure, we investigated the previous research, selected the a suitable structure for the reducer, and then applied it to the reducer after adjustment. Pang et al. (2011) introduced a transmission mode of the internal translational gear transmission, derived the transmission ratio of the mechanism based on its schematic diagram, designed an internal translational gear reduction with three parallelogram mechanisms based on this transmission method, and designed the man–machine interactive CAD system. Zhang et al. (2015) established an elastic dynamic model of a planetary gear reducer with a small tooth difference. Modal analysis was performed on the obtained model. The rationality of the model was verified by comparison with theoretical calculations. This paper analyzes the transmission principle and structural characteristics of the star gear reducer, which provides a basic model for the subsequent design of the reducer and a theoretical basis for the performance optimization work. We combined the internal translational gear transmission and small tooth difference model proposed by Pang et al. (2011) and Zhang et al. (2015) to design the output structure of the reducer. Lever transmission can achieve the ability of high efficiency with high loading. A lever transmission mechanism is designed in this paper to drive the output mechanism of the reducer. A lever transmission mechanism can change a large driving force into a small driving force and convert a bearing with a large radius into a spherical surface with a small radius. There is no high-speed rotation between the lever, gear, and frame, and only a slight change can be found in the inclination. The longer the lever is, the smaller the change in inclination becomes. The theoretical relative sliding speed is the sine of the dip multiplied by the radius of the sphere, and thus, it is very small. In addition, the spherical motion pair involves surface contact, so the load-carrying capacity is stronger than the rolling line contact. In order to obtain a better performance of the reducer, the structure of the lever in the reducer is taken as the analysis object. The objective function for optimum design is built up with the key parameters of the lever, such as stress, torque, and deflection.
A genetic algorithm has a unique advantage in the optimization. There are many applications of genetic algorithms in the field of multi-objective optimization. Ghosh et al. (2019) conducted the modeling and optimization of surface roughness based on a genetic algorithm for keyway milling. The input parameters were the spindle speed, feed rate, and cutting depth, and the output parameter was the surface roughness. Rezaie et al. (2019) used a genetic algorithm to optimize the heat recovery steam generator (HRSG) for a combined cycle power plant. The optimized variables of the algorithm included the sheet tube size and the steam flow rate. The optimized target parameters were the pressure at the gas turbine outlet and the finned tube metal temperature. Aggestam and Nielsen (2019) conducted multi-objective optimization through the genetic algorithm. The input parameters were the track pad stiffness and the sleeper spacing. Kumar and Jha (2019) used genetic algorithms to perform multi-objective optimization of a vortex finder, with the Euler number and collection efficiency as the target performance parameters. Liu et al. (2019) used the four size parameters of the drone as the input parameters of the genetic algorithm and the ratio of the lift coefficient and the drag coefficient as the target performance parameters. Sanusi and Mokheimer (2019) used a genetic algorithm to optimize the hydrogen production process and proposed a more energy-saving and more economic hydrogen production method. In order to achieve a good performance, the key parameters of the lever in the reducer proposed in this paper can also be optimized based on a genetic algorithm. Shen et al. (2021) have carried on the optimization of the lever structure. And we need to analyze the lever structure in the reducer to optimize the design.
Overall, this research has the following contributions:
-
In order to improve the load capacity of reducer at low speed, an output mechanism is designed.
-
In order to enhance the bearing capacity of key transmission components under high load, a lever mechanism is designed. Then, a new lever reducer with a large bearing/load capacity and compact structure is proposed.
-
An algorithm is developed based on a genetic algorithm to optimize the key dimensions of the lever, determined with high efficiency to ensure that the reducer has the best load-bearing capacity.
The article is organized as follows. In Sect. 2, The structure of the reducer is proposed. The parameters that need to be optimized are determined. In Sect. 3, we performed the analysis and simulations of the lever. In Sect. 4, we calculated the required data and developed the optimization algorithm by setting the variable ranges based on the size of a physical prototype. In Sect. 5, we analyzed the optimization results and present the conclusions.
2.1 Research object
The research object of this study is the lever drive mechanism in the reducer. An exploded view of the overall structure is shown in Fig. 1.
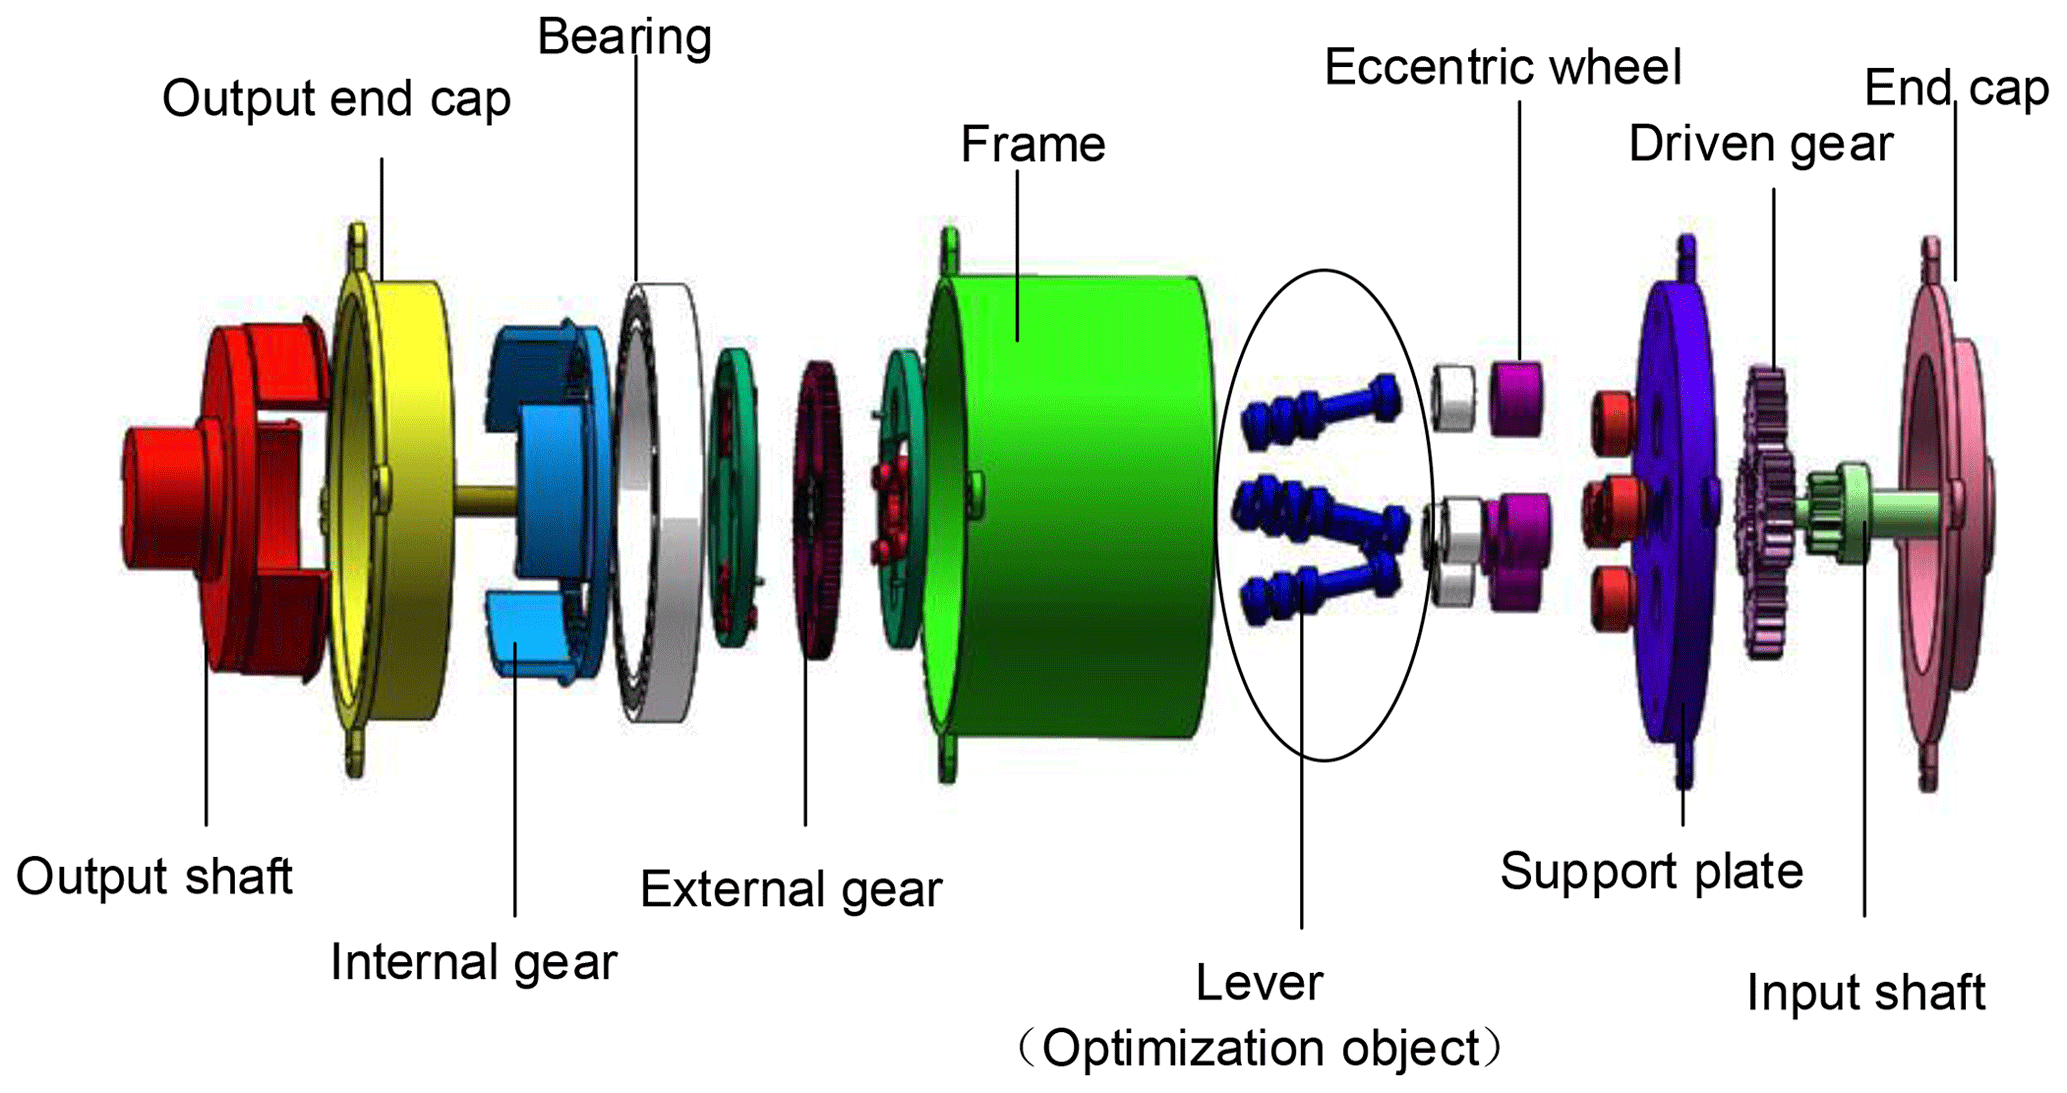
The reducer is suitable for low-speed and heavy-load scenarios, and it adopts a three-stage deceleration scheme overall. The first stage is a fixed-shaft gear train transmission, which plays a decelerating role and simultaneously transmits the rotation of the drive shaft to the four driven shafts. The second stage is the lever transmission, which greatly increases the load capacity. The third stage is the internal translation gear transmission, which converts the translation of the external gear into the rotation of the internal gear and finally transmits it to the output shaft. The goal of the optimization is to obtain a lever mechanism so that the reducer can achieve a much more stable working performance.
The lever reducer proposed in this article consists of a three-stage transmission: a fixed-axis gear train transmission, a lever transmission, and an internal translational gear transmission. As a result, the reducer has the advantages of these three kinds of transmissions. The fixed-axis gear train, shown in Fig. 2a, converted the input of the driving wheel into the output of the four driven wheels, yielding a large transmission ratio. Each of the four driven wheels was connected to an eccentric wheel to transmit the torque to the next stage.

Figure 2Structural diagram of the lever reducer. (a) Fixed-axis gear train transmission, (b) lever transmission mechanism, and (c) internal translational gear transmission.
The lever transmission mechanism is shown in Fig. 2b; component 1 drives the entire lever rotate around component 3 as a fulcrum, and components 2 and 4 are connected to the next level.
The structure of the inner translational gear is shown in Fig. 2c; the outer gear driven by the lever undergoes a translational motion which drives the inner gear to rotate about a fixed axis, thereby transmitting the motion. Finally, the output shaft outputs speed and torque.
In the working process of the reducer, the torque is input at the input end. The rotational speed is transmitted to four eccentric wheels through the transmission of planetary gear. The eccentric wheel moves with the lever. The lever rotates around one of its nodes. And the four levers move at the same time to drive the outer gear to move horizontally in the plane. Finally, the speed is transmitted to the internal gear to output torque.
2.2 Preliminary prototype of reducer
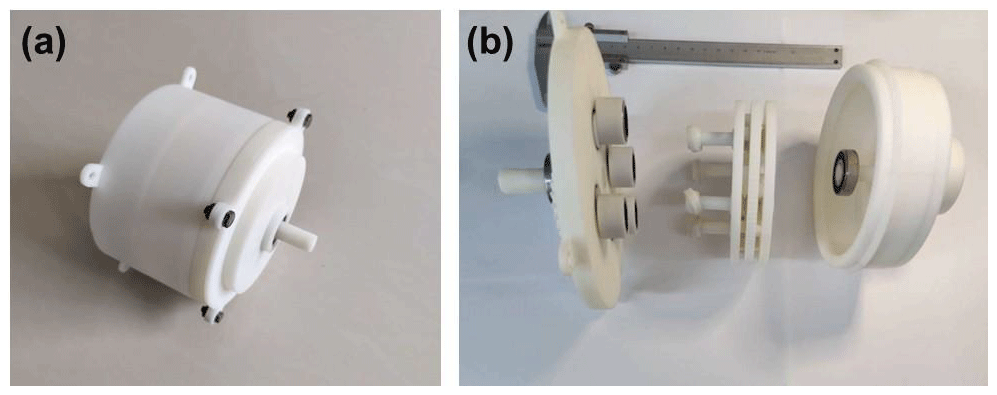
To verify the rationality of the structure of the reducer, a preliminary prototype of the reducer was made. Most parts of the reducer, including the gears, levers, and housings, were plastic parts made via 3D printing technology. The bearings in the reducer use standard metal parts. In the assembly process, the three transmission structures, namely, the fixed-shaft gear train transmission mechanism, lever transmission mechanism, and internal translational gear transmission mechanism, were assembled separately. These three mechanisms were assembled together to complete the assembly of the reducer. Through the preliminary experimental test, it was found that the input shaft of the reducer could drive the output shaft to rotate without a load. However, the stiffness of the plastic parts that made up the reducer was not sufficient to conduct experiments with loads. This shows that the reducer with this structure can have a certain deceleration and transmission function. Thus, the scheme we designed is feasible. The reducer model is shown in Fig. 3a. Figure 3b shows an exploded view of the model, which shows the internal structure of the reducer to illustrate the roles of the lever and gears inside.
2.3 Simplification of model and selection of inputs
The lever transmission mechanism involves the rotation of the spherical pair and the space as an optimization object. To optimize the design, the lever model was simplified as shown in Fig. 4a. The lever structure is shown in Fig. 4b, where a, b, and R are parameters that must be optimized, which are consistent with the parameters in Fig. 4a. These parameters will have a significant impact on the movement of the lever, and these effects will be described in the subsequent paragraphs.
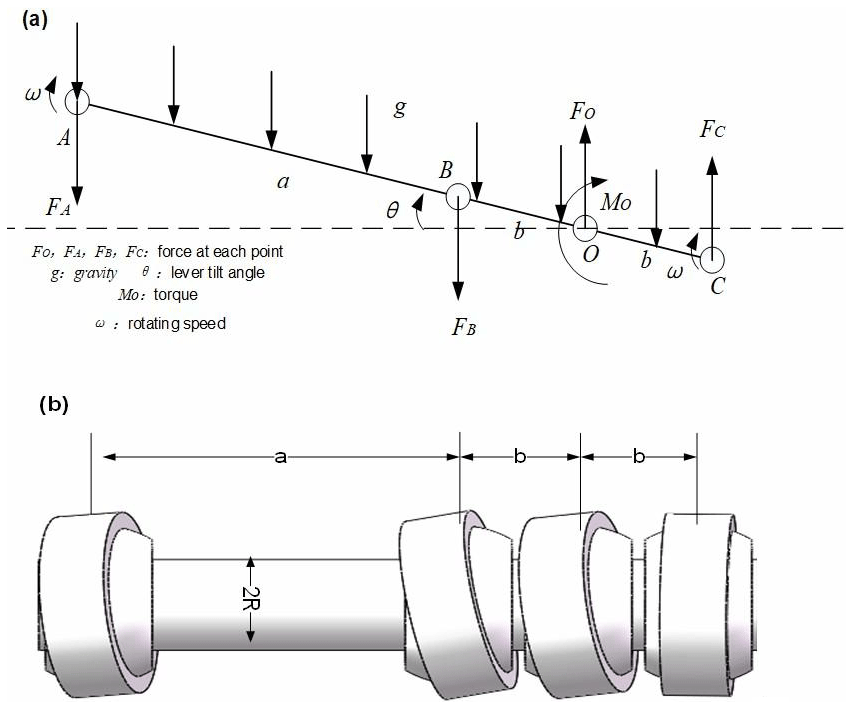
Figure 4Lever mechanism. (a) Schematic diagram of the simplified lever mechanism and (b) schematic diagram of the lever structure.
As shown in Fig. 4a, the speed of the lever is ω. The linear velocity of the lever rotation is perpendicular to the direction of gravity. The spatial force of the lever force is transformed into a plane force system of the lever force at that moment. The joint bearing and spherical pair on the lever are simplified. The space forces and moments provided by the spherical pair on the joint bearing are converted into a support for the lever and the moment on the plane.
The factors affecting the performance of the lever include the material of the lever, radius, length of each segment, and angle between the lever and the rotating shaft. The angle between the lever and the rotating shaft was constrained by the upper and lower transmission design of the reducer, which is not easy to change frequently. The choice of the material of the lever cannot be converted into a mathematical expression, so it cannot be optimized in the form of a genetic algorithm fitness function. Therefore, the radius of the lever, the rod length between A and B, and the rod length between B and O were selected as the input variables to be optimized by the genetic algorithm.
3.1 Finite element analysis and determination of target parameters
The stress, displacement, and safety factor plots were obtained by adding component contacts, fixtures, loads, and meshing, and then using solvers, as shown in Fig. 5. The lever began at rest, and the forces acting on the lever included the following: (1) gravitational forces, (2) external forces supporting the spherical pair, and (3) torque on the two ends of the spherical pair, which came from the drive of the input shaft and the load received by the output shaft.
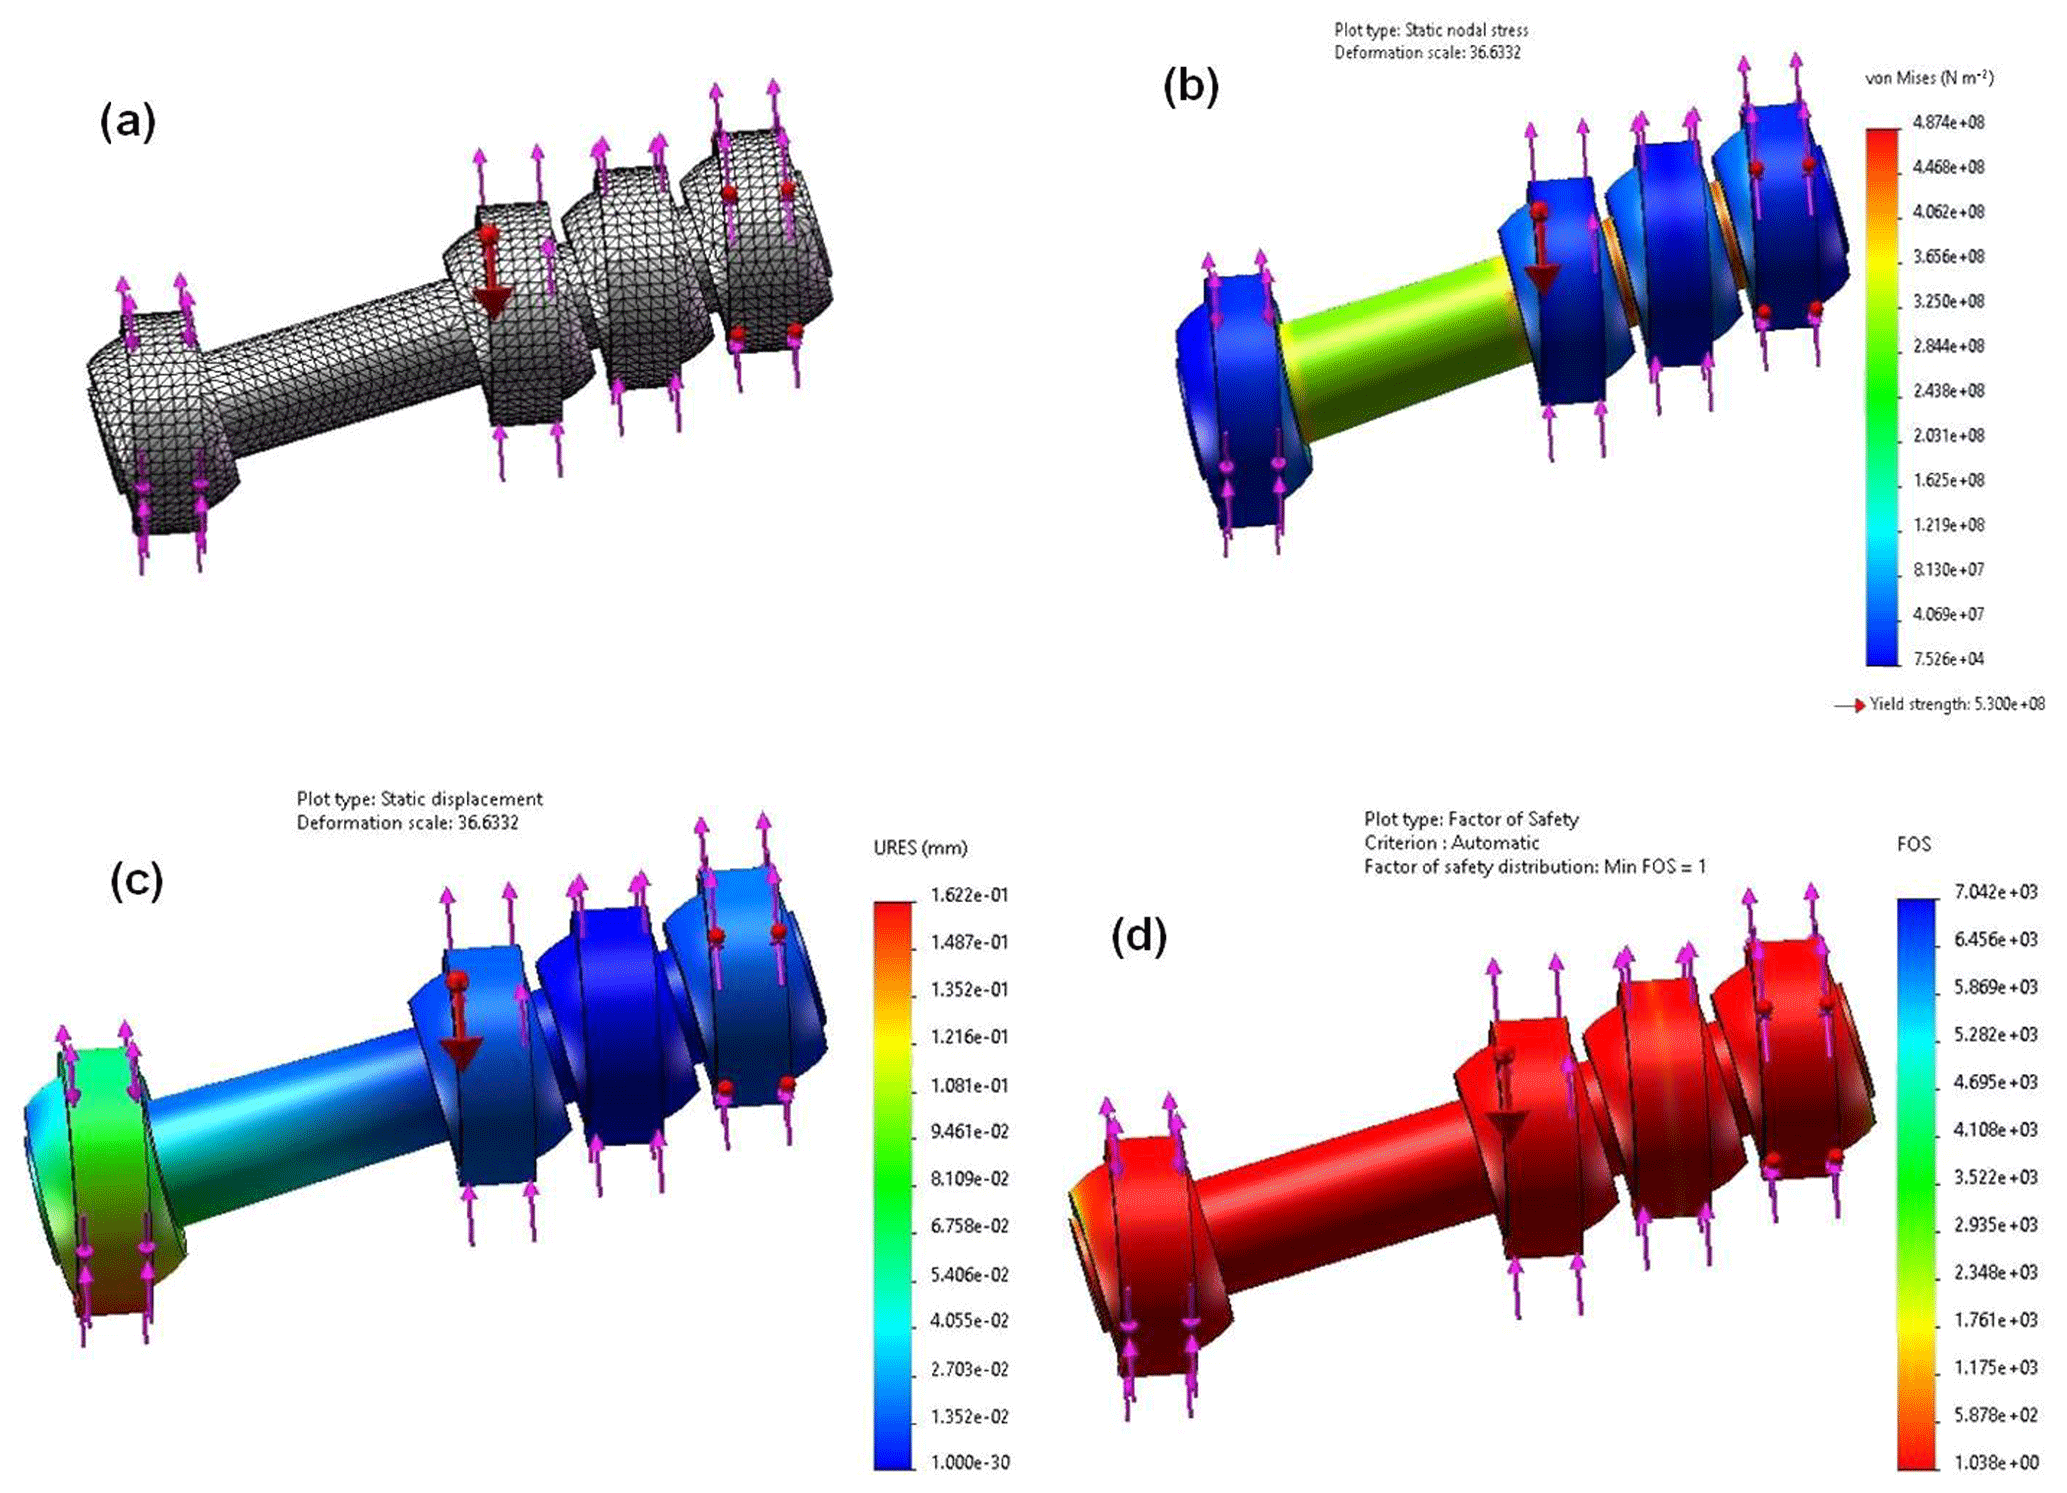
Figure 5Virtual prototype simulation. (a) Meshing, (b) stress diagram, (c) displacement diagram, and (d) safety factor diagram.
As shown in the stress diagram in Fig. 5b, the lever mechanism was subjected to a maximum stress near the fulcrum. The maximum stress was 4.924×10⁸ N/m2, and the yield limit of no. 45 steel is 5.3×10⁸ N/m2. Therefore, the design of the lever mechanism met the strength requirements. Figure 5c shows that the displacement near the input end of the lever was large. As shown in Fig. 5d, the minimum safety factor of the entire input was 1.1, and its safety level met the requirements.
The optimization of the lever mechanism depended on the force near the lever fulcrum and the disturbance of the lever input end. The bending normal stress at the lever fulcrum and the deflection at the lever inputs were selected as the target parameters for lever optimization. The mass of the lever was also an important parameter for measuring the performance of a lever drive, so it was one of the target parameters.
3.2 SOLIDWORKS optimization
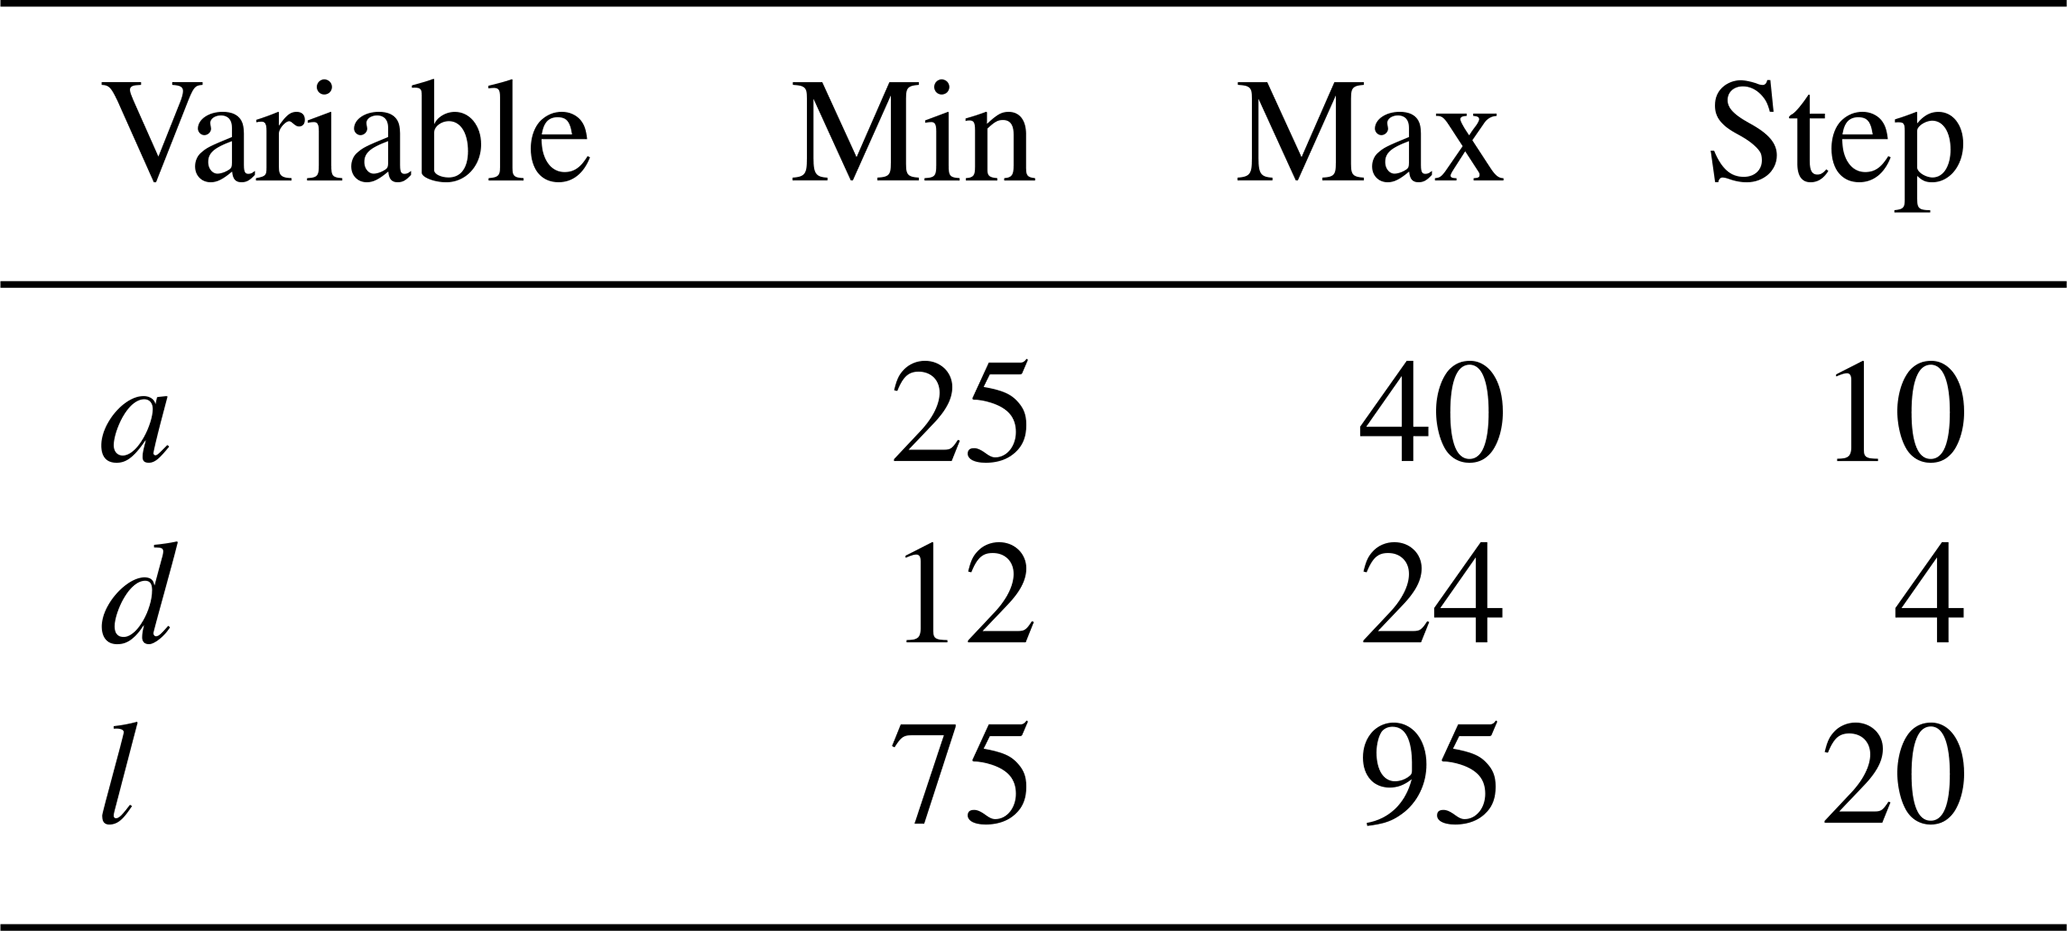
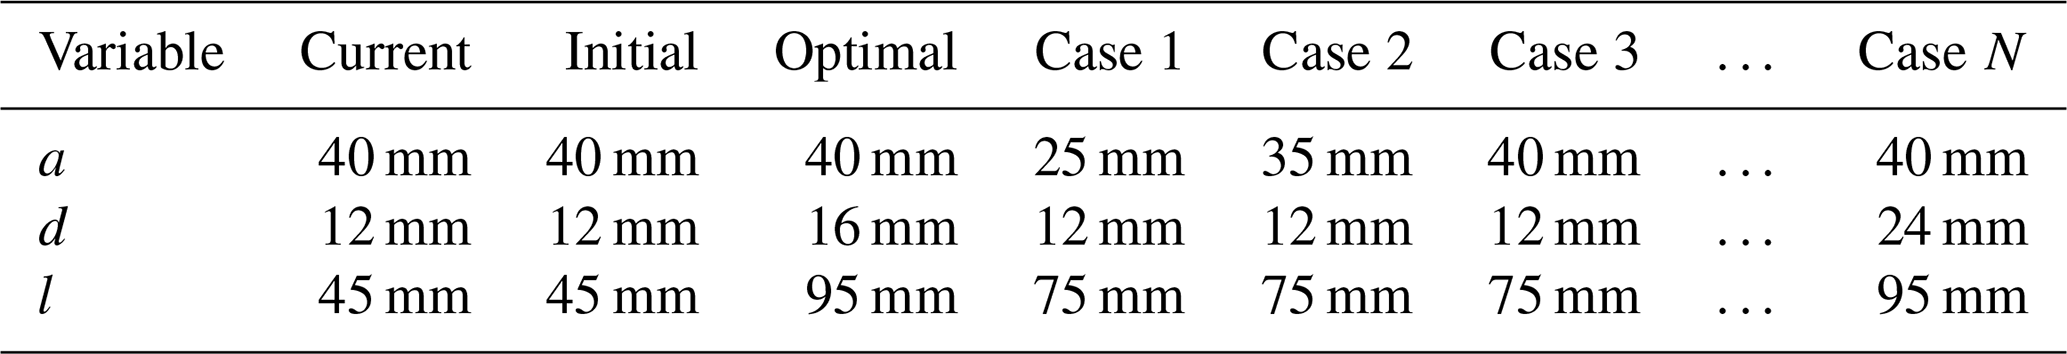
According to the previous finite element analysis, SOLIDWORKS was used to perform preliminary optimization of the parameters of the lever, and the goal was to obtain the minimum stress. The optimized variables are shown in Table 1. To use SOLIDWORKS to optimize the parameters, the original three parameters a, b, and R were modified. b was rewritten in terms of the length of the lever l, where . R was replaced by the diameter of the lever d, where d=2R. According to the maximum value, minimum value and step size of each parameter, only one parameter is modified in each simulation. After traversing all n cases, the stress of the mechanism in all cases can be obtained. Finally, the specific value of each parameter under the condition of minimum stress is selected
The optimization results were a=40 mm, d=16 mm, and l=95 mm, as shown in Table 2. For comparison with the results of the genetic algorithm, these data were converted back to the original parameters, which had the following values: a=40 mm, R=8 mm, and b=27.5 mm.
4.1 Calculation of target parameters
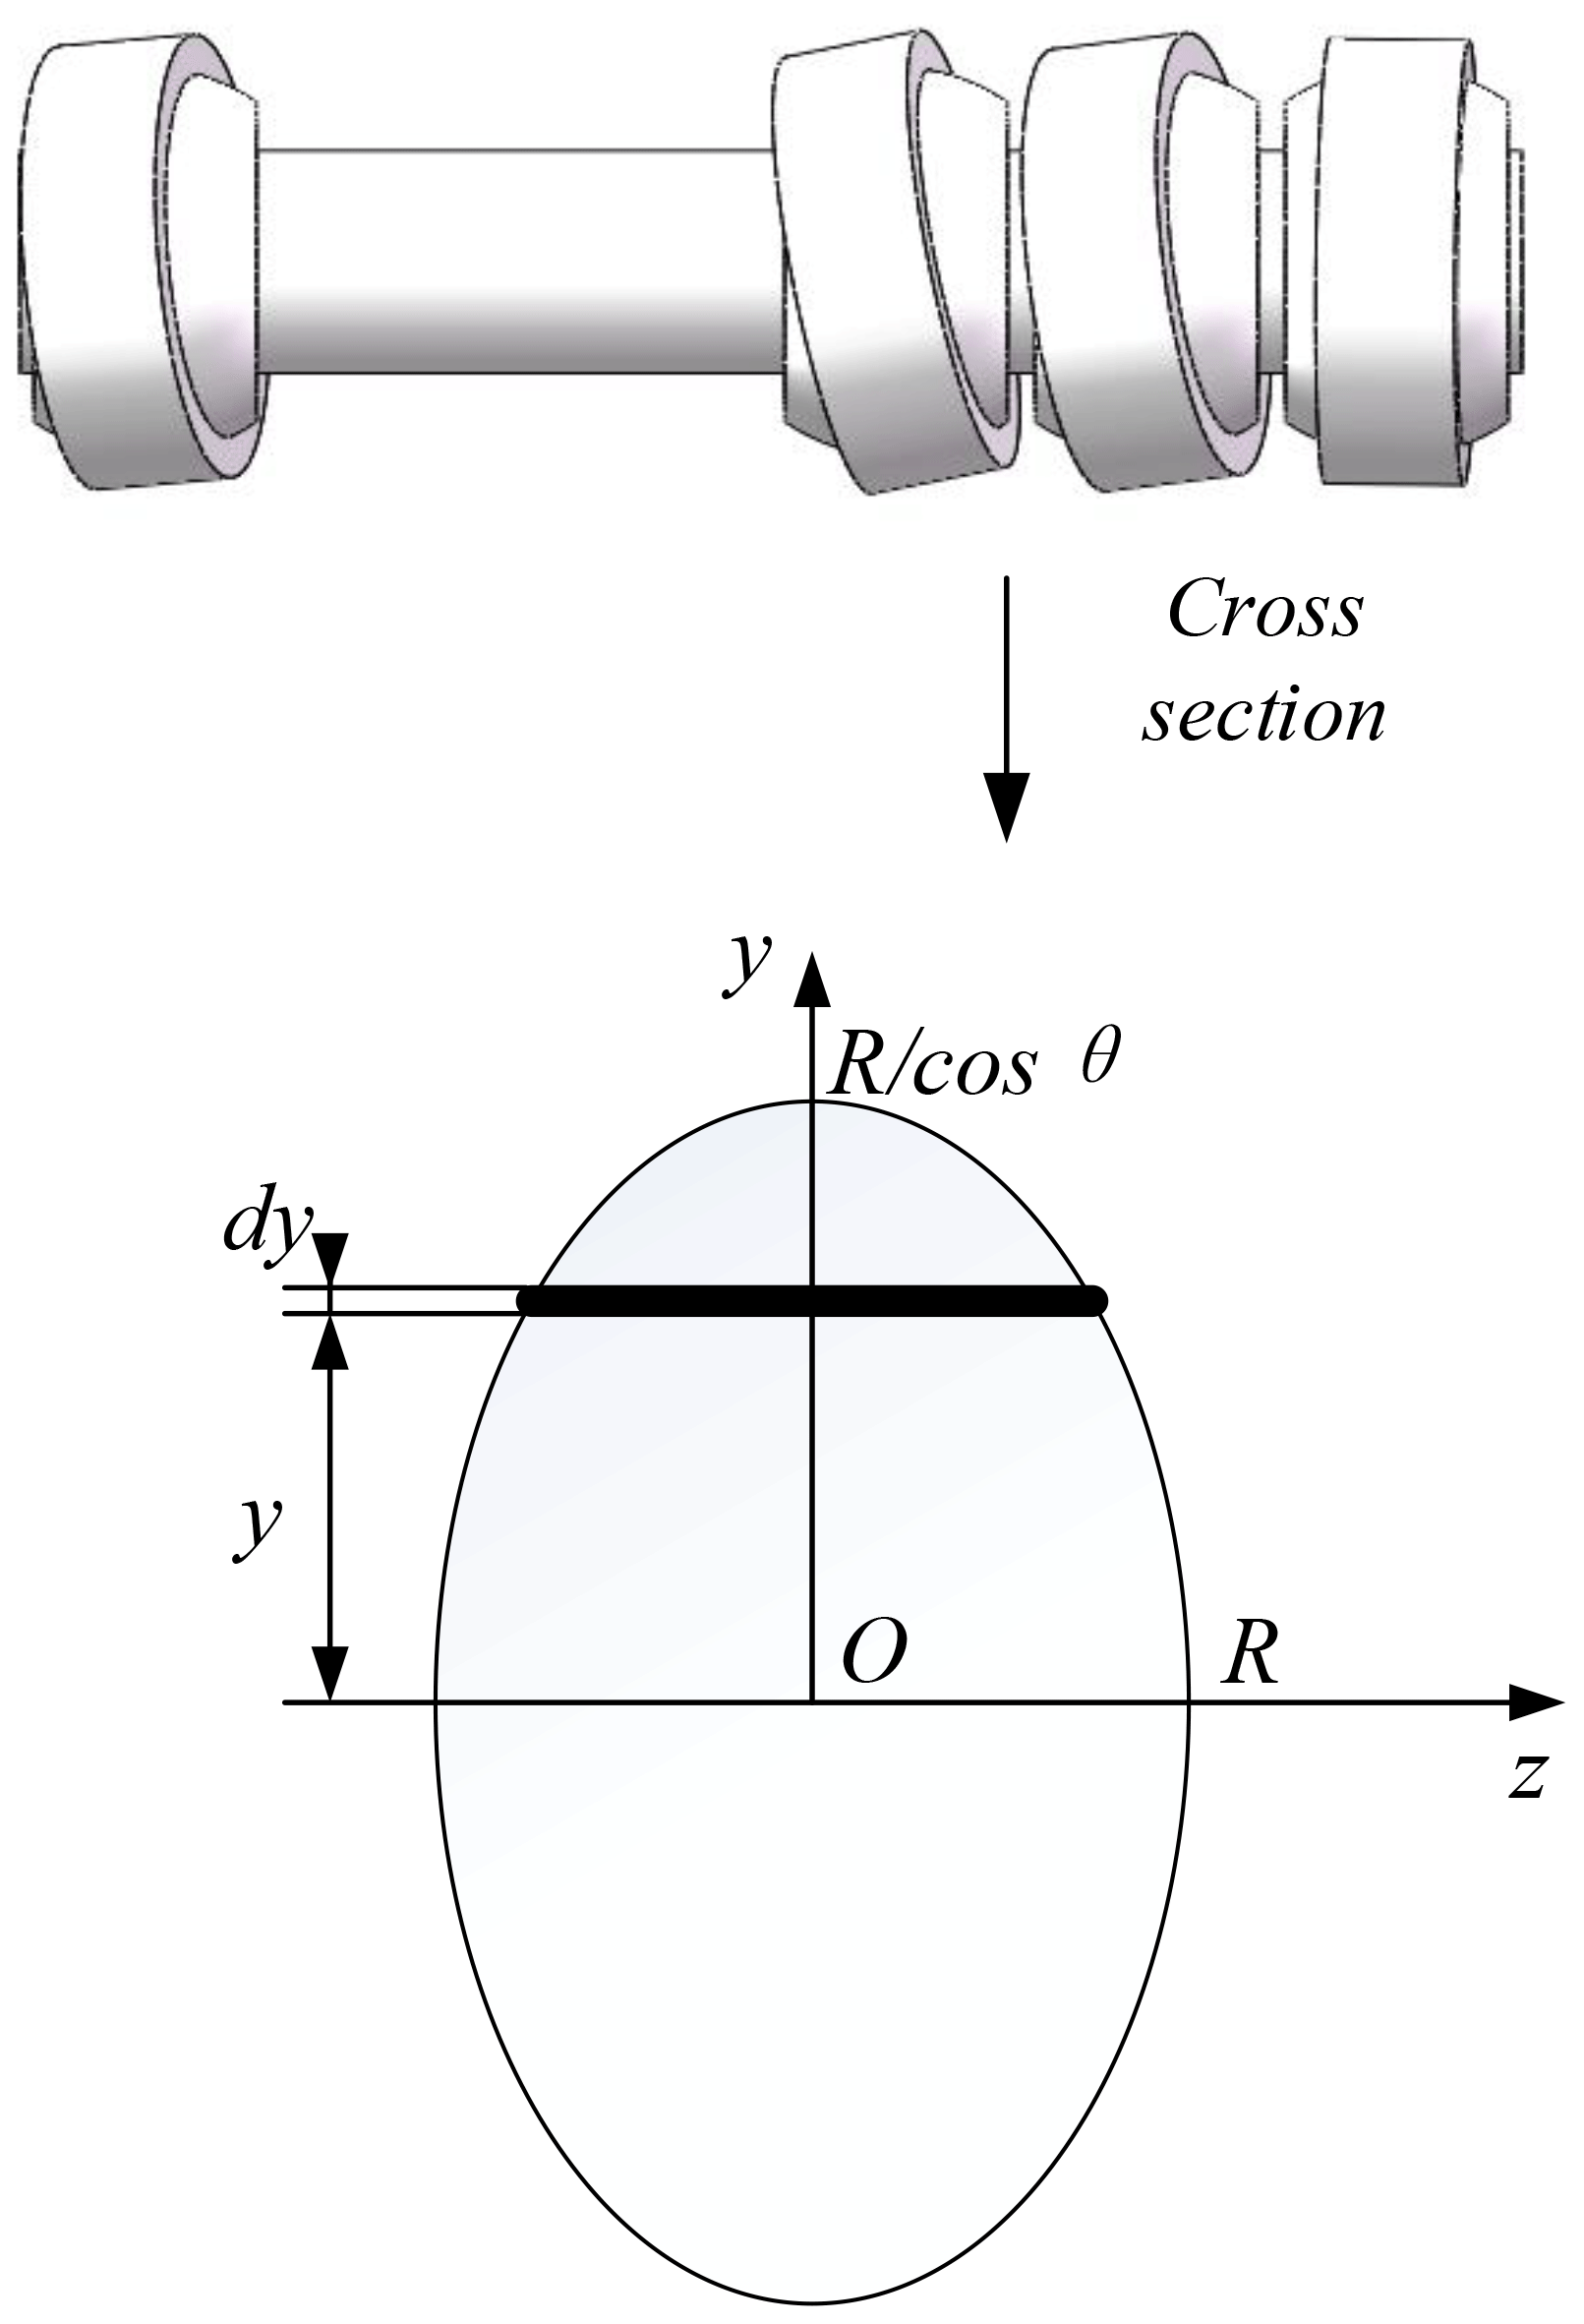
As shown in Fig. 6, the mass m of the lever, the maximum normal stress σmax experienced by the lever, and the maximum deflection ωmax of the lever were selected as the three target parameters of the lever optimization.
There are several known quantities: the angle between the lever and the rotating shaft θ=13∘, the angular velocity of the lever about the axis ω=50π rad/s, the density of the no. 45 steel kg/m3, the gravitational acceleration g=9.8 N/kg, and the modulus of elasticity of the no. 45 steel E=206 GPa.
The mass of the lever can be calculated as follows:
The maximum normal stress of the lever can be calculated as follows:
where mx is the mass of the interval dx, and ax is the centripetal force in this interval. Based on the kinematics, the following expressions can be obtained:
FC, which balanced the centrifugal force on the right side of the lever, can be calculated as follows:
The equilibrium equation of the plane force system is , and thus,
FO can be calculated as follows:
At equilibrium, the sum of the moments satisfies , where
MO can be calculated as follows:
From this, the bending moment of each segment of the lever can be calculated as follows:
-
which simplifies to the following:
-
which simplifies to the following:
-
which simplifies to the following:
Based on these expressions, the maximum bending moment of the lever can be calculated at the pivot point of the lever:
The polar moment of inertia of the cross section of the lever with respect to the z axis can be calculated as follows:
As shown in Fig. 6, . Substituting this into Eq. (18) yields the following:
The maximum normal stress experienced by the lever was calculated as follows:
which simplifies to the following:
The maximum deflection of the lever was calculated as follows:
-
Differential equation for
where C1 and D1 are two constants.
-
Differential equation at
where C2 and D2 are two constants.
-
Differential equation at
where C3 and D3 are two constants.
When the lever is located at x=a, the deflection and rotation angle of the first and second segments are equal. When the lever is located at , the deflections of the second and third segments are equal to zero. Therefore, after simplification, the deflection of the lever is maximized at x=0. The maximum deflection is
When the lever is at rest and suddenly receives external torque, the force of the lever is expressed as follows:
where N m is the external torque received.
In summary, Eqs. (1), (21), (31), and (32) are the expressions of the three target performance parameters optimized for the lever transmission mechanism, and thus, the target parameters of the genetic algorithm optimization can be obtained as
4.2 Genetic algorithm optimization
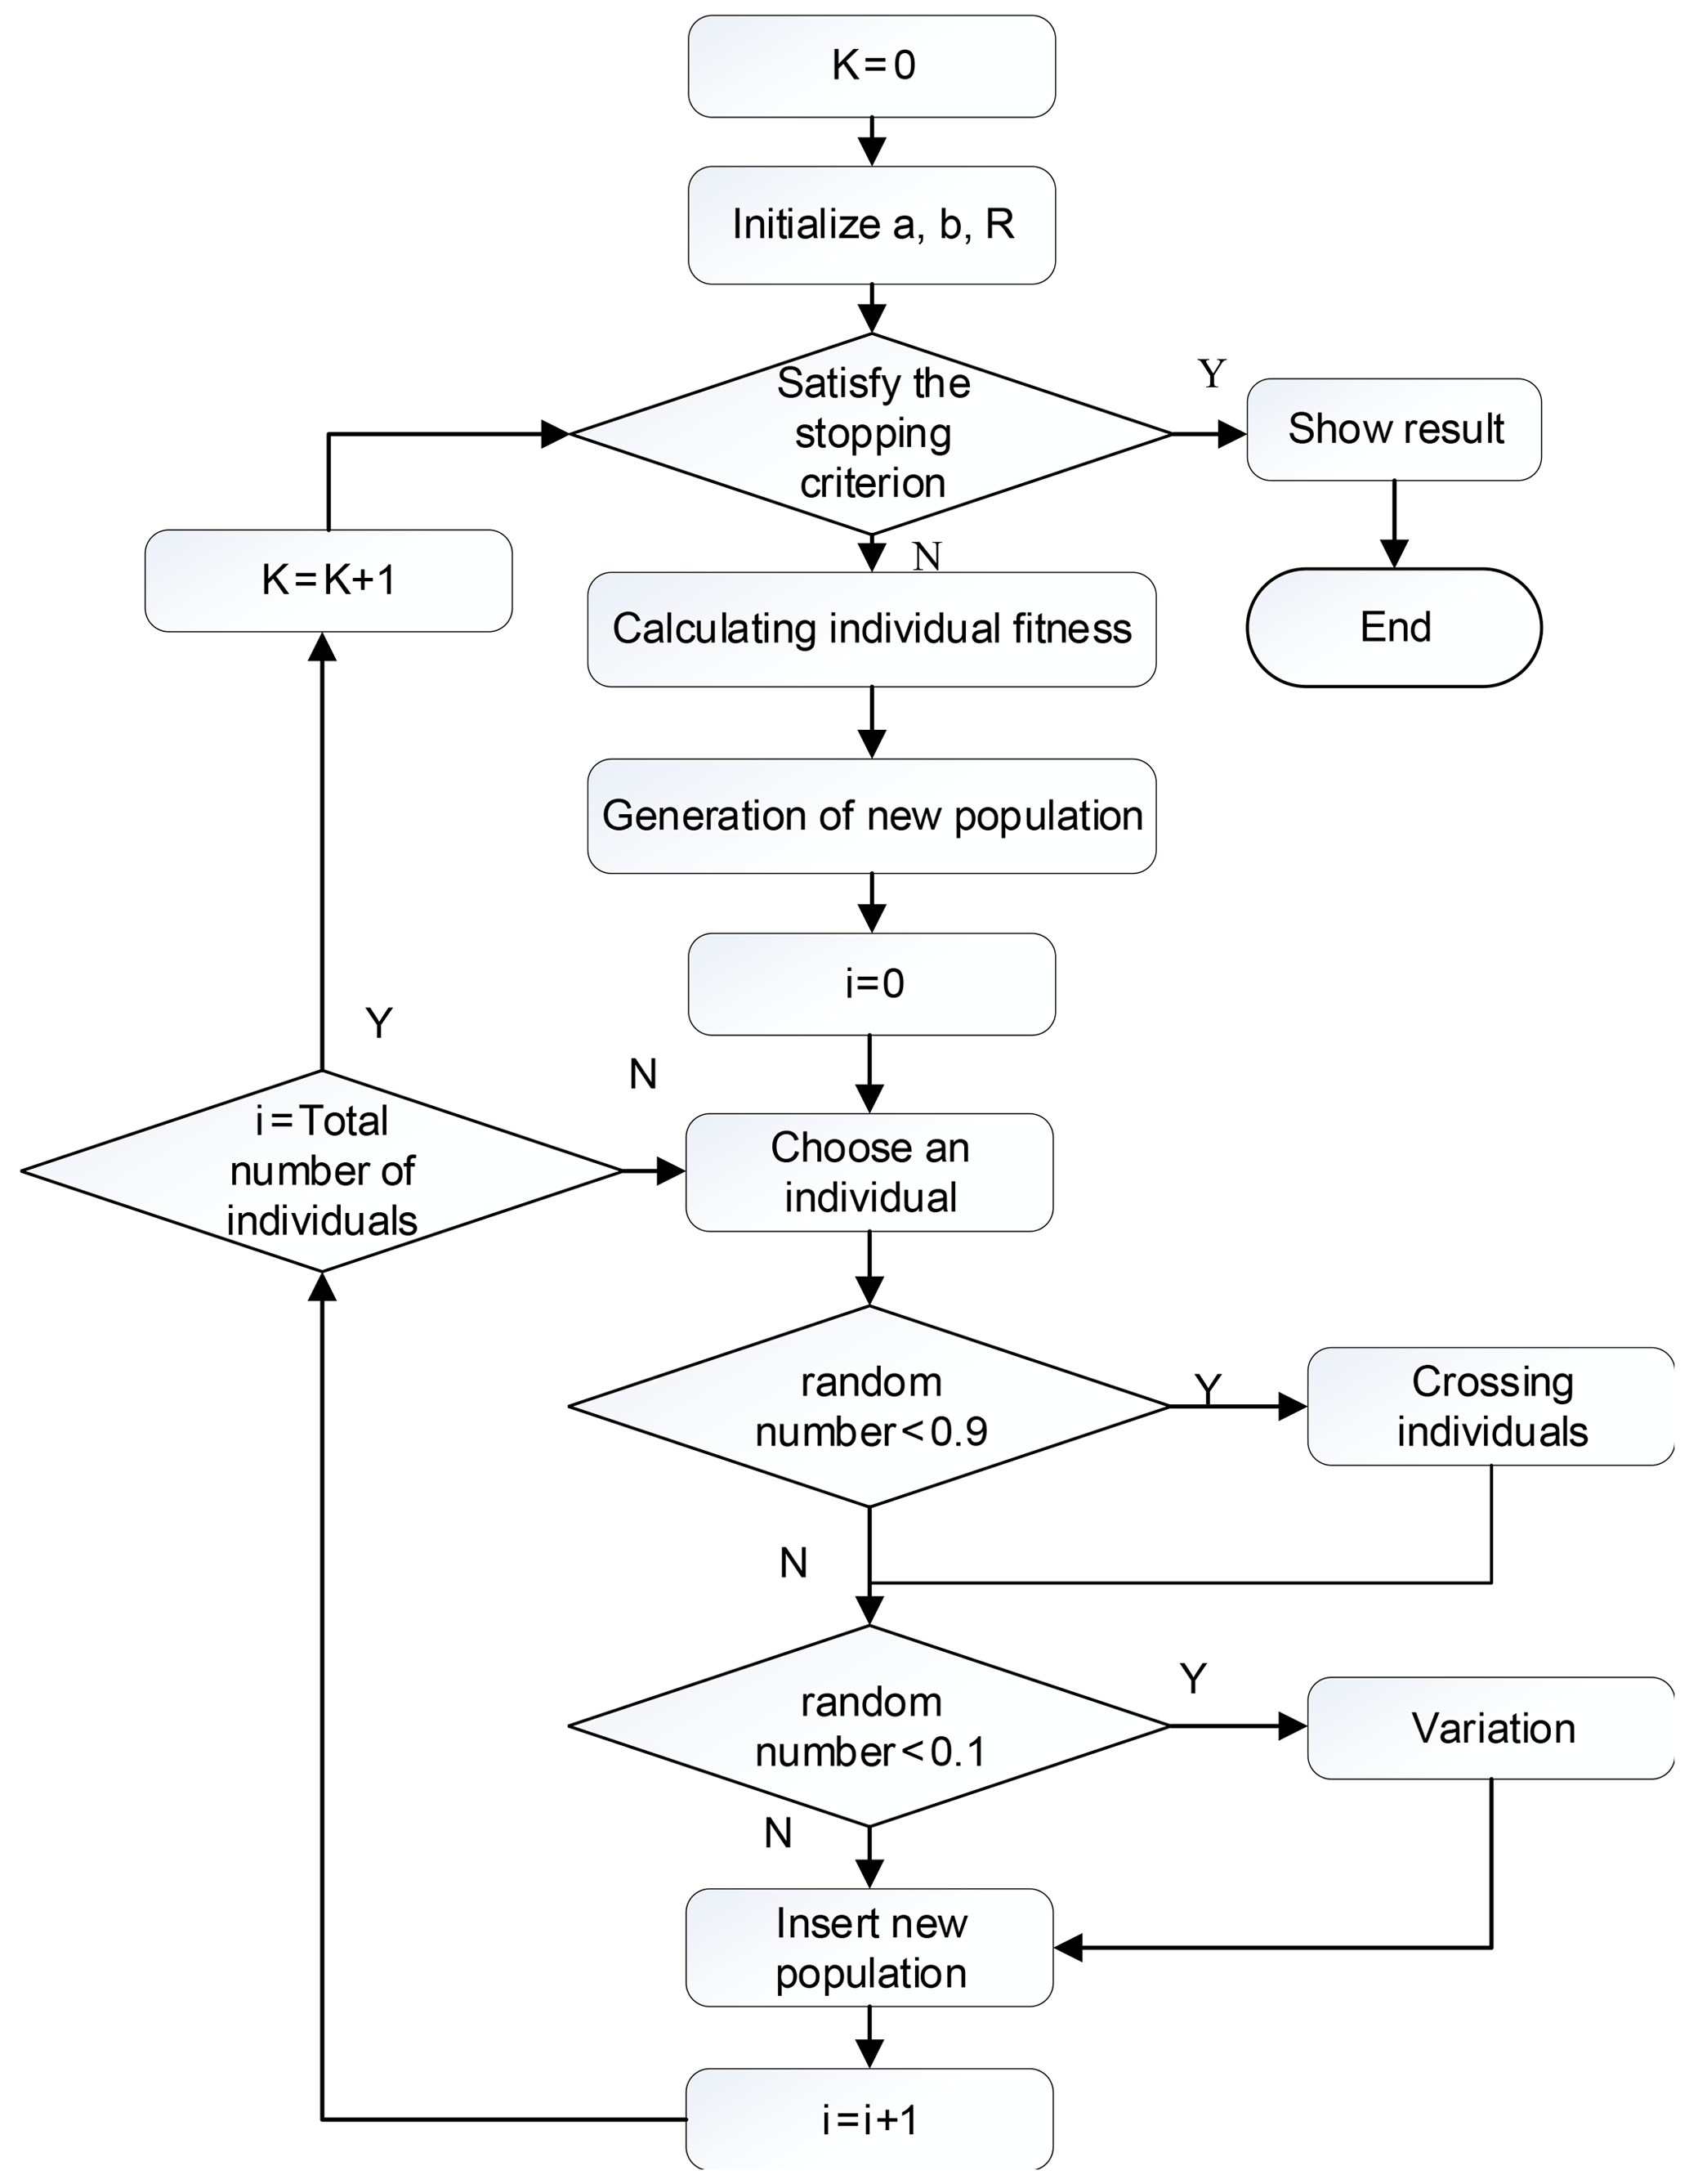
The input variables and target parameters of the genetic algorithm optimization were specified, and the genetic algorithm was then designed. The genetic algorithm designed in this study was divided into the following steps. A flow chart of the basic principle of the genetic algorithm is shown in Fig. 7.
-
First, the ranges of values for the three input variables were set. a and b are the lengths of the segments of the lever. The values of the two variables were set to and . R is the radius of the lever. If the radius of the lever is too small, the positive stress of the lever will be too large, and then the strength of the lever will be too low. If the radius of the lever is too large, the weight of the lever and the size and eccentricity of the bearing will be too large. Therefore, the range of the lever radius was set to . The algorithm optimization goal was to find the solution of three input variables within the specified ranges of the solutions to make the value of the fitness function reach a minimum value.
-
An initial group of solutions was created. The number of groups was 200. All individuals in the initial population were randomly generated. All individuals in the population were stored in the variable group.
-
The solved chromosome was encoded, and each variable was set to a 16 bit binary number. Therefore, the dimension of the solved chromosome was 48 bits.
-
The fitness function was defined as . The weights were set to t1=1, , t3=104, and t4=105. There were two functions of weights. One function ensured the orders of magnitude of the three target parameters were similar. The other function distinguished the importance of the three target parameters. The weights were determined by calculating the magnitudes of m, σmax, ωmax, and τ. The maximum normal stress between the three target parameters was more important than the other two target parameters because the primary failure condition of the lever mechanism was the bending normal stress σmax. Therefore, the weight of the maximum normal stress σmax was appropriately increased.
-
The fitness of each individual in the population was calculated, and the smallest one was selected as the best individual of the current group. If the current minimum was smaller than the global minimum, the global minimum was replaced with the current minimum and saved as the variable min_group.
-
A better individual in the group was selected by roulette to generate a population. Roulette was used to randomly select the next generation population, and the resulting population based on the selection was stored in the variable bettergroup.
-
The crossover operation of the population bettergroup was completed, and the crossover probability was set to cross_prob = 0.9. A random number between [0, 1] was generated between every two individuals in the population. If the random number was less than the crossover probability, the genes on the chromosome between the two individuals were randomly split and spliced.
-
The mutation operation of the population was completed, and the mutation probability was set to vary_prob = 0.1. A random number between [0, 1] was generated from each individual in the population. If the random number was less than the crossover probability, then the genes on the two chromosomes of this individual were randomly exchanged. After the mutation operation was completed and a new population was generated, an evolution of the genetic algorithm was completed, and the number of iterations was increased by 1.
-
Steps (5)–(8) were repeated, and the number of iterations of the genetic algorithm was set to 200. The optimal individual, its fitness value, and the value of the input variable for each iteration were output by decoding. After completing 200 iterations, the optimal individual of the output was the global optimal individual. The curve of the previous iteration fitness value and the input variable value could then be plotted.
4.3 MATLAB simulation results and analysis
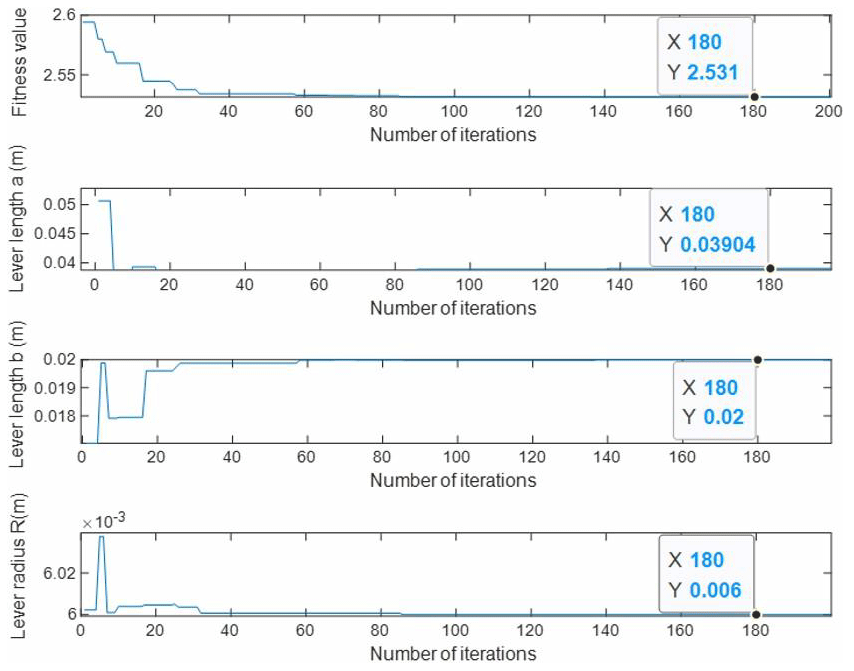
The simulation results of the genetic algorithm designed in this paper are shown in Fig. 8. In this figure, the x axis represents the number of iterations. The y axis represents the adaptive function values and the values of parameters a, b, and R, respectively. The fitness value of the optimal individual before the first 40 generations was significantly reduced, and the value of the optimal individual's solution fluctuated significantly. This shows that the algorithm was constantly searching for the optimal individual during each iteration in the population. After the algorithm completed about 65 iterations, the fitness value of the optimal individual in the population and the value of the solution approached convergence. The 180th generation result shown in the figure is selected as the final optimization result. The values of the optimal individual's solution were a=0.04 m, b=0.02 m, and R=0.006 m. The values of the three input variables were substituted into the expressions of the three target parameters to obtain the mass m=0.0710 kg, maximum normal stress Pa, maximum deflection , and static stress N/m. The initial values of the three input variables were a0=0.04, b0=0.015, and R0=0.008. The values of the three input variables were substituted into the expressions of the three target parameters to obtain the mass m0=0.11 kg, maximum normal stress , maximum deflection m, and static stress N/m2. After optimization, the three input variables were reduced by 61.7 %, the static stress was reduced by 57.9 %, and the maximum deflection was reduced by 83.4 %. This proved the rationality of the optimization algorithm designed in this paper. Based on the value of R, the optimal value of the radius within the set value range was 6 mm. If the radius R had no value range constraints, the optimal radius was less than 6 mm, but the minimum inner diameter of the joint bearing was 6 mm. Thus, the optimal radius of the lever mechanism was 6 mm. The value of b in the solution was 20 mm. The value of a of the best individual was 40 mm.
Table 3Design variables obtained by the genetic algorithm and SOLIDWORKS simulation.
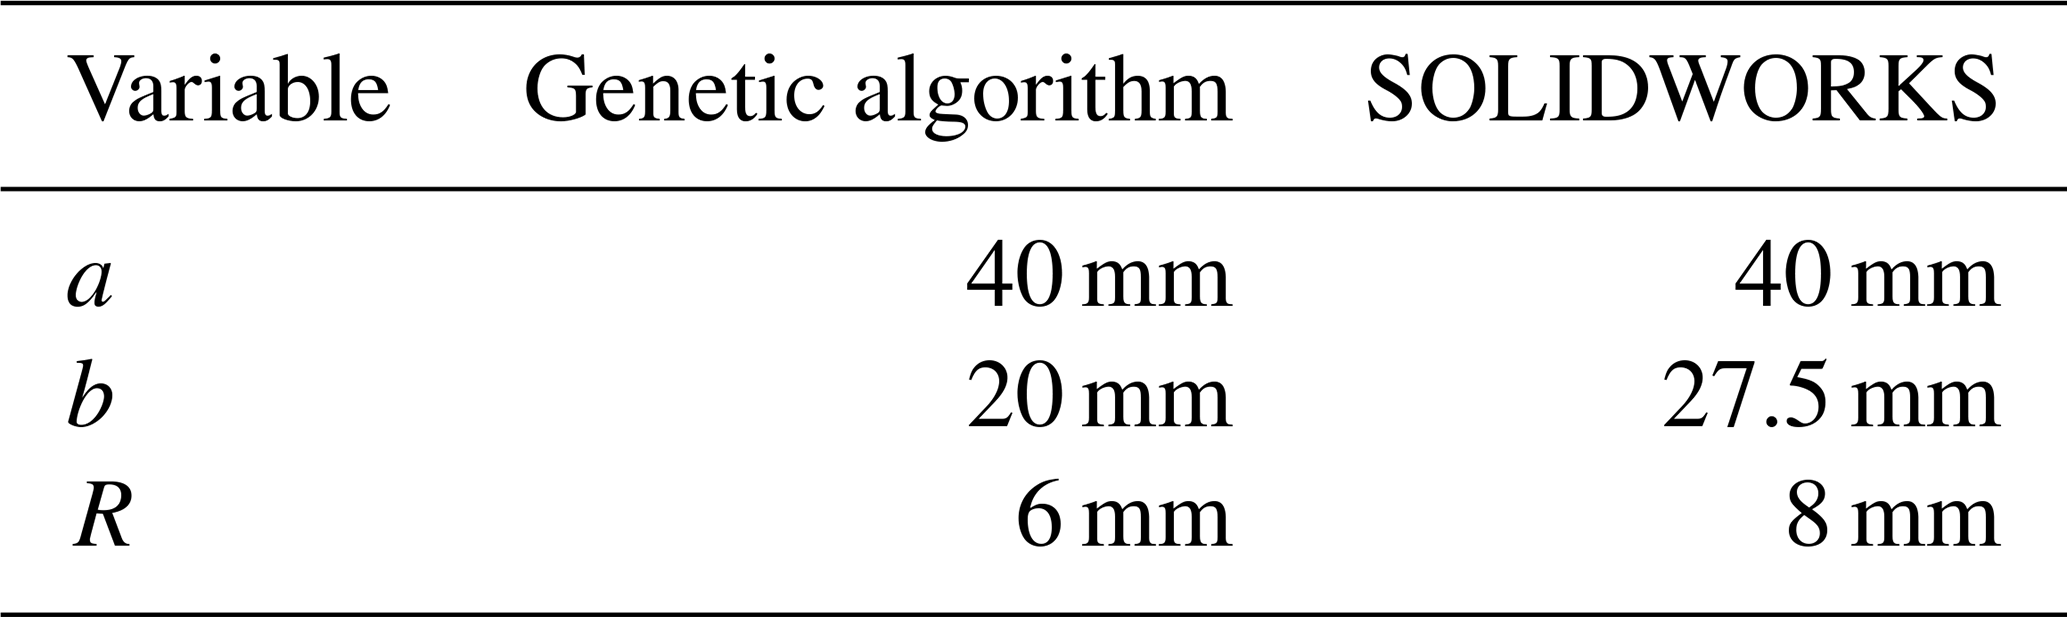
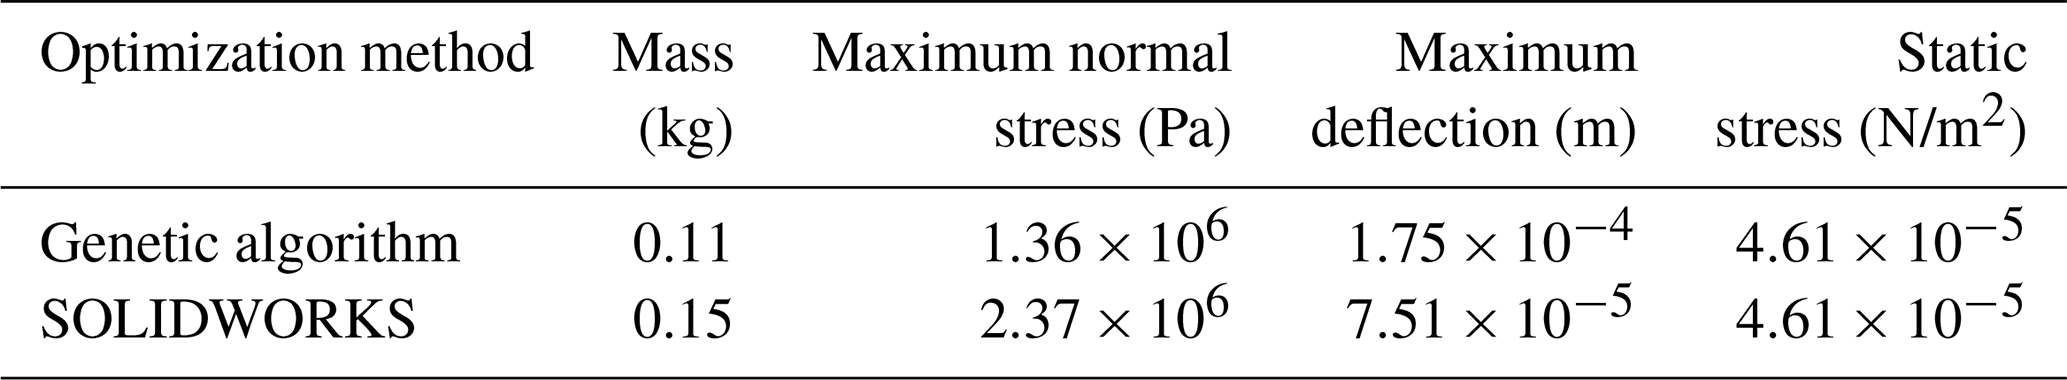
Table 4Performance index obtained by the genetic algorithm and SOLIDWORKS simulation.
5.1 Data comparison
Table 3 shows the final results obtained by the two methods. The results of the genetic algorithm and the SOLIDWORKS optimization were somewhat different. Substituting the results of the SOLIDWORKS simulation optimization into the fitness function in the genetic algorithm, the result obtained was 5.7461, whereas the fitness function value of the genetic algorithm simulation was 2.531. In addition, most of the results obtained by the genetic algorithm and the SOLIDWORKS simulation appeared at the maximum or minimum values of the parameter ranges, which means that the preset ranges significantly affected the final result. In addition to the influence of the ranges, other factors may have affected the results. The difference is resulted from the following:
-
SOLIDWORKS only considered the static stress and not a state of motion.
-
Owing to limitations of the computing power, the step size in SOLIDWORKS could not be set to a value that was too small. This could result in inaccurate optimization results.

We also compared the performance indicators of the optimized levers obtained by the two methods, and the results are shown in Table 4. Except for the deflection, most of the performance indicators obtained by the genetic algorithm were better than those obtained by the SOLIDWORKS simulation optimization. The main reason for the difference of deflection is that the SOLIDWORKS simulation only considers the static state and does not consider the influence of lever radius and mass on the system in the process of motion. As a result, the final radius obtained will be larger than the result of the genetic algorithm optimization, and the sectional inertia moment of lever will be increased, so the final deflection will have a large gap between the two optimization methods. This also proved that the genetic algorithm we used was suitable for solving such optimization problems. When the input power is fixed, changing the size of the lever can not change the final output speed of the reducer, but the optimized lever can make the reducer bear more input power and bear more load at the output end.
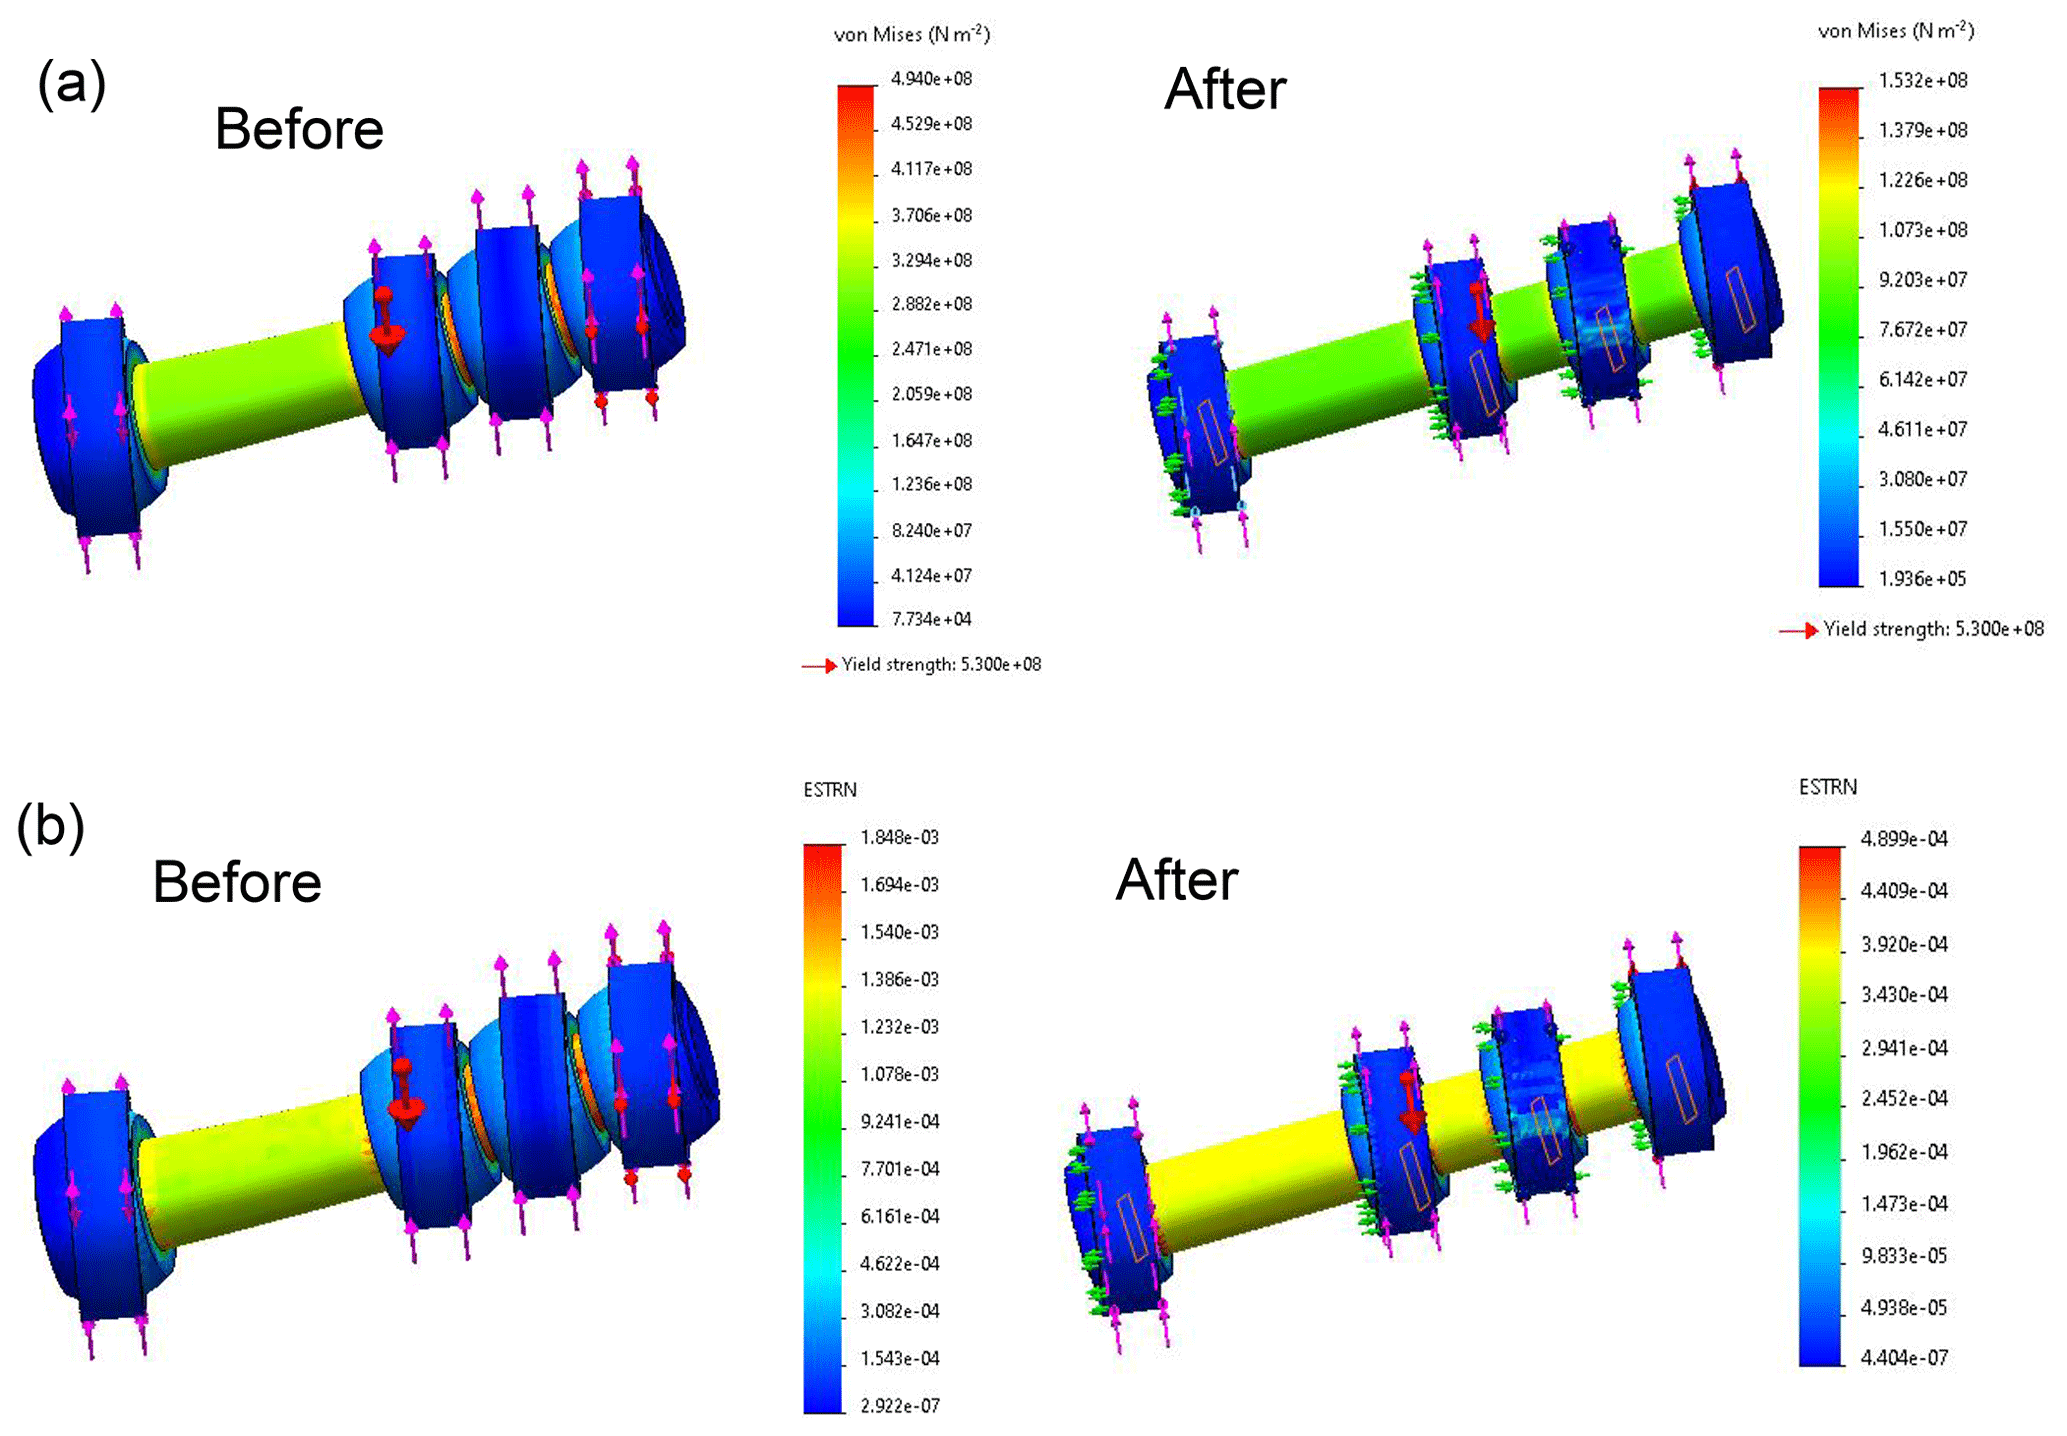
According to the optimized parameters, the mechanical properties of the lever before and after optimization are compared under the same external force. The comparison results are shown in Fig. 9. The stress and strain of the lever before and after optimization are compared in the figure under the same conditions. It can be seen that the stress and strain of the optimized lever are lower than those before optimization, in which the maximum stress is changed from 4.940×10⁸ to 1.532×10⁸, and the strain is changed from to . It can be seen that the mechanical properties of the lever have been improved after optimization. As shown in Table 5.
5.2 Conclusion
In this study, the structural optimization of the lever transmission mechanism was completed based on the genetic algorithm, and the model of the lever transmission mechanism was simplified and converted into a plane force system. The optimized input variables of the lever mechanism were screened through analysis, and the target performance parameters were optimized based on the results of motion simulations and finite element analysis. The target performance parameters, which depended on the three input variables, were calculated. Further design of the lever optimization algorithm was carried out, and the genetic algorithm was implemented in MATLAB, after which the simulation results were analyzed. However, this paper only focuses on the lever mechanism in the reducer and does not consider other transmission mechanisms such as the planetary gear in the reducer. Further research can take the whole reducer as the research object to optimize and obtain the optimal results. With the development of industrial production, the development of the reducer is mainly divided into two directions, i.e. high speed, high power and low speed, heavy load. In this paper, an optimization method based on a genetic algorithm is proposed, which can better reduce the stress and deformation of the key structure in the reducer under the conditions of a reasonable structure. It provides a new idea for the geometric parameter optimization of various industrial equipment and robots.
All the code used in this paper can be obtained from the corresponding author upon request.
All the data are shown in Tables 2 and 3.
XS and LG designed the structure model of reducer, LG and YS put forward the research method, ZW carried out experiments, and DG and ZW completed the writing of the paper.
The authors declare that they have no conflict of interest.
This research has been supported by the National Natural Science Foundation of China (grant no. 61105103).
This paper was edited by Guowu Wei and reviewed by three anonymous referees.
Aggestam, E. and Nielsen, J. C. O.: Multi-objective optimisation of transition zones between slab track and ballasted track using a genetic algorithm, J. Sound. Vib., 446, 91–112, https://doi.org/10.1016/j.jsv.2019.01.027, 2019.
Ghosh, G., Mandal, P., and Mondal, S. C.: Modeling and optimization of surface roughness in keyway milling using ANN, genetic algorithm, and particle swarm optimization, Int. J. Adv. Manuf. Technol., 100, 1223–1242, https://doi.org/10.1007/s00170-017-1417-4, 2019.
Kumar, V. and Jha, K.: Multi-objective shape optimization of vortex finders in cyclone separators using response surface methodology and genetic algorithms, Sep. Purif. Technol., 215, 25–31, https://doi.org/10.1016/j.seppur.2018.12.083, 2019.
Liu, W., Yao, X., and Li, C.: Optimization of Configuration Parameters of Tail-sitter UAV Based on Response Surface and Genetic Algorithm, Nongye. Jixie. Xuebao., 50, 88–95, https://doi.org/10.6041/j.issn.1000-1298.2019.05.010, 2019.
Pang, Z., Wang, Z., Zhao, Z., Zhang, C., Zhang, H., and Pang, D.: Mechanism design of internal translation gear transmission and its CAD system development, in: 2011 International Conference on Consumer Electronics, Communications and Networks (CECNet), 16–18 April 2011, Xianning, China, 2312–2316, 2011.
Rezaie, A., Tsatsaronis, G., and Hellwig, U.: Thermal design and optimization of a heat recovery steam generator in a combined-cycle power plant by applying a genetic algorithm, Energy, 168, 346–357, https://doi.org/10.1016/j.energy.2018.11.047, 2019.
Sanusi, Y. S. and Mokheimer, E. M. A.: Thermo-economic optimization of hydrogen production in a membrane-SMR integrated to ITM-oxy-combustion plant using genetic algorithm, Appl. Energy, 235, 164–176, https://doi.org/10.1016/j.apenergy.2018.10.082, 2019.
Shen, X., Zhang, L., and Qiu, D.: A lever-bridge combined compliant mechanism for translation amplification, Precis. Eng., 67, 383–392, https://doi.org/10.1016/j.precisioneng.2020.10.010, 2021.
Zhang, J., Guo, F., and Xie, S.: Elasto-dynamic modeling and modal analysis of spider reducer with small tooth number difference, J. Vib. Shock., 34, 169–175, https://doi.org/10.13465/j.cnki.jvs.2015.12.029, 2015.
- Abstract
- Introduction
- Determination of optimization parameters
- SOLIDWORKS simulation and optimization
- Design of lever structure optimization algorithm
- Data comparison and experimental conclusion
- Code availability
- Data availability
- Author contributions
- Competing interests
- Financial support
- Review statement
- References