the Creative Commons Attribution 4.0 License.
the Creative Commons Attribution 4.0 License.
 | 04 Mar 2021
Experimental measurement of the cutting forces and wear of the drill in processing X17CrNi16-2 martensitic stainless steel
Adrian Sorin Rosca
Nicolae Craciunoiu
Leonard Ciurezu Gherghe
For the optimum setup of an industrial manufacturing process, it can be important to know the drilling forces and moments. In many cases, theoretical estimates are not accurate enough, especially when dealing with new materials, and experimental measurements are mandatory. This paper presents the design of a dynamometer comprising a one-spoked wheel elastic component to measure the drilling thrust force and the drilling moment. A finite element analysis was made, using Ansys software, to find the most favorable position for the strain gauges. One set of strain gauges was bonded to spokes to determine the torque, and a second set was bonded to the other two spokes to quantify the axial thrust force. After dynamometer manufacturing, a calibration operation is achieved, and tests are performed by measuring the drilling forces, thrust, and torque on American Iron and Steel Institute (AISI) 1020 steel. The analogue signals from the gauges were recorded using a computer with a data acquisition device. Tool wear is studied, and the results are presented in the paper. A good agreement between results from the literature and computations demonstrates the efficiency and accuracy of this measuring instrument.
- Article
(5376 KB) - Full-text XML
- BibTeX
- EndNote


An important aspect that is considered when designing machine tools and metal cutting processes is to establish the dependencies between the material cutting parameters such as speed, feed, depth of cut, and the cutting force (Karabay, 2007a).
Also, cutting force measurement is needed to study the physics of the material cutting process (Xie et al., 2017) to develop realistic cutting force mathematical models, machinability tests, tool geometry parameters optimization, and machine surface quality. A state-of-the-art method for measuring the cutting forces on a milling operation is presented by Totis et al. (2010) and Albrecht et al. (2005). The methods and devices used are classified by several criteria, namely the location of the sensing element and the physical principle used for cutting force measurement. Also, an important aspect that needs to be considered when designing a drill measuring dynamometer is the type of component to be measured by the device (Boopathi et al., 2013). With respect to the sensor location, the caption element can be inserted in the spindle subsystem, or it can be integrated on the machine's tool table. Development of an original innovative plate dynamometer intended for use in milling and drilling operations is presented by Totis et al. (2014).
Research concerning the monitoring of the tool wear, surface roughness, and chip formation is presented by Bhuiyan et al. (2014) and Chen and Liao (2003). The design specifications and testing of a four-component milling dynamometer are presented by Yaldiz et al. (2007).
In the paper of Venkataraman et al. (1965), the analysis and performance of a dynamometer is presented. This design considers a wheel with four spokes being stressed by the drill trust. Strain gauges are fixed on the spokes to measure torque and radial force. A turning dynamometer is presented in the paper published by Yaldiz and Ünsaçar (2006), which was designed to be able to measure static and dynamic cutting forces. The dynamometer elastic element is an octagonal ring. The strain gauge location for bonding is established to maximize sensitivity and to reduce cross sensitivity. The performance of a drilling dynamometer is tested in Karabay (2007b). Test results from drilling operations are used to establish empirical equations for drill torque and thrust.
In the literature, studies are presented concerning the design of dynamometers for milling operations (Korkut, 2003; Rizal et al., 2015; Subasi et al., 2018). Also, analytical finite element methods for computing thrust force and torque are used by Strenkowski et al. (2004), Yang and Sun (2009), and Gok et al. (2015). An experimental analysis of forces in the drilling of fiber-reinforced composites is studied by Lazar and Xirouchakis (2011), Valarmathi et al. (2013), Senthil Kumar et al. (2013), and Faraz et al. (2009). Drill wear studies and drill life prediction are presented in the research of Subramanian and Cook (1977). A drill wear mechanism, under dry machining conditions, is studied by Harris et al. (2003) and Ali Khan et al. (2019). Force sensor solutions used for drilling operations are presented by Byrne and O'Donnell (2007) and Osman et al. (1979). A performance analysis of octagonal ring force transducers is studied in the paper of Soliman (2005). Multi-axis dynamometers are studied by Korkmaz et al. (2014). Tool wear and chip formation, in case of carbon fiber, are studied by Senthil Kumar et al. (2013). Tool wear monitoring, using force signals, is studied by Lin and Ting (1995), Rosnan (2018), Ciurezu Gherghe et al. (2015), and Ertunc and Oysu (2004). Measuring the cutting forces is not recommended for use as a single criterion of machinability. Other important factors can be the tool wear, the shape of the chips, and their removal from the machine. For sintered materials, machining studies in drilling were usually performed in two different ways, either by measuring the cutting forces under constant feed or by maintaining the thrust force constant and measuring the resulting feed or drilling time. When comparing tool wear studies with cutting force studies at constant feed, the method based on cutting force is far less time consuming.
As the main factors affecting machinability are the workpiece material, cutting tools, and cutting parameters like feed and speed or, in turn, depth of cut, steel and sintered materials can be considered difficult to machine. Here, the porosity, microstructure, chemical composition, and technological cutting conditions can play important roles. For sintered parts, drilling is the most frequently applied machining operation (Ciolacu et al., 2005; Tsao and Hocheng, 2008; Liu et al., 2020).
The need to measure cutting forces arises from many factors, such as tool geometric parameters optimization and also correlation with the tool wear progress. Based on force variation, it is possible to achieve tool wear monitoring (Yaldiz and Ünsaçar, 2006; Ciurezu Gherghe and Dumitru, 2015).
The principle of dynamometer working is that the measured force components produce elastic deformations to a sensitive element; in our case, it is a four-spoked wheel elastic element (Geonea et al., 2018). Deformations are proportional to the value of the force, so if we quantify the specific deformations with strain gauge sensors, then it will be able to quantify the force.
This study outlines the development of a strain-gauge-based spoked wheel dynamometer for milling and drilling operations. The device is able to measure two force components, and the main application field is to measure the thrust and drill at mill and drill operations.
The cutting forces for drilling process are presented in Fig. 1. In order to experimentally quantify the drill process, a dynamometer capable of measuring two cutting force components for milling and drilling operations was designed by us and tested. Computer data acquisition software is also used for dynamometer calibration and data acquisition. The design of the dynamometer elastic element is presented in Fig. 2.
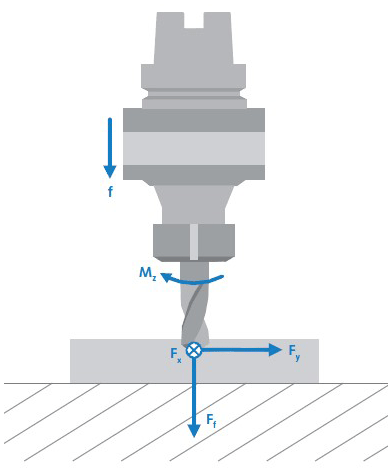
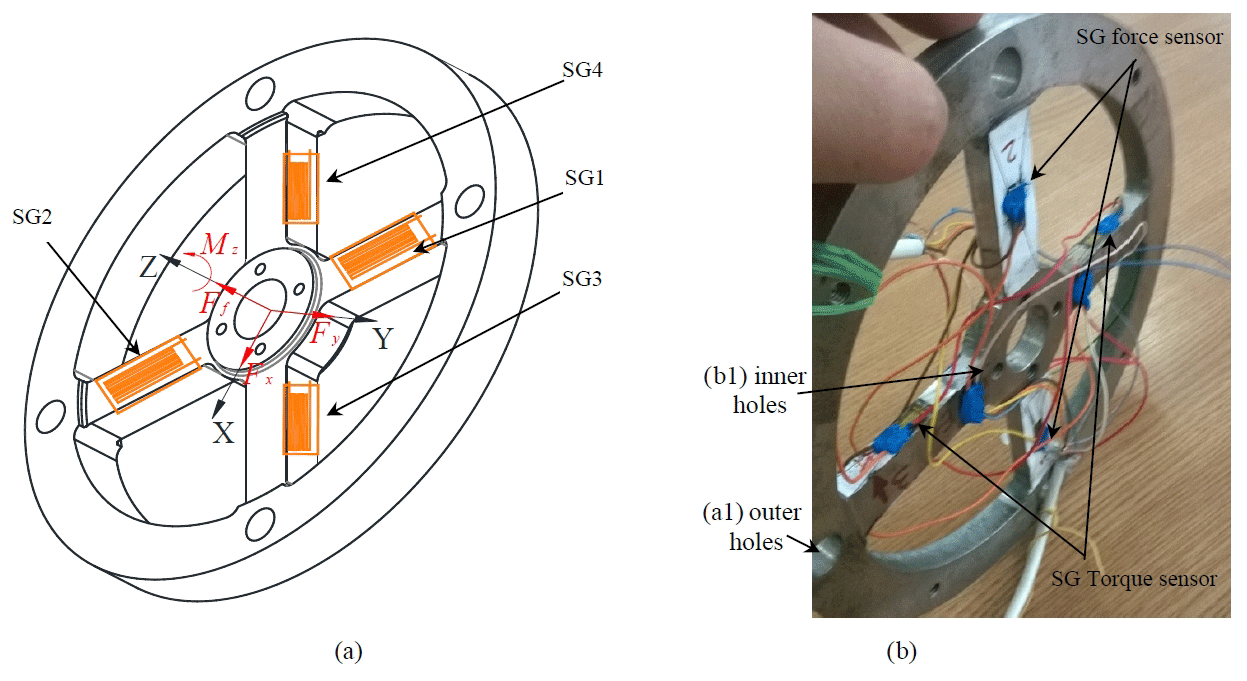
The dynamometer design must achieve two opposite characteristics, namely rigidity and sensitivity. The dynamometer must be suitable for dynamic loads, so the elastic element must be manufactured with accuracy and also high rigidity. The most-used design of dynamometers is strain gauge based, and the sensitive element uses the parallel beam, circular hole or piezoelectric type. Our designed dynamometer consists of a four-spoked wheel-type elastic element on which a strain gauge was bonded to the spokes, as presented in Fig. 2, with an electric connection to obtain a Wheatstone measuring bridge. The designed dynamometer is suitable for measuring axial force and torque simultaneously for different bore cutting processes, like drilling, boring, and counterboring. The solution adopted for the experimental setup was to mount the dynamometer directly onto the drilling machine table. The main advantage of this solution is the elimination of the rotating collector ring contacts for the signal transmission from the strain gauge transducers. The cutting forces act on the sensitive elastic four-spoked wheel element to which strain gauges are bonded. The dynamometer working principle is based on the measurement of the deformations of the spoked wheel's elastic element. The elastic element used is a spoked wheel designed and manufactured as shown in Fig. 2. Strain gauge sensors SG1 and SG2 are used to measure the drilling force Ff (Fig. 1). Strain gauge sensors SG3 and SG4 measure the deformations produced by the Mz drill torque. For a suitable design, the elastic element of the dynamometer shall be constructed with sufficient stiffness and machined with precision because it is subjected to dynamic loads. The strain gauges used are the HBM (Hottinger Baldwin Messtechnick) LY type with a 120 Ω electrical resistance. Strain gauges are bonded with elastic cyanoacrylate adhesive (Loctite 480). The strain gauge measuring grid is made of constantan, and the measuring grid support is made of polyamide. On the opposite sides of each spoke, two identical strain gauges are mounted to connect the strain gauge sensor to a full Wheatstone bridge mount. A total of two plates were designed to mount the spoked wheel (see Fig. 3) as follows:
-
a lower plate (1) through which the device is mounted on the table of the drilling machine with T-channel screws, and
-
a top plate (2) on which a universal fastener (3) is mounted.
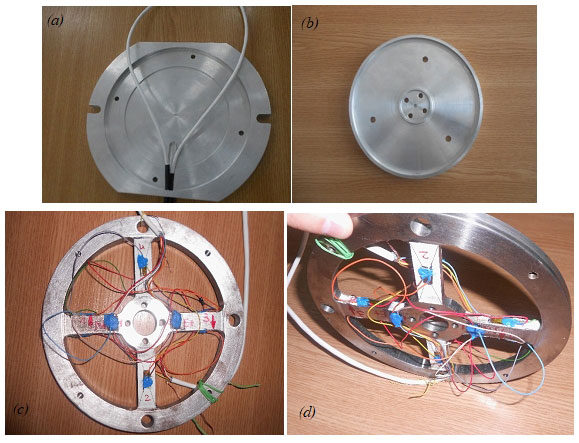
The elastic spoked element (3) is screwed onto the lower plate (1) in the outer holes (a1), as shown in Fig. 4. With the screws mounted in the inner holes (b1), the elastic element is attached to the upper plate (2). Under these conditions, the active loads from the drills are transferred through the universal device (4) to the center of the spoked wheel elastic element through the screws placed in threaded holes (b1). The elastic element is fixed on the bottom, on the outer side, with the base plate (1), using the screws in the holes (a1). Between plates (1) and (2) there is a gap of 1 mm; this allows the free deformation of the elastic element (3). The space is insulated with silicone rubber to prevent the coolant from reaching the strain gauge circuitry.
In Fig. 3, the virtual model of the measuring instrument is presented. The component elements were designed and manufactured based on the elaborated drawings. The purpose of the virtual model elaboration is for the optimization of the elastic spoked wheel. For this purpose, the spoked wheel has undergone a finite element analysis to determine the state of strain and deformation.
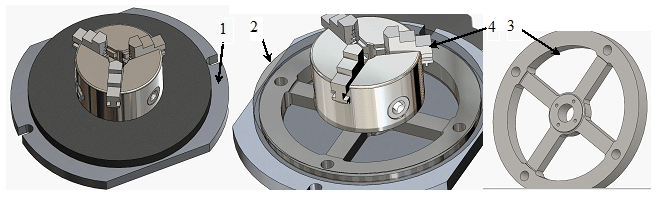
Based on optimized virtual model, the device components are manufactured and assembled. The dynamometer device's main components are presented in Fig. 4. Also, the arrangement of the force and torque transducers is presented in the next paragraph.
The main components of the dynamometer, according to Fig. 4, are as follows:
-
The base plate is shown in Fig. 4a. The four holes serve to clamp the spoked wheel, in the holes, to the outer part.
-
The top plate is shown in Fig. 4b. It is provided with two sets of holes. The first set of three equidistant holes serves to bolt the universal device. The other set of four holes serves to bolt the spike wheel into the holes.
-
The spoked wheel is shown in Fig. 4c and d. The strain gauges are glued to the wheel spokes, which measure the deformations produced by the bending as a result of the torque and the drilling force. In Fig. 4c, the sensors sensitive to the bending caused by the drilling force are visible, and in Fig. 4d sensors that detect deformations produced by the torque of drilling are visible.
Plates (1) and (2) are made of aluminum alloy, and the spoked wheel is made of alloy steel 2C45.
Inside the base plate (Fig. 5a), the wheel type's sensitive element is mounted with four screws. On the wheel, the transducers are glued in order to measure the axial force (as is presented in Fig. 4c) and the moment (Fig. 4d). The workpiece is clamped in the universal device and fixed with screws on the upper plate (Fig. 5b) which, in turn, is also attached to the elastic element with screws. The designed device brings, compared to previous achievements, the following as novelty elements:
-
It can simultaneously measure both the force and the torque, due to the mounting position of the strain gauges. Also, the two measurements are not affected by each other, i.e., the bending of the spokes produced by the measuring force does not produce recordings of the moment sensor and vice versa.
-
It has a construction that can be easily integrated on the machine tool table, with the base plate being provided with holes for mounting it with screws in the T channels of the machine tool table.
-
The construction is tight, and measurements can be made when cutting fluids are used.
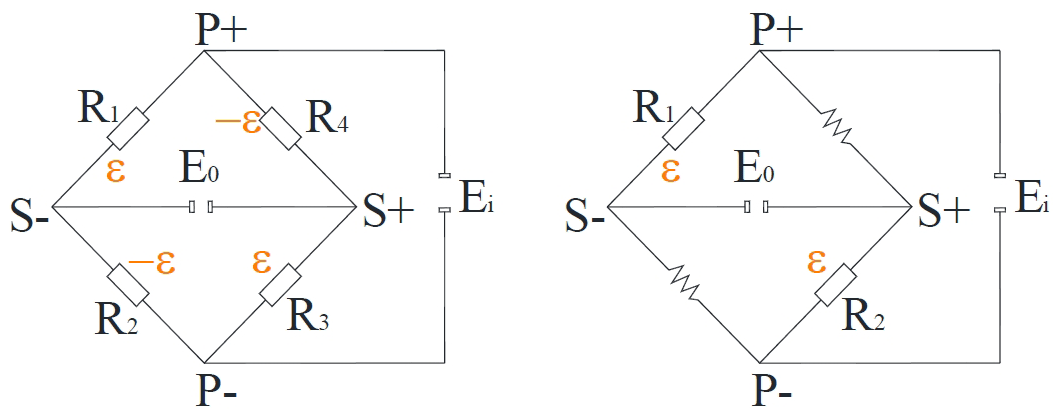
The position arrangement of the strain gauges and electric connections are described in Fig. 6. Our transducer will use a full Wheatstone bridge connection. For the half bridge configuration, only two strain gauges will be necessary.
The strain gauge bonded on the lower surface is positioned with the center under the gauge from the top surface. In this configuration, both strain gauges measure bending strains with equal magnitude and opposite signs. Any ohmic resistance changes in the strain gauges that are produced by the bending load will be canceled as a result of that configuration because two active strain gauges are positioned on adjacent arms of the electric Wheatstone bridge connection type. In a full bridge connection of four strain gauges, because the deformations produced by bending are equal in magnitude but opposite in sign, the bridge output voltage is double that produced by a single strain gauge with the same load. The electric circuit connection for half and complete Wheatstone bridges are presented in Fig. 7.

Figure 6Beam subjected to bending and strain gauge connections in half and complete Wheatstone bridges.
The elastic specific deformation is computed with Eq. (1).
Elastic specific deformations measured by the strain gauge are computed with Eq. (2).
where ΔR is the ohmic resistance variation, R is the initial ohmic resistance of the strain gauge, before the elongation occurs, in (Ω), k is the bridge factor, equal to two, for a strain gauge with constantan wire, ΔL is the elongation occurring because of the bending (in millimeters), L0 is initial length of the beam, and .
The output voltage of the Wheatstone bridge, from Fig. 7b, is computed with Eq. (3) as follows:
where E0 is the bridge output voltage (in volts), Ei represents the bridge excitation voltage, and R1, R2, R3, and R4 are the ohmic resistance of the strain gauges. Because the strain gauges have the same ohmic resistance, the output voltage is computed with Eq. (4).
For the beam loading, as in Fig. 6, the output voltage for the complete Wheatstone bridge configuration is , and for the half bridge connection it is .
Measuring the forces and moments in the drilling operations is important for the optimization of the geometry of the drill and the parameters of the cutting process. Also, some research shows that the cutting forces are correlated with the tool wear.
It is necessary to study the elastic four-spoked element with the finite elements method to verify the deformations and stresses that are produced by the maximum loads and determine if the deformations produced are within the elasticity limit of the material.
The steps taken to obtain the state of the stresses and deformations of the elastic element are described below. According to Fig. 8, the definition of the torsion moment is 2000 N mm, and the axial force is specified as being 5000 N.
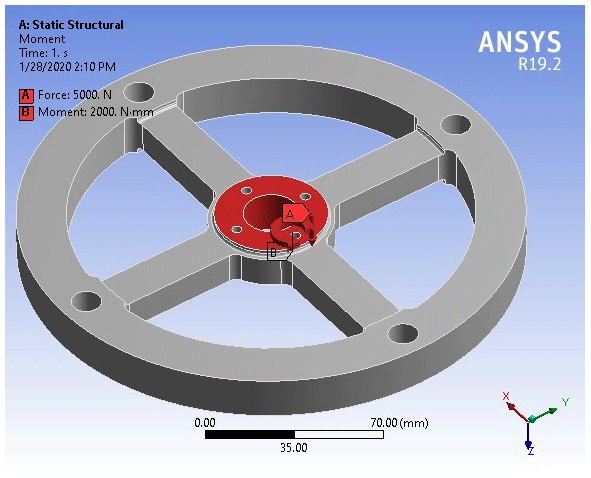
After defining the support conditions and the loads, the elastic element is discretized into finite elements, and the simulation with finite elements is run. The total resultant maximum deflection obtained have a value of 0.00076 mm per millimeter. The equivalent stress has a maximum value of 32.434 MPa, according to Fig. 9.
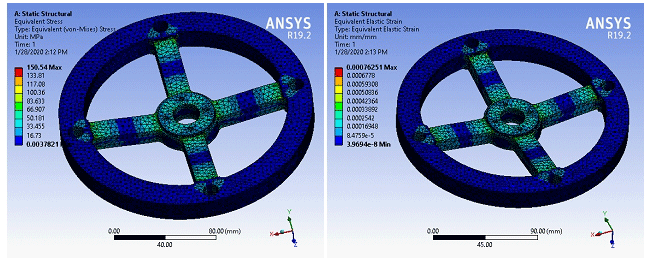
The maximum value of the mechanical stresses is in the connection area, with a value of 150.54 MPa. The most favorable position for gluing the strain gauges on the wheel spokes is in the central area because there the deformations have a constant distribution, and they do not show jumps as at the ends due to the presence of the stress concentrators. So, it is shown that it is best to stick the strain gauges outside the areas with stress jumps due to the presence of stress concentrators.
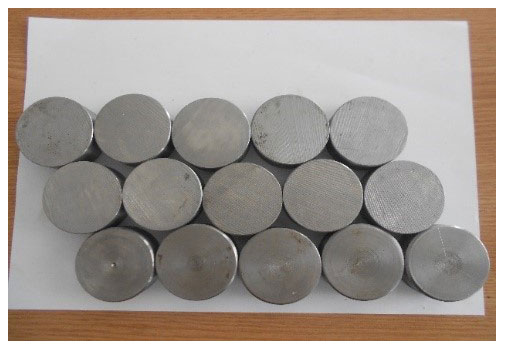
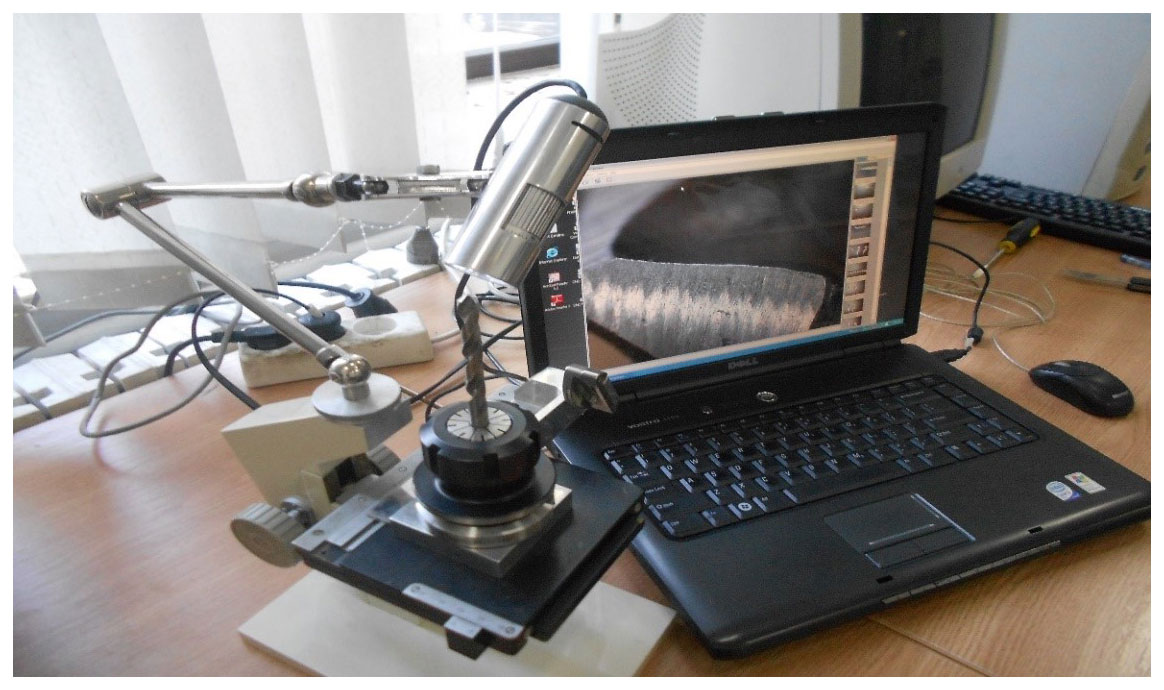
The experimental research will be carried out with equipment consisting of a YMC-1050 (Young Tech Advanced Co., Ltd., Taiwan) machining center, machined part, and a DigiMicro 2.0 microscope. The machined part used is a bar type, with a diameter of 47.6 mm from which 20 mm thick slices were cut, as seen in Fig. 10. The material of the part is X17CrNi16-2 stainless steel.
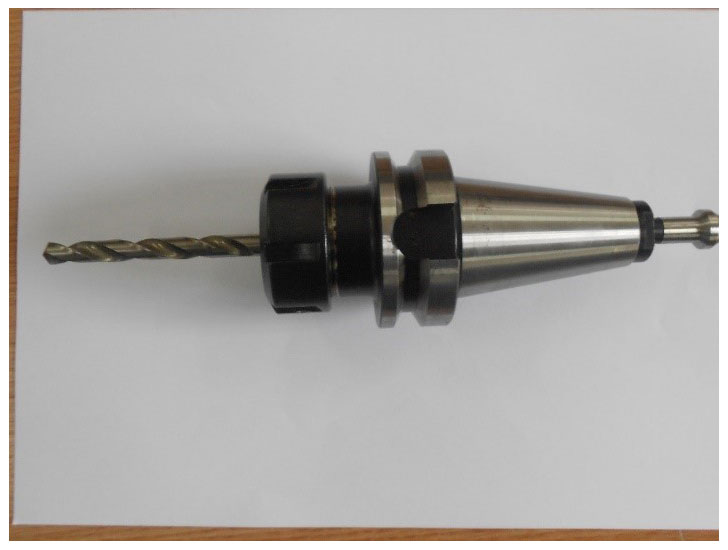
The fixing part of the drills may be conical, as shown in Fig. 11, or cylindrical, and the trainer may be missing. An 8 mm diameter steel drill bit from a Bosch drill kit (Fig. 11) will be used (Bosch HSS-G DIN 338 metal drill bit). The drill characteristics are as follows: work length – L1=75 mm; total length – L2=117 mm. The drill is attached to the holder, fitted with a BT-type cone, by means of an elastic bracelet, as shown in Fig. 11.
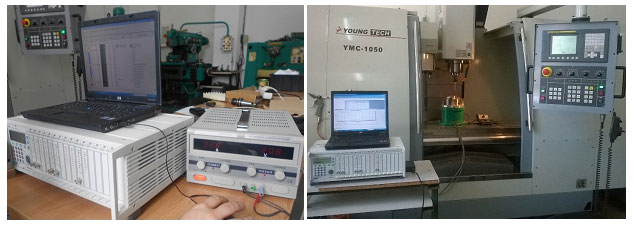
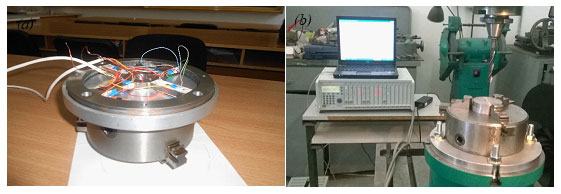
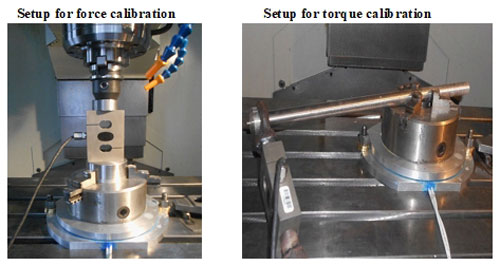
The software used for data acquisition is catman AP. The visualization of a working window with the acquisition software is shown in Fig. 12. To establish the linear correlation from the elastic deflection of the deformable four-spoked elastic element (4) and loads, the dynamometer was subjected to a calibration operation. The calibration is supposed to obtain an experimental correlation diagram between the applied exterior loads and registered elastic deformations. For that purpose, the deformations are registered with a high-performance measurement system (MGCplus produced by HBM), shown in Fig. 12. The calibration experimental setup, in order to obtain the calibration feature for the axial thrust and torque, is shown in Fig. 13. The principle used is to apply a measured axial force and torque and to register the specific deformations from the strain gauge transducers mounted on the wheel (4). Obtained dependencies are shown in Fig. 14.
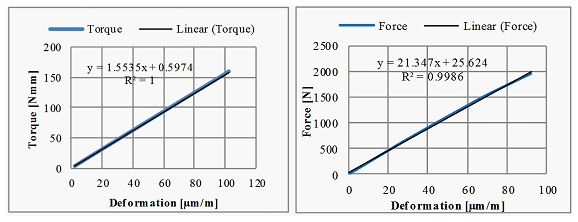
It can be observed that the obtained dependencies are linear, which demonstrates the correctness of the measurements made, the construction of the sensors, and the elastic spoked-wheel-type element. The limits of the device are given by the fact that the force and torque must be applied in the vertical direction. When an inclined load force or torque is applied, completely different forces appear in the wheel spokes.
For the study of the drill wear, when processing the proposed stainless steel (X17CrNi16-2) due to material considerations (quantity and shape of the semi-finished product), we will try to make as many holes as possible. Therefore, it was concluded that the best option, under the given conditions, is to work the holes with a diameter of 8 mm, on the surface of slices of semi-manufactured steel with a thickness of 20 mm so that we have as large an arrangement as possible to give the possibility of thermal influence when processing two adjacent holes. The drill wear is viewed with the DigiMicro 2.0 microscope. The software used is MicroCapture, as shown in Fig. 15.
Due to the many advantages that computer-assisted programming have, both in terms of drawing (computer-aided design – CAD) and, especially, processing simulations (computer-aided manufacturing – CAM), we will use the TopSolid program to model and perform the work program for the Young Tech machining center, YMC-1050, with which the practical part of the work will be realized.
Next is the creation of the semi-finished product, and for this, a new layer is activated. The values of the part incorporation are introduced, resulting in the final part and the necessary machined part (Fig. 16).

Figure 16TopSolid CAM modeling detail.
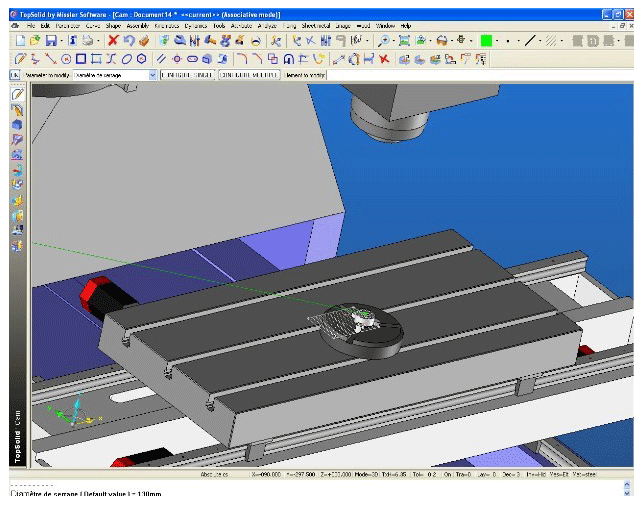
Figure 17Aspect of the machined part in TopSolid CAM.
The semi-finished product is brought into the chuck with three jaws (Fig. 16), and then the design of the technological process begins. It starts with the processing of holes; this entails a centering operation, which includes choosing the size and characteristics of the centering hole, and then a simulation of this operation.
The following operation is selected, namely the drill (Fig. 17), the type of the drill and its characteristics (Fig. 18), and, after specifying the cutting regime, a simulation of the processing is made (Fig. 19).
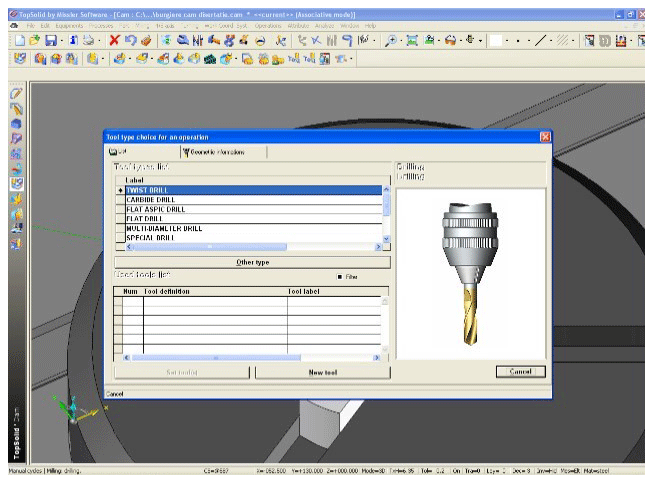
Figure 18TopSolid CAM tool parameters.
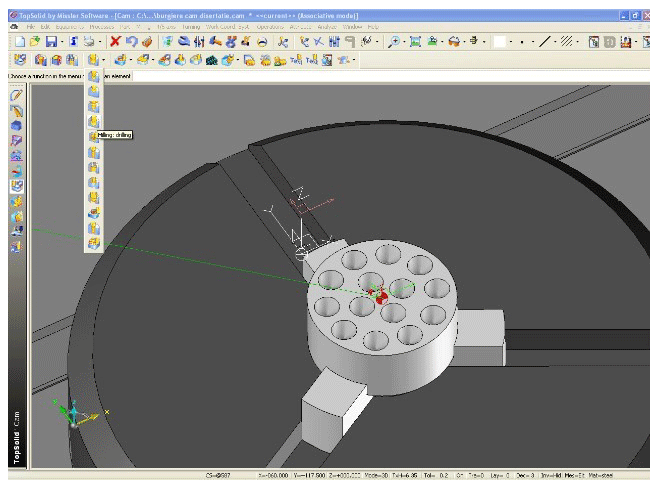
Figure 19Manufacturing simulation in TopSolid CAM.
The program obtained by using the TopSolid is presented in Appendix A.
As we have seen, the use of the cutting tool represents the set of complex actions and phenomena by which the tool loses its cutting properties.
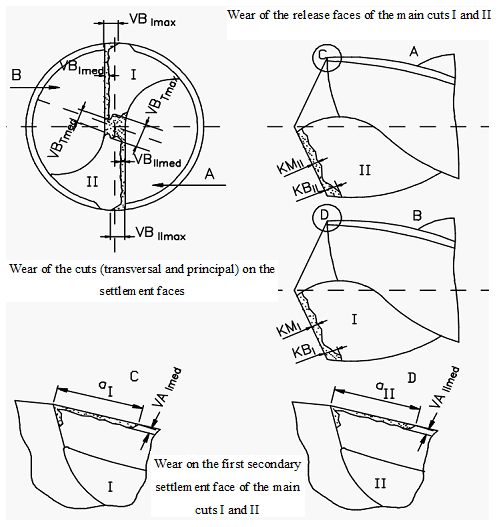
To create a more complete picture of the wear and the place of the manifestation of the wear, the types of drill wear are exemplified in Fig. 20.
As we have seen, during the machining process, a quantity of the tool material is removed. By appreciating this quantity, we can say what the size of the wear of the active part or the whole tool is. In this way, we appreciate its durability.
The parameters (criteria) for assessing the wear of the cutting tool are as follows:
-
VB – the width of the wear face on the main seat face;
-
VA – the width of the wear face on the secondary settlement face;
-
KT – the depth of the wear crater on the release face;
-
KM – the distance from the tip of the tool to the center of the crater;
-
KB – crater width;
-
KL – the distance from the tip of the tool to the origin of the crater;
-
b – the length of the wear face on the main seat face;
-
a – the length of the wear face on the secondary fitting face;
-
Vbmed – the average width of the wear face on the main settlement face;
-
Vamed – the average width of the wear face on the secondary settlement face;
-
Vbmax – the maximum width of the wear face on the main seat face;
-
Vamax – the maximum width of the wear side on the secondary side face;
-
– depth feature;
-
– surface feature.
The wear of the siding face appears in the form of a facet of the width, VB, which is parallel to the direction of the cutting edge. The cross-sectional profile of this facet corresponds to the shape of the machined surface, and the width is approximately constant. Near the peak (zone C) and near the initial surface of the semi-finished part (area limit N), the width of the side may increase.
The wear of the release face is due to the erosive effect of the chip in the form of a crater, arranged approximately parallel to the cutting edge. The position of the crater relative to the cutting edge of the tool is particularly important, and a crater placed farther from the cutting edge is less dangerous.
Due to the wear of the siding face, the tip of the tool changes its shape and position, which leads to diminished processing accuracy.
The wear of the cutting tool can also be appreciated by the total amount of material removed from the active side. In practice, the VB parameter is most often used, due to the ease with which it can be measured.
When establishing the cutting regimes, the recommendations of the tool manufacturer Walter AG were considered so that, depending on the material to be processed (i.e., X17CrNi16-2 stainless steel martensitic, ferritic, or annealed, with a hardness up to 200 HB), the type of drill bit (A1244, which has all the characteristics closest to the drill) with which the experiments would be carried out (without cover; peak angle of 130∘; total length 117 mm; active length 75 mm) was chosen (from the catalogue at https://www.technomarket.ro/; last access: 10 January 2020). A cutting speed of 11 m per minute and feed value of 0.094 mm per rotation are recommended by the tool manufacturer.
We will stop, due to material considerations, at a cutting speed of 13 m per minute and a feed value of 21 m per minute.
Knowing that the speed is calculated as follows:
where d is the diameter (millimeters) of the drill, and v is the cutting speed (meters per minute), we have the following:
It is chosen to have n=550 rpm with a feed of 0.16 mm revolutions per minute; therefore, for this regime, the feed rate at the machining tool is F=88 mm per minute.
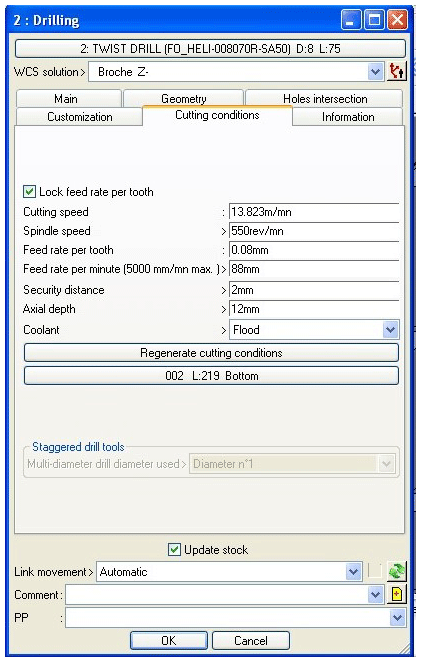
Figure 21Setting the drilling parameters.
The experimental data will be obtained using the following tests:
-
T1 with cutting regime – s=550 rpm, f=0.16 mm per rotation, and F=88 mm per minute;
-
T2 with cutting speed – s=836 rpm, f=0.16 mm per rotation and F=133.76 mm per minute;
-
T3 with cutting regime – s=836 rpm, f=0.08 mm per rotation and F=66.88 mm per minute;
-
T4 with cutting regime – s=550 rpm, f=0.08 mm per rotation and F=44 mm per minute.
We also specify that, for the speed of 836 rpm, the cutting speed is 21 m per minute.
The numerical control program is adjusted (i.e., the feed speed and feed rate F is introduced) on the machine each time when the cutting regime corresponding to the test performed is changed.
As we saw in this paragraph, the drill wear is measured on the siding face with parameter VB. Below, we will show, for each test separately, records for both the measured wear and for the forces and moments during drilling. The drill operation is stopped when the VB wear parameter reaches 0.2 mm.
All holes for first 14 drilled pieces (P1, P2, P3, P4, and P13) and the first two holes of part 14 are processed. It is evaluated that the VB parameter is the width of the wear face on the main seat face. Photographs of the wear progress are presented in Fig. 22.
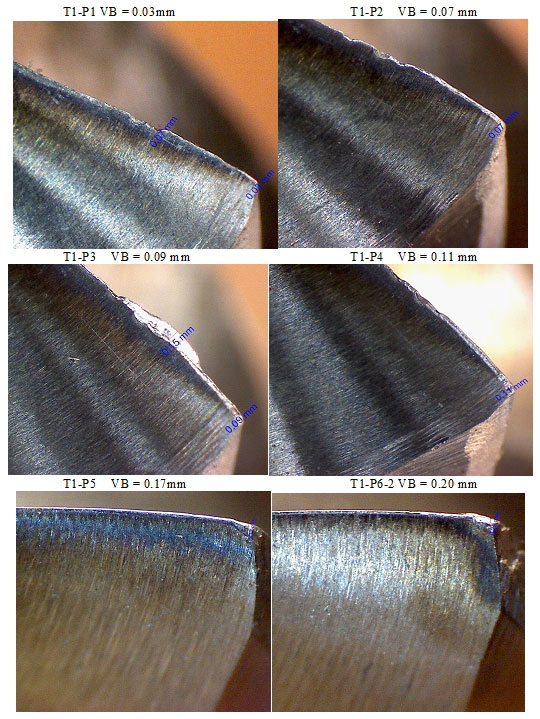
Depending on the number of holes drilled, until the target wear of 0.20 mm is reached, we can draw a wear graph based on the total length processed (Fig. 23).
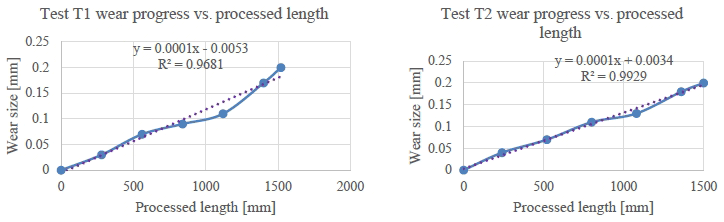
For the second test, T2, the wear evolution is presented in Fig. 23. The parameters used for the second test are as follows:
For the third test, T3, the cutting parameters are the following:
The wear is measured at the last seven holes (from pieces P6 and P9) and the first six holes of P10.
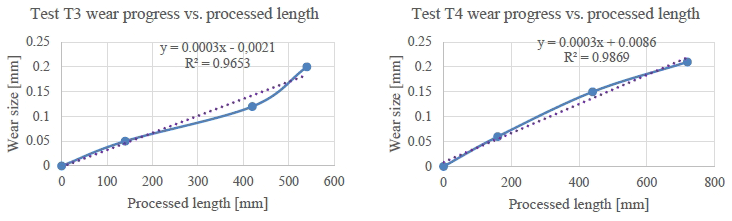
For the last test, T4, the cutting parameters are as follows:
The element of interest in the case of machining is the durability of the tool which, as we have seen in the previous paragraphs, is defined as being the time of use (minutes) of the tool until the first sharpening. Therefore, we will then calculate the durability of the drill for each test, depending on the total length of the drill, with a relation to the following form:
where L is the total length of the drills (in millimeters), and F is the feed rate (millimeters per minute).
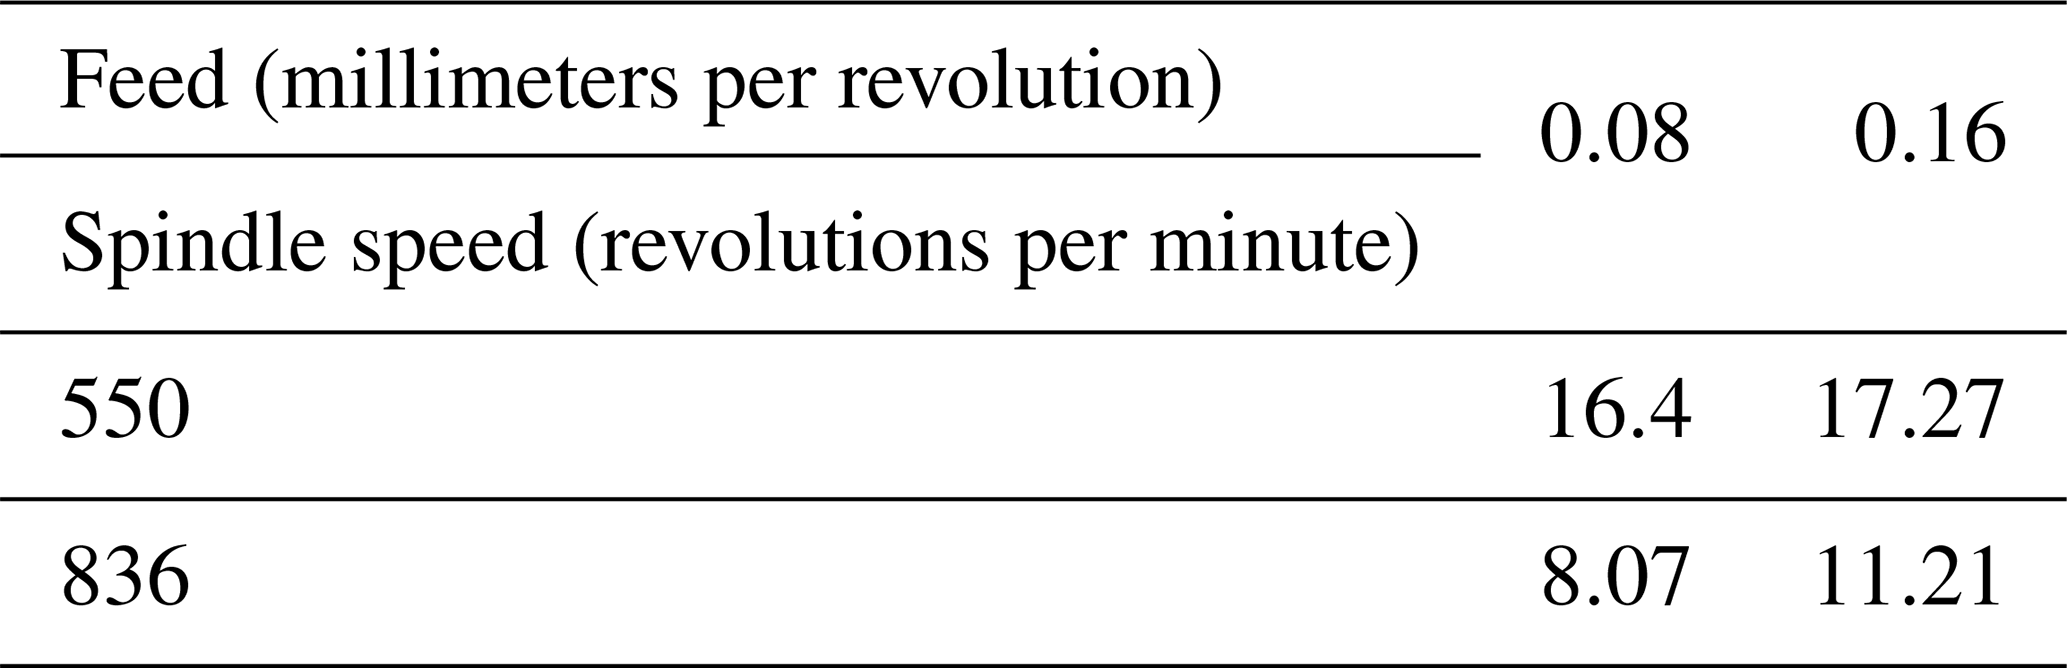
Therefore, we will have the computed tool durability for each four tests, as follows:
-
Test 1
s=550 rot per minute, f=0.16 mm per rotation, F=88 mm per minute, L=1520 mm, and the durability is as follows:
-
Test 2
s=836 rot per minute, f=0.16 mm per rotation, F=133.76 mm per minute, L=1500 mm, and the durability is as follows:
-
Test 3
s=836 rot per minute, f=0.08 mm per rotation, F=66.88 mm per minute, L=540 mm, and the durability is as follows:
-
Test 4
s=550 rot per minute, f=0.08 mm per rotation, F=44 mm per minute, L=720 mm, and the durability is as follows:
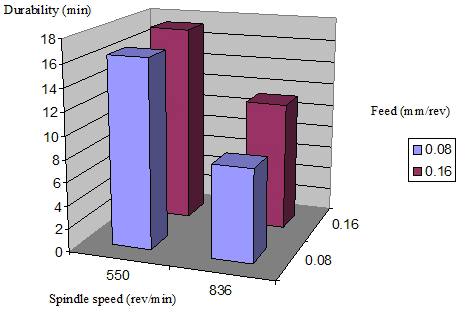
The durability written in Table 1 is according to the working regime shown.
The graphical representation of the durability is shown in Fig. 25.
We present some of the processed parts and the resulting chip shapes in Fig. 26.
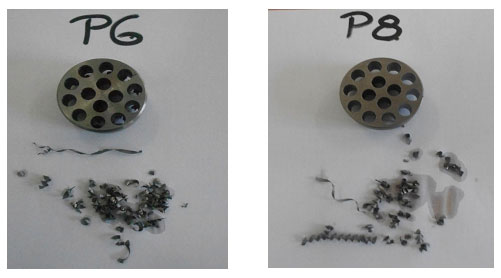
It is observed that, when processing the parts 1 and 2 with regime T1, we have several continuous chips.
In part 6 with the intense regime (low feed rate), the chips appear fragmented and dark in color, and there is an elongated chip which ends with a welding point, which leads us to think that there was a bonding on the cutting edge. At piece 8 where the feed rate is high, continuous chips are fragmented but light in color.
We will insert some measurements made for the axial force and moment, as shown in Fig. 27.
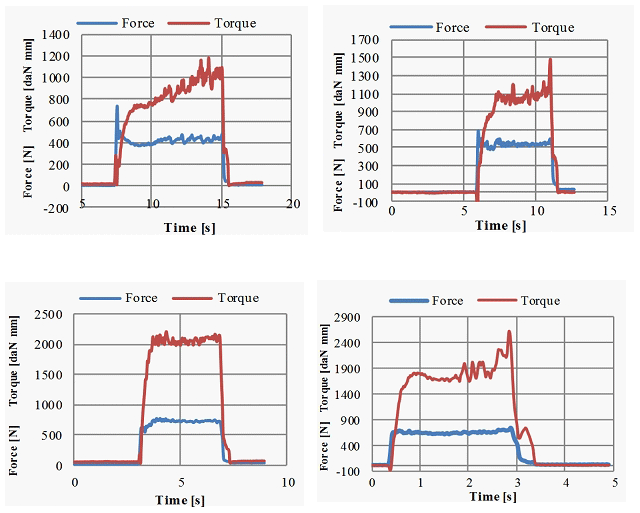
The proposed parameters to be measured are the drilling force and drilling torque. The graphical results obtained for the feed force and drilling torque are presented in Fig. 27. The unprocessed results obtained are the specific deformations from the bonded strain gauge sensors, which are given in micrometers per meter. The data are imported into the Excel program and, taking into account the calibration diagram coefficients for each transducer presented in Fig. 14, are computed and represented in the drilling parameters. The first graphical representation corresponds to the first feed rate (0.08 mm per rotation), and the hole is machined in 8.5 s. The feed force is around 400 N, and the drill torque is from 800 to 1200 daN mm. The next graphical representations correspond to a hole machined with an increased feed rete (0.16 mm per rotation); this is the reason for an increased value for the measured parameters. For this cutting regime, the measured parameters are increased, the feed force reaches 700 N, and the drilling torque is 1900–2000 daN mm. The twisting torque increases as wear progresses. This is explained by the fact that the cutting edge registers a greater friction with the processed material, and the removal of chips is more difficult.
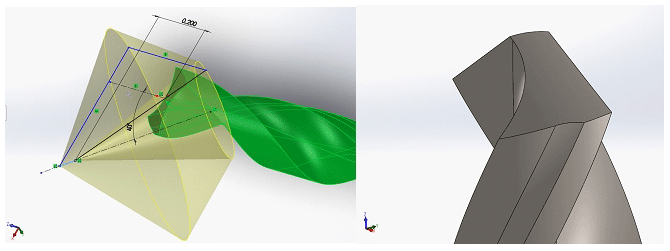
To perform the analysis of the stress state of the drill, we performed an analysis in the Ansys module called Explicit Dynamics. Particular attention is paid to the drill geometry modeling. The drill is modeled according to the tool standards, with a tip angle of 120∘. The mode of the embodiment of the cutting edge of the drill shown in Fig. 28.
The geometry modeled in SolidWorks, as shown in Fig. 29, is imported into the program Ansys Workbench, as shown in Fig. 30. The settings are adjusted for a high-speed drill of steel-type material, using the characteristics from Ansys database, and for a piece of stainless-steel material.
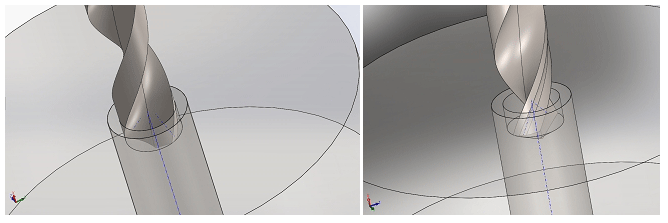
To achieve the discretization in Ansys, the sweep method and the use of hexahedral elements are specified, as shown in Fig. 30. The specifications of the contour conditions and the loads are shown in Fig. 31. For this simulation, we specified that the base surface of the part is fixed, and the upper surface of the drill only allows rotation after the z axis. The specified drill speed is 600 rpm, and the feed is 0.08 mm per revolution.


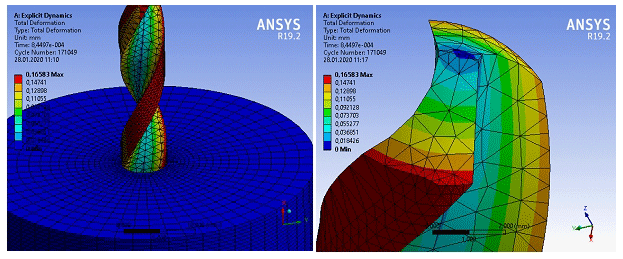
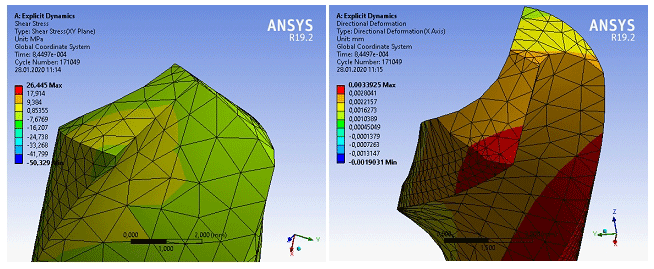
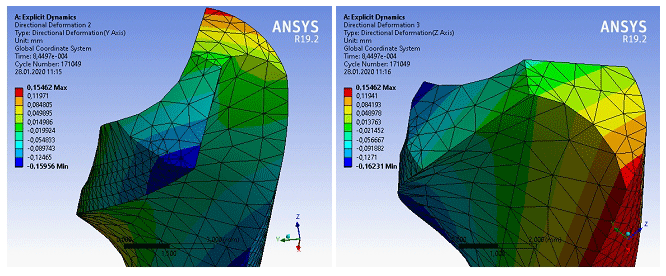
The distribution of the elastic deformation is obtained, as shown in Fig. 32. The maximum value is recorded at the top of the main cut as 0.1558 mm. The shear stress distribution is presented in Fig. 33. Also, the directional deformation results are presented in Fig. 34. From the finite element analysis, it is observed that the maximum stress during the drilling process is at the top of the main cutting edge.
First of all, it should be specified that the purpose of the work was achieved, with a fairly wide range of measurements, which allowed us to obtain conclusive data regarding the influence of the cutting regime parameters on the wear of the high-speed steel material of the drill when processing the stainless steel X17CrNi16-2. The results of the measurements on the wear were also reinforced by the analysis of the forces and moments as an element of additional interest.
As can be seen from the used cutting regime (from the experimental program used), the one that offers the highest durability is the one for which we have a low speed (S=550 rpm) and feed f=0.16 mm per rotation.
Because, when drilling, the parameters of the cutting regime are as follows:
-
the cutting depth (millimeters) which is equal to half the diameter of the drill (which does not change),
-
the feed (millimeters per rotation), and
-
the speed (rotations per minute).
The latter two may vary, so a complete factorial 22 EFC experimental program was used.
The CAD/CAM TopSolid program was used to perform the numerical control program and the processing on the YMC-1050 center.
As an element of interest, the device for measuring the forces and moments was constructed, and its recordings further highlighted the influence of the cutting regime on the wear.
The particular case with the detachment on the front of a piece of material raises the following problems, where
-
either the regime used is inadequate,
-
the tool used is not well chosen or has possible defects, or
-
there is another phenomenon.
The following was observed (under the microscope, as shown in Fig. 22):
-
The cut of the newly used drill is not rectilinear, as it has a pronounced portion, even in the area where the material detachment takes place later (after part 12 drilling).
Thus, the following conclusions can be drawn:
-
The cutting regime has a special influence on the drill wear; its durability can have significantly different values from one regime to another.
-
The material used in the experiment, X17CrNi16-2 stainless steel, despite being a martensitic steel, has a good workability when using a fast steel drill.
-
The best durability is obtained when using a low speed and high feed rate.
-
Due to the relatively low values of the tool's durability and the relatively high probability of problems, it is necessary to choose the type of tool used.
-
The paper uses the experimental program with two influencing factors, namely speed and advancement.
-
If the reporting is made relative to the amount of material removed, the best behavior is obtained at the low speed and high feed rate regime.
-
The paper tested the device presented above for situations where the measured parameters are not influenced by the position of the holes.
Thus, we have the following program:
| % |
| O5558 (Drill CAM Research) |
| G0 G40 G80 G90 G98 |
| T2 M6 |
| G57 G90 |
| M3 S900 |
| (TIP DRILL FO_POIN-010020R-SA50) |
| G0 X0 Y17.8 |
| G43 Z10. H1 M8 |
| (WCS PART 1) |
| Z2. |
| G81 Z-4. R2. F180 |
| X-10.463 Y14.401 |
| X-16.929 Y5.501 |
| Y-5.501 |
| X-10.463 Y-14.401 |
| X0 Y-17.8 |
| X10.463 Y-14.401 |
| X16.929 Y-5.501 |
| Y5.501 |
| X10.463 Y14.401 |
| X0 Y7.3 |
| X7.3 Y0 |
| X0 Y-7.3 |
| X-7.3 Y0 |
| G80 |
| G0 Z10. M9 |
| T18 M6 |
| G57 G90 |
| M3 S550 |
| (TWIST DRILL FO_HELI-008070R-SA50) |
| G0 X0 Y17.8 |
| G43 Z10. H18 M8 |
| Z2. |
| G81 Z-22. R2. F88 |
| X-10.463 Y14.401 |
| X-16.929 Y5.501 |
| Y-5.501 |
| X-10.463 Y-14.401 |
| X0 Y-17.8 |
| X10.463 Y-14.401 |
| X16.929 Y-5.501 |
| Y5.501 |
| X10.463 Y14.401 |
| X0 Y7.3 |
| X7.3 Y0 |
| X0 Y-7.3 |
| X-7.3 Y0 |
| G80 |
| G0 Z100. M9 |
| G53 Z0 |
| G53 Y0 |
| M30 |
| % |
All data used in this paper can be obtained from the corresponding author on request.
IDG and LCG conceived the presented idea, performed the experiment, and wrote the article. ASR and NC performed the simulation, provided guidance, and improved the paper. All of the authors approved the final article for publication.
The authors declare that they have no conflict of interest.
This paper was edited by Peng Yan and reviewed by three anonymous referees.
Albrecht, A., Park, S. S., Altintas, Y., and Pritschow, G.: High frequency bandwidth cutting force measurement in milling using capacitance displacement sensors, Int. J. Mach. Tool. Manu., 45, 993–1008, 2005.
Ali Khan, M., Jaffery, S. H. I., Khan, M., Younas, M., Butt, S. I., Ahmad, R., and Warsi, S. S.: Statistical analysis of energy consumption, tool wear and surface roughness in machining of Titanium alloy (Ti-6Al-4V) under dry, wet and cryogenic conditions, Mech. Sci., 10, 561–573, https://doi.org/10.5194/ms-10-561-2019, 2019.
Bhuiyan, M. S. H., Choudhury, I. A., and Dahari, M.: Monitoring the tool wear, surface roughness and chip formation occurrences using multiple sensors in turning, J. Manuf. Syst., 33, 476–487, 2014.
Boopathi, M., Shankar, S., Manikandakumar, S., and Ramesh, R.: Experimental investigation of friction drilling on brass, aluminium and stainless steel, Procedia Engineer., 64, 1219–1226, 2013.
Byrne, G. and O'Donnell, G. E.: An integrated force sensor solution for process monitoring of drilling operations, CIRP Ann.-Manuf. Techn., 56, 89–92, 2007.
Chen, Y. C. and Liao, Y. S.: Study on wear mechanisms in drilling of Inconel 718 superalloy, J. Mater. Process. Tech., 140, 269–273, 2003.
Ciolacu, F. G., Gruionu, L., and Craciunoiu, N.: Measuring of Drilling Forces Using a Strain Gage Based Dynamometer, European Congress and Exhibition on Powder Metallurgy, European PM Conference Proceedings, Vol. 3. The European Powder Metallurgy Association, Prague, Czech Republic, ISBN: 978-189907218-7, 239–244, 2005.
Ciurezu Gherghe, L. M. and Dumitru, N.: Experimental research regarding forces and moments which appear at processing X17CRNI16-2 martensitic stainless steel, Fiability & Durability Supplement No 1/ 2015, Publishing House “Academica Brâncuşi”, Târgu Jiu, Romania, pp. 123-128, ISSN 1844-640X, available at: https://www.utgjiu.ro/rev_mec/mecanica/pdf/2015-01.Supliment/4.pdf (last access: 2 March 2021), 2015.
Ciurezu Gherghe, L. M., Stanimir, A., and Geonea, I.: Experimental research regarding the influence of cutting regime on the wear of drills at steel processing, Fiability & Durability Supplement No 1/2015, Publishing House “Academica Brâncuşi”, Târgu Jiu, Romania, 118–122, ISSN 1844-640X, available at: https://www.utgjiu.ro/rev_mec/mecanica/pdf/2015-01.Supliment/4.pdf (last access: 2 March 2021), 2015.
Ertunc, H. M. and Oysu, C.: Drill wear monitoring using cutting force signals, Mechatronics, 14, 533–548, 2004.
Faraz, A., Biermann, D., and Weinert, K.: Cutting edge rounding: An innovative tool wear criterion in drilling CFRP composite laminates, Int. J. Mach. Tool. Manuf., 49, 1185–1196, 2009.
Geonea, I., Rosca, A., and Rinderu, P.: Design, Development and Testing of a Dynamometer for Drill Force Measurement, in: New Advances in Mechanism and Machine Science, Springer, Cham, 487–495, 2018.
Gok, A., Gok, K., and Bilgin, M. B.: Three-dimensional finite element model of the drilling process used for fixation of Salter–Harris type-3 fractures by using a K-wire, Mech. Sci., 6, 147–154, https://doi.org/10.5194/ms-6-147-2015, 2015.
Harris, S. G., Doyle, E. D., Vlasveld, A. C., Audy, J., and Quick, D. A study of the wear mechanisms of Ti1− xAlxN and Ti1− x− yAlxCryN coated high-speed steel twist drills under dry machining conditions, Wear, 254, 723–734, 2003.
Karabay, S.: Analysis of drill dynamometer with octagonal ring type transducers for monitoring of cutting forces in drilling and allied process, Mater. Design, 28, 673–685, 2007a.
Karabay, S.: Performance testing of a constructed drilling dynamometer by deriving empirical equations for drill torque and thrust on SAE 1020 steel, Mater. Design, 28, 1780–1793, 2007b.
Korkmaz, E., Bediz, B., Gozen, B. A., and Ozdoganlar, O. B.: Dynamic characterization of multi-axis dynamometers, Precis. Eng., 38, 148–161, 2014.
Korkut, I.: A dynamometer design and its construction for milling operation, Mater. Design, 24, 631–637, 2003.
Lazar, M. B. and Xirouchakis, P.: Experimental analysis of drilling fiber reinforced composites, Int. J. Mach. Tool. Manuf., 51, 937–946, 2011.
Lin, S. C. and Ting, C. J.: Tool wear monitoring in drilling using force signals, Wear, 180, 53–60, 1995.
Liu, Q., Huang, G., and Xu, Y.: Investigation of drilling 2D Cf/C–SiC composites with brazed diamond core drills, Mech. Sci., 11, 349–356, https://doi.org/10.5194/ms-11-349-2020, 2020.
Osman, M. O. M., Xistris, G. D., and Chahil, G. S.: The measurement and stochastic modelling of torque and thrust in twist drilling, Int. J. Prod. Res., 17, 359–376, 1979.
Rizal, M., Ghani, J. A., Nuawi, M. Z., and Haron, C. H. C.: Development and testing of an integrated rotating dynamometer on tool holder for milling process, Mech. Syst. Signal Pr., 52, 559–576, 2015.
Rosnan, R., Azmi, A. I., and Murad, M. N.: Effects of Cutting Parameters on Tool Wear and Thrust Force in Drilling Nickel-Titanium (NiTi) Alloys Using Coated and Uncoated Carbide Tools, Key Engineering Materials, 791, 111–115, https://doi.org/10.4028/www.scientific.net/kem.791.111, 2018.
Senthil Kumar, M., Prabukarthi, A., and Krishnaraj, V.: Study on tool wear and chip formation during drilling carbon fiber reinforced polymer (CFRP)/titanium alloy (Ti6Al4 V) stacks, Procedia Engineer., 64, 582–592, 2013.
Soliman, E.: Performance analysis of octal rings as mechanical force transducers, Alexandria Engineering J., 54, 155–162, 2015.
Strenkowski, J. S., Hsieh, C. C., and Shih, A. J.: An analytical finite element technique for predicting thrust force and torque in drilling, Int. J. Mach. Tool. Manuf., 44, 1413–1421, 2004.
Subasi, O., Yazgi, S. G., and Lazoglu, I.: A novel triaxial optoelectronic based dynamometer for machining processes, Sensor. Actuat. A-Phys., 279, 168–177, 2018.
Subramanian, K. and Cook, N. H.: Sensing of drill wear and prediction of drill life, J. Eng. Ind., 99, 295–301, 1977.
Totis, G., Wirtz, G., Sortino, M., Veselovac, D., Kuljanic, E., and Klocke, F.: Development of a dynamometer for measuring individual cutting edge forces in face milling, Mech. Syst. Signal Pr., 24, 1844–1857, 2010.
Totis, G., Adams, O., Sortino, M., Veselovac, D., and Klocke, F.: Development of an innovative plate dynamometer for advanced milling and drilling applications, Measurement, 49, 164–181, 2014.
Tsao, C. C. and Hocheng, H.: Evaluation of thrust force and surface roughness in drilling composite material using Taguchi analysis and neural network, J. Mater. Process. Tech., 203, 342–348, 2008.
Valarmathi, T. N., Palanikumar, K., and Latha, B.: Measurement and analysis of thrust force in drilling of particle board (PB) composite panels, Measurement, 46, 1220–1230, 2013.
Venkataraman, R., Lamble, J. H., and Koenigsberger, F.: Analysis and performance testing of a dynamometer for use in drilling and allied processes, Int. J. Mach. Tool D. R., 5, 233–261, 1965.
Xie, Z., Lu, Y., and Li, J.: Development and testing of an integrated smart tool holder for four-component cutting force measurement, Mech. Syst. Signal Pr., 93, 225–240, 2017.
Yaldız, S. and Ünsaçar, F.: Design, development and testing of a turning dynamometer for cutting force measurement, Mater. Design, 27, 839–846, 2006.
Yaldız, S., Ünsaçar, F., Sağlam, H., and Işık, H.: Design, development and testing of a four-component milling dynamometer for the measurement of cutting force and torque, Mech. Syst. Signal Pr., 21, 1499–1511, 2007.
Yang, Y. and Sun, J.: Finite element modelling and simulating of drilling of titanium alloy, in: ICIC'09, Second International Conference on Information and Computing Science, 21–22 May 2009, Manchester, UK, 4, 178–181, 2009.
- Abstract
- Introduction
- Design and manufacturing of a dynamometer for drilling
- Finite element analysis of the elastic wheel type element with spokes
- Experimental setup
- Experimental results
- Ansys simulation of the drill cutting deformation
- Conclusions
- Appendix A
- Code and data availability
- Author contributions
- Competing interests
- Review statement
- References