the Creative Commons Attribution 4.0 License.
the Creative Commons Attribution 4.0 License.
 | 24 Nov 2021
Characteristics of the Received Signal of an Ultrasonic Sensor Installed in a Chamber with Micro-Leakage
Wonjun Seo
Seokyeon Im
As fossil fuel depletion and environmental pollution problems are becoming increasingly more serious, interest in the efficient use of natural resources and alternative energy is rapidly growing. In particular, interest in fuels stored as high-pressure gases such as natural gas and hydrogen is also rising. Ultrasonic waves show various received signals according to characteristics such as density of the medium and acoustic impedance. An experimental study on the detection of the micro-leakage of fuel stored as high-pressure gas was conducted based on the characteristics of ultrasonic waves. First, an ultrasonic sensor was manufactured by selecting the matching layer with consideration of the acoustic impedance. In the experiment, a mass flow controller (MFC) was attached to a perforated hole in the fabricated chamber to generate micro-leakage, and the signal from the receiving ultrasonic sensor was then collected. The envelope signal of the received ultrasonic sensor signal was analyzed through the Gaussian distribution method. The temperature inside the chamber and the received voltage decreased according to a similar trend and showed a nonlinear result. However, the phase of the received ultrasonic sensor signal showed a relatively linear result according to the internal pressure change. Micro-leakage could not be detected with only the received voltage seen by the ultrasonic sensor. Therefore, the phase shift of the receiving ultrasonic sensor can be used to detect micro-leakage in a high-pressure gas tank.
- Article
(1108 KB) - Full-text XML
- BibTeX
- EndNote


In recent years, problems such as environmental pollution and the exhaustion of petroleum resources have been emerging around the world. As a part of efforts to address these problems, studies have been conducted on thermal efficiency and the emission characteristics of hydrogen/compressed natural gas mixture (HCNG) spark-ignition engines (Ma et al., 2007), and comparative studies have been conducted on compressed natural gas with direct injection (CNG-DI), compressed natural gas with bi-fuel direct injection (CNG-BI), and gasoline with port injection (gasoline-PI) engines (Kalam and Masjuki, 2011). As evidenced by the aforementioned studies, interest in and research on natural gas and alternative energy are increasing rapidly. Among natural resources, natural gas has the same thermal efficiency as fossil fuels and causes less pollution (Hesterberg et al., 2008). In addition, among alternative energies, hydrogen does not emit pollutants such as carbon dioxide, and there is specific interest in fuels stored in gaseous form (Jacobson et al., 2005). Natural gas has a high calorific value and has the advantage of low emissions of particulate matter (PM), nitrogen oxides (NOx), and carbon dioxide (CO2). In addition, as its octane number is high, the power can be improved by increasing the compression ratio compared to general gasoline engines. Natural gas is classified according to the storage type: compressed natural gas (CNG) compressed and stored at 200–500 bar, liquefied natural gas (LNG) stored in a liquid state, and adsorbed natural gas (ANG) that is compressed and stored at 30–60 bar in an adsorbent. Among them, CNG is actively applied and widely used in vehicles (Aslam et al., 2006). In the case of hydrogen fuel cells, they have already been incorporated into vehicles and commercialized and are receiving attention for reducing environmental pollution. Fuel cells are capable of high-efficiency power generation by using electrical energy generated through the reaction of hydrogen and oxygen, and unlike conventional petroleum fuels, they do not generate exhaust gas, thus mitigating air pollution. For this reason, fuel cells are a suitable eco-friendly energy source (Hames et al., 2018). The above two energy sources are both stored in gaseous form in a storage tank at high pressure and are used as fuel. In the case of hydrogen, it is compressed to 700–800 bar in the storage tank, while CNG is compressed to 200 bar (Veiga et al., 2010). However, in terms of public perception, these two energy sources are highly recognized as flammable gases with a higher risk of explosion compared to existing petroleum resources (Li et al., 2018; Liu et al., 2020). The currently applied high-pressure gas tank micro-leakage detection system relies on the use of a pressure sensor attached to the regulator of the fuel line. This measurement method has a disadvantage that errors occur according to changes in the surrounding environment. Therefore, in order to address the negative perception, it is necessary to present a reliable and accurate measurement method rather than a method of indirectly detecting micro-leakage caused by a pressure change.
Ultrasound has various reception characteristics depending on the density and acoustic impedance of the measurement medium, and, on the basis of these characteristics, it is widely used in communication devices, medical devices, actuators, transducers, precision sensors, nondestructive testing (NDT), and measuring devices (Vellekoop, 1998; Choi et al., 2020). In addition, it has been used in structural health monitoring (SHM) systems (Guo et al., 2020), liquid level monitoring systems (Gao et al., 2020), early crack detection of structural systems (Chakraborty et al., 2019), and gas leak location detection systems (Wang et al., 2018). In this paper, an experimental study was conducted to analyze the characteristics of ultrasonic waves for the measurement of micro-leakage in a high-pressure gas tank instead of the conventional pressure sensor.
Waves are generated by elasticity against compression deformation of the particles constituting the medium through physical vibration, and this is called a sound wave. Sound waves can be classified into longitudinal waves, transverse waves, coda waves (vibration that persists for a long time even after the arrival time of the surface wave), and surface waves according to the direction of vibration. In addition, they can be classified into three ranges according to the frequency. Vibration frequencies below 20 Hz are defined as low frequencies, vibration frequencies in the 20 Hz–20 kHz range are defined as audible frequencies that humans can hear, and frequencies above 20 kHz are defined as ultrasonic (Cheeke, 2017). Ultrasonic waves carry wave energy, and phenomena such as dispersion and diffraction occur. In addition, in the process of being transferred to another medium, some energy may be lost and attenuation may occur. Ultrasonic waves move similarly to light waves, but, unlike light waves that can move in a vacuum, an elastic medium is required (Sharma et al., 2017). In order to artificially generate ultrasonic waves, a sound-emitting body with a high frequency is required. The sound-emitting body uses the electrical properties of an object to apply a high-frequency alternating voltage to both ends of the object to generate ultrasonic waves through the vibration of the object. Currently, the most commonly used sound-emitting body is lead zirconate titanate made by mixing lead titanate (PbTiO3) and lead metaniobate (PbNb2O6) in a certain ratio and sintering it at a high temperature; the resultant product is called PZT (Furukawa et al., 1979). PZT causes a direct piezoelectric effect that transforms mechanical energy into electrical energy as well as a converse piezoelectric effect that transforms electrical energy into mechanical energy, and mutual conversion is also possible. Ultrasound experiences energy loss due to scattering and absorption as it passes through the medium. Scattering mainly occurs at the interface between a solid medium and a gaseous medium when there is a defect inside the material constituting the ultrasonic sensor. In addition, loss occurs as part of the vibration energy that is converted into heat energy during the transfer of ultrasonic energy (Khimunin, 1972).
The piezoelectric element and the matching layer are the key factors of ultrasonic sensors. Alvarez-Arenas (2004) investigated the requirements to select the material of the piezoelectric element laminated layer. It was found that the selection of materials with high porosity and fine pores and the thickness of the matching layer affect the performance of the ultrasonic sensor. Kim et al. (2019) and Kim and Lee (2019) conducted a study on the envelope signal change of the received signal according to the composition of the matching layer and the mixing ratio of the air methane mixture and obtained results showing that an ultrasonic sensor can be used to measure the mixing ratio of the mixed gas. In addition, through the relationship between the piezoelectric element and the matching layer, the resonance frequency was confirmed using the impedance curve; their results showed that the frequency range changed according to the adhesive hardness of the matching layer. Sonoyama et al. (2010) tried to detect the mixing rate of hydrogen and air by using the difference in the sound velocity between hydrogen and air and developed an ultrasonic sensor with a very fast response rate of 84 ms to measure the sound travel time between the transmitting and receiving ultrasonic sensors. It has been experimentally verified that an ultrasonic sensor can detect hydrogen concentrations as low as 100 ppm at room temperature. Qian et al. (2020) proposed an ultrasonic sensor using an electromechanical analogy and argued that the selection of a frequency with parallel resonance frequency and maximum phase shift provides excellent performance including linearity.
In the literature studies on the selection of an optimal matching layer for the use of ultrasonic waves for gaseous medium measurement are dominant. However, relatively few studies on situations where flow exists inside the chamber, such as micro-leakage, have been reported. Therefore, in this study, basic research was carried out in the state where there was flow inside a chamber by generating micro-leakage. The results of the study were analyzed to assess the relationship between the temperature and the voltage inside the chamber. In addition, the ultrasonic envelope signal underwent curve fitting and was applied to micro-leakage detection for a pressure gas tank and verified experimentally.
2.1 Experimental setup
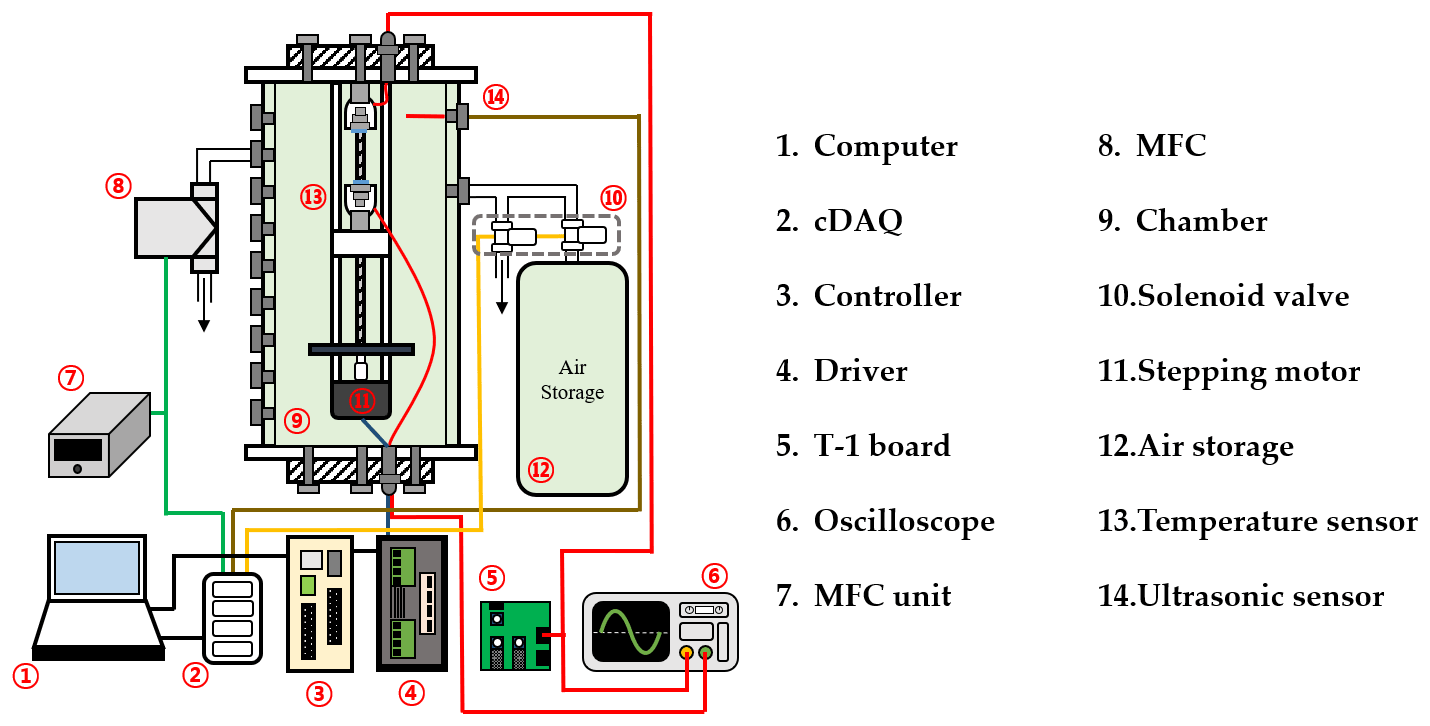
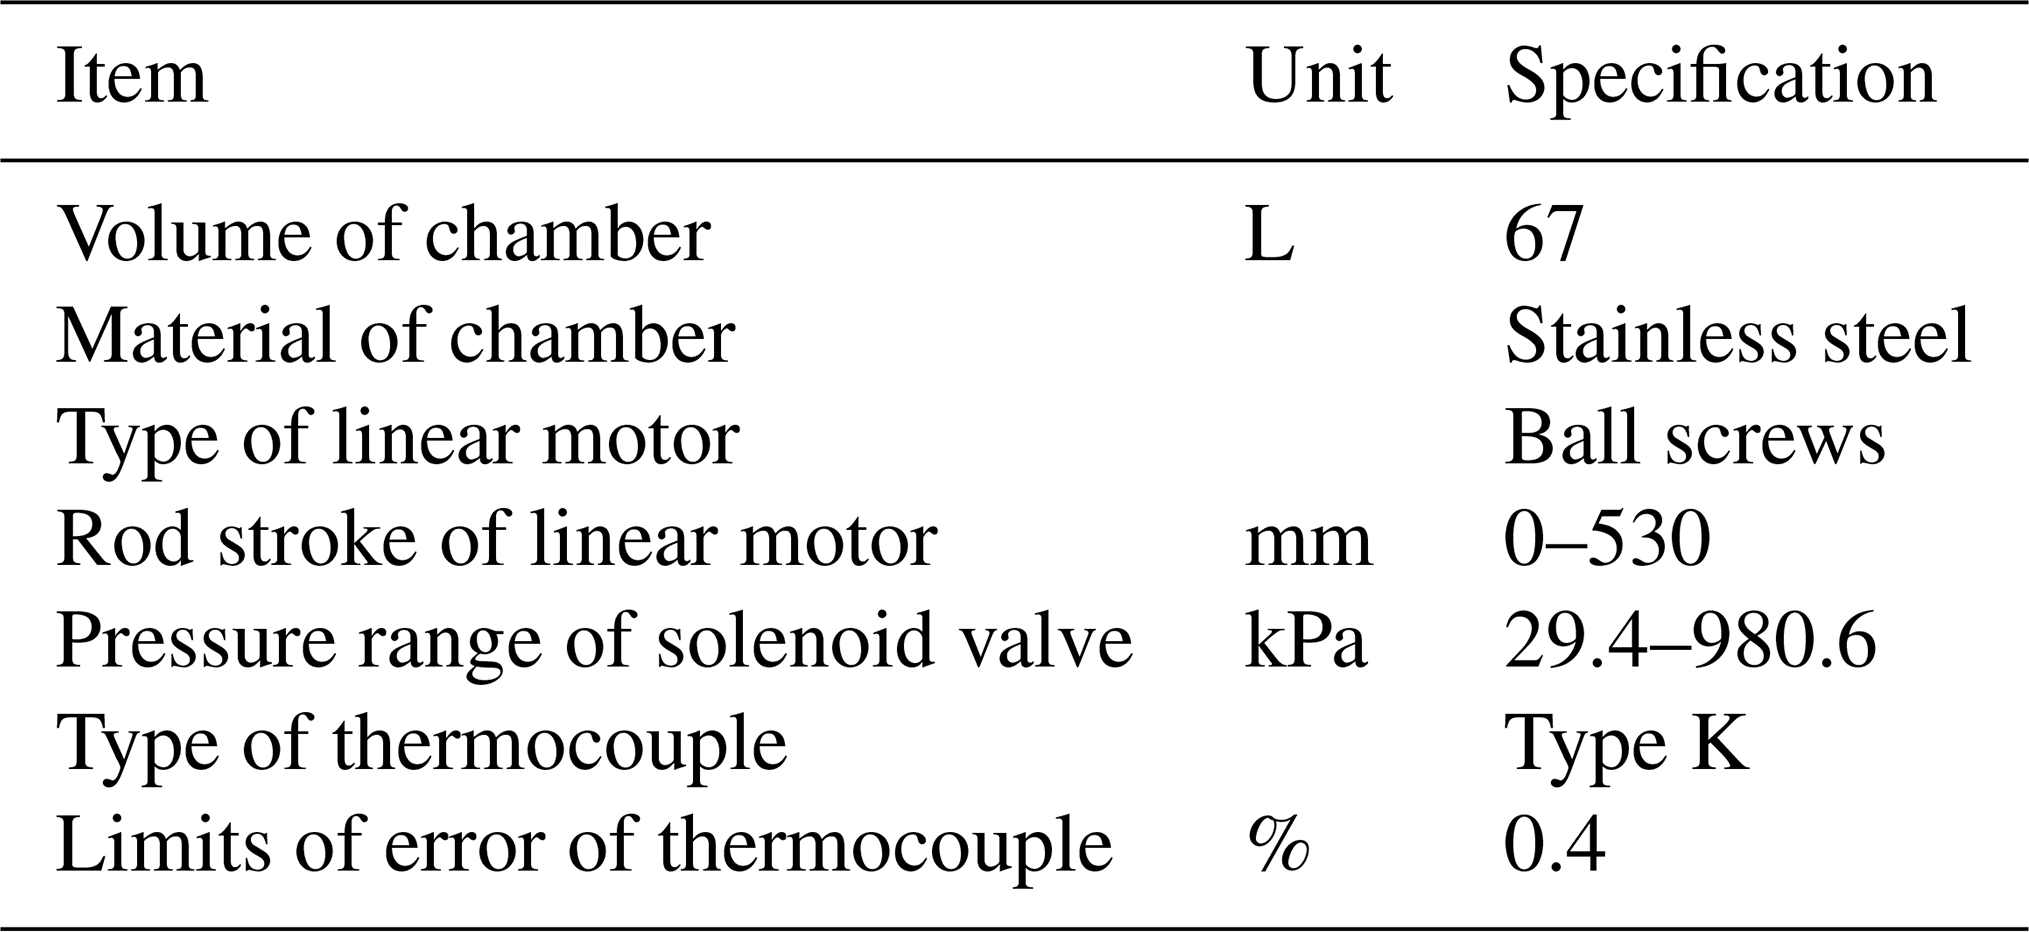
Figure 1 shows a schematic diagram of the experimental apparatus used in this study, and Table 1 shows the specifications of the experimental setup. In this study, as shown in no. 14 of Fig. 1, the method of attaching an ultrasonic sensor inside the chamber was used. In addition, as shown in no. 9, it was manufactured with a volume of 67 L, focusing on the capacity of the currently used type-4 tank (tank made of nonmetallic liner and carbon fiber composite material). In order to generate micro-leakage, the side of the chamber was drilled to make a in. fitting thread. To investigate the characteristics of the ultrasonic signal according to the location of micro-leakage, a total of five holes were drilled at intervals of 140 mm from the upper part of the chamber to 700 mm. As shown in no. 11 of Fig. 1, a ball-screw-driven linear motor was attached inside the chamber to control the distance between the transmission and reception sensors. As shown in no. 8, micro-leakage was controlled by a mass flow controller (MFC) using a hole drilled in the side of the chamber. In order to fill the chamber with compressed air with an initial charging pressure of 5 bar, as shown in no. 10, a solenoid valve used for charging and discharging was implemented to be charged according to the specified pressure capacity, and a thermocouple was installed to monitor the chamber temperature conditions, as in no. 13. The filling pressure data were collected using a pressure sensor (Sensys PTDH0030BCIA-FC). As shown in no. 2 of Fig. 1, all controls except the ultrasonic sensor were controlled using DAQ (data acquisition device) (NI cDAQ 9263, 9215, 9203, 9213), and, as shown in no. 5, the ultrasonic sensor was controlled using the transceiver module (Airmar T1 board). The signal from the receiving ultrasonic sensor was collected using an oscilloscope, as in no. 6.
2.2 Design of ultrasonic sensor
Ultrasonic waves experience a loss of energy due to scattering and absorption during the process of being transmitted through the medium and have characteristics of transmitting and reflecting in the boundary layer between media having different acoustic impedances. Accordingly, in the design of an ultrasonic sensor, the selection of a matching layer in consideration of acoustic impedance is an important factor.
Acoustic impedance refers to a property that hinders the propagation of sound waves (Fatemi and Greenleaf, 1998). Acoustic impedance is calculated by multiplying the density of a material by the speed of sound, given as follows (Tone et al., 1985):
where ZL is the acoustic impedance (MRayl), ρ (g cm3) is the density, and C (mm s−1) is the sound velocity.
When ultrasonic waves radiate from the boundary layer of a medium, transmission and reflection occur, which are determined by the difference in impedance between two different media. The reflection coefficient and transmission coefficient are calculated by the following equation (Pedersen et al., 1982) by the acoustic impedance:
where Pi,w is the incident wave sound pressure, Pr,w is the reflected wave sound pressure, T is the transmission coefficient, R is the reflection coefficient, and Z1 and Z2 are the acoustic impedances of layers 1 and 2, respectively.
The structure of the ultrasonic sensor mainly consists of two matching layers to increase the frequency bandwidth. Therefore, the sound wave passing through the first matching layer in the PZT passes through the first matching layer again at the interface of the second matching layer and returns.
When the transmission coefficient transmitted from the PZT to the first matching layer is T1 and when the transmission coefficient returned from the interface of the second matching layer is T2, then the reciprocating transmission coefficient Tr is calculated as follows (Pedersen et al., 1982):
As outlined above, ultrasonic waves experience energy loss due to transmission and reflection according to the acoustic impedance of the matching layer. Therefore, in this study, CW (chemical wood, SP-170) mixed with acetic acid, alcohol, synthetic resin, artificial wood, and carbonized acetone was used as the first matching layer. As the second matching layer, an EVA (ethylene-vinyl acetate) copolymer was used in which ethylene and vinyl acetate monomers were copolymerized.
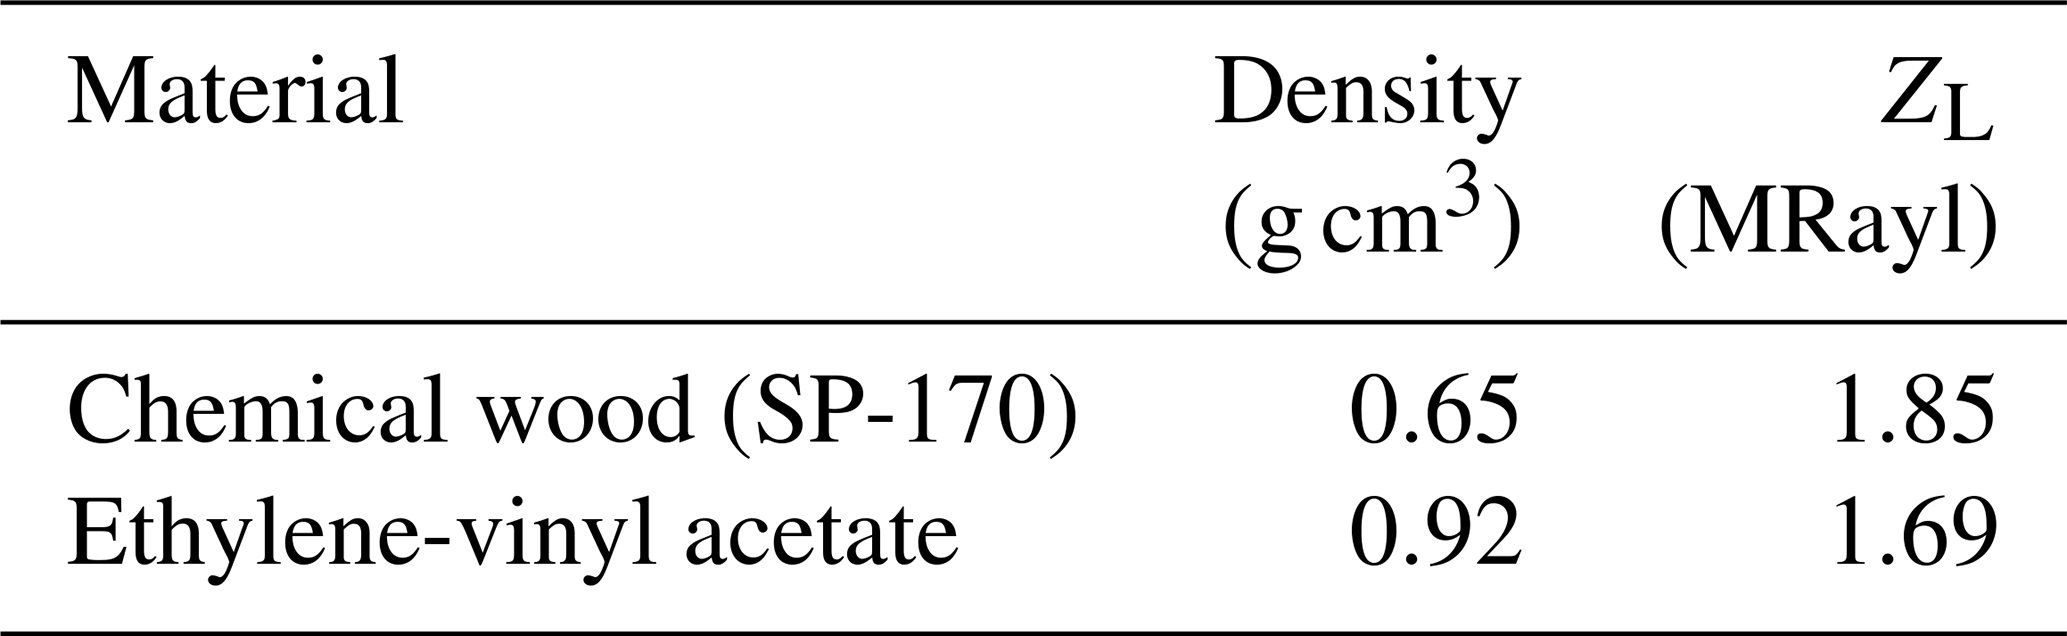
Figure 2 schematically illustrates the structure of the ultrasonic sensor used in this study. The first matching layer and the second matching layer were attached in the direction of the radial plane of the PZT. The PZT generates vibration energy while repeating deformation and restoration when AC voltage is applied to both ends; thus, it generates ultrasonic waves in the direction opposite to the radiation surface as well as in the direction of the radiation surface. If ultrasonic waves generated in the opposite direction of the radiation surface are not absorbed, noise is increased due to vibration inside the sensor, making it difficult to obtain reliable results. Therefore, for the ultrasonic sensor fabricated in this study, a backing layer was constructed by stacking cork and rubber in a layer opposite to the radiation surface.
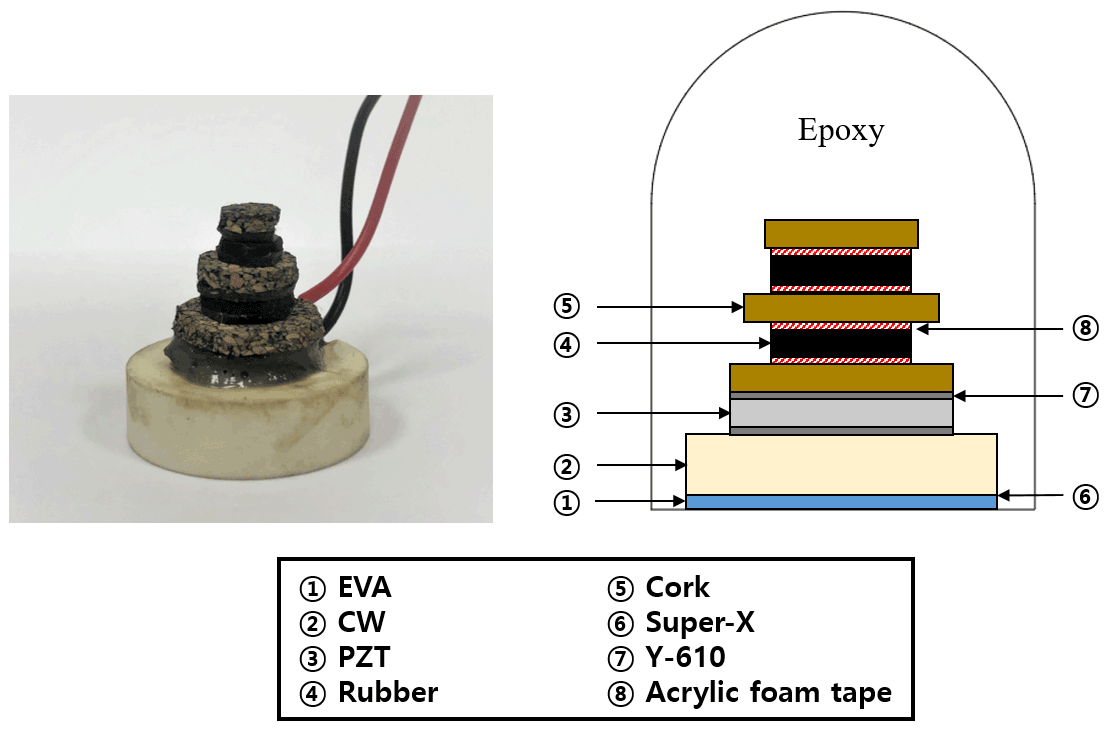
In addition, in order to protect the PZT under external environmental conditions, epoxy, which has elasticity even after curing, was molded inside the housing of the sensor.
2.3 Uncertainty analysis
Factors that can indicate the uncertainty of the ultrasonic signal include the temperature of the measurement medium, noise other than the measurement frequency, and an inappropriate signal post-processing process. The temperature of the measurement medium can affect the sound velocity of the ultrasonic waves. The velocity of sound in air is given by the following equation (Kim, 2019):
where VS is the speed of sound (m s−1), and TC is the temperature of the medium (∘C).
Looking at Eq. (5), it can be seen that the velocity of sound of ultrasonic waves is affected by the temperature of the medium, and the speed of velocity increases as the temperature increases. According to Eq. (5), it can be seen that the velocity of sound decreases by about 0.18 % for every 1 ∘C decrease in temperature. This reduction in the velocity of sound may cause uncertainty in the ultrasound signal.
Other factors that can indicate uncertainty are noise and signal post-processing, which will be discussed in detail in the sections below.
2.4 Filter for analysis of received signal
Ultrasonic waves pass through the medium from the transmitting sensor and transmit wave energy to the receiving sensor. Unnecessary signals also occur during this process. Therefore, in order to check the frequency of the desired region without distortion, it is necessary to remove the frequency region received as a noise signal. Therefore, in this paper, we used a normal band-pass filter that blocks frequencies outside the range between fcl (cutoff frequency lower) and fch (cutoff frequency higher) in order to filter out general low-frequency noise (Wang et al., 2021).
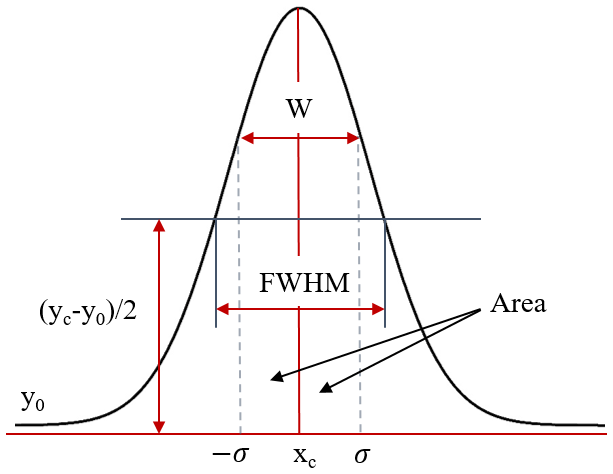
The purpose of the analysis was to consider all the characteristics of the received ultrasonic sensor envelope signal, such as the maximum received voltage, increasing area, decreasing area, and tail area. Therefore, in this study, the envelope signal was analyzed using a Gaussian distribution, which is mainly used to analyze the probability distribution of signal change, as shown in Fig. 3, and the equation (Kim et al., 2019) given below is applied:
where y0 is the basic data value obtained through the experiment, A is defined as the area for the normal distribution, σ is the standard deviation, xc is the center of the x axis of the data, yc is the center of the y axis of the data, and w is the value obtained by dividing the FWHM (full width at half maximum) by the square root of the natural logarithm of 4.
2.5 Experimental method
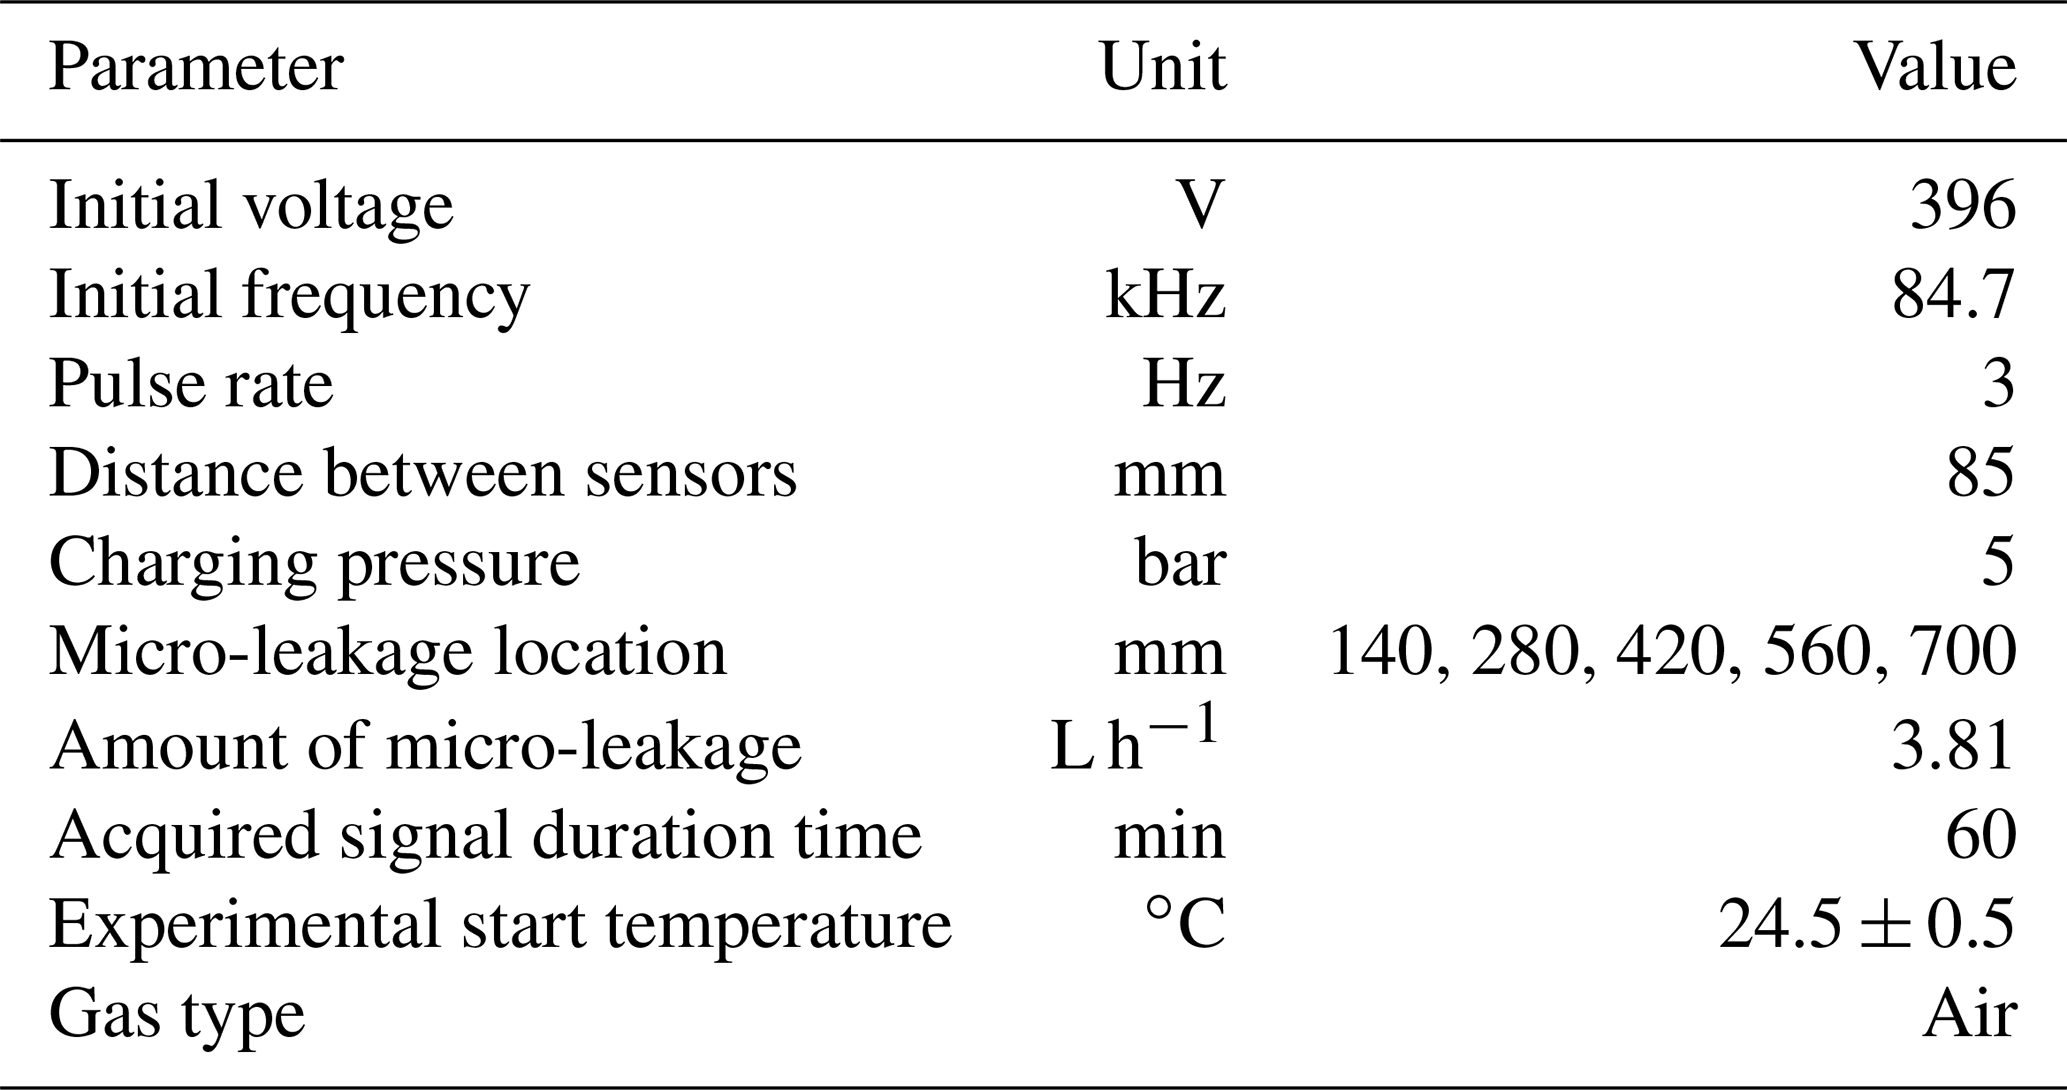
In order to conduct an experimental study on the applicability of measuring the micro-leakage of high-pressure gas fuel using an ultrasonic sensor, an experiment was conducted using a method of attaching an ultrasonic sensor to the inside of the manufactured chamber. The experimental conditions are listed in Table 3. Through a preliminary experiment, it was confirmed that the PZT showed smooth reception sensitivity at a frequency of 84.7 kHz. Based on this, the experiment was carried out by fixing the frequency at 84.7 kHz, and the micro-leakage locations were set at intervals of 140 mm from the top of the chamber using holes drilled in the chamber. The amount of micro-leakage was fixed at 3.81 L h−1 by controlling the how much the valve of the MFC was opened.
3.1 Relationship of received ultrasonic sensor maximum voltage with gas temperature in chamber
Figure 4 shows the temperature variations of the gas inside the chamber due to micro-leakage and the maximum voltage of the receiving ultrasonic sensor. The lower the air temperature in the chamber is, the slower the sound velocity is, and, as wave energy is transmitted through the vibrations of the particles constituting the medium, the attenuation of the amount of energy transmitted varies according to the density of the gas. The results of the experiment reveal that the temperature inside the chamber decreased from 24 to 22 ∘C. The maximum reception voltage of the receiving ultrasonic sensor showed a similar tendency to the decline in temperature inside the chamber due to micro-leakage. From the results of repeated experiments, the error range of the temperature sensor and the ultrasonic sensor was within 5 %.
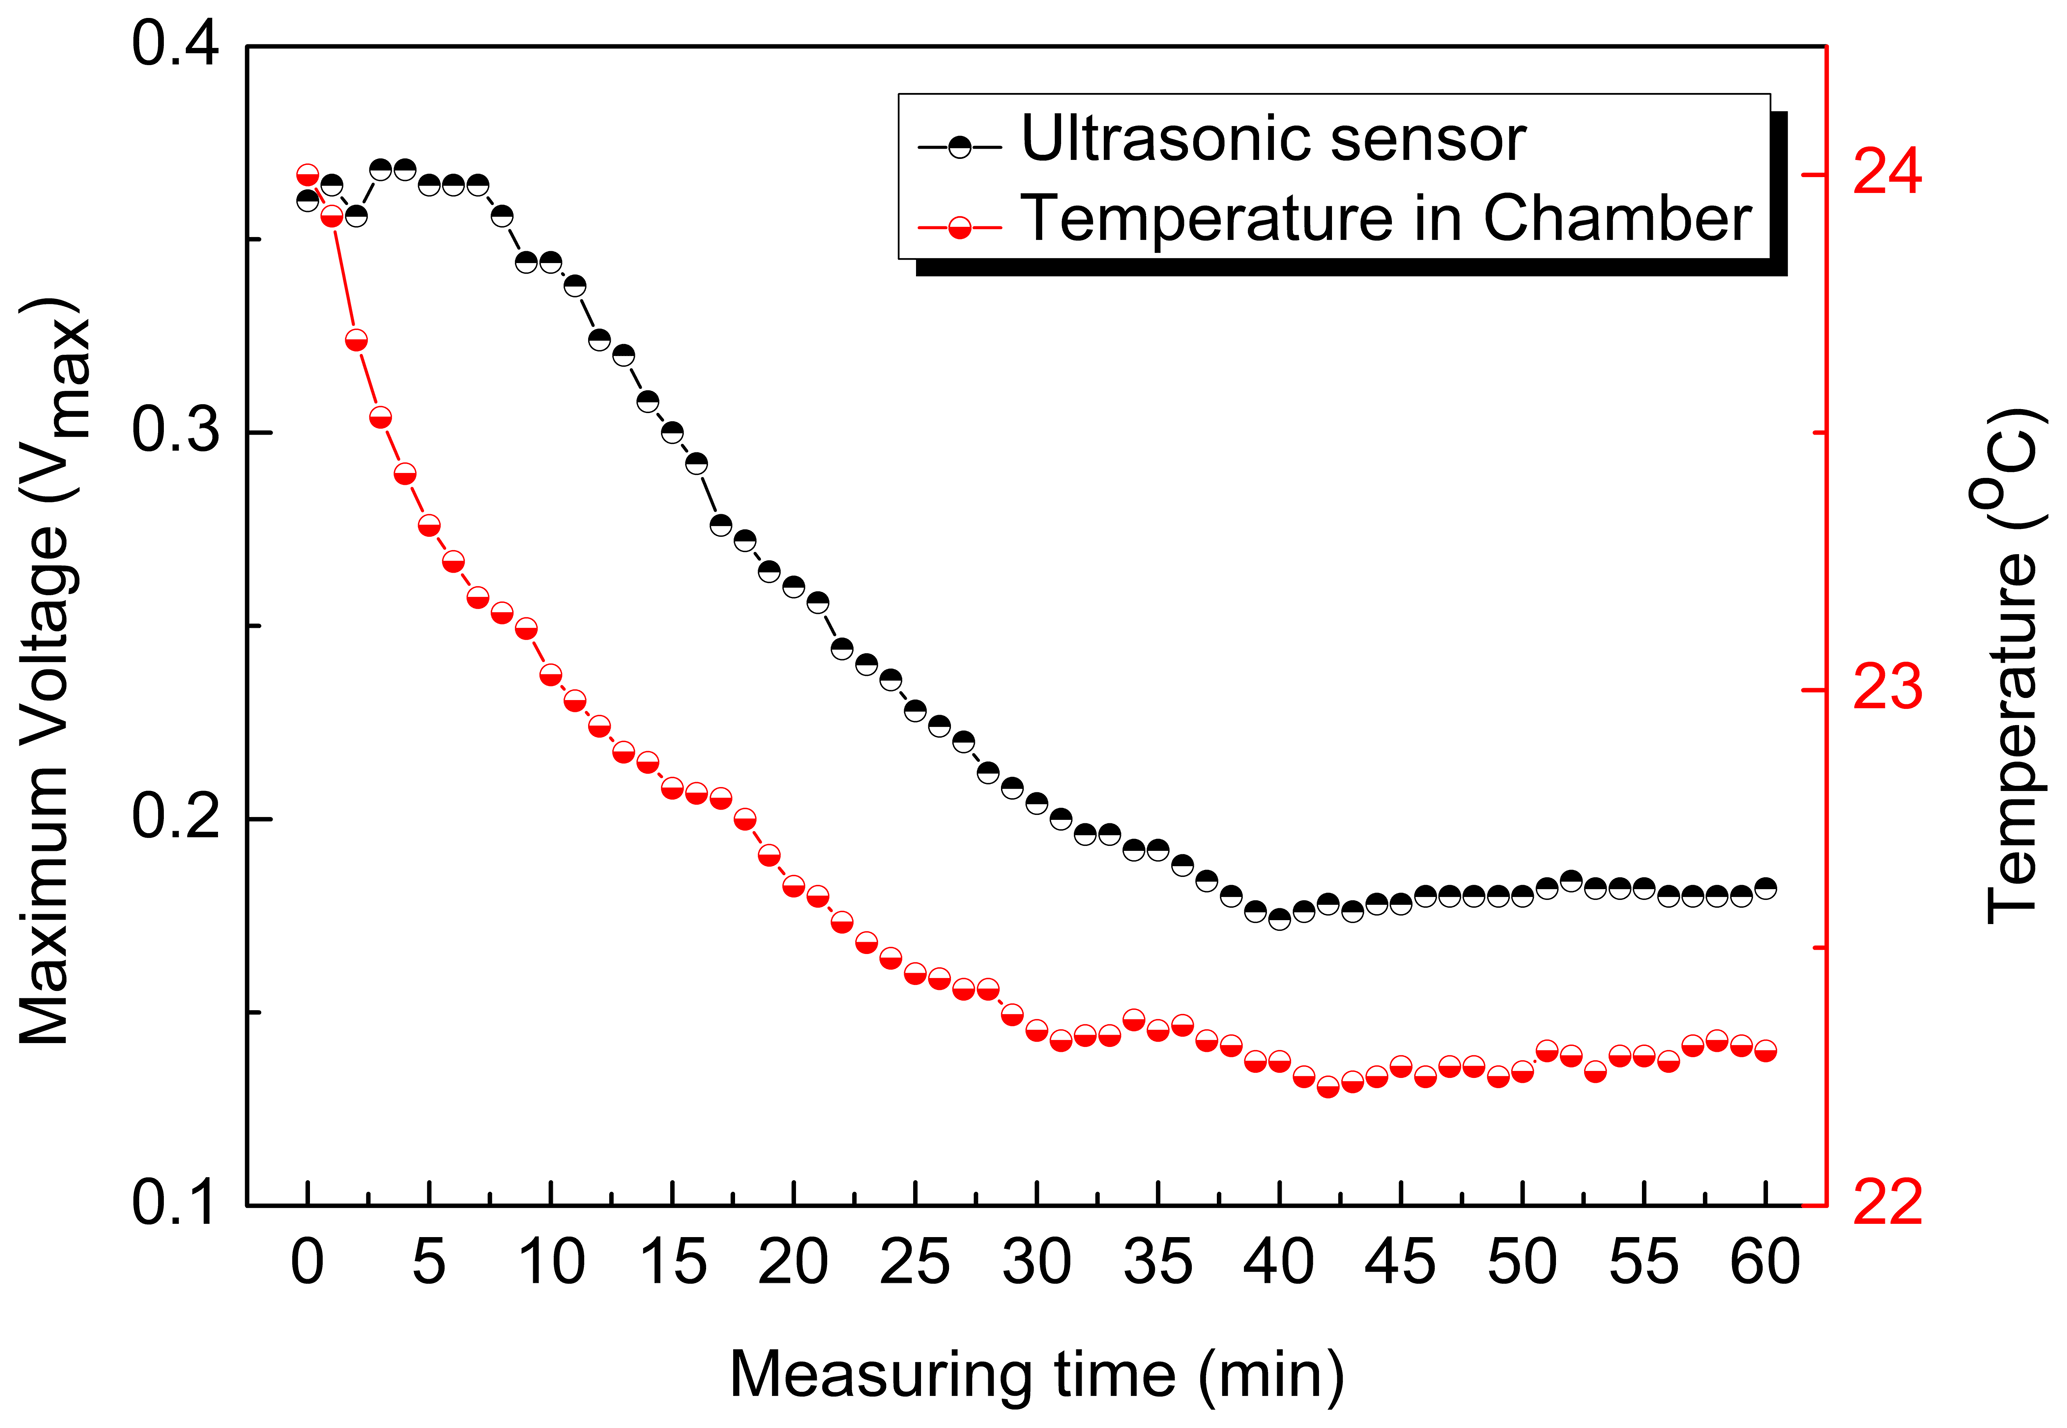
This is due to the characteristics of ultrasonic waves transmitted through the vibrations of the particles: the more actively the particles constituting the medium move, the less loss of ultrasonic energy there is during the delivery process. When the gas medium is measured by a direct measurement method using an ultrasonic sensor, it was found that it reacts more sensitively to changes in internal temperature than to changes in the internal density of the chamber. Therefore, it is judged that precise measurement is difficult, and reliable results would be difficult to obtain when using an ultrasonic sensor to detect minute leakage of gaseous fuel from the viewpoint of the received voltage.
3.2 Phase-shift characteristics according to the location of micro-leakage
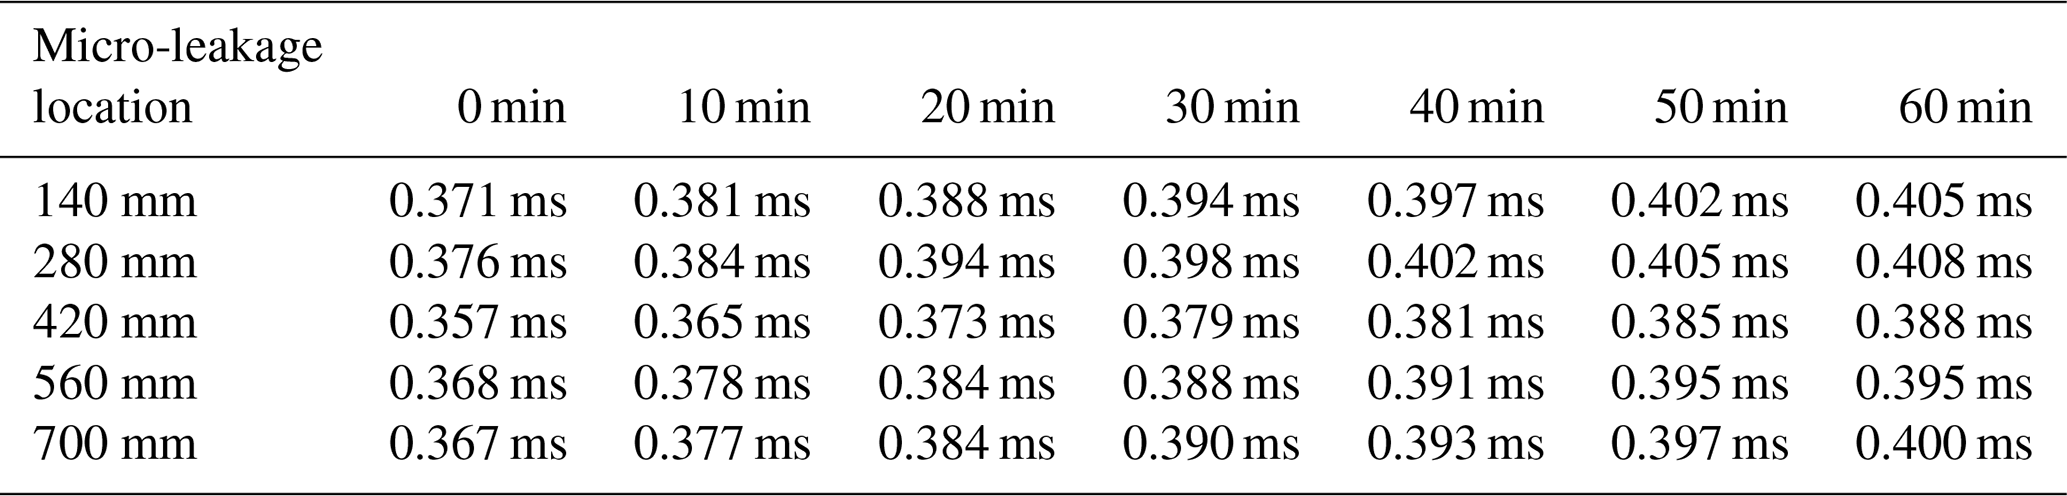
Figure 5a shows the results of curve fitting the envelope signal of the receiving ultrasonic sensor according to the micro-leakage at 140 mm of the micro-leakage by the Gaussian distribution at intervals of 10 min. The Gaussian envelope energy decreased nonlinearly with the occurrence of micro-leakage. Figure 5b depicts the change in the pressure inside the chamber and the change in phase according to the micro-leakage. The phase at the initial pressure of 5 bar was 0.371 ms, and it was 0.405 ms at the time of micro-leakage termination at 60 min. It can be seen that the phase shifted by 0.0057 ms on average. The phase shift according to the occurrence of micro-leakage and the pressure inside the chamber showed a similar tendency and changed linearly.
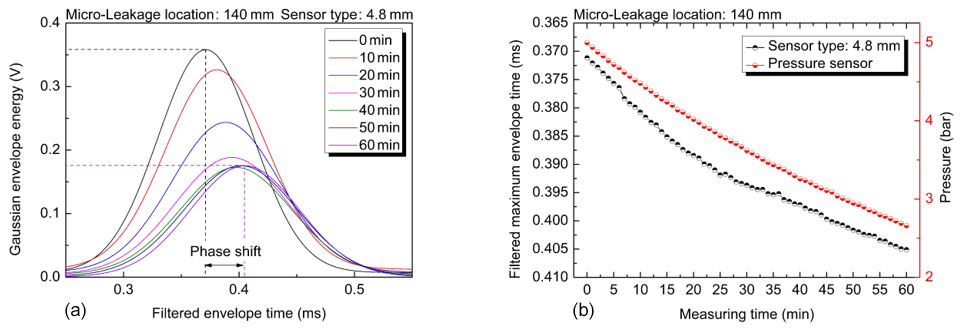
Figure 5Phase shift of ultrasonic sensor envelope signal filtered through a Gaussian distribution for micro-leakage location of 140 mm.
Unlike the relationship between the received voltage and the temperature, the pressure inside the chamber and the filtered maximum envelope time show linear results. This is considered to be the result of using a Gaussian distribution that takes all the characteristics of the receiving ultrasonic sensor into account.
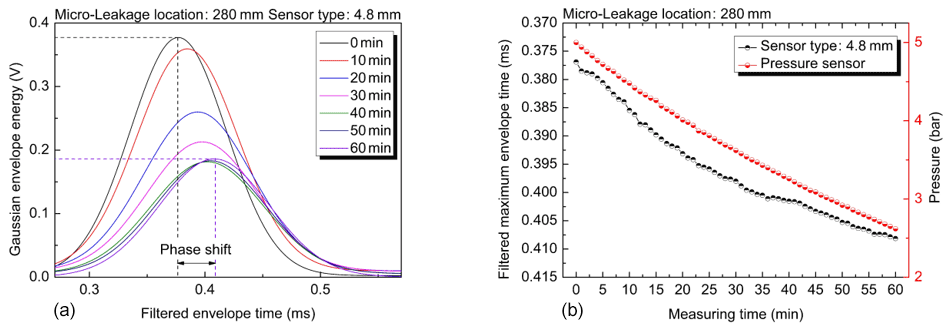
Figure 6Phase shift of ultrasonic sensor envelope signal filtered through a Gaussian distribution for micro-leakage location of 280 mm.
Figure 6a shows the results of curve fitting the envelope signal of the received ultrasonic sensor according to the micro-leakage at 280 mm of the micro-leakage by the Gaussian distribution at intervals of 10 min. The Gaussian envelope energy decreased nonlinearly with the occurrence of micro-leakage, as in the case of the micro-leakage location of 140 mm. Figure 6b is a graph comparing the change in the pressure inside the chamber and the change in phase according to the micro-leakage. The phase at the initial pressure of 5 bar was 0.376, and it was 0.408 ms at the time of micro-leakage termination at 60 min. It can be seen that the phase shifted by 0.0053 ms on average.
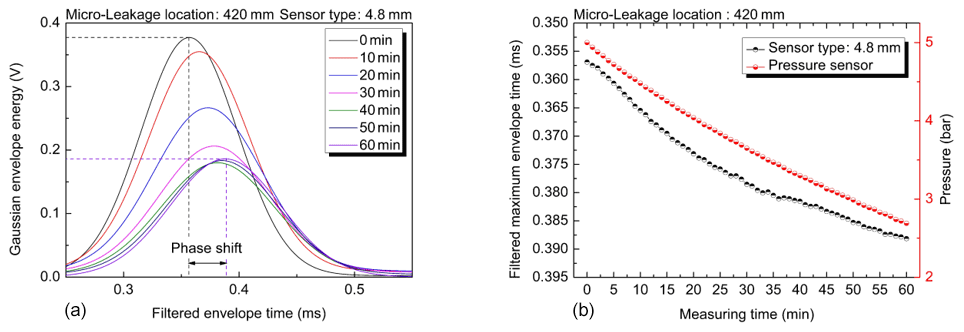
Figure 7Phase shift of ultrasonic sensor envelope signal filtered through a Gaussian distribution for micro-leakage location of 420 mm.
Figure 7a shows the results of curve fitting the envelope signal of the received ultrasonic sensor according to the micro-leakage at 420 mm of the micro-leakage by the Gaussian distribution at intervals of 10 min. The Gaussian envelope energy shows nonlinear results according to the micro-leakage, as in the previous results. Figure 7b is a graph comparing the change in the pressure inside the chamber and the change in phase according to the micro-leakage. The phase at the initial pressure of 5 bar was 0.357, and it was 0.388 ms at the time of micro-leakage termination at 60 min. It can be seen that the phase shifted by 0.00517 ms on average.

Figure 8Phase shift of ultrasonic sensor envelope signal filtered through a Gaussian distribution for micro-leakage location of 560 mm.
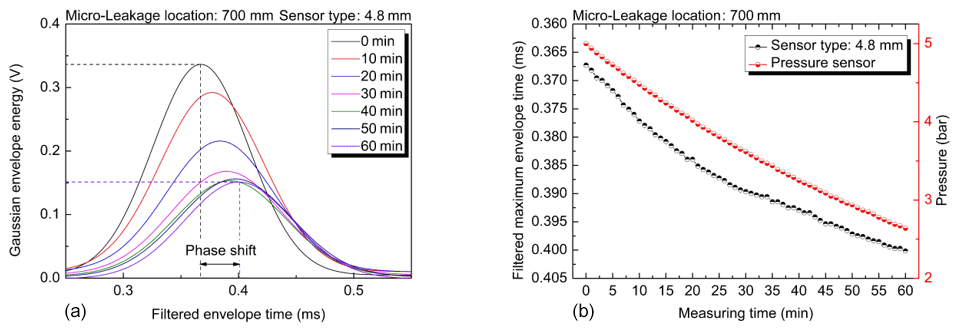
Figure 9Phase shift of ultrasonic sensor envelope signal filtered through a Gaussian distribution for micro-leakage location of 700 mm.
Figure 8a shows the results of curve fitting the envelope signal of the received ultrasonic sensor according to the micro-leakage at 560 mm of the micro-leakage by the Gaussian distribution at intervals of 10 min. The Gaussian envelope energy shows nonlinear results according to the micro-leakage, as in the previous results. Figure 8b is a graph comparing the change in the pressure inside the chamber and the change in phase according to the micro-leakage. The phase at the initial pressure of 5 bar was 0.368, and it was 0.395 ms at the time of micro-leakage termination at 60 min. It can be seen that the phase shifted by 0.0045 ms on average.
Figure 9a shows the results of curve fitting the envelope signal of the received ultrasonic sensor according to the micro-leakage at 700 mm of the micro-leakage by the Gaussian distribution at intervals of 10 min. The Gaussian envelope energy shows nonlinear results according to the micro-leakage, as in the previous results. Figure 9b is a graph comparing the change in the pressure inside the chamber and the change in phase according to the micro-leakage. The phase at the initial pressure of 5 bar was 0.367, and it was 0.400 ms at the time of micro-leakage termination at 60 min. It can be seen that the phase shifted by 0.0055 ms on average.
3.3 Phase shift according to the pressure inside the chamber
Experiments show that the thickness of the primary convergence layer of the ultrasonic sensor, as shown in Seo (2021), is similar to the frequency wavelength length (the minimum length in which a wave repeats the same shape at a given time), resulting in a relatively linear change in phase variation depending on the internal pressure of the high-pressure gas tank. This is attributed to stably transmitting signals, because the phase change is small when ultrasonic waves pass through the matching layer due to the thickness of the first matching layer of the ultrasonic sensor being the same as the frequency wavelength length. In addition, due to this effect, it is determined that the ultrasonic signal reacts sensitively according to the density change in the chamber.
Table 4Phase shift according to the pressure shift inside the chamber.
Huang et al. (2002) found that, when the temperature inside a chamber changes from 24 to 22 ∘C at the same pressure, the sound speed of ultrasonic waves changes from about 312.1 to 323.7 m s−1 at a distance of 5 cm between sensors. As a result of converting this to the unit of milliseconds (ms), the phase appears to have changed by 0.005741 ms. In this paper, an experiment was conducted to simulate the actual situation after the occurrence of micro-leakage; thus, the pressure change and the temperature change inside the chamber existed at the same time. Therefore, it appears that the phase shifted about 6.25 times more than the phase change of the previous study.
Kim et al. (2019) compared the ultrasonic envelope signal according to the mixing rate of CH4 and air. As a result, it was seen that the amplitude was different according to the mixing ratio, but the phase did not change. This appears to be the result of measuring the signal by controlling the temperature inside the chamber. However, in this study, we simulated the actual micro-leakage situation and conducted an experiment, and it is judged that the decrease in the sound velocity due to the decrease in the temperature inside the chamber affected the phase shift. In addition, in Figs. 5–9a, it can be confirmed that the creating point moved as the micro-leakage progressed.
However, as a result of comparing the characteristics of the phase change according to the location of the micro-leakage, a certain tendency could not be confirmed. Therefore, it is difficult to detect the location of micro-leakage by a direct measurement method in which an ultrasonic sensor radiates ultrasonic waves into a gas medium.
In this paper, a study was conducted on the applicability of ultrasonic sensors to the measurement of micro-leakage in gas fuel tanks. To proceed with the research, a chamber was manufactured according to the capacity of a high-pressure gas tank currently in wide use. The following conclusions were obtained by detecting the received signal according to the location of the micro-leakage using a direct measurement method:
-
The received voltage of the ultrasonic sensor showed a similar tendency to the change in temperature. This is judged to be a result of the relationship that the speed of sound decreases as the temperature decreases. Therefore, it is concluded that reliable results cannot be obtained in detecting the micro-leakage of gaseous fuel from the viewpoint of the received voltage.
-
The phase change of the results of curve fitting the envelope signal received by the ultrasonic sensor by a Gaussian distribution after the occurrence of micro-leakage showed linear results according to the pressure change inside the chamber. Because the thickness of the first matching layer is close to the frequency wavelength length, when ultrasonic waves pass through the matching layer, there is little phase deviation over time, and this is attributed to stably transmitting and receiving signals.
-
In addition, curve fitting using a Gaussian distribution has the advantage of taking into account all the reception characteristics appearing at the receiving ultrasonic sensor. Accordingly, it was possible to effectively analyze multiple factors of the received ultrasonic signal according to the pressure change in the chamber.
-
Regarding the characteristics of the phase change according to the location of the micro-leakage, it was difficult to detect the location of the micro-leakage with the direct ultrasonic measurement method, because a certain tendency could not be confirmed.
The results of this study revealed that it was difficult to use the received voltage for curve fitting the envelope signal of an ultrasonic sensor to a Gaussian distribution; the phase change shows linear results; thus, it is considered that it can be applied as a new micro-leakage measurement method for a high-pressure gas tank.
This study is focused on analyzing signal changes according to internal flow and temperature change by generating micro-leakage, unlike previous studies that experimented with no flow inside a chamber. In addition, a new application method utilizing a phase shift by post-processing the ultrasonic reception signal was proposed. By using the ultrasonic sensor, a different method was proposed for the measurement of micro-leakage of gaseous fuel that relied on the existing pressure sensor.
All the code used in this paper can be obtained upon request to the corresponding author.
All the data used in this paper can be obtained on request from the corresponding author.
WS did the experiments and wrote the article. SI provided ideas and reviewed the overall process for the experiment. GL reviewed and instructed the overall content of the thesis.
The contact author has declared that neither they nor their co-authors have any competing interests.
Publisher’s note: Copernicus Publications remains neutral with regard to jurisdictional claims in published maps and institutional affiliations.
This research was supported by the BB21plus funded by Busan Metropolitan City and Busan Institute for Talent & Lifelong Education (BIT).
This research was supported by the BB21plus funded by Busan Metropolitan City and Busan Institute for Talent & Lifelong Education (BIT).
This paper was edited by Jeong Hoon Ko and reviewed by Moo-Yeon Lee and one anonymous referee.
Alvarez-Arenas, T. E. G.: Acoustic Impedance Matching of Piezoelectric Transducer to the Air, IEEE Transactions on Ultrasonics, Ferroelectrics, and Frequency Control., 51, 624–633, https://doi.org/10.1109/TUFFC.2004.1320834, 2004.
Aslam, M. U., Masjuki, H. H., Kalam, M. A., Abdesselam, H., Mahlia, T. M. I., and Amalina, M. A.: An experimental investigation of CNG as an alternative fuel for a retrofitted gasoline vehicle, Fuel, 85, 717–724, https://doi.org/10.1016/j.fuel.2005.09.004, 2006.
Chakraborty, J., Katunin, A., Klikowicz, P., and Salamak, M.: Early Crack Detection of Reinforced Concrete Structure Using Embedded Sensors, Sensors, 19, 3879, https://doi.org/10.3390/s19183879, 2019.
Cheeke, J. D. N.: Fundamentals and Applications of Ultrasonic Waves, 2nd ed, CRC press: 6000 Broken Sound Parkway NW, USA, ISBN 978-1-1380-7720-1, 2017.
Choi, J. Y., Truong, N. T. P., Pham, V. H., Boc, M. T., Kim, B. G., and Oh, J. H.: Fabrication of High Frequency Transducer for Nondestructive Testing, KSPSE, 24, 36–42, https://doi.org/10.9726/kspse.2020.24.3.036, 2020.
Fatemi, M. and Greenleaf, J. F.: Ultrasound-stimulated vibro-acoustic spectrography, Science, 280, 82–85, https://doi.org/10.1126/science.280.5360.82, 1998.
Furukawa, T., Ishida, K., and Fukada, E.: Piezoelectric properties in the composite system of polymers and PZT ceramics, J. Appl. Phys., 50, 4094–4912, https://doi.org/10.1063/1.325592, 1979.
Gao, W., Liu, W., Hu, Y., and Wang, J.: Study of Ultrasonic Near-Field Region in Ultrasonic Liquid-Level Monitoring System, Micromachines, 11, 763, https://doi.org/10.3390/mi11080763, 2020.
Guo, Z., Huang, T., and Schröder, K. U.: Development of a Piezoelectric Transducer-Based Integrated Structural Health Monitoring System for Impact Monitoring and Impedance Measurement, Applied Science, 10, 2062, https://doi.org/10.3390/app10062062, 2020.
Hames, Y., Kaya, K., Baltacioglu, E., and Turksoy, A.: Analysis of the control strategies for fuel saving in the hydrogen fuel cell vehicles, Int. J. Hydrogen Energ., 43, 10810–10821, https://doi.org/10.1016/j.ijhydene.2017.12.150, 2018.
Hesterberg, T. W., Lapin, C. A., and Bunn, W. B.: A Comparison of Emission from Vehicles Fueled with Diesel or Compressed Natural Gas, Environ. Sci. Technol., 42, 6437–6445, https://doi.org/10.1021/es071718i, 2008.
Huang, K. N., Huang, C. F., Li, Y. C., and Young, M. S.: High precision, fast ultrasonic thermometer based on measurement of the speed of sound in air, Rev. Sci. Instrum., 73, 4022–4027, https://doi.org/10.1063/1.1510576, 2002.
Jacobson, M. Z., Colella, W. G., and Golden, D. M.: Cleaning the Air and Improving Health with Hydrogen Fuel-Cell Vehicle, Science, 308, 1901–1905, https://doi.org/10.1126/science.1109157, 2005.
Kalam, M. A. and Masjuki, H. H.: An experimental investigation of high performance natural gas engine with direct injection, Energy, 36, 3563–3571, https://doi.org/10.1016/j.energy.2011.03.066, 2011.
Khimunin, A. S.: Numerical calculation of the diffraction corrections for the precise measurement of ultrasound absorption, Acta Acust. United Ac., 27, 173–181, https://doi.org/10.1016/0041-624x(73)90413-7, 1972.
Kim, H. J.: A study on the fuel quantity measurement of gas tank for vehicle using ultrasonic sensor, Ph.D degree, Kongju National University, Cheonan, 2019.
Kim, K. S. and Lee, P. K.: The application of ultrasonic-assisted measurement in pure methane gas space in a constant volume chamber using an ultrasonic sensor, Sensor and Actuators A, Physical, 297, 111515, https://doi.org/10.1016/j.sna.2019.07.039, 2019.
Kim, K. S., Choi, D. S., and Im, S. Y.: The application of ultrasonic waves and envelope energies in a closed chamber based on an air/methane mixture, Ultrasonics, 91, 92–102, https://doi.org/10.1016/j.ultras.2018.07.009, 2019.
Liu, F., Akram, M. Z., and Wu, H.: Hydrogen effect on lean flammability limits and burning characteristics of an isooctane-air mixture, Fuel, 266, 117144, https://doi.org/10.1016/j.fuel.2020.117144, 2020.
Li, Y., Bi, M., Li, B., Zhou, Y., Hwang, L., and Gao, W.: Explosion hazard evaluation of renewable hydrogen/ammonia/air fuels, Energy, 109, 252–263, https://doi.org/10.1016/j.energy.2018.06.174, 2018.
Ma, F., Wang, Y., Liu, H., Wang, J., and Zhao, S.: Experimental study on thermal efficiency and emission characteristics of a lean burn hydrogen enriched natural gas engine, Int. J. Hydrogen Energ., 32, 5067–5075, https://doi.org/10.1016/j.ijhydene.2007.07.048, 2007.
Pedersen, P. C., Tretiak, O., and He, P.: Impedance-matching properties of an inhomogeneous matching layer with continuously changing acoustic impedance, Acoustical Society of America, 72, 327–336, https://doi.org/10.1121/1.388085, 1982.
Qian, Y., Salehian, A., Han, S. W., and Kwon, H. J.: Design and analysis of an ultrasonic tactile sensor using electro-mechanical analogy, Ultrasonics, 105, 106129, https://doi.org/10.1016/j.ultras.2020.106129, 2020.
Seo, W. J.: A Study on the Optimization and Transmitting/Receiving Characteristics of Ultrasonic Sensor for Measuring Micro-Leakage in Gas Fuel Tank, Master degree, Tongmyong University, Busan, 2021.
Sharma, G. S., Skvortsov, A., MacGillivary, I., and Kessissoglou, N.: Sound transmission through a periodically voided soft elastic medium submerged in water, Wave Motion, 70, 101–112, https://doi.org/10.1016/j.wavemoti.2016.10.006, 2017.
Sonoyama, M., Kato, Y., and Fujita, H.: Application of ultrasonic to a hydrogen sensor, SENSORS, 2010 IEEE, 91, 92–102, https://doi.org/10.1109/ICSENS.2010.5690522, 2010.
Tone, M., Yano, T., and Saito, K.: Piezoelectric ultrasonic transducers having acoustic impedance-matching layer, U.S. Patent No. 4,523,122, Panasonic Corp, 11 June 1985.
Veiga, M. R., Mansano, R. D., and Silva, R. L.: Injection system for tri-fuel engines with control of power by simultaneous use of CNG and ethanol or gasoline, SAE Technical Paper, SAE Brasil 2010 Congress and Exhibit, https://doi.org/10.4271/2010-36-0195, 2010.
Vellekoop, M. J.: Acoustic wave sensors and their technology, Ultrasonics, 36, 7–14, https://doi.org/10.1016/S0041-624X(97)00146-7, 1998.
Wang, T., Wang, X., and Hong, M.: Gas Leak Location Detection Based on Data Fusion with Time Difference of Arrival and Energy Decay Using an Ultrasonic Sensor Array, Sensors, 18, 2985, https://doi.org/10.3390/s18092985, 2018.
Wang, X., Chakraborty, J., and Niederleithinger, E.: Noise Reduction for Improvement of Ultrasonic Monitoring Using Coda Wave Interferometry on a Real Bridge, J. Nondestruct. Eval., 40, 1–14, 2021.