the Creative Commons Attribution 4.0 License.
the Creative Commons Attribution 4.0 License.
 | 27 Oct 2026
Optimization and experimental analysis of turbine airfoil of downhole generator based on genetic algorithm
Jun Qu

Xingyu Tan
Yingqi Li
Peng Zhou
Reliable power supply is essential for downhole measurement and intelligent drilling systems operating in deep and ultra-deep wells. This study develops an efficient hydraulic-airfoil optimization framework for a downhole turbine generator using the NACA66 profile. High-order Bezier curves with eight movable control points are used for parameterization, and a genetic algorithm (GA) coupled with MATLAB and XFOIL maximizes the sectional lift-to-drag ratio under geometric constraints. The principal optimization is performed at Re=3000 over an angle-of-attack range of 10 to 20°. The optimized airfoil shows favorable performance near 10° and achieves a lift-to-drag ratio 26.9 % higher than that of the original profile at 15°. Sensitivity analyses at Re=300, 3000, and 30 000 demonstrate stable hydrodynamic performance over the investigated range. CFD simulations at flow rates of 10 and 40 L s−1 further confirm improved pressure distribution and lift–drag characteristics. The turbine experiments conducted within different flow ranges showed that at the highest test flow rate, the torque increased from 0.997 to 1.297 N m (an increase of 30.2 %), and the rotational speed increased from 712–904 revolutions per minute (an increase of 27.1 %). The optimized turbine also exhibits higher tip-speed ratio and normalized power-performance characteristics across the tested operating range. These results verify that the proposed Bezier–GA–XFOIL framework effectively improves both sectional hydrodynamic performance and turbine-level mechanical response.
- Article
(1029 KB) - Full-text XML
- BibTeX
- EndNote


The increasing complexity of oil and gas exploration, particularly in deep and ultra-deep formations, has promoted the widespread use of measurement-while-drilling, logging-while-drilling, and other intelligent downhole tools. These systems require reliable power under restricted installation space and harsh conditions. Although batteries remain widely used, their limited capacity and service life constrain long-duration operation. Consequently, converting the hydraulic energy of circulating working fluids into electricity through downhole turbine generators has attracted increasing attention (Jia, 2020). Their output and stability are strongly influenced by turbine hydrodynamics, and blade profile is a key factor governing pressure loading, torque, rotational speed, and energy-conversion performance.
Previous studies on downhole turbine generators have mainly addressed structural design, parameter matching, and turbine-level performance. Response-surface optimization, component matching, blade modification, and experiments have demonstrated the importance of turbine geometry and operating parameters (Lu et al., 2016; Lu, 2017; Zhang et al., 2018; Jia et al., 2021; Qu et al., 2023; Sun et al., 2025). However, systematic optimization of sectional hydraulic airfoils under the low-Reynolds-number conditions relevant to compact downhole turbines remains limited.
Hydrofoil optimization has been investigated more extensively in other liquid-driven turbines. Muis et al. (2015) examined geometry optimization for a very-low-head axial hydraulic turbine, while Zhu et al. (2014) combined a radial-basis-function neural network with a genetic algorithm for marine-current-turbine hydrofoil optimization. Bezier-based and multi-objective evolutionary approaches have also been applied to tidal-turbine hydrofoils (Yuan et al., 2019; Tan et al., 2020). Sun et al. (2021) considered cavitation and surface roughness, and biomimetic modifications have also been explored (Xiong et al., 2021). These studies demonstrate the potential of parametric optimization for liquid-driven blades, but their scales, environments, and constraints differ from those of downhole turbine generators.
A critical issue in transferring conventional airfoil-design methods to hydraulic applications is the working medium. Aerodynamic airfoils and hydrofoils both generate lift through pressure differences, but Reynolds-number similarity alone does not ensure equivalent pressure loading, momentum transfer, cavitation behavior, or structural response. Liquid environments may also involve stronger hydrodynamic loading, confinement effects, cavitation, and fluid–structure interactions. Seifi Davari et al. (2025a) emphasized the importance of fluid properties, cavitation, three-dimensional flow, structural effects, and operating conditions in lift-based hydrokinetic turbines. Aerodynamic tools can therefore provide useful comparative information for sectional optimization but should be supplemented by liquid-flow CFD and experiments for hydraulic-turbine evaluation.
Airfoil parameterization determines design-space flexibility and optimization efficiency. Bezier and B-spline representations are widely used because they describe smooth geometries with relatively few variables. Their applicability to turbine blades and low-Reynolds-number airfoils has been demonstrated through geometric control and GA-based optimization (Zhang et al., 2015, 2019; Sun et al., 2019; Wei et al., 2020). Related work has optimized NACA thickness parameters for maximum lift-to-drag ratio (Bourisli and Hamadeh, 2020), coupled parameterization with GA-based CFD optimization (Akram and Kim, 2021), and improved B-spline fitting procedures (Wu and Liu, 2024).
The solver embedded in an optimization loop must balance predictive capability and computational cost. High-fidelity CFD can resolve detailed pressure, separation, and vortical structures, as demonstrated in numerical and experimental studies of NACA4412 airfoils (Coles and Wadcock, 1979; Gleize et al., 2022), but repeated CFD calculations for numerous candidate geometries are expensive. XFOIL offers a faster alternative for estimating sectional lift and drag. Morgado et al. (2016) showed that its reliability for high-lift, low-Reynolds-number airfoils depends on the operating regime. Accordingly, XFOIL is used here primarily as a rapid comparative tool rather than as a complete representation of the liquid-flow turbine environment.
The choice of evolutionary optimizer is likewise problem dependent. Genetic algorithms have been widely combined with Bezier, B-spline, and related parameterizations because selection, crossover, and mutation support global exploration in constrained spaces (Sun et al., 2019; Wei et al., 2020; Akram and Kim, 2021). Particle swarm optimization (PSO) is also effective. Seifi Davari et al. (2025b) coupled blade-element momentum theory with PSO for wind-turbine optimization in air and validated the analysis at a Reynolds number of approximately 3×10⁵. However, optimizer performance depends on variable representation, constraints, objective landscape, and computational budget. The present problem involves eight coupled Bezier variables with geometric and cross-sectional-area constraints; therefore, GA is adopted for its suitability to this constrained design space rather than from an assumption of universal superiority over PSO.
Despite these advances, a gap remains between rapid sectional optimization and turbine-level hydraulic evaluation for downhole applications. Improving lift-to-drag ratio alone does not guarantee improved turbine output because torque and rotational speed are also affected by blade arrangement, guide-vane interaction, confinement, three-dimensional flow, and load. To address this gap, the present study uses the NACA66 (mod) hydraulic airfoil as the baseline and develops a GA-based constrained optimization framework. High-order Bezier curves with eight movable control points are coupled with MATLAB and XFOIL to maximize sectional lift-to-drag ratio under geometric constraints. The principal optimization is performed at Re=3000 over −10 to 20°, with sensitivity examined at Re=300, 3000, and 30 000. The optimized profile is then evaluated using liquid-flow CFD and turbine experiments measuring torque and rotational speed, linking rapid sectional optimization with higher-fidelity numerical and turbine-level experimental verification.
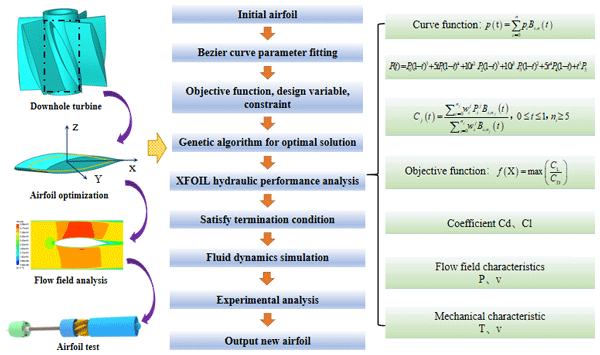
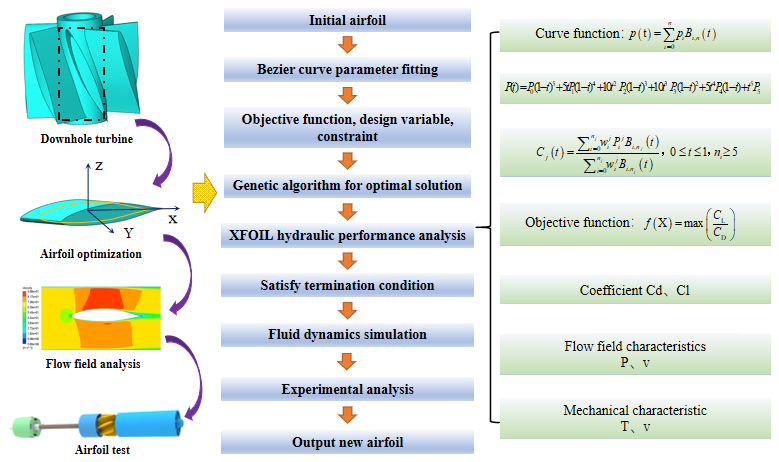
The overall workflow of the proposed airfoil optimization and evaluation method is illustrated in Fig. 1.
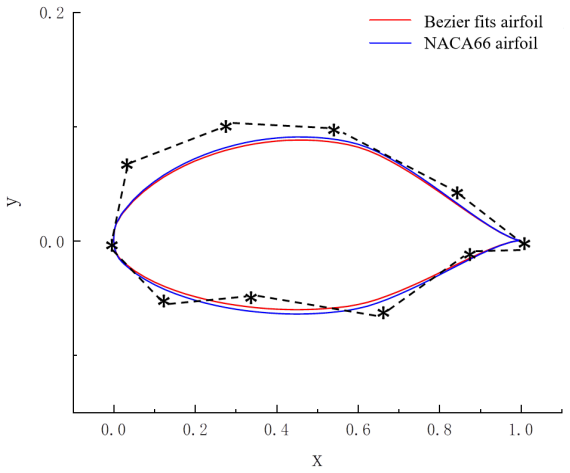
The design variables comprised eight pre-selected control points on the Bezier curve to ensure an accurate fit. Parallel trimming control points were established at the leading and trailing edges. Subsequently, the control vertices of the interpolation curve were inversely calculated based on the provided control point coordinates, and appropriate weight factors were assigned to achieve a precise fit of the airfoil line. The fitting outcomes are illustrated in Fig. 2.
By avoiding the occurrence of curve cusps, this method yields an airfoil that closely matches the original airfoil curve. For the base airfoil, the commonly utilized hydraulic airfoil NACA66 (mod) was chosen, and its curve coordinates were derived from a relevant airfoil database. The airfoil control curve function for NACA66 was formulated under the Bezier curve function (Lu et al., 2016).
In the equation, ; Pi is the control point; B (t) is the Bernstein basis function of degree n, whose expression is
Then the fitting difference formula of the multi-order Bezier curve function of each segment is as follows:
In Fig. 2, the overlapping control points on the upper and lower airfoil surfaces of the airfoil are fixed to keep the chord length of the airfoil unchanged, while the remaining eight control points are moved, including four on each of the upper and lower airfoil surfaces. The shape of the airfoil is controlled by moving these eight control points Pi.
The fitting difference formula of the fifth-order Bezier curve function is as follows:
The coordinate matrix of the upper and lower airfoil contour lines corresponding to the airfoil blade is
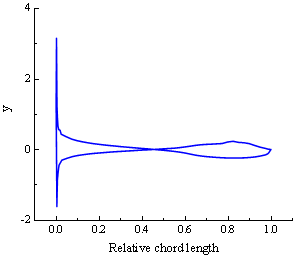
Figure 2 shows the airfoil curve after Bezier fitting. The result revealed that the airfoil curve after fitting is similar to the original airfoil. The smoothness of the airfoil surface curve is an important factor affecting the variation in hydraulic performance, so it is necessary to analyze the curvature characteristics of the fitted airfoil curve. Figure 3 illustrates the curvature variation in the fitted airfoil curve, which exhibits a smooth and continuous shape from the leading edge to the trailing edge, with no significant fluctuation. The only exceptions are the excessive singularities at the front and back edges of both ends, indicating that the continuity of the fitted airfoil curve is excellent. This suggests a high quality of curve fitting.
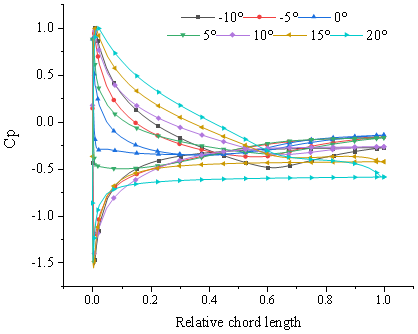
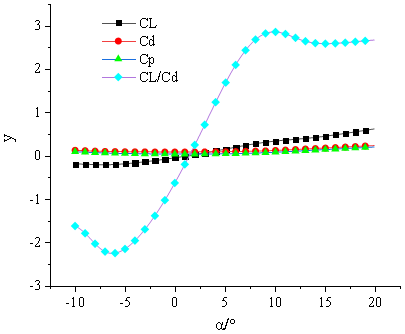
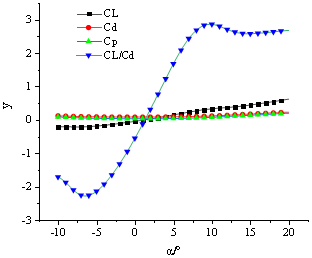
The XFOIL software uses the surface source method based on potential flow calculation, and uses the integral function of the flow boundary layer to calculate the flow field near the airfoil turbulent flow by taking the boundary conditions of the inner and outer flow at the displacement thickness of the boundary layer as the symbol of iterative convergence. Therefore, XFOIL is capable of rapidly predicting airfoil performance under different Reynolds numbers. Previous research has shown that the accuracy and convergence behavior of XFOIL depend on the Reynolds number, angle of attack, and flow conditions (Morgado et al., 2016). Considering the viscosity characteristics of the drilling fluid itself, continuous iterative calculation of the optimized airfoil structure can be performed in XFOIL through a coupling call algorithm based on MATLAB fitting results. Utilizing XFOIL instead of CFD within the optimization model of the genetic algorithm not only ensures calculation accuracy but also significantly enhances the efficiency of the design optimization process, making it more suitable for practical engineering applications (Wei et al., 2020). Figures 4 and 5 show the pressure coefficient distribution and hydraulic characteristic curves of the initially fitted airfoil.
The performance of the airfoil across various working conditions is analyzed through the above MATLAB combined with XFOIL software. The Fig. 2 shows a two-order Bezier curve with four movable control points above and below each, and the control points do not move when the front and back edges coincide. A genetic algorithm is used to set constraints, design variables, objective functions to obtain the optimal solution (Akram and Kim, 2021; Bourisli and Hamadeh, 2020).
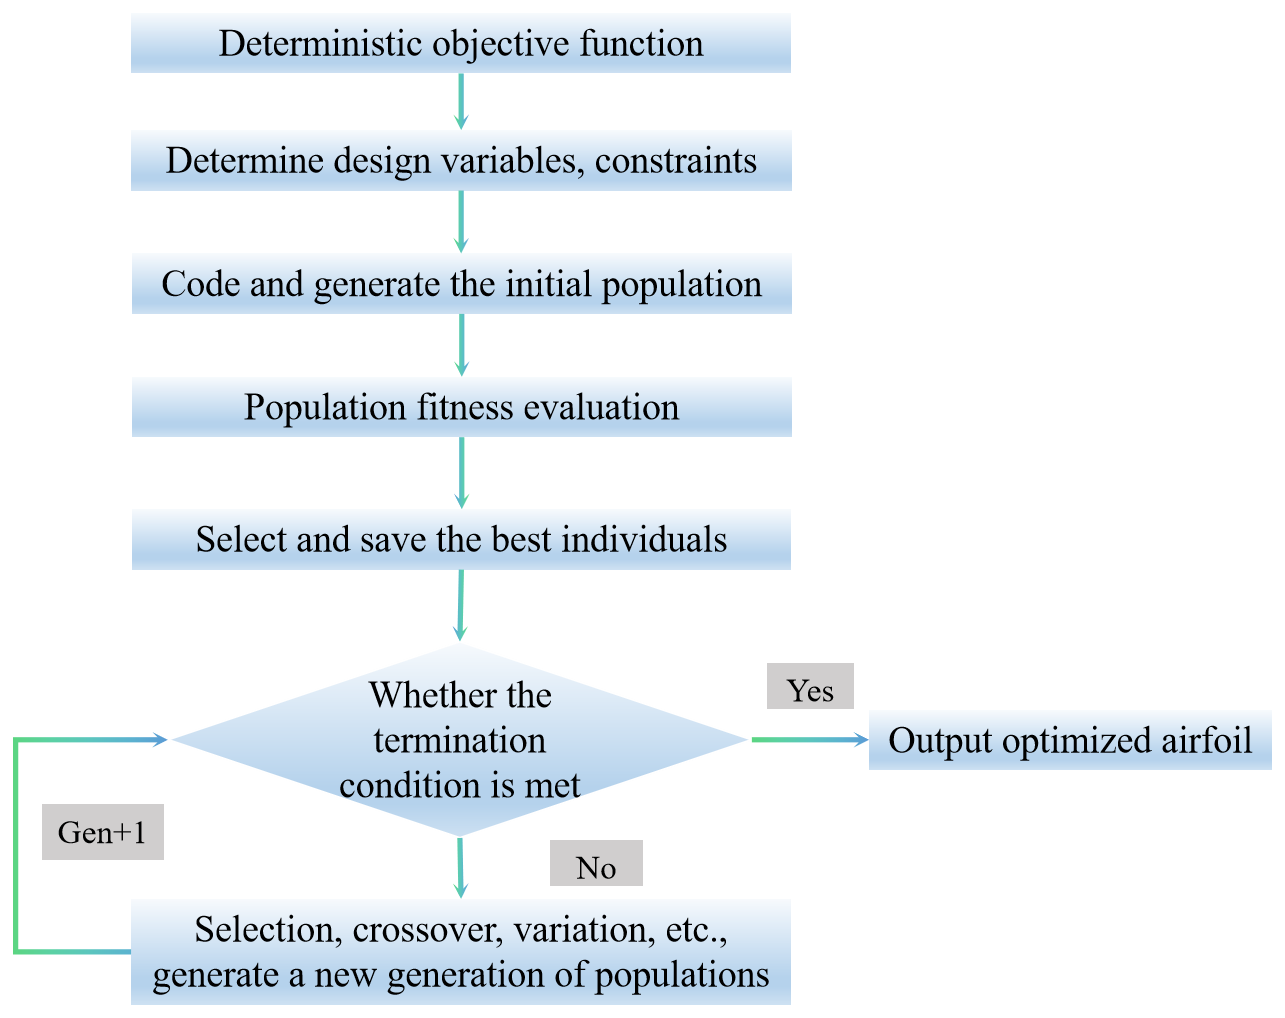
When the genetic optimization algorithm is used to find the optimal airfoil under constraints, the specific steps are as follows: (1) determine the design variables, objective functions, and constraints; (2) generate initial population; (3) calculate the fitness value; (4) compare and preserve the best individuals; (5) determine whether the termination conditions are met. If yes, the airfoil is optimized. If no, the following steps are performed. (6) Select, cross, and mutate to generate a new generation of population; then perform steps (3), (4), and (5) until the objective function and constraints are satisfied and the optimal solution is obtained. The flowchart is shown in Fig. 6:
Among them, the settings of design variable, objective function, and constraint conditions are as follows:
-
Design variable Bezier curve was used for parametric modeling. The control points on the airfoil fitting curve were taken as design variables, and the design variables were eight control points. The design variables were expressed as follows:
-
Objective function
The purpose of blade design is to improve the energy efficiency of the impeller, and the lift-to-drag ratio of the airfoil directly affects the energy efficiency of the blade. Therefore, the objective function for optimizing the blade airfoil is as follows:
In the equation, CL is the lift coefficient; CD is the drag coefficient.
-
Constraint conditions
The constraint on the design variable X is
In order to maintain a wide range of laminar flow on the surface of the airfoil, the optimized airfoil has machinability and strength. The constraint condition of the maximum relative thickness position (L is the position of the maximum thickness of the airfoil, c is the chord length) is
The camber of airfoil and the lift-to-drag ratio of airfoil are related to strength. The increase in camber can increase the lift-to-drag ratio of airfoil, but it is necessary to restrict the camber, because excessive camber will affect the strength of airfoil. Constraints are imposed by combining the above factors:
In the equation, xt is the curvature of the airfoil.
Appropriate movement of the bending position to the backward edge is conducive to increasing the maximum lift-to-drag ratio of the hydraulic airfoil and imposing constraints:
In the equation, f is the distance between the bending position and the leading edge of the airfoil.
To ensure sufficient structural rigidity and mechanical strength, the airfoil cross-sectional area is constrained in the design optimization (Tan et al., 2020):
In the equation, S0 is the cross-sectional area of the fitted airfoil and S is the cross-sectional area of the optimized rear airfoil.
5.1 Performance comparison between optimized airfoil and original airfoil
Based on the initial input parameters of the airfoil, the performance data of the individual airfoil (such as the lift-to-drag ratio calculated from the lift and drag coefficients) are obtained. Then, with the required calculation parameters and constraint conditions, the population size of the genetic algorithm is set to 80, the number of evolution generations is set to 500, random sampling is selected, the crossover probability is set to 0.8, and the mutation probability is set to 0.05, thereby obtaining the optimal solution.
Taking the optimal lift-to-drag ratio as the optimization objective, the α angle of attack of the airfoil ranges from −10 to 20° (Zhu et al., 2014). Unlike conventional aerodynamic airfoils operating in air, the blade considered in the present study operates in a liquid environment. The Reynolds number is used here to characterize the relative importance of inertial and viscous effects in the two-dimensional sectional flow, but Reynolds-number similarity alone does not imply complete physical similarity between air and liquid flows. Differences in fluid density and viscosity can substantially alter dimensional pressure, hydrodynamic loading, and momentum exchange, while hydraulic operation may additionally involve cavitation, confinement effects, and fluid–structure interactions. Therefore, XFOIL is employed in this study primarily as a computationally efficient tool for comparative airfoil optimization rather than as a complete representation of the actual turbine flow. The principal optimization condition is set at Re=3000, and the influence of Reynolds-number variation is subsequently examined at Re=300, 3000, and 30 000 (Zhang et al., 2019). The optimized profile is further assessed using liquid-flow CFD simulations and turbine-level experiments to evaluate its hydraulic performance under more representative operating conditions.
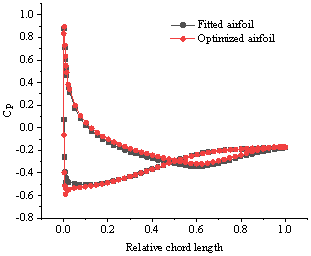
Figure 7 shows the airfoil curve optimized by genetic algorithm. The obtained airfoil curve is compared with the original airfoil curve, and the airfoil is optimized by XFOIL analysis combined with the change in flow field. It is found that the thickness of the upper part of the airfoil decreases after optimization, the maximum thickness moves backward relative to the initial airfoil, and there is an obvious curvature change at the lower trailing edge.
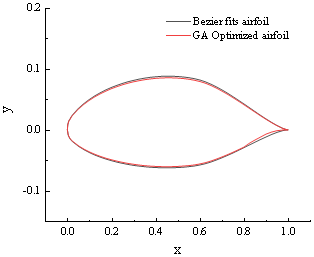
Figure 8 shows the pressure coefficient distribution curves of airfoil surface at different angles of attack after optimization. At the position of 50 %–55 % of the maximum thickness of the airfoil, the pressure distribution coefficient of the airfoil changes; that is, the pressure coefficient of the tail increases. This is mainly because the change in the lower airfoil curve leads to laminar flow separation transition, and the tail develops into turbulence, resulting in the increase in the pressure coefficient of the tail. The pressure coefficient of the optimized airfoil is similar to that of the fitted airfoil.
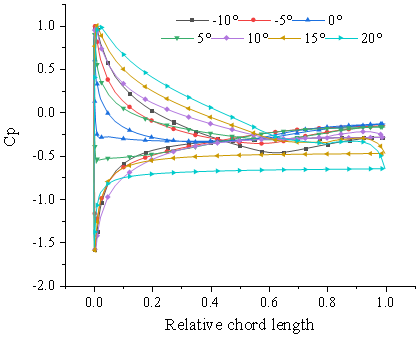
Figure 8Pressure coefficient distribution curves at different angles of attack after optimization.
The lift and drag characteristic curves of the optimized airfoil drawn according to the calculation results at different angles of attack are shown in Fig. 9. The lift-to-drag ratio of the optimized airfoil has a higher lift-to-drag ratio when the angle of attack is 10°, which is in line with the expected design. When the angle of attack is greater than 10°, the lift-to-drag ratio tends to be stable.
Figure 10 shows the comparison curve of the pressure coefficient between the initial airfoil and the optimized airfoil. The area enclosed by the upper and lower pressure lines of the optimized airfoil becomes significantly larger, indicating that the optimized airfoil is superior to the initial airfoil and can effectively reduce hydraulic loss. It can also be seen that the maximum thickness of the optimized airfoil shifts back.
As depicted in Fig. 11a and c, with the increase in the angle of attack, the pressure coefficient and resistance coefficient of the airfoil exhibit a trend of initial decreasing followed by increasing; moreover, the amplitude of the symmetry axis of 0° angle of attack is symmetrically similar. After optimization, the thickness of the airfoil decreases relative to the original airfoil and the maximum position is moved back, the leading-edge radius of the airfoil decreases, the upper airfoil curve is relatively flat, the resistance generated by the upper flow field is reduced after sweeping, and the lift force generated by the rise in the lift coefficient is increased compared with the initial airfoil, as shown in Fig. 11b. Figure 11d shows that the lift-to-drag ratio of the airfoil reaches its maximum at an range of 10°, indicating an improved hydraulic performance at this angle. In the case of large angle of attack, the lift-to-drag ratio of the optimized airfoil is much higher than that of the original airfoil. When the angle of attack is 15°, the maximum lift-to-drag ratio is 26.9 % higher than that of the original airfoil. The results reveal that the optimized airfoil exhibits super hydrodynamic performance compared to the original airfoil across a broad spectrum of attack at both large and small angles.
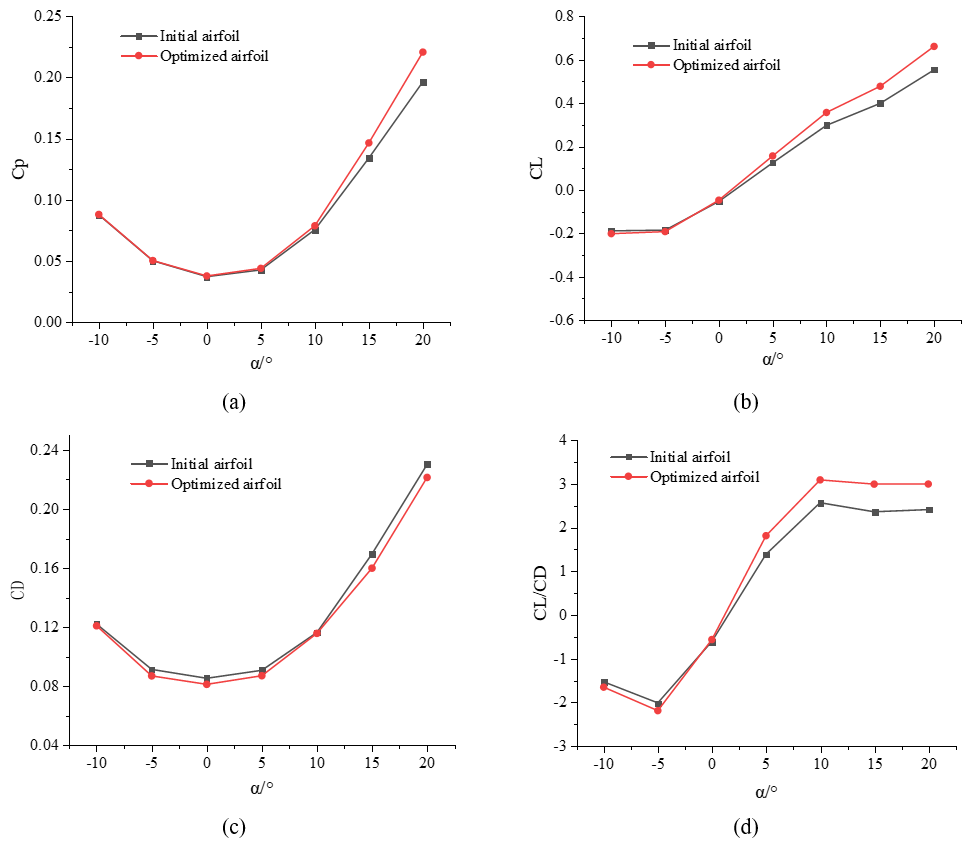
Figure 11Comparison between initial airfoil and optimized airfoil. (a) Curve of pressure coefficient. (b) Curve of lift coefficient. (c) Curve of resistance coefficient. (d) Curve of lift drag ratio.
5.2 Analysis of hydraulic performance of optimized rear airfoil
Given the dynamic change in turbine flow in the application scenario, the change in flow field of the airfoil should have sensitivity and reliability. Therefore, it is necessary to analyze the hydraulic performance of the optimized airfoil under different flow-field conditions. The Reynolds numbers of the calculated flow field are set at 300, 3000, and 30 000, respectively, with the angle of attack ranging from −10 to 20°.
As depicted in Fig. 12, when the Reynolds number is 3000, the pressure coefficient distribution across the airfoil the airfoil is notably concentrated, indicating that the pressure distribution coefficient has a better distribution in this range. At the Reynolds numbers of 300 and 30 000, the overall changes observed in the airfoil are similar. At low Reynolds number, the leading edge pressure coefficient of the airfoil is larger, while at high Reynolds number, the pressure coefficient of the optimized airfoil is larger than the trailing edge.
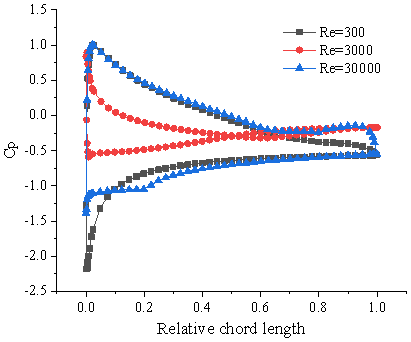
Figure 12Pressure coefficient distribution curves of the optimized airfoil at different Reynolds.
Figure 13a shows the variation curve of the lift coefficient under different flow-field conditions. The fluctuation phenomenon of lift coefficient under different attack angles α is more obvious than that under high Reynolds number conditions. When the Reynolds number is 30 000 and the attack angle α is >10°, the lift coefficient changes greatly, and the variation phenomenon in the direction of negative attack angle α and large attack angle is higher than that of low Reynolds number. The lift coefficient of the optimized airfoil is higher at low Reynolds number.
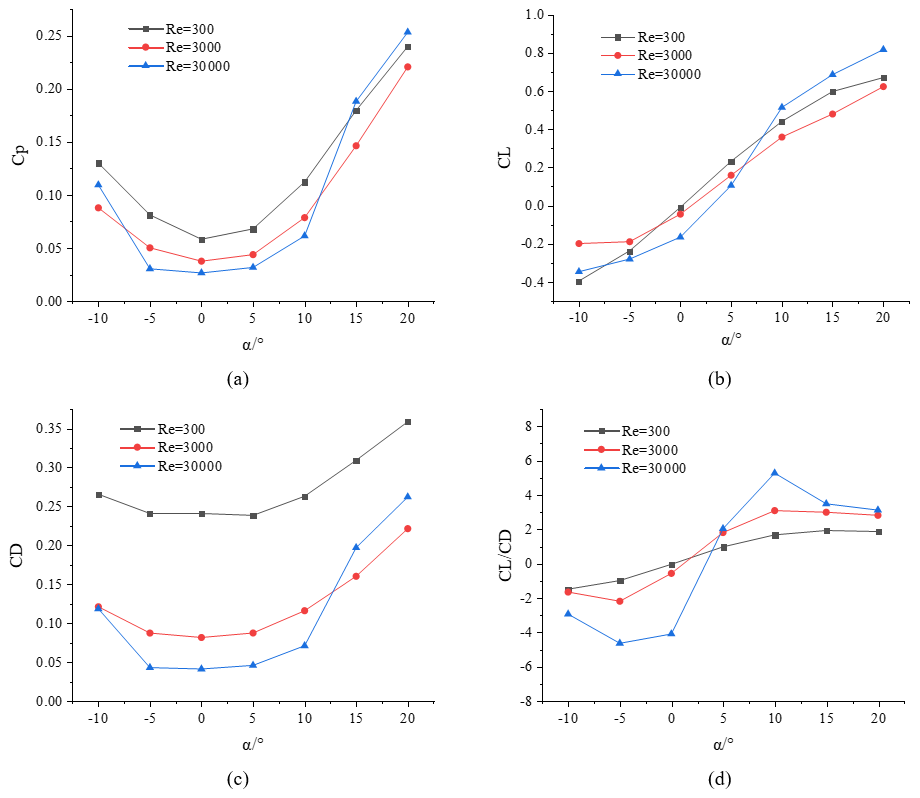
Figure 13Variation in the optimized airfoil at different Reynolds numbers. (a) Curve of pressure coefficient. (b) Curve of lift coefficient. (c) Curve of resistance coefficient. (d) Curve of lift drag ratio.
Figure 13b illustrates the lift coefficient curves of the initial airfoil and the optimized airfoil at different Reynolds numbers. As the angle of attack increases, the lift coefficient increases. Notably, the initial airfoil NACA66 is a symmetrical airfoil, the negative angle of attack and the positive angle of attack have the same variation trend.
Figure 13c reveals that the resistance coefficient of positive attack angle α increases more obviously, which is mainly related to the characteristics of airfoil family. The drag coefficient basically maintains a constant value in the range of −5 to 5°. When the angle of attack is greater than 15°, the drag coefficient of the airfoil at a Reynolds number of 30 000 exceeds the drag coefficient at a Reynolds number of 3000, indicating that the viscous pressure differential resistance increases under this state, and the fluid characteristics mainly affect the hydraulic performance of the airfoil.
Figure 13d demonstrates that across various Reynolds numbers, the lift-to-drag ratio remains relatively stable compared to the initial airfoil when the angle of attack exceeds 15°. Under different Reynolds numbers, the rotation position of the optimized rear airfoil is near the angle of attack of 10°. When the airfoil is at a negative angle of attack, the lift-to-drag ratio in turbulent flow is smaller than that in laminar flow and excessive flow. The lift-to-drag ratio of the optimized airfoil is in the same state near the angle of attack of 5°. With the increase in the angle of attack, the lift-to-drag ratio at high Reynolds number is gradually larger than that at low Reynolds number. In summary, the performance of the optimized airfoil is relatively stable in laminar flow and transition phase, and better hydraulic characteristics can be obtained in the range of 5–10° angle of attack.
5.3 Analysis of airfoil flow-field characteristics
5.3.1 CFD simulation process
The optimized airfoil needs to further determine its optimization effect through hydrodynamics. At present, the commonly used method is to analyze the flow-field characteristics of the airfoil through CFD, and the time-homogenized N-S equation is used to solve the optimal hydraulic characteristics of the airfoil. Gambit was used to divide the airfoil and the flow-field grid, and a C-structured grid was used to locally encrypt around the airfoil. During the CFD simulations, different flow rates were prescribed as inlet boundary conditions, and the corresponding lift and drag coefficients were analyzed. The standard k−ϵ turbulence model was employed for the CFD verification, following its established application in hydraulic turbomachinery simulations (Hua et al., 2022; Zhang et al., 2015). In the present study, the CFD analysis is primarily used to compare the pressure distribution, velocity field, and overall hydrodynamic characteristics of the original and optimized airfoils under liquid-flow conditions. The control equation is spatially discretized by the finite volume method of the element center, the viscous vector flux is discretized by the second-order central difference scheme, and the time term is solved by the two-time-step propulsion method (Xiong et al., 2021; Qu et al., 2024; Zhou and Wang, 2024).
In the process of analysis, it is necessary to verify the correlation of the grid. The maximum pressure and flow rate in the simulation results were analyzed to verify the independence of the two (Gleize et al., 2022). The convergence standard of flow-field calculation is set to 10−4. In the process of grid independence verification, according to the time step of 0.01 s and the inlet flow of the flow field 40 L s−1, the correlation test was carried out for the four grid quantities. In the process of numerical iteration, underrelaxation technology is used to accelerate the convergence of the calculation (Coles and Wadcock, 1979; Krzysiak and Narkiewicz, 2006). After the simulation reaches steady state, the results obtained are shown in Table 1.

As shown in Table 1, the maximum pressure varies with the number of computational grids. When the grid number exceeds approximately 3 × 10⁴, the maximum pressure remains nearly unchanged, indicating that the numerical results are relatively insensitive to further grid refinement. Considering the calculation time and simulation error, it can be approximated that the grid number of 3 × 10⁴ can meet the requirement of grid number independence. Since the lift resistance is relatively large when the angle of attack is 5°, the fluid density is set to 1.4 g cm−3, and the flow field is set to 10 and 40 L s−1.
5.3.2 Analysis of CFD simulation results
(1) Comparison of airfoil flow-field characteristics
By optimizing the hydraulic performance of the rear airfoil under different flow-field environments, the pressure distribution cloud diagram of the airfoil in the design flow field is obtained, as shown in Fig. 14. When the flow rate is 10 L s−1, the high-pressure area generated by the optimized airfoil and the original airfoil is mainly concentrated in the leading edge and the optimized airfoil pressure is relatively high. In addition, the negative pressure area of the upper part of the optimized airfoil is larger than that of the original airfoil, and the airfoil generates more lift. The above phenomenon becomes more obvious with the increase in flow rate (40 L s−1). It can be observed in the cloud image that after optimization, the difference between the maximum pressure at the leading edge of the blade and the pressure at the trailing edge of the blade increases, and the difference between the pressure surface and the suction surface increases.
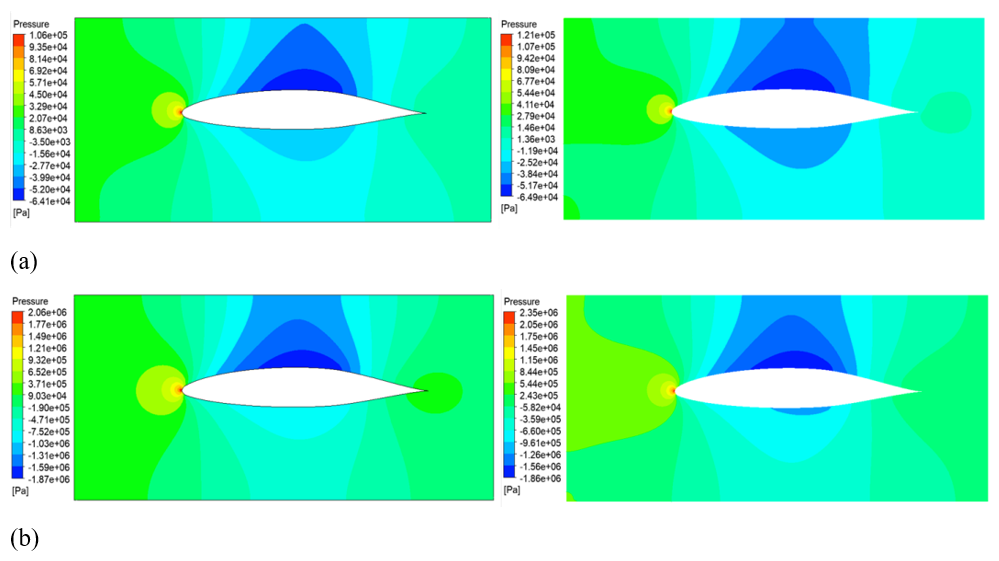
Figure 14Comparison of pressure cloud images between the original airfoil and the optimized rear airfoil. (a) 10 L s−1 flow rate. (b) 40 L s−1 flow rate.
Figure 15 shows the velocity distribution cloud diagram of the two airfoils under different flow fields. In the flow field, due to the interaction between the inertia force and the viscous force of the fluid, the flow at the trailing edge may be easily separated, but it can be found from the optimized airfoil velocity cloud image that there are no adverse flow phenomena such as flow separation and vortex around the airfoil. With the increase in the flow in the flow field, the overall flow velocity around the airfoil in the flow field increases, and the flow velocity distribution of the optimized airfoil is consistent with that of the original airfoil without flow separation.
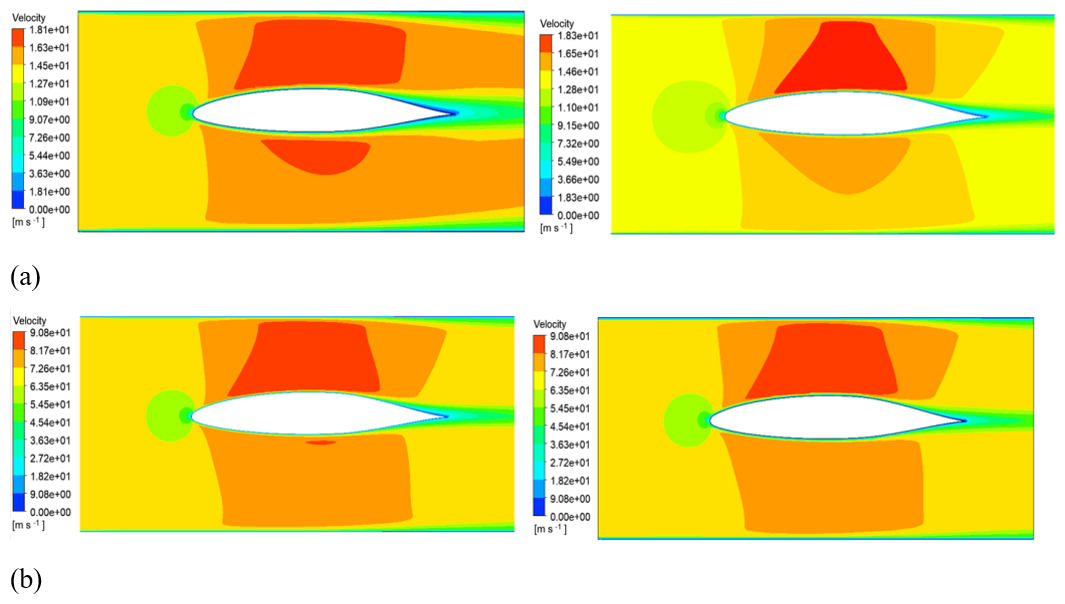
Figure 15Comparison of velocity cloud images between the original airfoil and the optimized rear airfoil. (a) 10 L s−1 flow rate. (b) 40 L s−1 flow rate.
(2) Comparison of lift and drag coefficients
Figure 16 shows the curves of lift coefficient and drag coefficient for the initial wing and the optimized wing under different flow-field characteristics. The optimized airfoil generates higher lift and lower drag than the original wing under different flow rates, and its lift-to-drag ratio is higher than that of the original airfoil. A higher lift-to-drag ratio of the airfoil indicates better hydrodynamic performance. Since the optimized airfoil has better fluid performance within the angle of attack range of 5 to 10° and since the angle of attack in the fluid simulation analysis is 5°, when the angle of attack increases, the generated lift usually also increases, indicating that the performance adaptability of the optimized airfoil is stronger. A high lift-to-drag ratio can increase the favorable hydrodynamic force relative to the profile drag, thereby enhancing the mechanical power output.
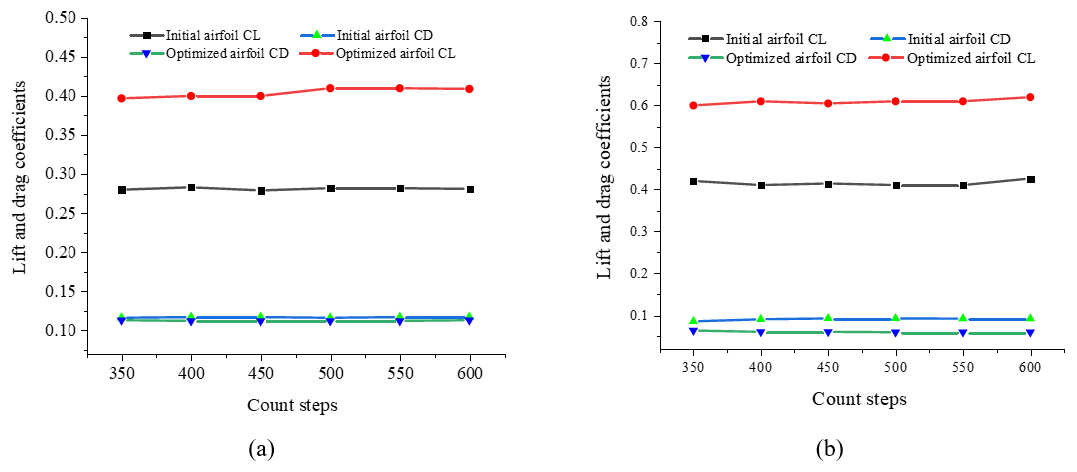
Figure 16Variation in the optimized airfoil at different Reynolds numbers. (a) 10 L s−1 flow rate. (b) 40 L s−1 flow rate.
5.4 Turbine characteristic experimental analysis
In order to further verify the hydraulic performance of the optimized rear airfoil, an experimental platform for impeller hydraulic performance was established, as shown in Fig. 17. The experimental hydraulic circuit is mainly composed of a turbine test bench, water pump, water tank, flow meter, torque tester, and PC data acquisition terminal, in which the impeller test platform is composed of the front guide cascade, the rear guide cascade, the turbine, and the torque coupling at the tail; airfoil parameters are shown in Table 2. During the experiment, the speed and torque of the impeller were tested by adjusting the displacement of the pump, and then the hydraulic performance of the standard NACA66 airfoil was compared with that of the optimized rear airfoil.
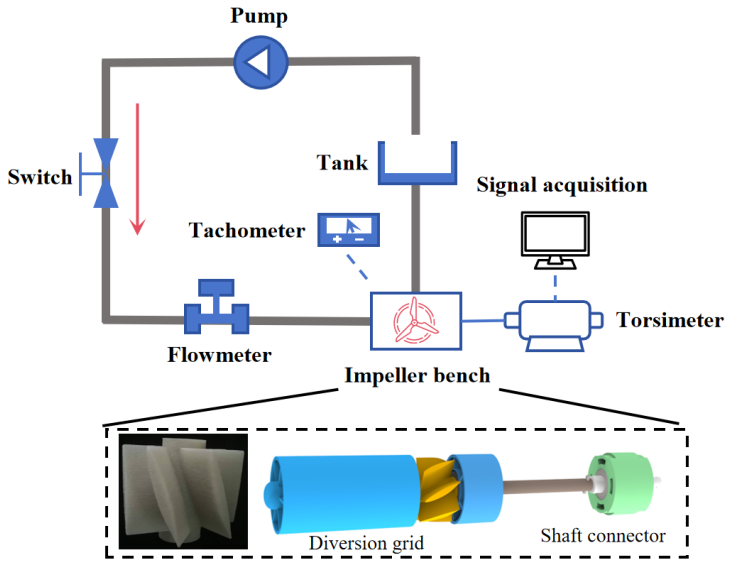
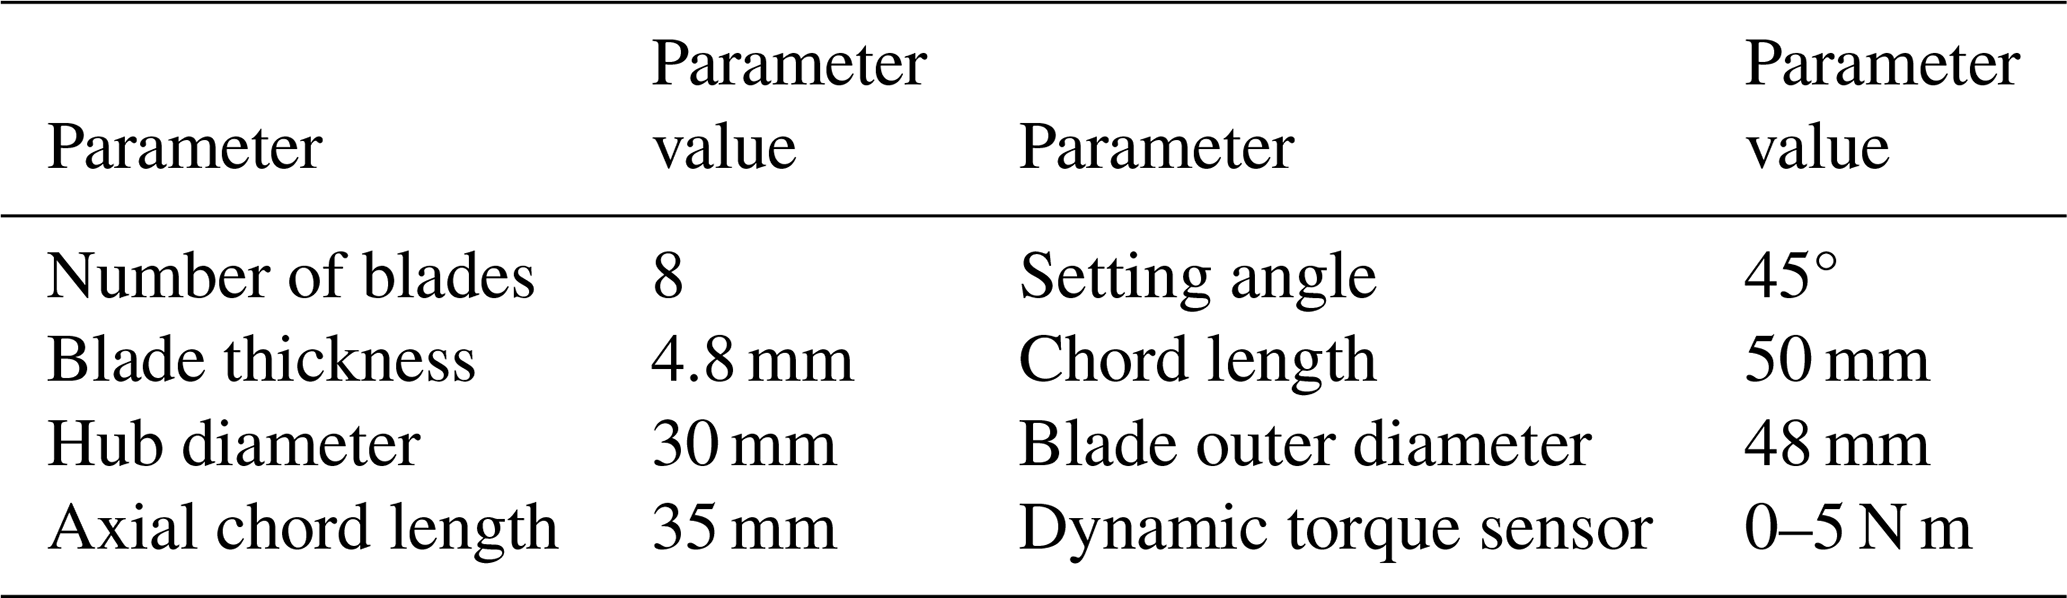
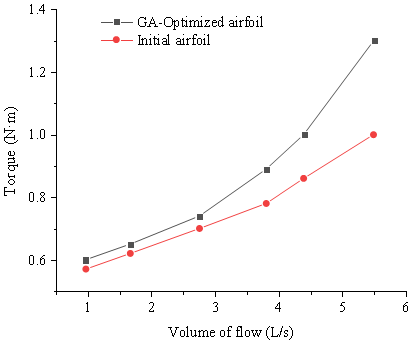
Figure 18 shows the maximum torque value of each measuring point for the two airfoils under flow variation. It can be clearly found that turbine torque gradually increases with the increase in flow, and the flow and turbine torque value show a quasi-quadratic relationship. When the flow rate is small, the load of the turbine is large, and the torque of the fluid acting on the turbine cannot overcome the external load. When the flow rate increases, the torque value of the optimized airfoil increases significantly compared with that of the original airfoil.
As shown in Fig. 19, when the flow rate is 4 L s−1, the torque generated by the optimized airfoil turbine is relatively stable, while the fluctuation in the original airfoil turbine is relatively large, which is not conducive to the stability of the downhole turbine generator during operation.
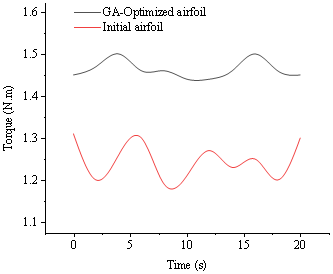
Figure 19Comparison curve of torque value between the original airfoil and the optimized airfoil.
When the turbine is stabilized, the torque generated by it is equal to the external load, and the combined external torque of the turbine is zero. When the torque generated by the fluid is greater than the load, the turbine starts to move from rest, and the change in the angular velocity of the turbine is directly related to the impact torque of the turbine. As shown in Fig. 20, with the increase in flow rate, the turbine speed is gradually provided. Compared with the original NACA66 airfoil, the optimized design achieves a higher rotational speed at the same flow rate.
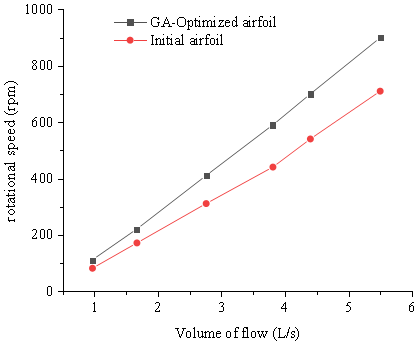
To further establish the relationship between the sectional airfoil optimization and turbine-level performance, the mechanical power (Cpower), tip-speed ratio (TSR), and normalized power coefficient were calculated from the experimentally measured torque and rotational speed. Since the torque and rotational speed were obtained at the same flow rate, load, and steady operating conditions, the mechanical power was determined by
The tip-speed ratio was calculated as , and the normalized power coefficient was defined as
where and ρ represents the density of the drilling fluid, A represents the cross-sectional area of the flow, and U represents the average flow velocity.
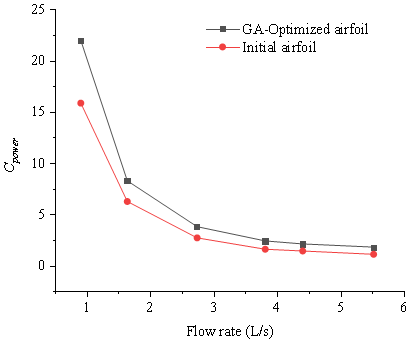
As shown in Fig. 21, the TSR of both turbines increases with increasing flow rate, while the optimized turbine maintains a consistently higher TSR over the entire tested range. The TSR of the GA-optimized turbine increases from approximately 0.33 to 0.45, compared with approximately 0.25–0.36 for the original turbine. This result indicates that the optimized blade produces a stronger rotational response under the same incoming-flow conditions. Figure 22 shows that Cpower decreases with increasing flow rate for both turbines because the reference kinetic-power term increases with the cube of the inflow velocity. Nevertheless, the optimized turbine exhibits a consistently higher Cpower than the original turbine at all investigated operating points, demonstrating that the improvement in sectional hydrodynamic characteristics is reflected in the turbine-level mechanical response.
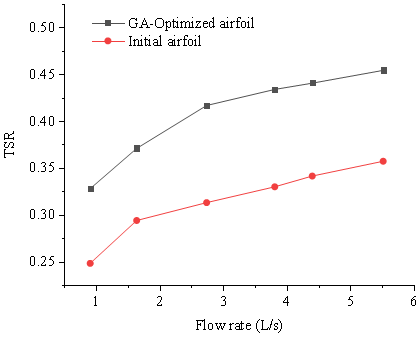
Figure 21Tip-speed ratio (TSR) curve between the original airfoil and the optimized airfoil.
6.1 Conclusion
This study developed a computationally efficient optimization framework for the hydraulic airfoil of a downhole turbine generator by integrating Bezier parameterization, genetic-algorithm-based optimization, MATLAB-controlled XFOIL analysis, CFD verification, and turbine-level experiments. The principal conclusions are summarized as follows.
-
High-order Bezier parameterization accurately reproduced the baseline NACA66 (mod) profile while enabling flexible geometric modification through eight movable control points. The resulting parameterization provided a smooth and controllable design space suitable for iterative airfoil optimization.
-
The genetic-algorithm-based optimization, coupled with XFOIL, effectively improved the sectional hydrodynamic performance while satisfying the imposed geometric constraints. The optimized profile exhibited a reduced upper-surface thickness and a rearward shift in the maximum thickness position. Compared with the original profile, the optimized airfoil showed a higher lift-to-drag ratio over a broad range of positive angles of attack, with an improvement of approximately 26.9 %.
-
Reynolds-number sensitivity analysis at Re=300, 3000, and 30 000 indicated that the optimized profile maintained relatively stable hydrodynamic characteristics within the investigated low-Reynolds-number range, with favorable performance mainly occurring at angles of attack of approximately 5–10°. CFD results further confirmed improved pressure distribution and lift–drag characteristics under the investigated liquid-flow conditions.
-
Turbine experiments demonstrated that the sectional airfoil improvement translated into enhanced turbine-level mechanical performance. Under comparable flow-rate and loading conditions, the optimized turbine produced higher torque and rotational speed than the turbine equipped with the original NACA66 profile. The derived tip-speed ratio and normalized power-performance characteristics also showed consistent improvements, supporting the effectiveness of the proposed optimization framework for downhole turbine-generator applications.
6.2 Limitations
XFOIL was adopted as a rapid two-dimensional comparison tool. However, due to differences in fluid density, viscosity, pressure loads, and other liquid flow effects, relying solely on the Reynolds number similarity cannot fully represent the physical similarity between aerodynamics and hydraulic environments. This analysis is limited to the range of Re=300–30 000 and cannot fully reproduce the dependency of actual drilling fluids on temperature, pressure, and rheological properties. Additionally, cavitation phenomena were not explicitly modeled, and the numerical simulation assumed that the blades were rigid structures with no fluid–structure interactions. Moreover, the optimization process was conducted at the two-dimensional wing shape level, so the three-dimensional blade effects, the constraints between the impeller and the casing, and the interactions between the blades and the guide vanes were not clearly included in the optimization model.
6.3 Future work
Future work will focus on expanding the existing cross-section optimization framework into a more comprehensive turbine stage design method. Cavitation modeling and fluid–structure interaction (FSI) analysis will be introduced to assess the onset of cavitation, blade deformation, stress and vibration under hydraulic loads under real operating conditions. The current two-dimensional optimization will also be extended to three-dimensional blade and turbine stage structural configurations to consider the cross-blade chord geometry, hub and casing effects, and the interaction between guide vanes. More in-depth experimental studies will be conducted within a broader range of flow rates, loads, Reynolds numbers, pressures, temperatures, and drilling fluid characteristics, and simultaneous measurements of torque, rotational speed, pressure drop and flow rate will be taken to quantify mechanical power and hydraulic efficiency. Additionally, systematically comparing other population-based optimization methods under the same variables, constraints, and computational budget will be carried out to further enhance the robustness and accuracy of the optimization framework.
The data supporting the findings of this study are available from the corresponding author upon reasonable request. The datasets are not publicly deposited because the authors prefer to manage data access through the corresponding author to ensure appropriate data verification, interpretation, and responsible use. Requests from researchers with legitimate scientific purposes will be considered on a case-by-case basis.
Jun Qu designed the study and wrote the article. Xingyu Tan and Peng Zhou calculated the model and conducted the application research. Qilong Xue provided guidance in the writing. Yingqi Li translated the original manuscript from Chinese into English. All the authors gave their final approval for publication.
The contact author has declared that none of the authors has any competing interests.
Publisher's note: Copernicus Publications remains neutral with regard to jurisdictional claims made in the text, published maps, institutional affiliations, or any other geographical representation in this paper. The authors bear the ultimate responsibility for providing appropriate place names. Views expressed in the text are those of the authors and do not necessarily reflect the views of the publisher.
This project is supported by special fund of State Key Laboratory of Deep Earth Exploration and Imaging, No. DEEI20252232.
This paper was edited by Pengyuan Zhao and reviewed by Mariusz Kostrzewski and two anonymous referees.
Akram, M. T. and Kim, M.-H.: CFD analysis and shape optimization of airfoils using class shape transformation and genetic algorithm – Part I, Appl. Sci., 11, 3791, https://doi.org/10.3390/app11093791, 2021.
Bourisli, R. I. and Hamadeh, F. Z. S.: Optimizing NACA airfoil thickness function parameters for maximum lift-to-drag ratio, AIAA SciTech 2020 Forum, Orlando, FL, USA, 6–10 January 2020, AIAA 2020-1297, https://doi.org/10.2514/6.2020-1297, 2020.
Coles, D. and Wadcock, A. J.: Flying-hot-wire study of flow past an NACA 4412 airfoil at maximum lift, AIAA J., 17, 321–329, https://doi.org/10.2514/3.61127, 1979.
Gleize, V., Costes, M., and Mary, I.: Numerical simulation of NACA4412 airfoil in pre-stall conditions, Int. J. Numer. Method. H., 32, 1375–1397, https://doi.org/10.1108/HFF-07-2021-0514, 2022.
Hua, G., Qu, B., and Chen, H.: Parametric design and optimization of tubular turbine runner blades, J. Mech. Elect. Eng., 39, 820–826, https://doi.org/10.3969/j.issn.1001-4551.2022.06.015, 2022.
Jia, C.: Development challenges and future scientific and technological researches in China's petroleum industry upstream, Acta Petrolei Sinica, 41, 1445–1464, https://doi.org/10.7623/syxb202012001, 2020.
Jia, H., Fu, Q., Chen, D., Jia, Q., Sun, D., Tian, D., and Yue, L.: Parameter design and test analysis of downhole turbine generator in water injection well, J. Xi'an Shiyou University (Natural Science Edition), 36, 83–88, 121, 2021.
Krzysiak, A. and Narkiewicz, J.: Aerodynamic loads on airfoil with trailing-edge flap pitching with different frequencies, J. Aircraft, 43, 407–418, https://doi.org/10.2514/1.15597, 2006.
Lu, H.: Study on parameter matching and structure optimization between regulating wheel and turbine of downhole generator, M.S. thesis, Southwest Petroleum University, Chengdu, China, 2017.
Lu, H., Li, B., and Zhang, X.: Optimization design for downhole turbine generator based on response surface method, Int. J. Eng. Adv. Res. Technol., 2, 16–21, 2016.
Morgado, J., Vizinho, R., Silvestre, M. A. R., and Páscoa, J. C.: XFOIL vs CFD performance predictions for high lift low Reynolds number airfoils, Aerospace Sci. Technol., 52, 207–214, https://doi.org/10.1016/j.ast.2016.02.031, 2016.
Muis, A., Sutikno, P., Soewono, A., and Hartono, F.: Design optimization of axial hydraulic turbine for very low head application, Energy Proced., 68, 263–273, https://doi.org/10.1016/j.egypro.2015.03.255, 2015.
Qu, J., Xue, Q., Wang, J., Sun, J., and Li, J.: Optimization of a turbine flow well logging tool based on the response surface method, Machines, 11, 455, https://doi.org/10.3390/machines11040455, 2023.
Qu, J., Ji, G., Wang, Q., Wang, J., Wang, C., Hu, Y., Li, Y., and Xue, Q.: Analysis of the dynamic characteristics of an eccentric cylinder in axial flow, Geoenergy Sci. Eng., 236, 212735, https://doi.org/10.1016/j.geoen.2024.212735, 2024.
Seifi Davari, H., Botez, R. M., Seify Davari, M., and Chowdhury, H.: Wind turbine optimization by blade element momentum method and particle swarm optimization technique, J. Eng., 2025, 8779428, https://doi.org/10.1155/je/8779428, 2025a.
Seifi Davari, H., Seify Davari, M., and Ntantis, E. L.: A review on the design and optimization of lift-based hydrokinetic turbines: Darrieus, Gorlov, and helical types, Result. Eng., 28, 107746, https://doi.org/10.1016/j.rineng.2025.107746, 2025b.
Sun, X., Tan, Y., Li, X., Ding, C., and Hu, Q.: The effect of downhole turbine modeling parameters on mechanical output performance, Processes, 13, 507, https://doi.org/10.3390/pr13020507, 2025.
Sun, Z., Li, Z., Xu, C., Zhang, Q., and Feng, L.: Airfoil optimization and experimental research based on the B-spline and genetic algorithm, J. Eng. Thermophys., 40, 2806–2814, 2019.
Sun, Z., Mao, Y., and Fan, M.: Performance optimization and investigation of flow phenomena on tidal turbine blade airfoil considering cavitation and roughness, Appl. Ocean Res., 106, 102463, https://doi.org/10.1016/j.apor.2020.102463, 2021.
Tadjfar, M., Kamari, D., and Tarokh, A.: Use of machine learning to optimize actuator configuration on an airfoil, J. Fluids Struct., 128, 104141, https://doi.org/10.1016/j.jfluidstructs.2024.104141, 2024.
Tan, J., Bian, B., Si, X., Wang, S., and Yuan, P.: Special hydrofoil optimization design of tidal turbine based on multi-objective genetic algorithm, Periodical of Ocean University of China, 50, 127–134, https://doi.org/10.16441/j.cnki.hdxb.20180106, 2020.
Wei, X., Wang, X., and Chen, S.: Research on parameterization and optimization procedure of low-Reynolds-number airfoils based on genetic algorithm and Bezier curve, Adv. Eng. Softw., 149, 102864, https://doi.org/10.1016/j.advengsoft.2020.102864, 2020.
Wu, N.-C. and Liu, C.-Z.: Randomized progressive iterative approximation for B-spline curve and surface fittings, Appl. Math. Comput., 473, 128669, https://doi.org/10.1016/j.amc.2024.128669, 2024.
Xiong, P., Deng, J., and Chen, X.: Performance improvement of hydrofoil with biological characteristics: Tail fin of a whale, Processes, 9, 1656, https://doi.org/10.3390/pr9091656, 2021.
Yuan, P., Chen, C., Wang, S., and Tan, J.: Study on optimal design of the laminar hydrofoil of a tidal turbine based on Bezier curve, Renew. Energy Resour., 37, 1576–1580, 2019.
Zhang, S., Xi, D., and Li, H.: Research on airfoil design method based on geometric characteristic parameter control, J. Eng. Thermophys., 40, 1058–1064, 2019.
Zhang, X., Yu, S., Gong, Y., Yang, W., and Zhou, Q.: Modeling and optimization for turbine blades based on Bezier curve, J. Mechan. Strength, 37, 266–271, https://doi.org/10.16579/j.issn.1001.9669.2015.02.009, 2015.
Zhang, X., Ou, S., Gong, Y., and Lu, H.: Modification and optimization design of blade for down-hole turbine generator, Mechan. Sci. Technol. Aerospace Eng., 37, 663–668, 2018.
Zhou, Z. and Wang, Y.: Numerical simulation study of the effect of porous media passive flow control on the propulsion performance of airfoils in Kármán vortex streets, Ocean Eng., 311, 118720, https://doi.org/10.1016/j.oceaneng.2024.118720, 2024.
Zhu, G., Feng, J., Guo, P., and Luo, X.: Optimization of hydrofoil for marine current turbine based on radial basis function neural network and genetic algorithm, T. Chinese Soc. Agr. Eng., 30, 65–73, https://doi.org/10.3969/j.issn.1002-6819.2014.08.008, 2014.
- Abstract
- Introduction
- Airfoil parametric design
- Airfoil performance analysis method
- Genetic algorithm
- Airfoil optimization results and analysis
- Conclusion, limitations, and future work
- Code and data availability
- Author contributions
- Competing interests
- Disclaimer
- Financial support
- Review statement
- References