the Creative Commons Attribution 4.0 License.
the Creative Commons Attribution 4.0 License.
 | 17 Apr 2026
Cloud-based mapping of fragmented tobacco fields using multi-source remote sensing to support autonomous agricultural operations
Dongjie Zhao
Zheng Wang
Yabo Jin
Shaoli Huang
Traditional autonomous agricultural systems face significant challenges in performing continuous operations within fragmented field regions. To address this issue, it is essential to upgrade these systems to automatically acquire high-precision field boundaries. This study tests the hypothesis that fragmented tobacco parcels can be reliably mapped using a cloud-based, multi-source remote sensing framework and that the resulting products can directly support autonomous field operations. Using Xuchang City, Henan Province, China, as a case study, we developed a cloud-edge-integrated tobacco mapping workflow on the Google Earth Engine (GEE) platform by fusing Sentinel-2 optical imagery, Sentinel-1 synthetic-aperture radar data, and topographic variables. A comprehensive feature set, including spectral bands, vegetation indices, radar backscatter, texture metrics, and terrain attributes, was used to train and compare three machine learning classifiers: random forest (RF), gradient boosting decision tree (GBDT), and classification and regression tree (CART). RF achieved the highest performance, with an overall accuracy of 93.08 % and a kappa coefficient of 0.92, outperforming GBDT (90.60 %, 0.89) and CART (87.60 %, 0.85). The RF-derived tobacco planting area showed the closest agreement with official statistics, with a consistency ratio of 94.12 %. Model robustness was further demonstrated by direct transfer to the adjacent Pingdingshan City without re-training, yielding a 97.70 % consistency with reported acreage. By shifting field-boundary extraction from manual delineation to automated cloud-based processing, this study provides a scalable solution for mapping fragmented tobacco fields and delivering parcel-level geospatial data to autonomous agricultural systems, with broader applicability to other cash crops in fragmented landscapes.
- Article
(7751 KB) - Full-text XML
- BibTeX
- EndNote


Tobacco is a high-value crop that serves as a significant source of revenue, and an important source of agricultural income and fiscal revenue in many regions worldwide (Wang et al., 2022). In both developed and developing countries, tobacco production plays a significant role in supporting rural livelihoods and regional economic development. With the rapid advancement of artificial intelligence (AI), sensing technologies, and agricultural mechanisation, precision-agriculture systems, such as automated spraying (Tufail et al., 2021), topping (Gravalos et al., 2019) and harvesting (Gravalos et al., 2019; Lin et al., 2025), are increasingly adopted to improve production efficiency and reduce labour inputs. For these intelligent machines, the accurate delineation of field parcels is a fundamental prerequisite, as reliable spatial boundaries are essential for path planning, navigation and task execution during autonomous operations. At the regional scale, accurate crop-distribution mapping also provide critical information on spatial and temporal heterogeneities in agricultural landscapes (Pendrill et al., 2011; Samberg et al., 2016), supports the derivation of biogeophysical variables (Ferencz et al., 2004; Liu et al., 2012), and enables the assessment of crop growth conditions and environmental stress (Virnodkar et al., 2020). Therefore, the precise mapping of tobacco fields is not only indispensable for guiding automated field operations but also for assisting agricultural administrators in formulating evidence-based policies, optimising planting layouts and improving crop-management strategies (Bégué et al., 2018, 2020; Pinter et al., 2003).
Conventional tobacco-field mapping relies on field surveys and manual reporting, which are costly, time consuming and labour intensive, and they are poorly suited to large-area or real-time monitoring (Gao and Huang, 2022), especially in regions dominated by fragmented smallholder farms. In contrast, satellite remote sensing offers an efficient alternative by enabling timely synoptic observation over extensive areas with substantially reduced labour and financial costs. Remote sensing technologies have been widely utilised in agricultural monitoring, including the detection of biophysical and biochemical parameters (Kganyago et al., 2024), irrigation assessment (Bastiaansen et al., 2000) and fragmentation analysis (Raab and Spies, 2023). However, the large data volumes associated with multi-temporal and multi-sensor satellite imagery impose significant computational burdens, historically limiting the operational use of remote sensing for real-time agricultural decision-making. The emergence of cloud-computing platforms, most notably Google Earth Engine (GEE), has revolutionised remote sensing workflows by enabling on-demand processing of massive datasets. Numerous studies have demonstrated that combining GEE with advanced machine learning classifiers and multi-source satellite data significantly enhances crop mapping accuracy and efficiency. In particular, the integration of Sentinel-1 synthetic-aperture radar and Sentinel-2 multispectral imagery has proven effective for crop discrimination under varying weather conditions. Awad Mohamad (2021) and Luo et al. (2021) utilised this multi-source fusion with support vector machine (SVM) and random forest classifiers, respectively, to achieve high-accuracy crop classification. Eisfelder et al. (2024) further verified the transferability of the Sentinel-1/2 integration workflows for multi-crop identification in Ethiopia. For classifier performance on GEE, Clemente et al. (2020) conducted comparative studies and identified random forest and SVM as the top performers, while Xue et al. (2023) further improved the accuracy by integrating simple non-iterative clustering (SNIC) segmentation. Beyond standard classification methods, innovative frameworks have also emerged. Yang et al. (2021) introduced the AGTOC framework for automatic training-sample generation, demonstrating robust cross-sensor transferability. GEE has also been applied to large-scale dynamics monitoring; Amani et al. (2020) produced the first Annual Crop Inventory (ACI) map, and Liu and Wang (2022) successfully detected crop-type transitions (e.g. soybean to maize) and poleward expansions in north-eastern China to support ecological policy-making.
Despite these advances, existing studies have largely focused on staple crops such as wheat, maize and rice. Research targeting tobacco remains limited. This gap is noteworthy because tobacco fields are often characterised by small parcel sizes, spatial fragmentation and phenological patterns distinct from major food crops, posing additional challenges for remote-sensing-based identification. Moreover, the lack of accurate, parcel-level tobacco maps constrains the deployment of autonomous tobacco machinery and limits the availability of reliable spatial data for regional production management. To bridge this gap and facilitate the autonomous operations of tobacco machinery, as well as provide accurate geospatial data for regional management, this study selected Xuchang City, a major tobacco-producing region in Henan Province, China. We leveraged the GEE platform to integrate multi-source imagery, including Sentinel-2 optical imagery, Sentinel-1 synthetic-aperture radar (SAR) observations and topographic variables. From these inputs, we derived a comprehensive feature set comprising spectral signatures, vegetation indices, radar backscatter, tasselled cap components, texture metrics and terrain attributes. Three machine learning classifiers – random forest, gradient boosting tree (GBT), and classification and regression tree (CART) – were trained and comparatively evaluated for tobacco-field mapping. Model performance is evaluated using both ground-truth samples and official statistical data, and the transferability of the optimal classifier is further tested in an adjacent tobacco-growing region. The objectives of this study are to develop a high-accuracy cloud-based framework for mapping fragmented tobacco fields using multi-source remote sensing data, evaluate and compare the performance of commonly used machine learning classifiers for tobacco identification on the GEE platform, and provide reliable geospatial information to support autonomous tobacco-field operations and precision regional management.
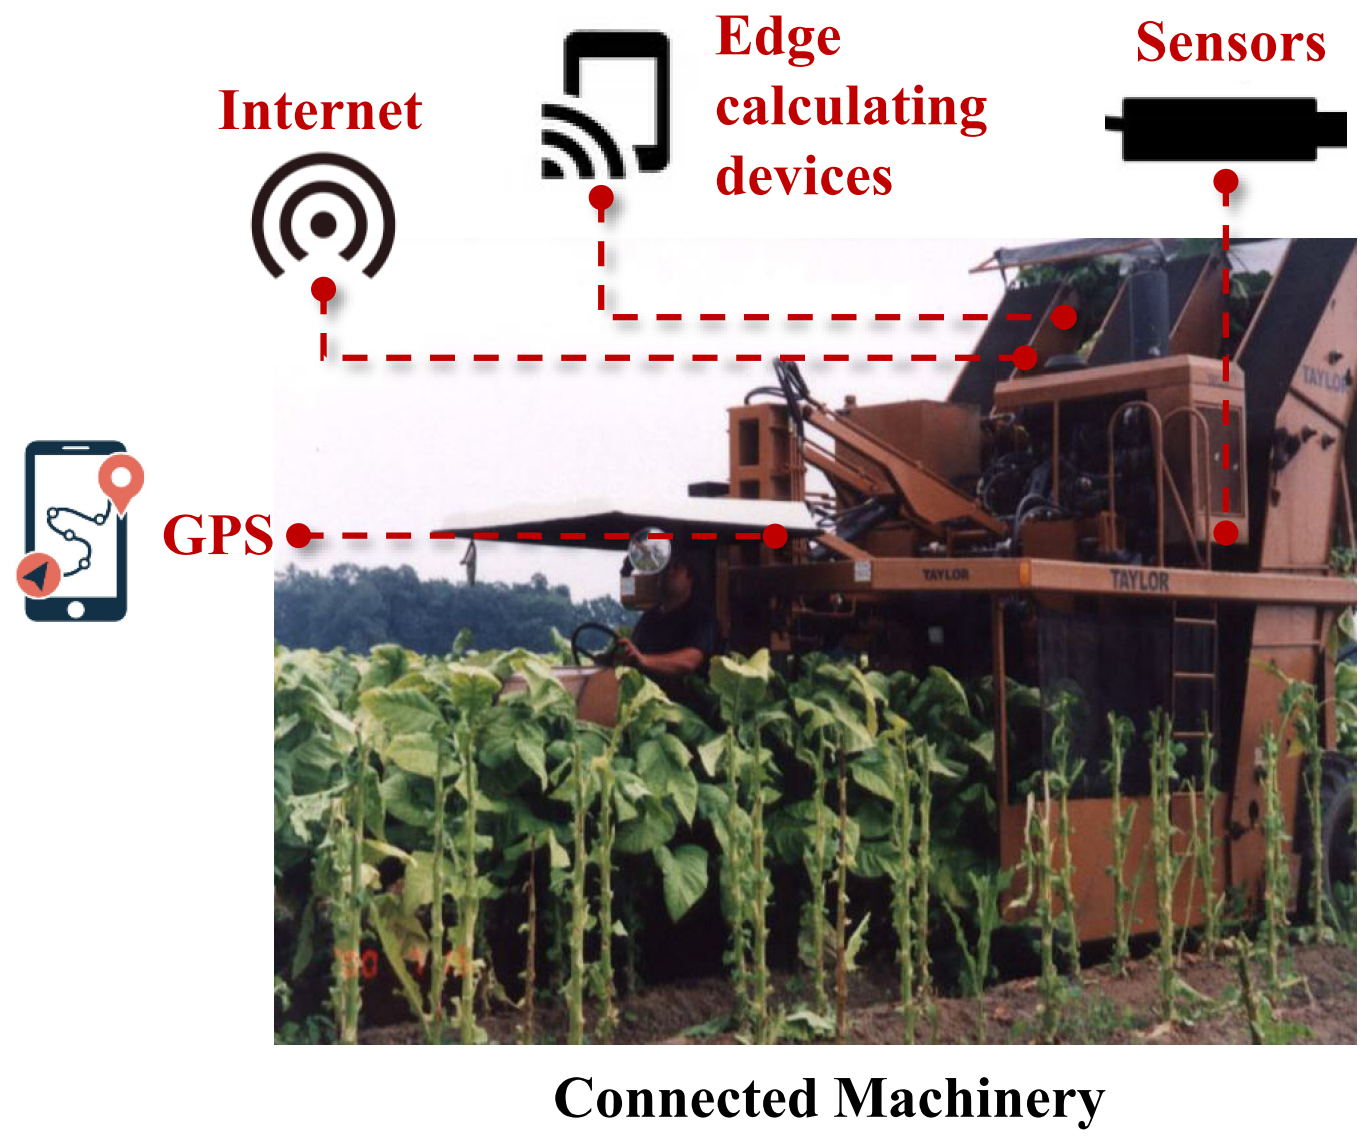
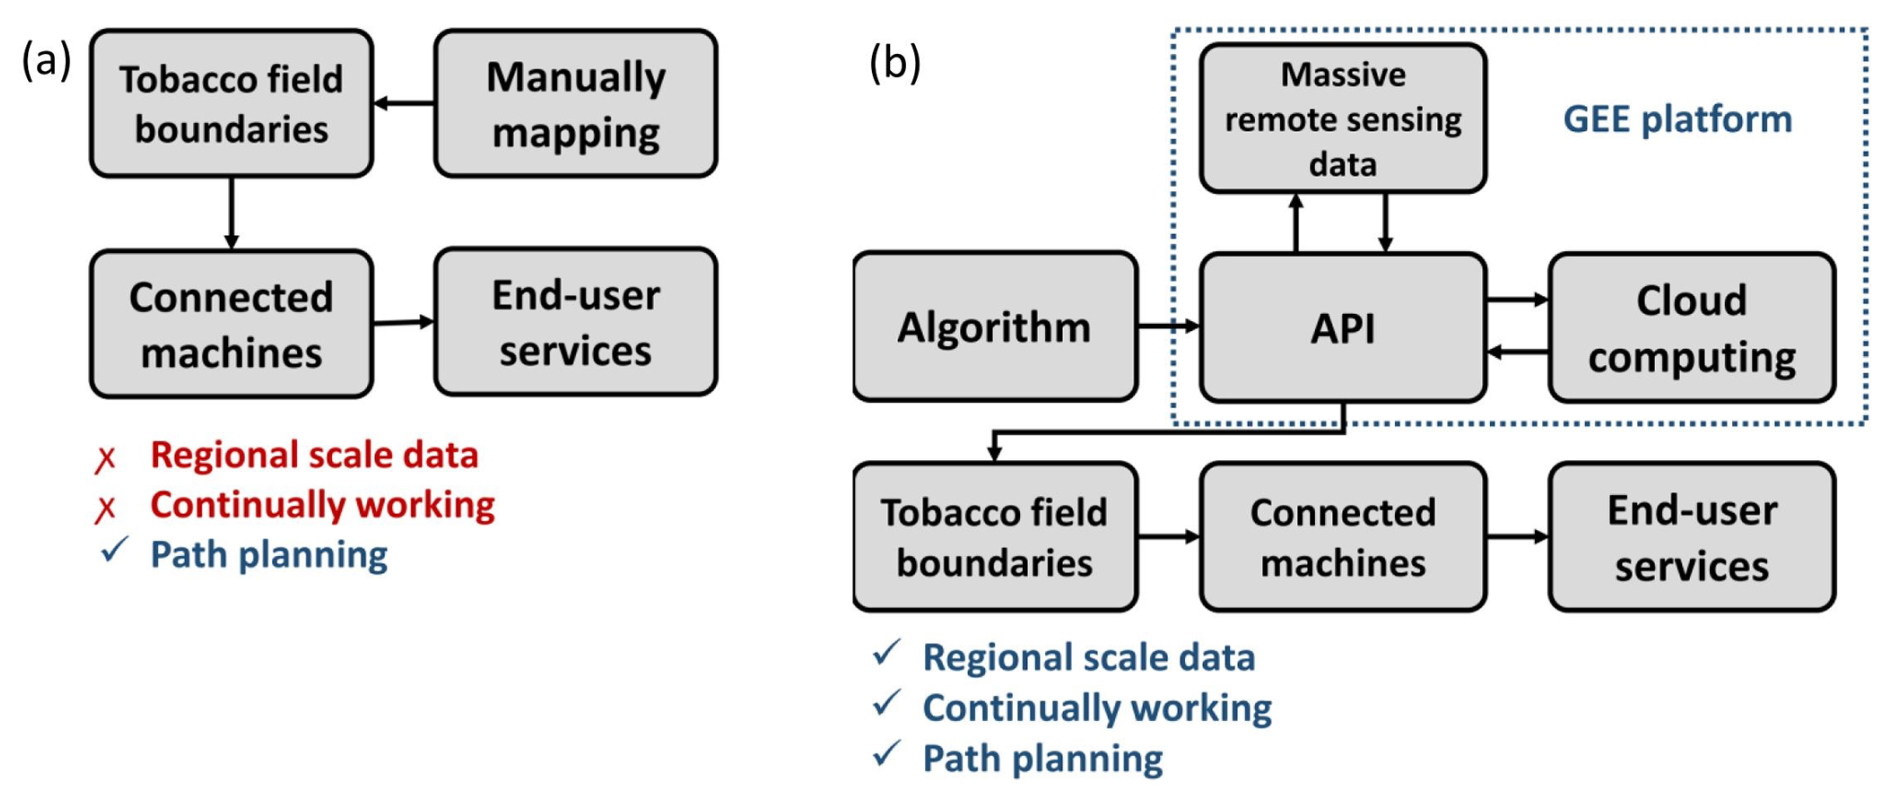
Current autonomous agricultural systems typically require a pre-operational step where field boundaries are manually delineated on on-board edge-computing units (e.g. Raspberry Pi or industrial PCs) using satellite base maps. Subsequently, integrated with on-board sensors such as LiDAR or visual cameras for obstacle avoidance and crop recognition, the system guides the machinery to perform specific tasks, such as harvesting and spraying, within the defined parcel. Edge-computing devices can integrate real-time feedback with field-boundary base maps to provide obstacle avoidance and small-scale course correction for agricultural machinery along their planned routes.
However, a significant limitation arises when operating in complex agricultural landscapes. While a single manual delineation suffices for large-scale contiguous farms, it is inefficient for smallholder regions where tobacco fields are typically small and geographically fragmented. Manual annotation is thus ill suited for supporting continuous operations across such scattered territories.
To address this challenge, the framework proposed in this study features a core module designed to automatically and accurately extract scattered field boundaries, providing the necessary geospatial data for continuous autonomous operations (Fig. 1). The system consists of three parts: (1) an edge-computing unit preloaded with extraction algorithms and vector data, (2) a cloud-based processing module that calls GEE APIs to identify tobacco-field extents from satellite imagery and (3) an execution module that uses the extracted boundaries as geometric constraints. By integrating vision sensors and GPS, the system performs autonomous harvesting within the field, while the edge device handles inter-field navigation. This architecture successfully realises seamless cross-field automation in fragmented landscapes. The core system upgrade lies in the integration of an automated tobacco-field extraction algorithm capable of invoking GEE APIs, which provides the essential foundational data for the autonomous equipment.
3.1 Study area
Located in central Henan Province (Fig. 2), Xuchang City lies between 33°42′–34°24′ N and 113°03′–114°19′ E, covering 4979 km2. The terrain is dominated by flat alluvial plains with an average elevation of ∼75 m, forming one of the province's most important agricultural bases. The climate is warm-temperate, semi-humid monsoon, with a mean annual temperature of ∼14.3 °C and mean annual precipitation of ∼740 mm, 60 %–70 % of which falls during June–September. Four distinct seasons, abundant summer sunshine, and concurrent rainfall and heat provide favourable conditions for tobacco germination, growth and ripening. As a major cash crop of Xuchang, tobacco is extensively cultivated in Xiangcheng County, Yanling County and Jian'an District. According to the Henan Statistical Yearbook (Henan Statistical Yearbook, 2024), in 2023, Xuchang City harvested 31 900 t of tobacco from 11 240 ha of planted area. Sharing similar climatic traits with its neighbour Xuchang, Pingdingshan City's central western hilly terrain is eminently suitable for tobacco farming, making it one of China's leading regions for premium tobacco production. Therefore, we selected Pingdingshan as the study area for method validation.
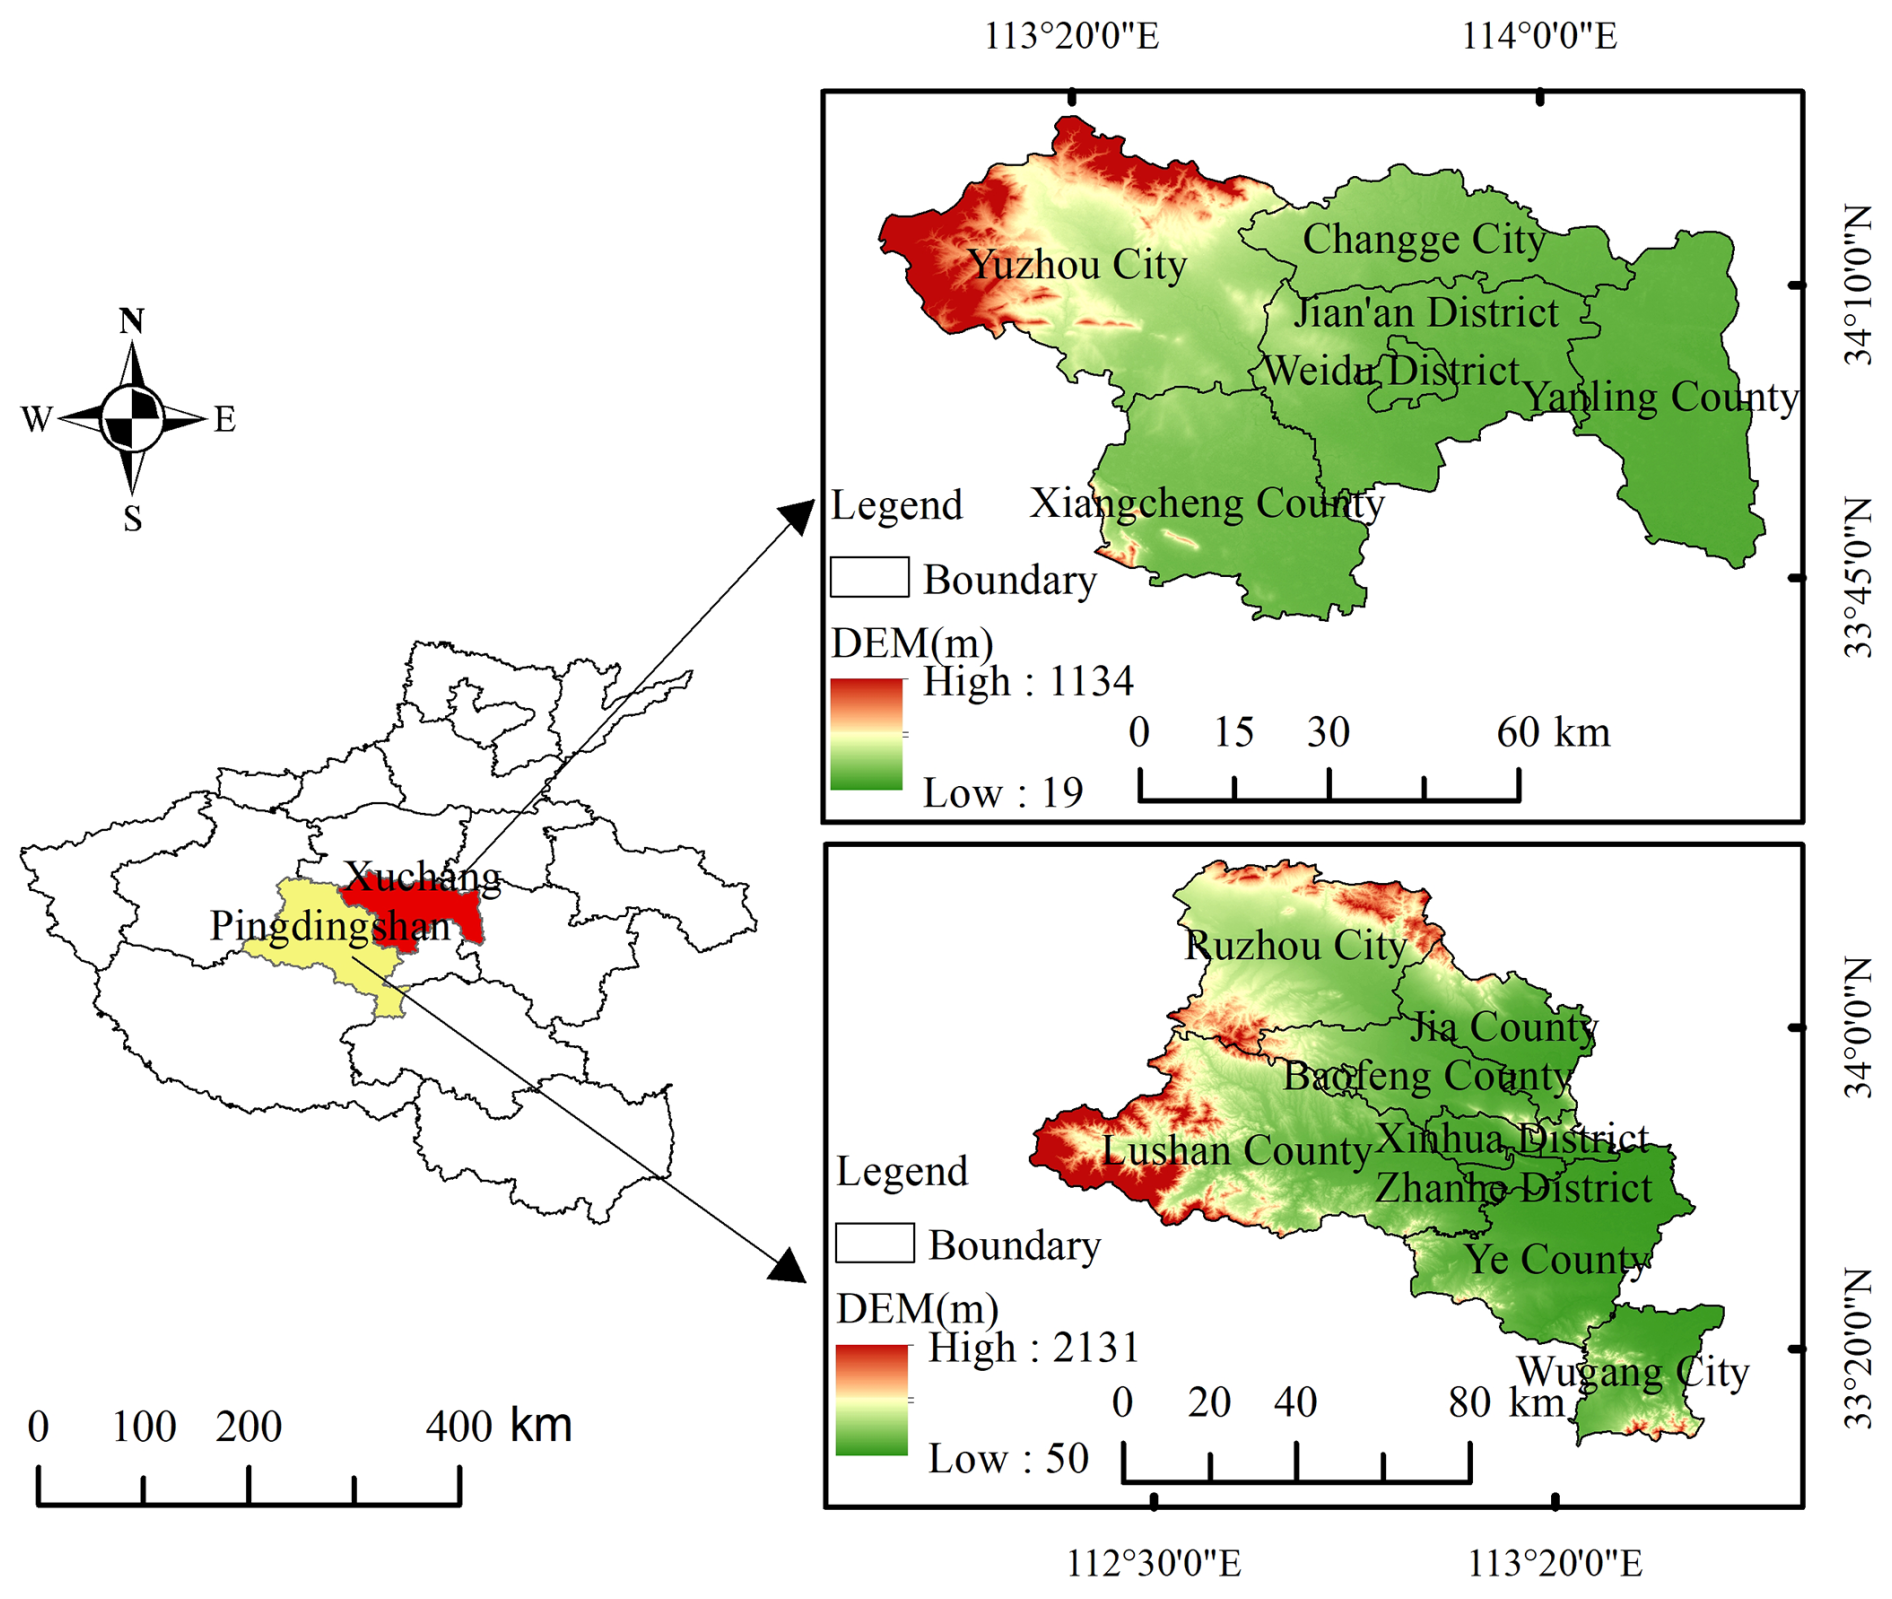
Figure 2Study area.
3.2 Data source
The cornerstone of accurate tobacco mapping lies in effective feature extraction. Consequently, datasets were selected based on three dimensions: spectral properties, canopy structure and environmental planting conditions. Spectral features were derived from Sentinel-2 MultiSpectral Instrument (MSI) imagery; specifically, its inclusion of red-edge bands provides abundant information related to the physicochemical properties of vegetation. Canopy structure was captured using Sentinel-1 InSAR data, as radar backscatter effectively characterises land-surface roughness. Planting conditions were incorporated using a digital elevation model (DEM), considering that excessively high altitudes may lack sufficient accumulated temperature, while low-lying areas are often prone to poor drainage. We extracted comprehensive features from multi-source data to achieve a more robust tobacco-field extraction model.
3.2.1 InSAR image data
Sentinel-1, launched by the European Space Agency (ESA), consists of Sentinel-1A and Sentinel-1B, each carrying a C-band SAR sensor. The constellation provides all-weather, day-and-night Earth observation, guaranteeing surface information even during cloudy or rainy periods when optical systems fail. In this study, VV (vertical transmit/vertical receive) and VH (vertical transmit/horizontal receive) polarisations acquired by Sentinel-1 are selected through GEE to enhance the discrimination of land-cover features.
3.2.2 Optical image data
Sentinel-2 is the multispectral optical component of ESA's Copernicus programme. Sentinel-2A (launched in 2015) and Sentinel-2B (2017) fly in the same orbit at 786 km altitude, 180° apart, yielding a joint revisit of 5 d. Each satellite carries the MSI that records 13 spectral bands – from visible to short-wave infrared – across a 290 km swath. The red-edge and near-infrared bands are highly sensitive to vegetation properties, providing the spectral resolution needed to differentiate tobacco fields from other crops, woodland, artificial surface, bare land and water bodies.
3.2.3 DEM data
The DEM dataset used in this study is the Shuttle Radar Topography Mission (SRTM) digital elevation model released by the US National Aeronautics and Space Administration (NASA). Derived from the Shuttle Radar Topography Mission's interferometric measurements, it provides near-global topographic information.
3.3 Data preprocessing
The primary objective of data processing is feature extraction. For the classification task in this study, three categories of features were utilised: spectral, textural, canopy structure and terrain. Spectral features were derived using vegetation indices (VIs) and the tasselled cap transformation (TCT), while textural features were computed based on the grey-level co-occurrence matrix (GLCM). Canopy structure information is captured by Sentinel-1 data and was used without further extraction, while topographic information was derived from the DEM data.
3.3.1 Spectral feature extraction
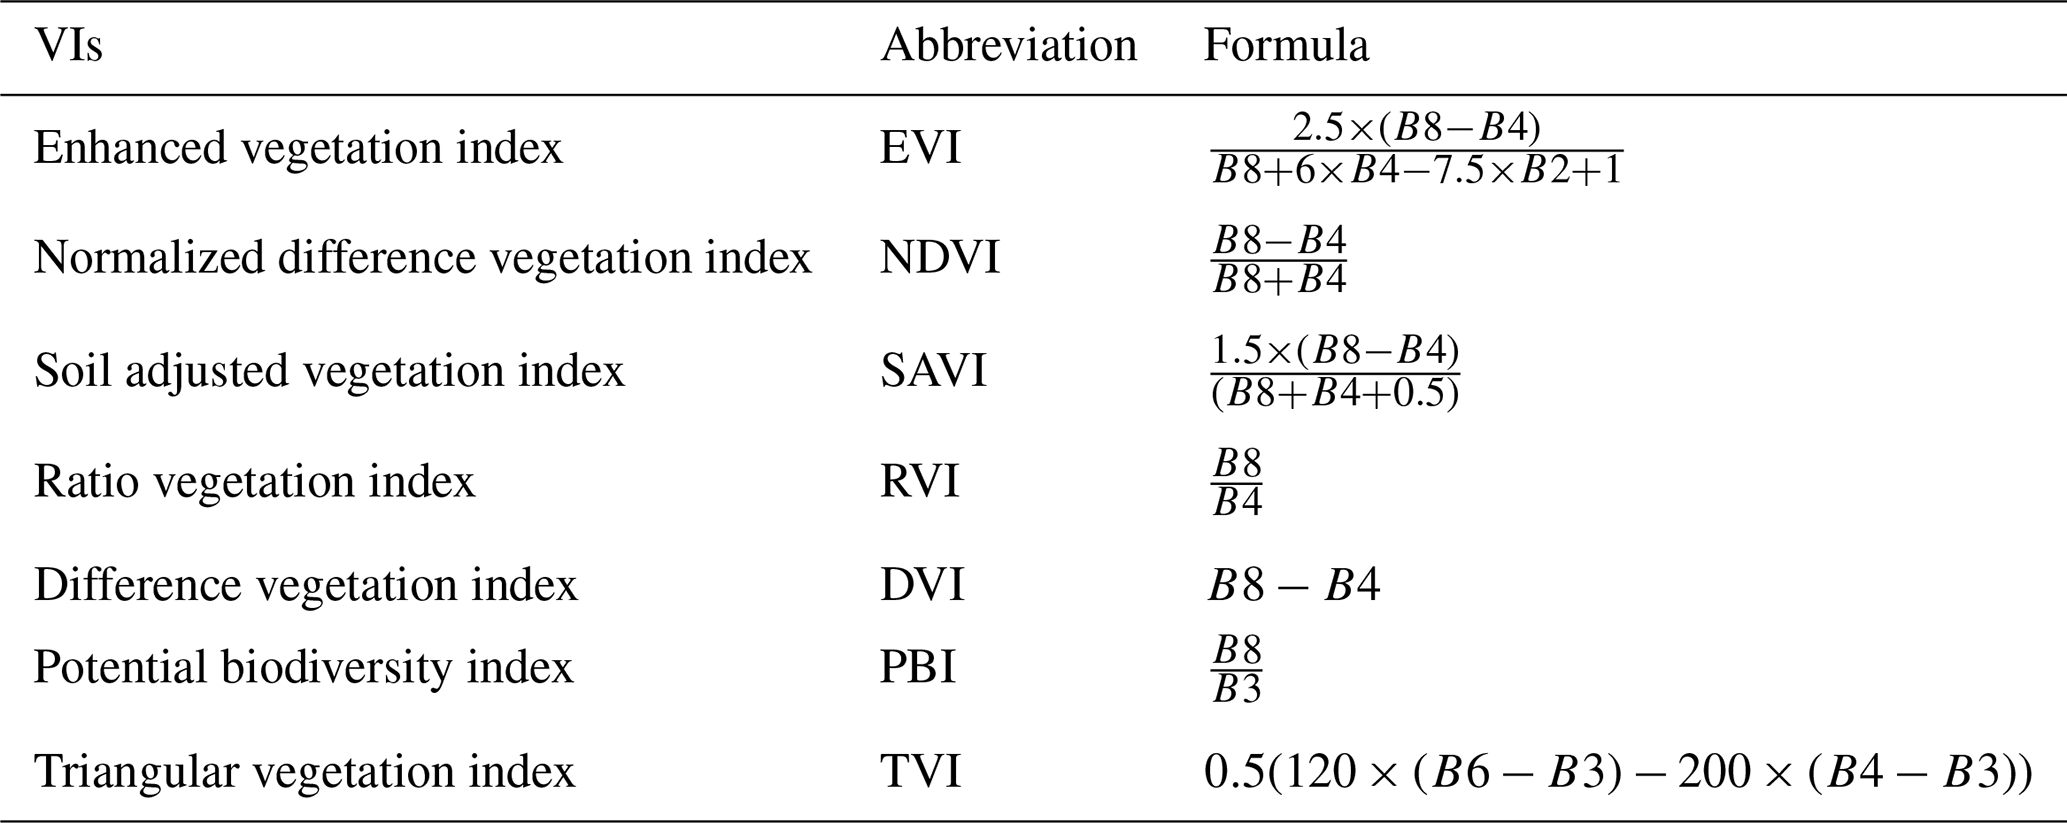
VIs provide a simple yet robust means of quantitatively and qualitatively assessing vegetation cover, vigour and growth dynamics (Xue and Su, 2017). Derived from algebraic combinations of spectral bands, VIs enhance vegetation signals, suppress background noise, and accentuate differences between vegetation and other land-cover types more effectively than individual bands. As a typical cash crop, tobacco exhibits distinct canopy architecture, chlorophyll content and phenological cycles that imprint specific VI signatures. Exploiting these differences should improve the discrimination of tobacco fields from other crops. In this study, seven widely used VIs were computed and incorporated as training features for the classification models; their definitions are summarised in Table 1. Variables in the formulas represent reflectance data of a specific band of Sentinel-2 MSI images.
The TCT is a linear-band compression technique – essentially a tailored principal-component analysis – designed to isolate physical scene properties from multispectral imagery. By forming weighted sums of the original spectral bands, TCT generates new axes that are more directly related to land-surface characteristics. On the GEE platform, Sentinel-2 images were transformed to yield brightness, greenness and wetness components, which were then used as model training features. Brightness distinguishes high-albedo targets such as bare soil and built-up surfaces; greenness is sensitive to the amount and vigour of vegetation, thereby highlighting vegetated pixels; wetness provides a measure of surface and canopy moisture, reflecting the water content of soils and plants.
where Y denotes the transformed tasselled cap image, C is the transformation-coefficient matrix and X represents the original multispectral image. For Sentinel-2 MSI data, we adopted the tasselled cap coefficients published by Nedkov (2017).
3.3.2 GLCM calculation
The grey-level co-occurrence matrix (GLCM) is a statistical approach that quantifies image texture by describing the spatial relationship between pairs of pixel grey values. It captures local structure and subtle spatial variations that are often invisible to spectral analysis, thereby providing insight into the arrangement, intensity and contrast of surface elements (Iqbal et al., 2021). Essentially, GLCM counts how frequently each grey-value pair (i,j) occurs in the image at a user-defined inter-pixel distance and orientation, yielding a two-dimensional histogram that serves as the basis for second-order texture measures. Owing to its ability to discriminate complex land-cover types, the application of GLCM is ubiquitous in remote sensing classification missions. In this study, a greyscale image was first derived from the Sentinel-2 multispectral data on GEE (Eq. 2). The built-in GLCM function was then used to compute seven commonly employed texture features: angular second moment (ASM), contrast, correlation, inverse difference moment (IDM), sum average, dissimilarity and entropy. These metrics were finally appended to the feature stack for subsequent classification.
where grey represents the greyscale image.
3.3.3 Altitude and slope calculation
Within GEE, the built-in “terrain” function was applied to compute altitude and slope layers, which were then employed as ancillary variables to improve the identification and extraction of tobacco-planted areas in the study region.
3.4 Classification samples collection
The classification samples were collected according to both the visual characteristics and NDVI time series of the target land-cover types. In addition, high-resolution imagery in Google Earth and field-survey records were jointly used to guide the selection of training samples. The study area was stratified into six land-cover classes: artificial surface, water, vegetation, bare soil, tobacco and other crops. Considering the phenological characteristics of tobacco, cloud-free Sentinel-2 scenes acquired between mid-July and late August 2023 were averaged to generate a composite optimised for tobacco extraction. On the GEE platform, a total of 2606 reference pixels were collected (Fig. 3), and randomly partitioned into a training set (70 %) and a validation set (30 %).
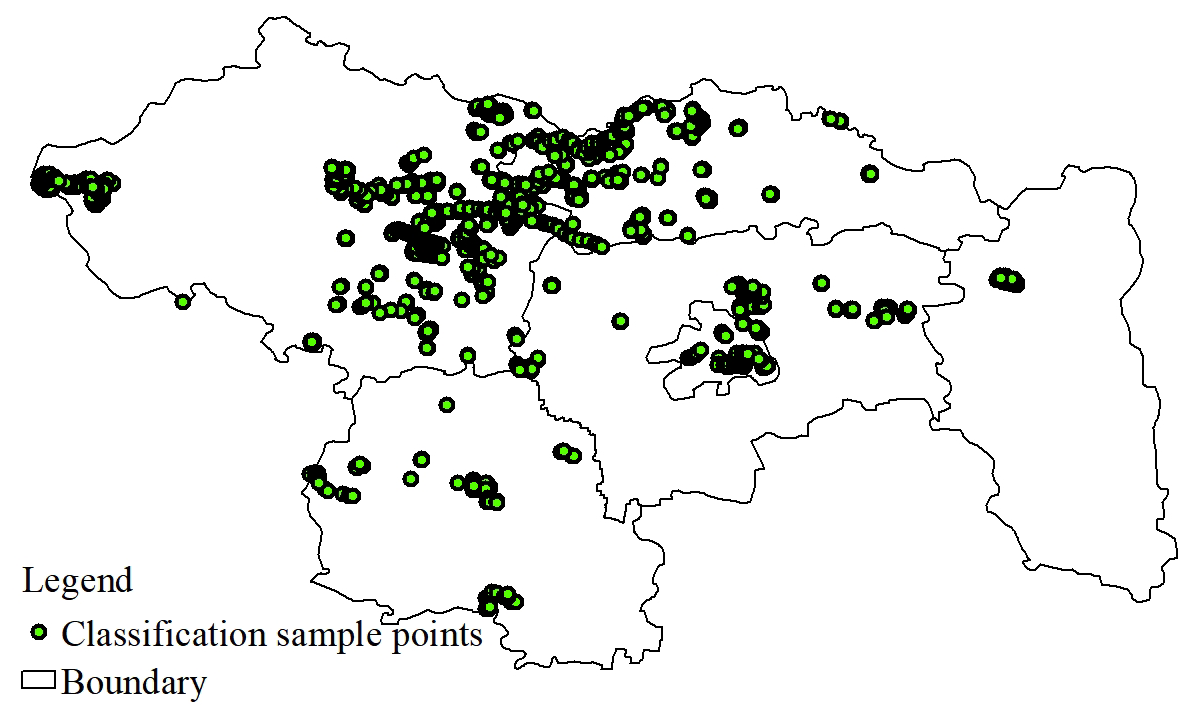
Figure 3Spatial distribution of sampling stations.
3.5 Machine learning algorithms
To establish a rigorous evaluation framework for tobacco-field extraction, this study selected three representative decision-tree-based algorithms: the single CART; RF, based on parallel ensemble strategies; and GBDT, based on iterative boosting strategies. These three algorithms constitute a complete evolutionary lineage from basic classifiers to mainstream ensemble learning paradigms. Specifically, CART serves as the baseline model, establishing the interpretability foundation for the classification task. RF, distinguished by its superior robustness and noise immunity in handling high-dimensional remote sensing data, represents the most stable machine learning paradigm currently employed in the field. Meanwhile, GBDT aims for maximum classification accuracy through residual learning mechanisms. A comparative analysis of these algorithms allows for a deep investigation into the incremental effectiveness of ensemble learning in addressing the challenge of “spectral confusion” (same spectrum, different objects) in complex agricultural landscapes.
RF (Breiman, 2001) is an ensemble learning algorithm that aggregates multiple decision trees. Each tree is built using a resampled training set generated by drawing examples from the original data with replacement. For classification, the final label is determined by majority voting; for regression, the average prediction is taken. This voting/averaging strategy substantially increases overall accuracy (OA) and generalisation capacity. RF handles high-dimensional, multi-band remote sensing data efficiently, is robust to over-fitting and provides an internal estimate of variable importance. Consequently, it has been widely adopted for image classification (Ok et al., 2012; Tatsumi et al., 2015). In this study, the RF classifier was implemented in GEE using ee.Classifier.smileRandomForest. The main parameters tuned were the trees number, the features number considered at each split and the minimum samples per node.
GBDT is another ensemble technique that builds an additive model in a forward step-wise fashion. At each iteration, a new decision tree is fitted to the negative gradient of the loss function (i.e. the residual error of the previous stage), thereby progressively refining the overall fit. GBDT offers high robustness to outliers and scales well to large data sets, and has been applied successfully to crop mapping (Dong et al., 2025), parameter retrieval and general remote sensing classification. Here, GBDT was implemented via the ee.Classifier.gbdt function in GEE. Key parameters optimised were the number of boosting rounds, maximum tree depth, learning rate and the subsampling fraction used at each iteration.
CART is a canonical single-tree algorithm that recursively partitions the feature space into a binary tree. At each node, the algorithm selects the split that maximises the homogeneity of the resulting child nodes; this process is repeated until a stopping rule (e.g. minimum samples per leaf or maximum depth) is met. CART is computationally efficient, highly interpretable and easily adapted to either classification tasks (Gómez-Chova et al., 2003; Sonobe et al., 2017). In this study, the CART model was implemented in GEE using the built-in ee.Classifier.smileCart function.
3.6 Accuracy assessment indices
The performance of the three classifiers was evaluated using confusion matrices generated from the training-sample set. A confusion matrix cross tabulates predicted labels against reference labels and thus provides an effective means of assessing classifier accuracy. Four indices, i.e. OA, producer's accuracy (PA), user's accuracy (UA) and kappa coefficients (kappa), were calculated to evaluate the classification results. The matrix was computed via the following formulas:
where m is the number of classes, N represents the element numbers in the confusion matrix and Pii is the total sample number of the ith column and the ith line. P+i is the total sample number of the ith column and Pi+ is the total sample number of the ith line.
4.1 Performance of different algorithms
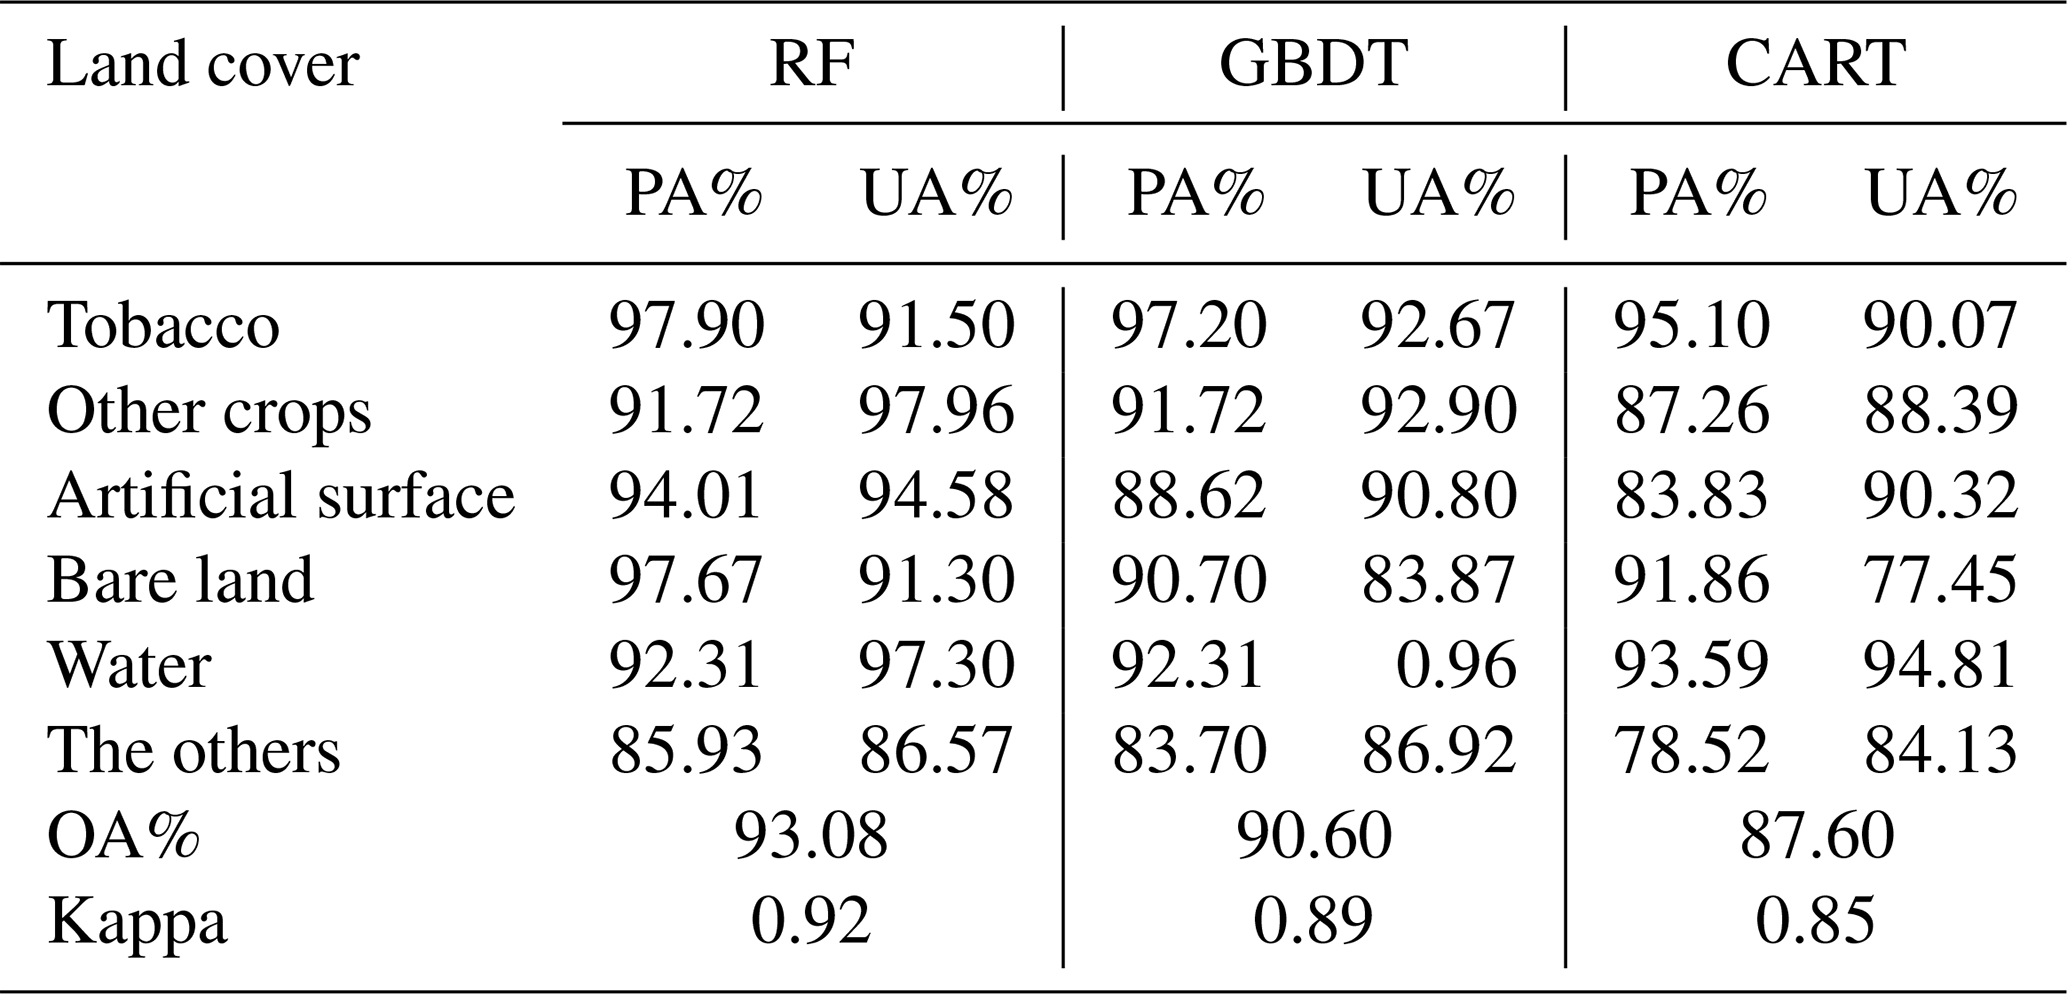
On the GEE platform, multi-source variables were fed into the three machine learning classifiers to map land cover and to isolate tobacco fields. Confusion matrices were produced by comparing the independent validation sample set with each map. OA, PA, UA and the kappa coefficient were then calculated. The results are summarised in Table 2. RF achieved the highest OA (93.08 %) and kappa (0.92), followed by GBDT (OA=90.60 %, kappa=0.89). The CART model yielded the lowest accuracy (OA=87.60 %, kappa=0.85). For the tobacco class, both PA and UA exceeded 90 % in all three models, indicating that omission and commission errors for tobacco are small.
Table 2Classification performance of RF, GBDT and CART algorithms.
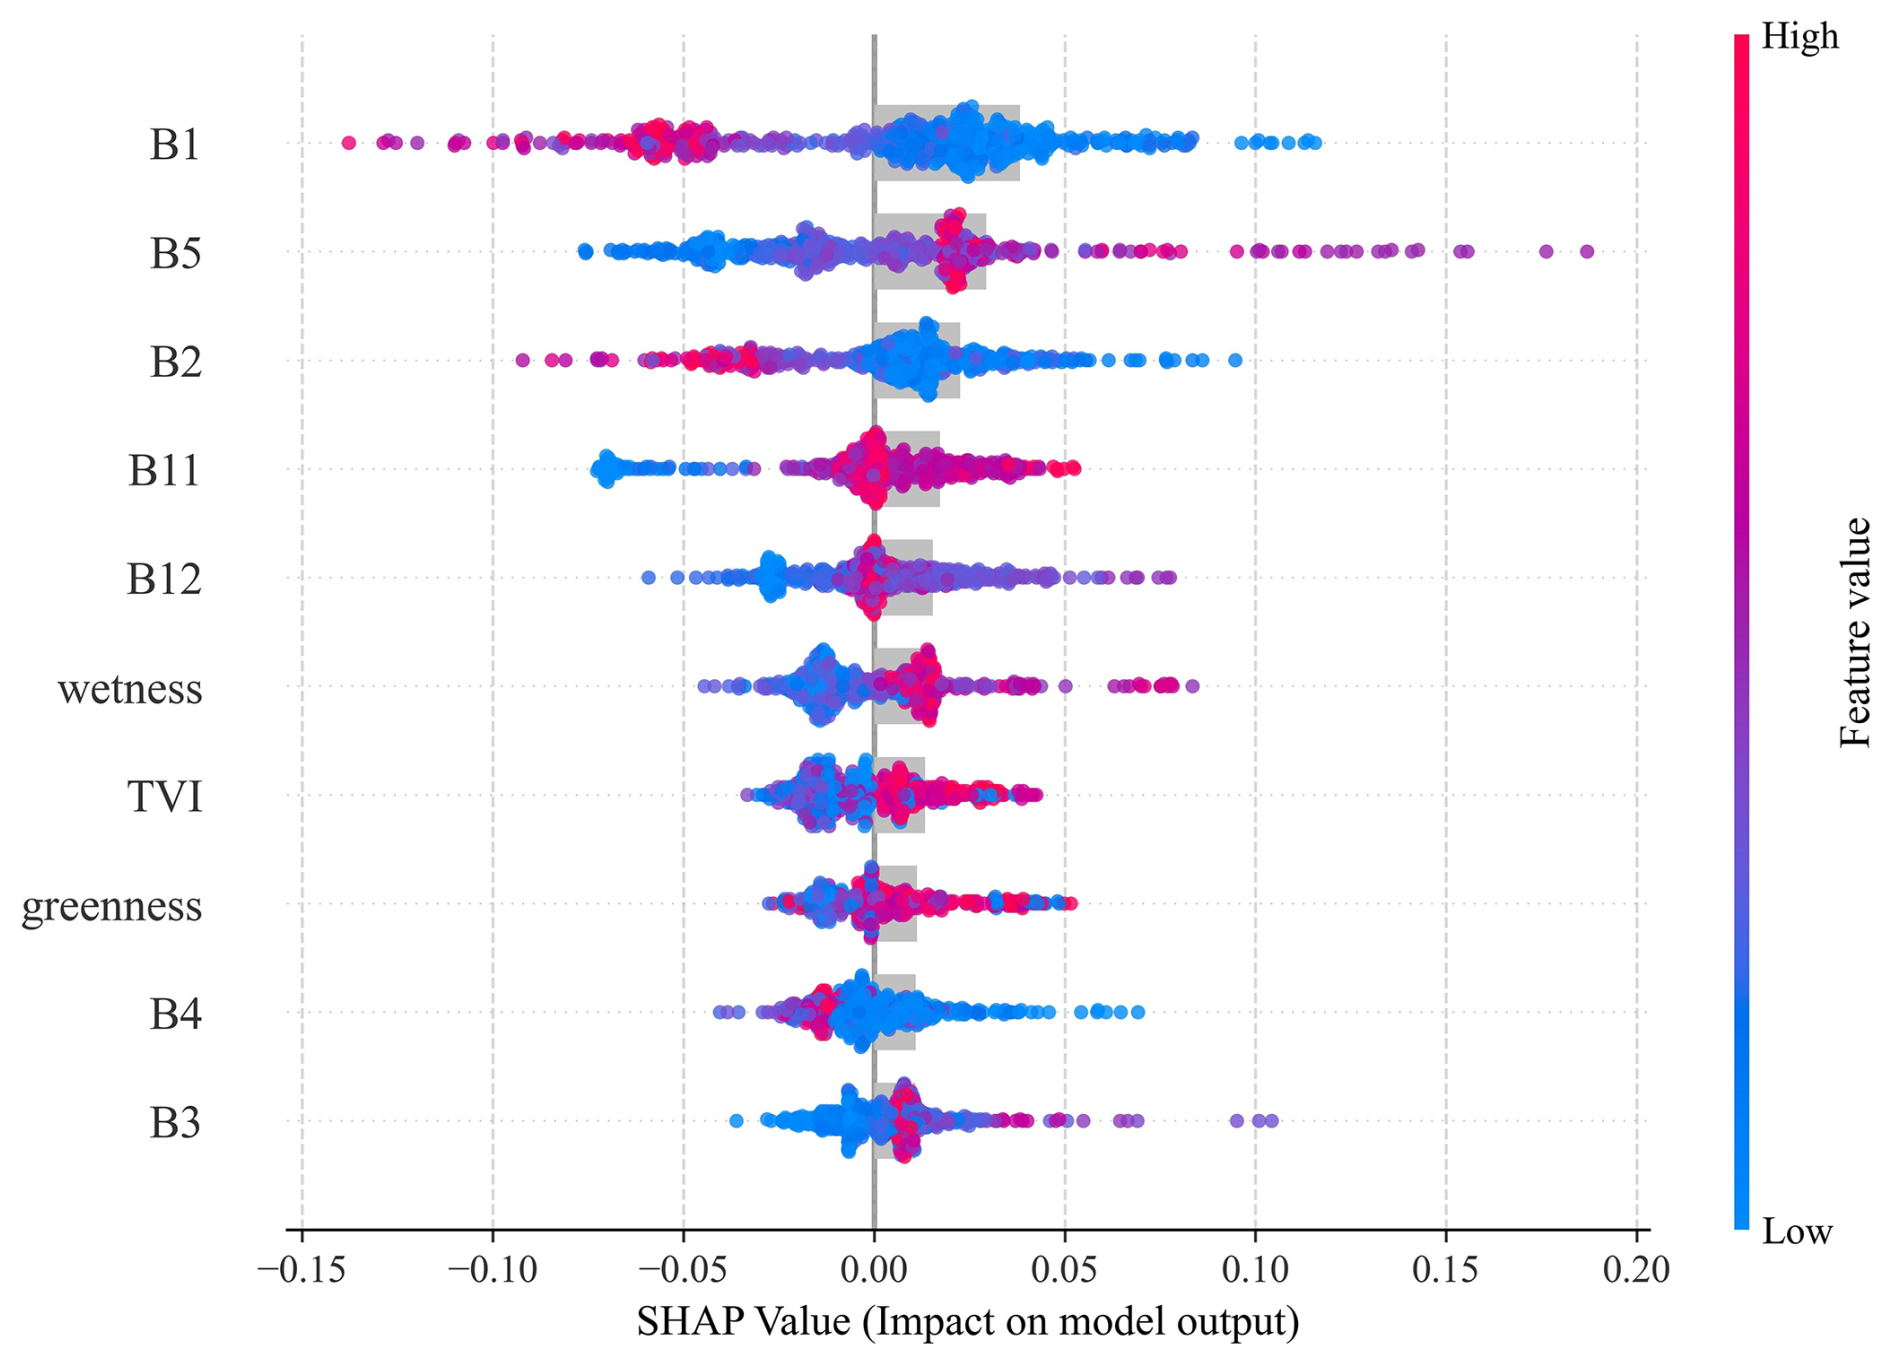
SHAP analysis was performed on the best-performing RF model, with feature values and SHAP scores presented in Fig. 4. The top 10 features, primarily consisting of spectral bands along with one vegetation index and two tasselled cap components, were analysed. B1, B2 (blue) and B4 (red) showed negative contributions; as these are strong chlorophyll a absorption bands, their lower reflectance signifies higher chlorophyll content. Conversely, the red-edge band (B5) showed a marked positive impact, highlighting chlorophyll a as a key discriminator for tobacco. The short-wave infrared (SWIR) bands (B11, B12) contributed negatively, helping to rule out water bodies. The wetness and greenness components had weaker effects but aligned with the chlorophyll and moisture findings, while TVI mirrored the greenness pattern. Ultimately, the SHAP results confirm that spectral sensitivity to chlorophyll a and moisture drives the tobacco classification performance.
4.2 Extraction result of the tobacco fields
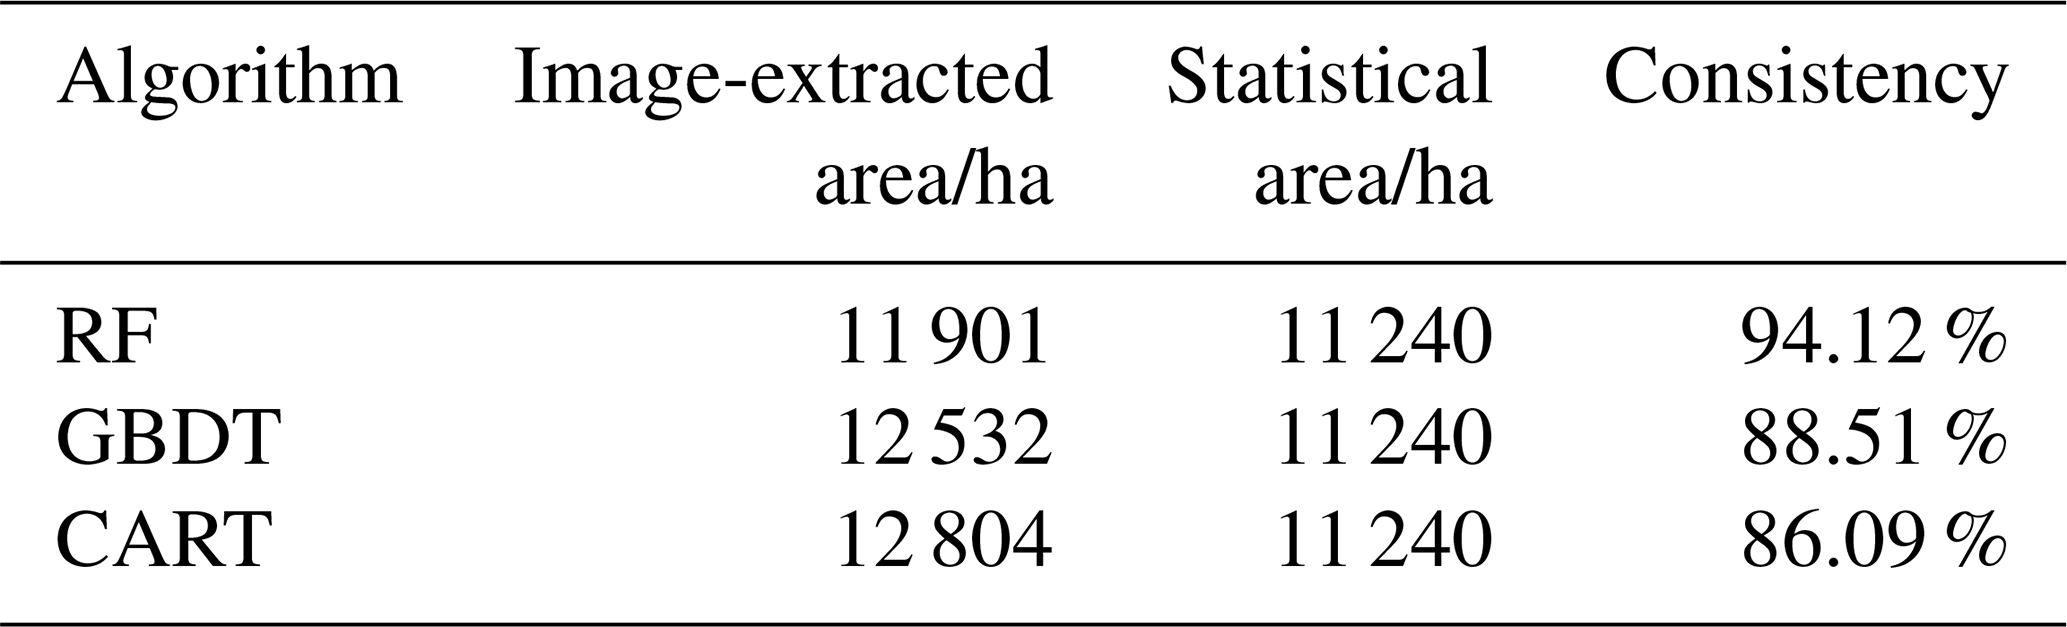
By utilising the RF, GBDT and CART models on the input data, the classification maps are generated (Fig. 5). The tobacco-planted areas mapped by the three classifiers were aggregated and compared with the 2023 official statistics for Xuchang City (Table 3). Similar to the classification performance (Table 2), RF showed the best agreement, with an area-consistency ratio of 94.12 %. Gradient boosting decision tree followed at 88.51 %, whereas CART yielded the lowest consistency (86.09 %).
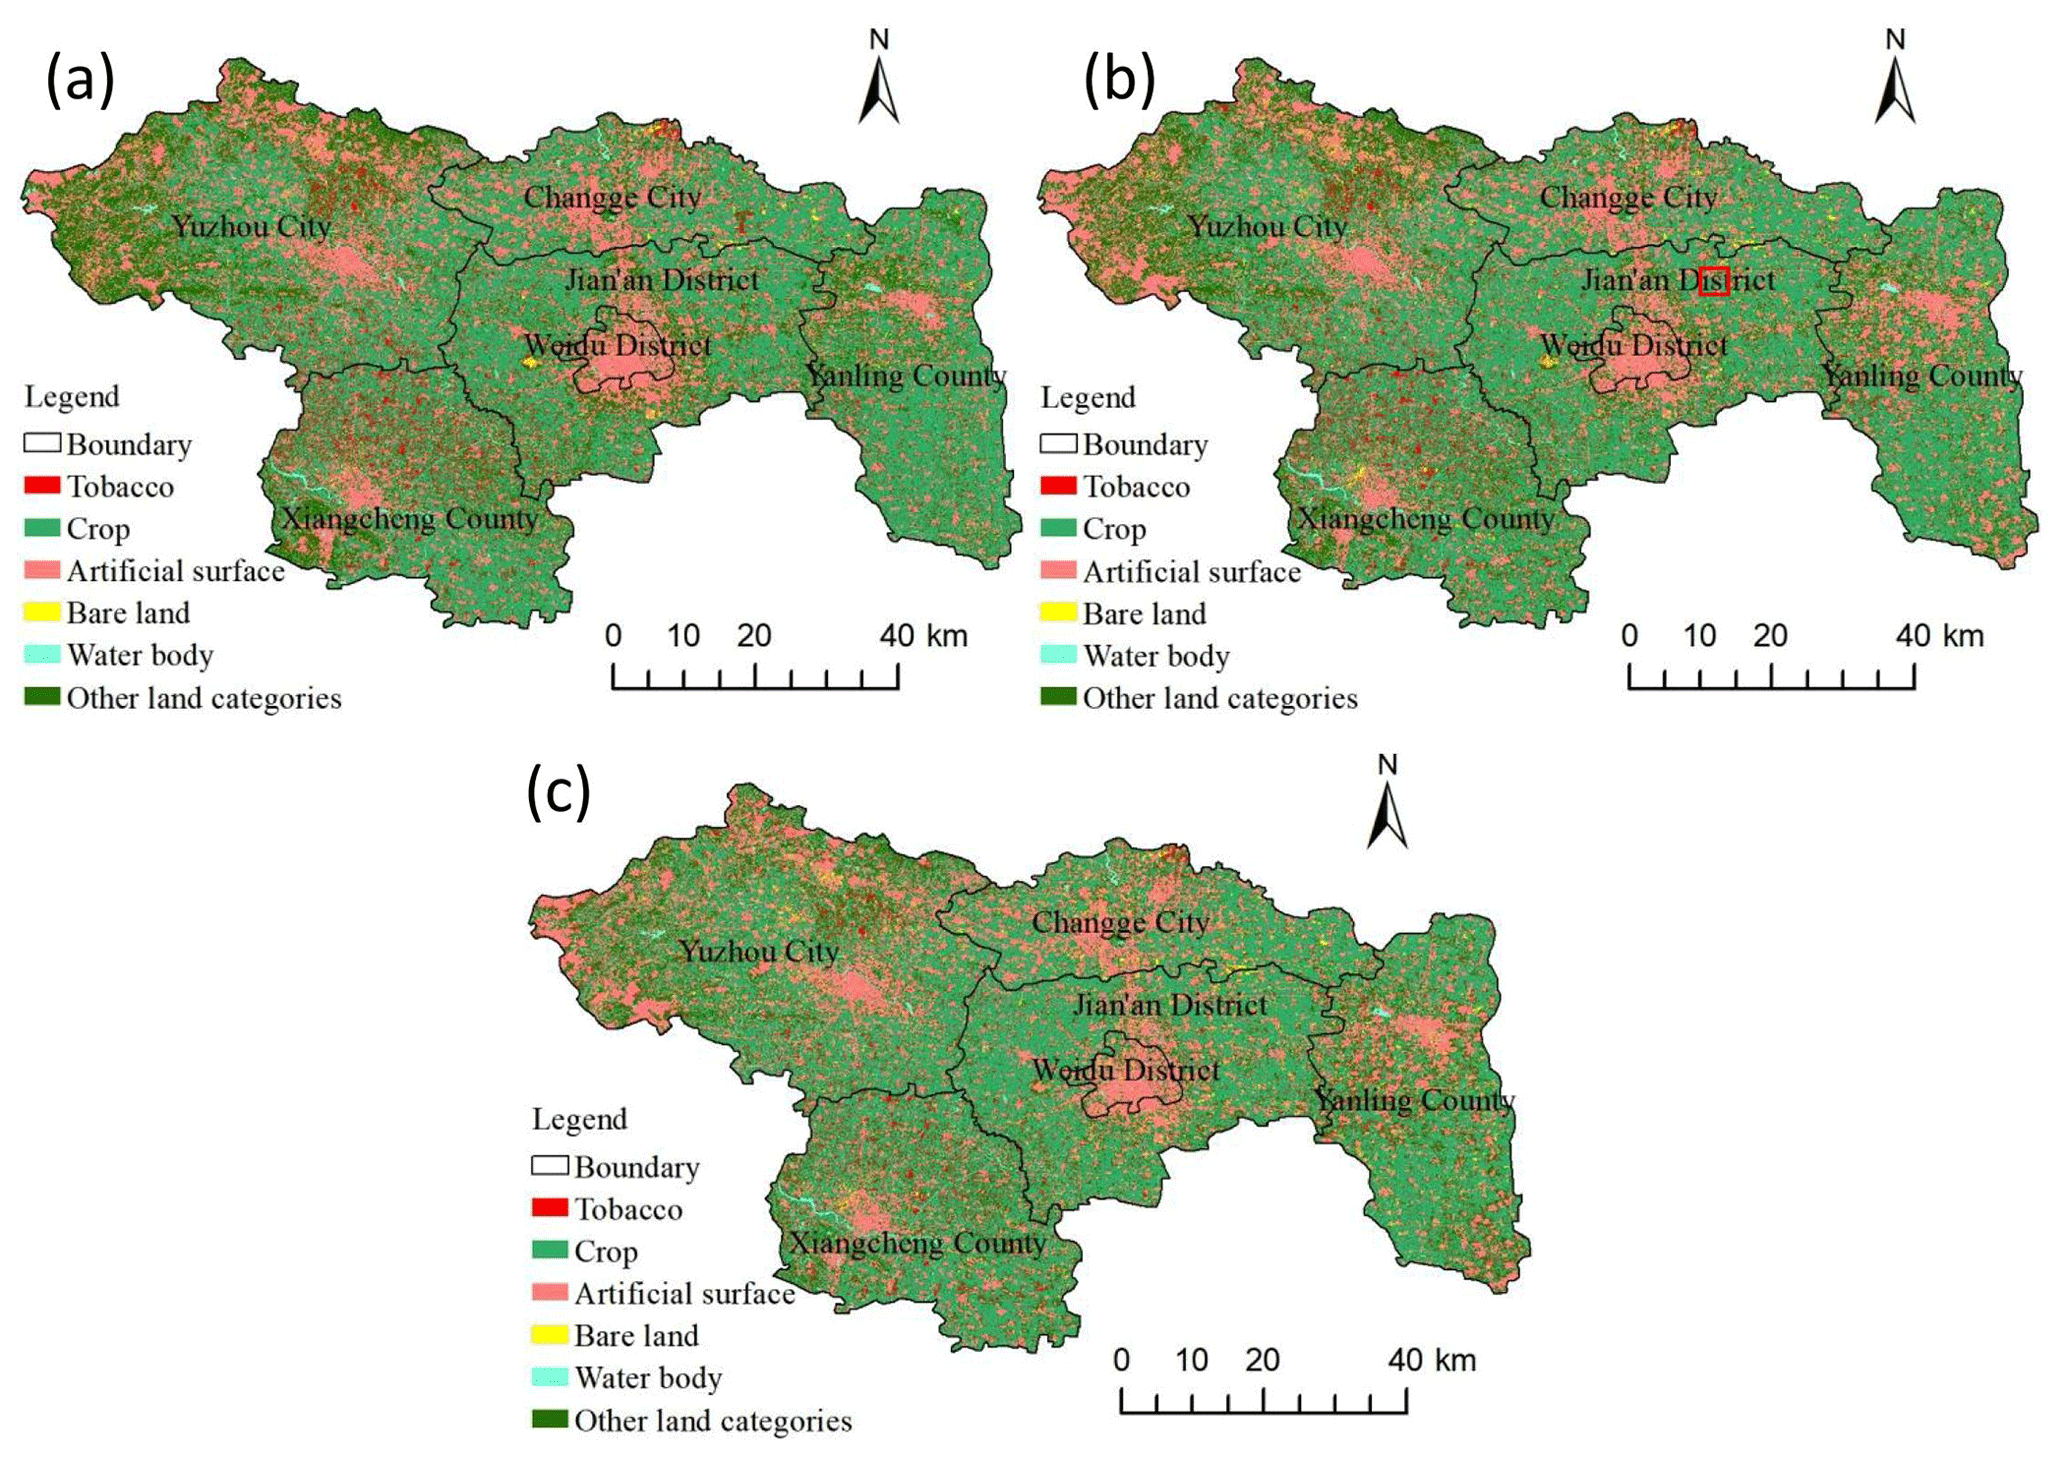
Figure 5Land-surface classification result of the study area.
Table 3Comparison of the image-extracted tobacco plant area and the statistical data.
Considering both the accuracy metrics and the agreement with statistical area data, the RF classifier delivered the best performance for tobacco mapping and was therefore selected to produce the final planting area layer. The 2023 spatial distribution derived from RF (Fig. 6) shows that tobacco fields are concentrated in Xiangcheng County, with substantial extensions also in Yuzhou City; smaller scattered plots occur in the remaining counties and districts of Xuchang.
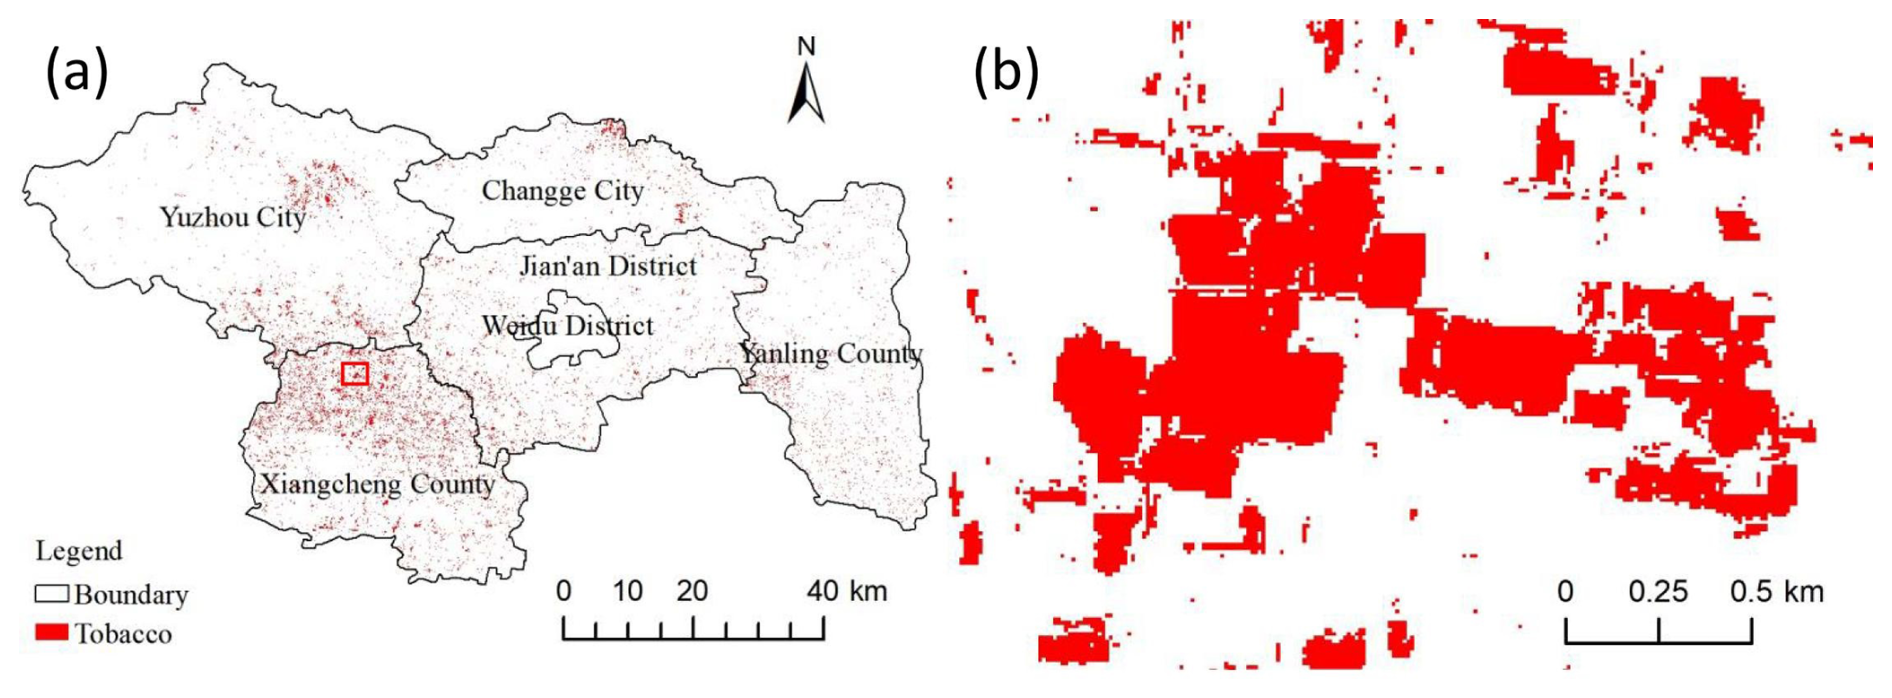
Figure 6Spatial distribution of tobacco plant in the study area.
Located in the south-west of Xuchang, Xiangcheng County is known as the “Hometown of Tobacco”. Its soils are predominantly loamy sand and sandy loam, offering excellent drainage and aeration that favour root development and leaf-quality formation; organic-matter content is moderate and well balanced. The county is intersected by the Ru and Ying rivers, providing abundant water for irrigation. These favourable natural conditions promote the synthesis of aromatic compounds, yielding tobacco leaves with a rich and mellow aroma. The high concentration of tobacco fields mapped by our RF classifier in Xiangcheng therefore agrees well with local agricultural realities, lending additional credibility to the extraction results. As shown in the enlarged view (Fig. 6b) of the area marked by the red box in Fig. 6a, the field boundaries are clear and intact.
To test the stability of the optimal classifier (RF), we transferred the trained model, without any re-training, to Pingdingshan City, an adjacent tobacco-growing region in Henan. All remotely sensed predictor layers (spectral, temporal, textural, topographic) were first generated for Pingdingshan and then fed into the RF classifier inherited from the Xuchang experiment. The resulting 2023 land-cover map and tobacco mask are shown in Fig. 7. The RF extraction yielded 9096 ha of tobacco fields, compared with 9385 ha reported in the 2023 Henan Statistical Yearbook – an area-consistency ratio of 97.70 %. Spatially, the mapped tobacco is concentrated in Jia County, Ye County and Ruzhou City, precisely matching the documented distribution pattern in Pingdingshan. These results confirm that the multi-feature, RF-based workflow provides both accurate and stable tobacco mapping across different administrative units.
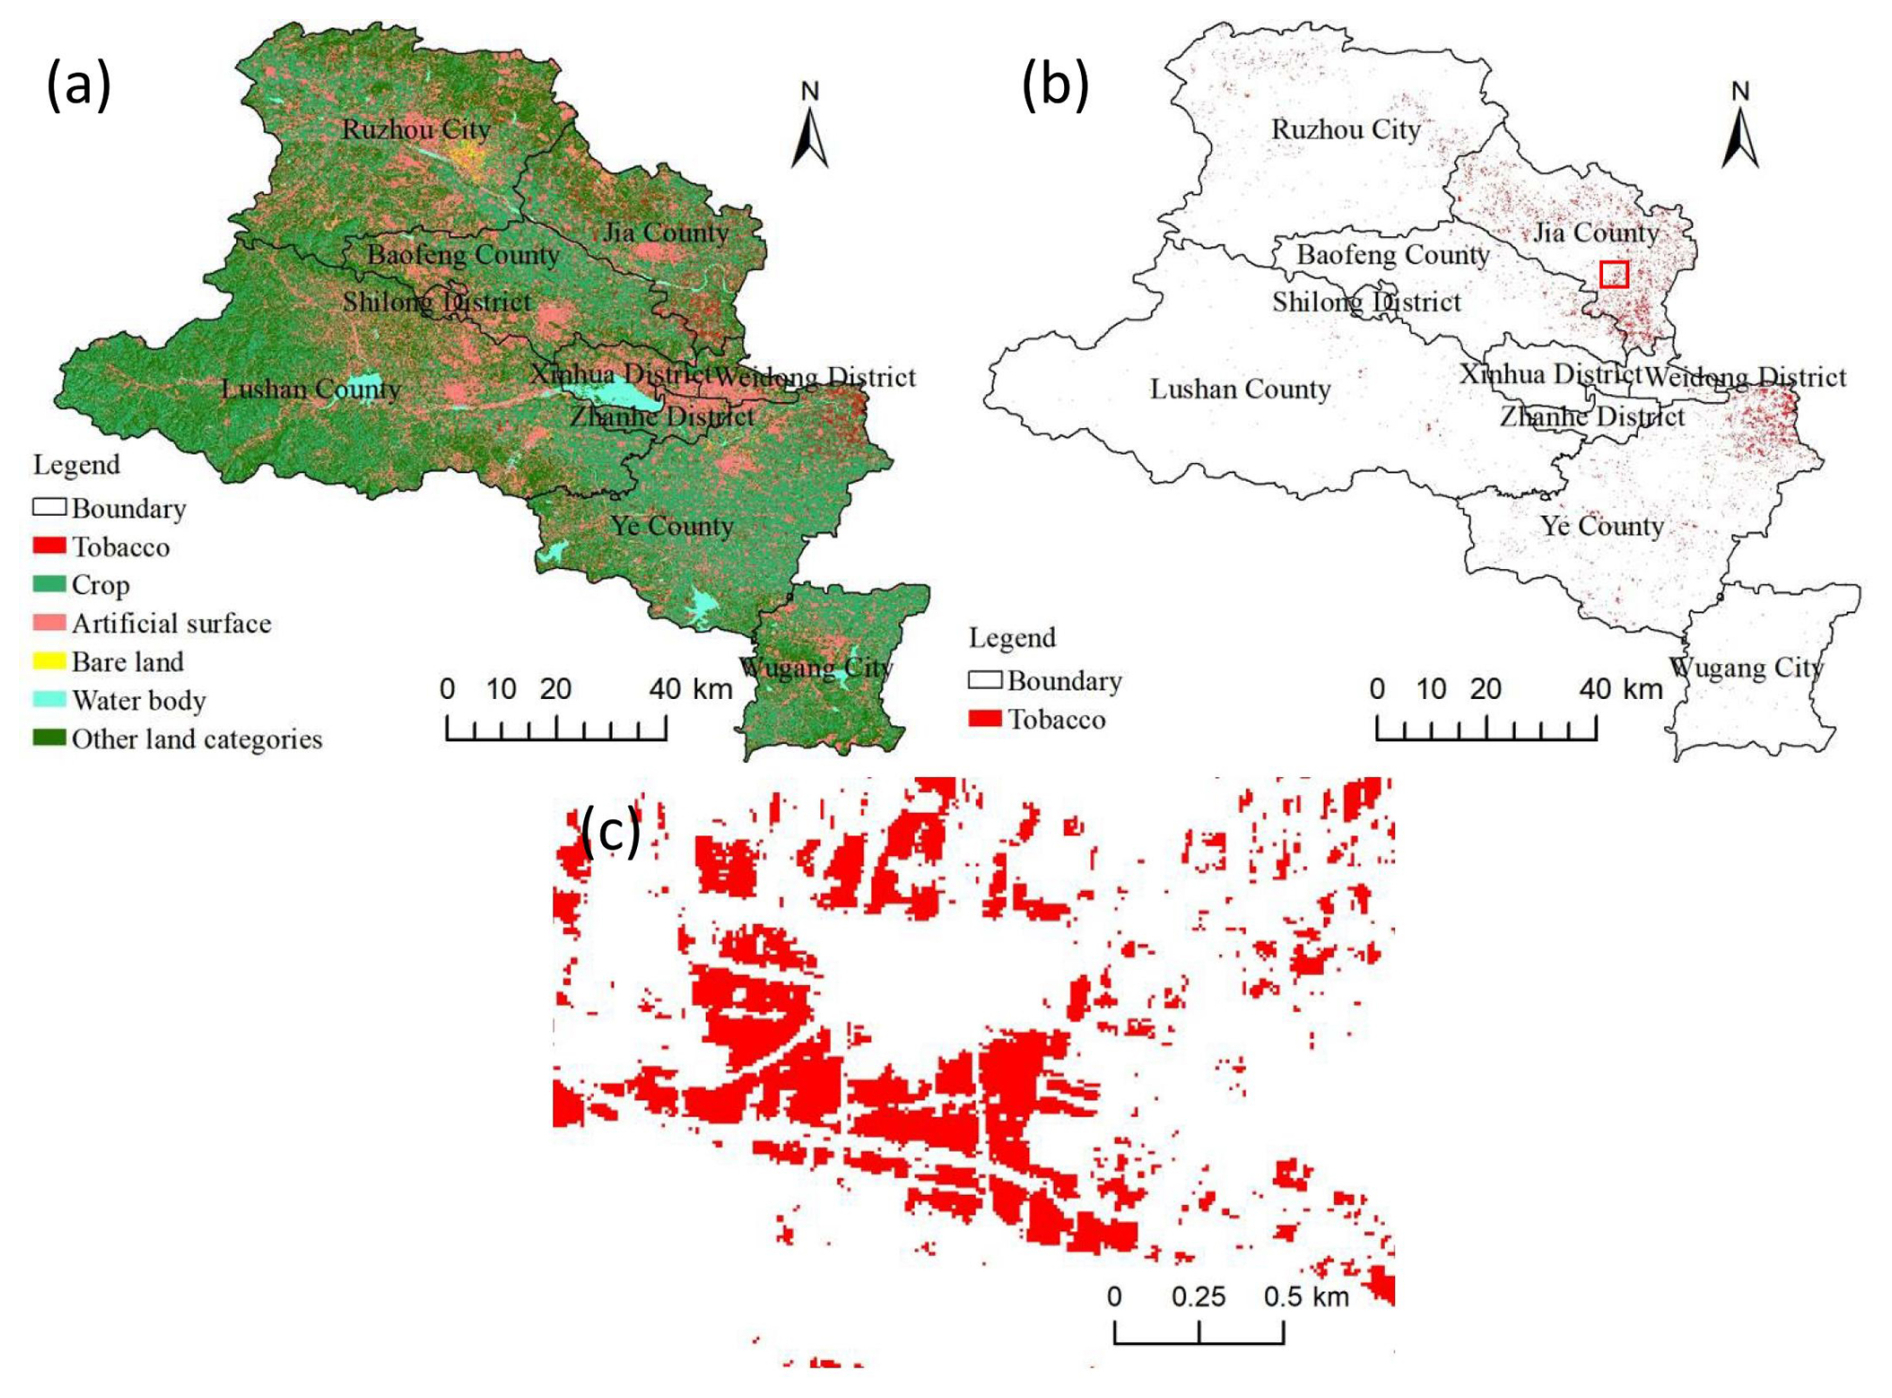
Figure 7Tobacco plant region extraction result of Pingdingshan City.
The central hypothesis of this study is that fragmented tobacco fields in smallholder agricultural landscapes can be accurately and operationally mapped using a cloud-based, multi-source remote sensing framework and that the resulting geospatial products can directly support autonomous field operations when integrated with edge-computing systems. This hypothesis arises from a practical mismatch between the requirements of autonomous agricultural machinery, continuous parcel-level spatial information and the limitations of traditional manually delineated field-boundary workflows commonly used in tobacco production. To test this hypothesis, we designed a framework that integrates multi-source satellite data on the GEE platform, applies machine learning classifiers to extract tobacco fields at the regional scale and evaluates whether the derived products are sufficiently accurate, stable and transferable to serve as base maps for autonomous operations (Fig. 1).
The experimental design combined three key elements. First, a high-dimensional feature space was constructed by integrating spectral information, vegetation indices, radar backscatter, texture metrics and terrain attributes (Table 1), enabling the differentiation of tobacco fields characterised by distinct phenology and canopy structure. Second, three representative machine learning classifiers – random forest, GBDT and CART – were systematically compared to assess the impact of algorithmic complexity and ensemble learning on classification performance (Table 2). Third, the robustness of the optimal classifier was evaluated through cross-regional transferability testing, in which a model trained in Xuchang City was applied directly to Pingdingshan City without re-training (Fig. 7). This design allowed us to move beyond conventional single-area accuracy assessments and to explicitly evaluate whether the proposed workflow satisfies operational requirements for regional-scale deployment, a criterion that is often overlooked in crop mapping studies focused solely on classification accuracy.
This study establishes a bridge between remote sensing cloud-computing and guidance systems for autonomous agricultural machinery. It aims to fully exploit the application potential of massive remote sensing data in the automated management of tobacco fields. The deployment scheme bridges the gap between massive cloud computation and on-site autonomous operation. Specifically, the automated extraction algorithm on GEE generates precision tobacco-field maps, which are then transmitted to the on-board edge-computing device via the GEE Python API. To handle plot fragmentation and potential network latency in remote smallholder areas, the system adopts a “cloud-predict, local-execute” strategy. The extracted maps are converted into GeoJSON formats and cached locally for real-time path planning through CAN-bus integration, while RTK-GNSS ensures the machinery aligns with the extracted field boundaries within a 5 cm tolerance.
The results clearly support the proposed hypothesis. Among the three classifiers tested, random forest consistently outperformed GBDDT and CART, achieving the highest OA (93.08 %) and kappa coefficient (0.92) in Xuchang City (Table 2). RF also produced the closest agreement with official planting statistics, with a consistency ratio of 94.12 % for tobacco acreage estimation (Table 3). These findings are consistent with previous studies demonstrating the robustness of ensemble classifiers for agricultural remote sensing, particularly when handling high-dimensional and multi-source inputs (Breiman, 2001; Clemente et al., 2020; Eisfelder et al., 2024). Spatially, the RF-derived tobacco distribution map captured both large contiguous planting areas and small fragmented parcels (Fig. 5). The concentration of tobacco fields in Xiangcheng County closely matched known agronomic conditions and production patterns, lending additional confidence to the classification results. Importantly, the RF model maintained high performance when transferred to Pingdingshan City, achieving a 97.70 % consistency with statistical records (Fig. 6). This strong transferability indicates that the learned feature–class relationships are not site specific but reflect generalisable characteristics of tobacco cultivation in the region.
A key novelty of this study lies not only in mapping accuracy but also in the explicit coupling of cloud-based crop mapping with edge-based autonomous machinery workflows. In conventional systems, field boundaries must be manually delineated on on-board devices prior to operation, an approach that is impractical in fragmented smallholder regions (Fig. 8b). By contrast, the proposed framework automatically generates parcel-level tobacco maps on the GEE cloud platform and delivers them to edge-computing units, where they can be used for geo-fencing, path planning and continuous autonomous operations across scattered fields (Fig. 8a). This shift from manual local annotation to automated cloud-driven mapping represents a substantive advance over existing practices. It enables autonomous systems to operate efficiently at the regional scale, reduces labour requirements and provides a scalable foundation for integrating additional data streams, such as uncrewed aircraft vehicle (UAV) imagery or in-field sensor observations. Benefiting from advanced real-time object detection algorithms (Du et al., 2025; Shi et al., 2023), UAVs can accurately avoid obstacles in the field and execute rapid detection missions. For the individual farmer, more precise managing could yield better yields and quality. For managers, more detailed decisions could be made based on the first-hand field information.
With the rapid development of AI technology, the acquisition of multi-modal field data, such as video and audio signals, can provide autonomous agricultural machinery with richer datasets, thereby enabling more precise path planning. Furthermore, in practical applications, since the algorithm operates at the pixel level, the occurrence of fragmented patch errors (often referred to as “salt-and-pepper” noise) is inevitable. To mitigate these deviations, post-processing steps can be implemented. For instance, a minimum area threshold can be set as a filtering criterion, allowing the machinery to ignore smaller noise patches during field operations.
Focusing on Xuchang City – a principal tobacco-growing region in Henan Province – this study leveraged the GEE platform to integrate multi-source remote sensing data (Sentinel-1/2) with machine learning classifiers. A high-dimensional feature set, comprising spectral bands, radar backscatter, vegetation indices, texture metrics and topographic variables, was derived to drive three algorithms: RF, GBDT and CART. These models were employed to map the 2023 tobacco-planting area. Validation results indicated that RF outperformed the other models, achieving an OA of 93.08 % and a kappa coefficient of 0.92, compared to GBDT (90.60 %, 0.89) and CART (87.60 %, 0.85). Regarding acreage estimation, the RF model yielded the highest consistency (94.12 %) with official statistics. Furthermore, the transferability of the workflow was verified by applying the trained RF model to the adjacent Pingdingshan City; the estimated area of 9096 ha deviated by only ∼2.3 % from statistical records (97.70 % consistency). The proposed method provides essential geospatial information for autonomous agricultural machinery and supports precision tobacco management.
The GEE code is available at https://code.earthengine.google.com/e6bafb8405d9b2239742fe18d5bf4d71 (last access: 15 April 2026).
All satellite data are freely available at https://www.esa.int/Applications/Observing_the_Earth/Copernicus/Sentinel-2 (last access: 15 April 2026).
DZ: writing (original draft). ZW: writing (editing). YJ: conceptualisation. SH: validation.
The contact author has declared that none of the authors has any competing interests.
Publisher's note: Copernicus Publications remains neutral with regard to jurisdictional claims made in the text, published maps, institutional affiliations, or any other geographical representation in this paper. The authors bear the ultimate responsibility for providing appropriate place names. Views expressed in the text are those of the authors and do not necessarily reflect the views of the publisher.
We gratefully acknowledge the European Space Agency for providing freely accessible Sentinel-2 imagery. We also thank the Google Earth Engine platform for offering efficient batch processing capabilities. Finally, we sincerely appreciate the efforts of the field sampling team for their hard work and dedication.
This paper was edited by Qingyu Yao and reviewed by four anonymous referees.
Amani, M., Kakooei, M., Moghimi, A., Ghorbanian, A., Ranjgar, B., Mahdavi, S., Davidson, A., Fisette, T., Rollin, P., Brisco, B., and Mohammadzadeh, A.: Application of Google Earth Engine Cloud Computing Platform, Sentinel Imagery, and Neural Networks for Crop Mapping in Canada, Remote Sens.-Basel, 12, 3561, https://doi.org/10.3390/rs12213561, 2020.
Awad, M.: Google Earth Engine (GEE) cloud computing based crop classification using radar, optical images and Support Vector Machine Algorithm (SVM), 2021 IEEE 3rd International Multidisciplinary Conference on Engineering Technology, https://doi.org/10.1109/IMCET53404.2021.9665519, 2021.
Bastiaansen, W. G. M., Molden, D. J., and Makin, I. W.: Remote sensing for irrigated agriculture: examples from research and possible applications, Agr. Water Manage., 46, 137–155, 2000.
Bégué, A., Arvor, D., Bellon, B., Betbeder, J., De Abelleyra, D., Ferraz, R. P. D., Lebourgeois, V., Lelong, C., Simões, M., and Verón, S. R.: Remote Sensing and Cropping Practices: A Review, Remote Sens.-Basel, 10, 99, https://doi.org/10.3390/rs10010099, 2018.
Bégué, A., Leroux, L., Soumaré, M., Faure, J.-F., Diouf, A. A., Augusseau, X., Touré, L., and Tonneau, J.-P.: Remote Sensing Products and Services in Support of Agricultural Public Policies in Africa: Overview and Challenges, Front. Sustain. Food Syst., 4, 58, https://doi.org/10.3389/fsufs.2020.00058, 2020.
Breiman, L.: Random Forest, Mach. Learn., 45, 5–32, 2001.
Clemente, J. P., Fontanelli, G., Ovando, G. G., Roa, Y. L. B., Lapini, A., and Santi, E.: Google Earth Engine: Application of Algorithms for Remote Sensing of Crops in Tuscany (Italy), 2020 IEEE Latin American GRSS & ISPRS Remote Sensing Conference, https://doi.org/10.1109/LAGIRS48042.2020.9165561, 2020.
Dong, S., Ma, Q., Yu, C., Li, L., Liu, H., Cui, G., Qiu, H., Yang, S., and Wang, G.: Comparative analysis of crop coefficient approaches and machine learning models for predicting water requirements in three major crops in coastal Saline-Alkali land, Agronomy, 15, 492, https://doi.org/10.3390/agronomy15020492, 2025.
Du, J., Wang, K., Fan, Y., Lai, G., and Yu, Y.: High-Fidelity Integrated Aerial Platform Simulation for Control, Perception, and Learning, IEEE T. Autom. Sci. Eng., 22, 13662–13683, https://doi.org/10.1109/TASE.2025.3555014, 2025.
Eisfelder, C., Boemke, B., Gessner, U., Sogno, P., Alemu, G., Hailu, R., Mesmer, C., and Huth, J.: Cropland and Crop Type Classification with Sentinel-1 and Sentinel-2 Time Series Using Google Earth Engine for Agricultural Monitoring in Ethiopia, Remote Sens.-Basel, 16, 866, https://doi.org/10.3390/rs16050866, 2024.
Ferencz, Cs., Bognár, P., Lichtenberger, J., Hamar, D., Tarcsai, Gy., Timár, G., Molnár, G., Pásztor, Sz., Steinbach, P., Székely, B., Ferencz, O. E., and Ferencz-Árkos, I.: Crop yield estimation by satellite remote sensing, Int. J. Remote Sens., 25, 4113–4149, 2004.
Gao, R. and Huang, F.: Review of Tobacco Planting Area Estimation Based on Machine Learning and Multi-source Remote Sensing Data, International Conference on Artificial Intelligence, Robotics, and Communication, https://doi.org/10.1007/978-981-99-4554-2_23, 2022.
Gómez-Chova, L., Calpe, J., Soria, E., Camps-Valls, G., Martin, J., and Moreno, J.: CART-based feature selection of hyperspectral images for crop cover classification, in: Proceedings 2003 International Conference on Image Processing (Cat. No. 03CH37429), III–589, https://doi.org/10.1109/ICIP.2003.1247313, 2003.
Gravalos, I., Ziakas, N., Loutridis, S., and Gialamas, T.: A mechatronic system for automated topping and suckering of tobacco plants, Comput. Electron. Agr., 166, 104986, https://doi.org/10.1016/j.compag.2019.104986, 2019.
Henan Statistical Yearbook: ISBN 50132001, https://tjj.henan.gov.cn/tjfw/tjcbw/tjnj/ (last access: 15 April 2026), 2024.
Iqbal, N., Mumtaz, R., Shafi, U., and Zaidi, S. M. H.: Gray level co-occurrence matrix (GLCM) texture based crop classification using low altitude remote sensing platforms, PeerJ Computer Science, 7, e536, https://doi.org/10.7717/peerj-cs.536, 2021.
Kganyago, M., Adjorlolo, C., Mhangara, P., and Tsoeleng, L.: Optical remote sensing of crop biophysical and biochemical parameters: An overview of advances in sensor technologies and machine learning algorithms for precision agriculture, Comput. Electron. Agr., 218, 108730, https://doi.org/10.1016/j.compag.2024.108730, 2024.
Lin, Y., Yan, G., Wang, T., Bai, T., Tang, S., Chen, J., and Zhang, B.: Development and Testing of an Intelligent Tobacco Leaf Harvesting Robot Based on Machine Vision, INMATEH, 600–609, https://doi.org/10.35633/inmateh-75-51, 2025.
Liu, J., Pattey, E., and Jégo, G.: Assessment of vegetation indices for regional crop green LAI estimation from Landsat images over multiple growing seasons, Remote Sens. Environ., 123, 347–358, 2012.
Luo, C., Liu, H., Lu, L., Liu, Z., Kong, F., and Zhang, X.: Monthly composites from Sentinel-1 and Sentinel-2 images for regional major crop mapping with Google Earth Engine, J. Integr. Agr., 20, 1944–1957, https://doi.org/10.1016/S2095-3119(20)63329-9, 2021.
Nedkov, R.: Orthogonal transformation of segmented images from the satellite Sentinel-2, CR Acad. Bulg. Sci., 70, 687–692, 2017.
Ok, A. O., Akar, O., and Gungor, O.: Evaluation of random forest method for agricultural crop classification, Eur. J. Remote Sens., 45, 421–432, 2012.
Pendrill, F., Gardner, T. A., Meyfroidt, P., Persson, U. M., Adams, J., Azevedo, T., Bastos Lima, M. G., Baumann, M., Curtis, P. G., De Sy, V., Garrett, R., Godar, J., Dow Goldman, E., Hansen, M. C., Heilmayr, R., Herold, M., Kuemmerle, T., Lathuillière, M. J., Ribeiro, V., Tyukavina, A., Weisse, M. J., and West, C.: Disentangling the numbers behind agriculture-driven tropical deforestation, Science, 377, eabm9267, https://doi.org/10.1126/science.abm9267, 2011.
Pinter Jr., P. J., Hatfield, J. L., Schepers, J. S., Barnes, E. M., Moran, M. S., Daughtry, C. S. T., and Upchurch, D. R.: Remote Sensing for Crop Management, Photogramm. Eng. Rem. S., 69, 647–664, https://doi.org/10.14358/pers.69.6.647, 2003.
Raab, C. and Spies, M.: Characterising cropland fragmentation in post-Soviet Central Asia, using Landsat remote-sensing time series data, Appl. Geogr., 156, 102968, https://doi.org/10.1016/j.apgeog.2023.102968, 2023.
Samberg, L. H., Gerber, J. S., Ramankutty, N., Herrero, M., and West, P. C.: Subnational distribution of average farm size and smallholder contributions to global food production, Environ. Res. Lett., 11, 124010, https://doi.org/10.1088/1748-9326/11/12/124010, 2016.
Shi, C., Lai, G., Yu, Y., Bellone, M., and Lippiello, V.: Real-Time Multi-Modal Active Vision for Object Detection on UAVs Equipped With Limited Field of View LiDAR and Camera, IEEE Robotics and Automation Letters, 8, 6571–6578, https://doi.org/10.1109/LRA.2023.3309575, 2023.
Sonobe, R., Tani, H., and Wang, X.: An experimental comparison between KELM and CART for crop classification using Landsat-8 OLI data, Geocarto Int., 32, 128–138, 2017.
Tatsumi, K., Yamashiki, Y., Torres, M. A. C., and Taipe, C. L. R.: Crop classification of upland fields using Random forest of time-series Landsat 7 ETM+ data, Comput. Electron. Agr., 115, 171–179, 2015.
Tufail, M., Iqbal, J., Tiwana, M. I., Alam, M. S., Khan, Z. A., and Khan, M. T.: Identification of Tobacco Crop Based on Machine Learning for a Precision Agricultural Sprayer, IEEE Access, 9, 23814–23825, https://doi.org/10.1109/ACCESS.2021.3056577, 2021.
Virnodkar, S. S., Pachghare, V. K., Patil, V. C., and Jha, S. K.: Remote sensing and machine learning for crop water stress determination in various crops: a critical review, Precis. Agric., 21, 1121–1155, https://doi.org/10.1007/s11119-020-09711-9, 2020.
Wang, Y., Zhou, Z., Huang, D., Zhang, T., and Zhang, W.: Identifying and Counting Tobacco Plants in Fragmented Terrains Based on Unmanned Aerial Vehicle Images in Beipanjiang, China, Sustainability-Basel, 14, 8151, https://doi.org/10.3390/su14138151, 2022.
Xue, H., Xu, X., Zhu, Q., Yang, G., Long, H., Li, H., Yang, X., Zhang, J., Yang, Y., Xu, S., Yang, M., and Li, Y.: Object-Oriented Crop Classification Using Time Series Sentinel Images from Google Earth Engine, Remote Sens.-Basel, 15, 1353, https://doi.org/10.3390/rs15051353, 2023.
Xue, J. and Su, B.: Significant Remote Sensing Vegetation Indices: A Review of Developments and Applications, J. Sensors, 2017, 1–17, https://doi.org/10.1155/2017/1353691, 2017.
Yang, G., Yu, W., Yao, X., Zheng, H., Cao, Q., Zhu, Y., Cao, W., and Cheng, T.: AGTOC: A novel approach to winter wheat mapping by automatic generation of training samples and one-class classification on Google Earth Engine, Int. J. Appl. Earth Obs., 102, 102446, https://doi.org/10.1016/j.jag.2021.102446, 2021.
Farm robots currently struggle in scattered fields due to a lack of precise map data. To solve this, we created a system using satellite imagery and AI to automatically generate accurate field boundaries. Our tests showed 93 % accuracy across different regions. This technology serves as "digital eyes" for machinery, replacing slow manual inputs with automated data. It enables robots to navigate and harvest continuously in complex smallholder farms, unlocking the full potential of smart agriculture.
Farm robots currently struggle in scattered fields due to a lack of precise map data. To solve...