the Creative Commons Attribution 4.0 License.
the Creative Commons Attribution 4.0 License.
 | 20 Mar 2026
Design of ultrasonic power based on a transducer admittance characteristic frequency-tracking method
Dongxing Du
Heng Yue
Qiang Mao
Jinxing Kong
Resonant-frequency drift caused by load variation and thermal effects is a major source of instability in ultrasonic-machining systems, leading to reduced electro-acoustic efficiency and fluctuating output power. Conventional phase-locked-loop (PLL) tracking schemes often suffer from controller–parameter sensitivity and frequency jitter under continuously drifting resonance, while impedance-scanning methods are accurate but time-consuming. To address these issues, this study proposes an ultrasonic power supply design and resonance-tracking method based on the admittance characteristics of the piezoelectric transducer under operating conditions. A voltage–current sampling circuit is developed to measure the magnitudes and phase differences at the transducer terminals in real time; the corresponding admittance information is then reconstructed, and the series resonant frequency is estimated through a two-step frequency transformation without full-range scanning. Experiments were conducted using a 100 W, 40 kHz transducer: the resonant frequency obtained by the proposed method was 41 320 Hz compared with 41 262 Hz as measured by an impedance analyzer, yielding a frequency deviation of 58 Hz and a relative error of 0.14 %. The results demonstrate that the proposed method can rapidly locate and lock the resonance frequency using only two frequency transformations, providing accurate in situ resonance estimation and improved output power stability for ultrasonic-machining power supplies.
- Article
(1011 KB) - Full-text XML
- BibTeX
- EndNote


Ultrasonic machining is an advanced manufacturing technique that has attracted increasing attention due to its ability to reduce cutting forces, improve tool life, and enhance surface integrity. Therefore, it has been widely applied in the processing of difficult-to-machine materials such as hard and brittle materials, honeycomb composites, and titanium alloys (Hourmand et al., 2021; Festas et al., 2021; Zhang et al., 2023). A typical ultrasonic-machining system mainly consists of an ultrasonic power supply, a piezoelectric transducer, an amplitude transformer (horn), and an ultrasonic tool head. Among these components, the ultrasonic power supply plays a pivotal role because its performance directly determines the stability and effectiveness of the entire ultrasonic-machining system.
The ultrasonic power supply converts the standard mains input (e.g., 220 V/50 Hz) into a high-frequency alternating excitation via an AC–DC–AC (alternating current to direct current to alternating current) conversion process, thereby driving the transducer to generate ultrasonic vibration. The vibration amplitude is further amplified through the horn to enable material removal and machining operations (Graff, 2015). However, during machining, variations in temperature, loading conditions, and boundary constraints can cause the resonant frequency of the transducer–tool system to drift. Consequently, resonant-frequency searching and real-time frequency tracking have become fundamental requirements for ultrasonic power supplies (Hemsel et al., 2014; Fu et al., 2019; Duan et al., 2023). In parallel, recent research has also highlighted the importance of automatic calibration and optimization in ultrasound systems to ensure stable signal performance, further indicating the necessity of robust real-time adjustment strategies in ultrasonic applications (Jung and Choi, 2022).
From the viewpoint of circuit topology and design objectives, ultrasonic power supplies in the literature can be broadly classified into several mainstream approaches. (i) Linear amplifier-based supplies generate high-frequency sinusoidal excitation by operating power devices in the linear region. They provide low electromagnetic interference (EMI) and high waveform purity but suffer from low efficiency and significant heat dissipation and are therefore mainly used in low-to-medium-power laboratory platforms or applications requiring high signal quality. (ii) Switching-mode AC–DC–AC supplies, typically consisting of a rectifier stage, a regulated DC link, and a high-frequency inverter (e.g., half-bridge/full-bridge), have become the dominant solution for industrial ultrasonic machining and welding due to their high efficiency, compact size, and scalability. However, their performance is strongly affected by transducer impedance variation, which requires proper driver and/or protection design and robust control to ensure stable output under changing loads. (iii) Resonant inverter-based supplies (e.g., series- or parallel-resonant and LLC (inductor–inductor–capacitor)-type structures) introduce resonant tanks to enable soft switching and improve power density, which is advantageous for high-power ultrasonic actuation. Nevertheless, resonant designs are sensitive to parameter tuning and load dynamics, and output stability may degrade when the operating point deviates from resonance. Therefore, modern ultrasonic power supplies increasingly integrate resonance-related regulation, where real-time frequency searching or tracking is combined with power control to maintain stable operation and high electro-acoustic efficiency in practical machining scenarios.
Resonance frequency tracking is commonly implemented in ultrasonic power supplies. Traditionally, analog ultrasonic power supplies often employ phase-locked-loop (PLL) techniques for closed-loop frequency tracking. With the development of embedded controllers, many modern ultrasonic power supplies adopt digital control methods, where digital PLL schemes are implemented to achieve frequency tracking (Rehman et al., 2021; Li and Qin, 2021; Guo et al., 2023). Nevertheless, PLL-based approaches are still sensitive to the tuning performance of PID (proportional–integral–derivative)-type controllers. When resonance drifts continuously, frequent updates of the excitation frequency may lead to output instability, which further deteriorates machining consistency and power regulation accuracy. To overcome these limitations, recent studies have explored alternative resonance tracking mechanisms beyond conventional PLL frameworks. For example, resonance control based on the admittance circle model has been developed to achieve fast resonance frequency control under varying operating conditions (Ye et al., 2025). Furthermore, robust and intelligent control strategies have been introduced into ultrasonic power supply frequency tracking, such as optimization-assisted sliding-mode control combined with matching network design, which improves tracking performance and suppresses frequency drift (Ye and Cai, 2025). In addition, admittance-extremum-based schemes (e.g., minimum admittance point tracking in phase shift pulse width modulation (PWM) inverter control) have also been reported for high-intensity ultrasonic power control (An et al., 2025; Ye et al., 2024). These developments motivate further research on admittance-characteristic-based tracking methods for achieving stable ultrasonic power output.
Compared with conventional PLL-based tracking, admittance-based resonance estimation is less sensitive to controller tuning and can reduce frequency jitter under continuous resonance drift. Moreover, unlike sweep-based methods requiring full-range scanning, the admittance characteristic enables fast online identification of resonance behavior using real-time voltage and/or current measurements, which is more suitable for stable ultrasonic-machining operation. To address these issues, this paper proposes an ultrasonic power supply design method based on frequency tracking using the admittance characteristics of the transducer. By sampling the voltages and currents at both terminals of the transducer and calculating their phase difference, the equivalent electrical parameters of the transducer under operating conditions can be obtained. The resonant frequency is then identified and tracked in real time, thereby reducing unnecessary frequency oscillations and improving output power stability. The proposed strategy enables fast resonant-frequency tracking and contributes to stable ultrasonic-machining performance.
The main function of the ultrasonic power supply is to output an ultrasonic frequency AC signal to drive the ultrasonic transducer operation and then to adjust the output signal according to the operating conditions to maintain the stability of the ultrasonic transducer operating conditions. Therefore, it is necessary to design relevant circuits to achieve these functions; Fig. 1 shows the design of the ultrasonic power supply topology of the main circuit.
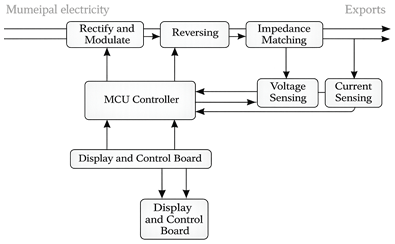
The ultrasonic power supply consists of several critical components, including the rectifier, DC link capacitor, buck converter, full-bridge inverter, and voltage- or current-sensing circuits. First, the AC input voltage is rectified by a diode bridge rectifier, which converts the AC into a regulated DC voltage. The DC link capacitor helps smooth out the low-frequency ripple, ensuring stable DC supply. The buck converter adjusts the DC voltage level to a suitable value to drive the transducer, optimizing power delivery. The full-bridge inverter converts this regulated DC voltage into high-frequency AC, driving the ultrasonic transducer. Real-time voltage- and current-sensing circuits monitor the transducer's performance, ensuring that the frequency is adjusted to maintain resonance even under varying load conditions. These components are integrated and controlled by a digital microcontroller, which implements the frequency-tracking algorithm to ensure stable and efficient operation throughout the ultrasonic-machining process.
Based on the topology shown in Fig. 1, a laboratory-prototype ultrasonic power supply was fabricated. The prototype consists of an AC–DC rectifier and DC link stage, a buck regulator for output amplitude control, a full-bridge inverter for high-frequency excitation, and real-time voltage- and/or current-sensing circuits for frequency tracking and power regulation.
2.1 Rectifier power module design
The municipal alternating current is 220 V/50 Hz; if one needs to convert it into ultrasonic signal output then they would need to rectify it to the DC and then invert it to the ultrasonic frequency AC output; thus, one needs to design the rectifier module to rectify it to the DC first. The rectifier module will first be connected to the utility AC power in the rectifier bridge, and the sinusoidal wave of AC power will be converted into DC power. After rectification, the DC voltage is filtered by the filter capacitor to remove the high-frequency component higher than 50 Hz, and only the DC voltage with a small voltage ripple is retained.
As the designed power supply requires the ability to adapt to different working conditions, the input signal needs to realize that the power can be adjusted. The ultrasonic transducer is a passive device, and the output power is determined by the input signal voltage amplitude and frequency and ultrasonic processing for ultrasonic frequency requirements, usually by changing the input voltage size. Commonly used voltage regulations are the BUCK (Buck Converter) voltage regulation and the LDO (Low-Dropout Regulator) voltage regulation of two kinds: in the ultrasonic power supply working under the large-voltage condition, LDO voltage regulation energy conversion efficiency rather than the BUCK voltage regulation is lower and will produce a lot of heat. Thus, in this design of the voltage regulator, we choose the BUCK voltage regulation.
The BUCK converter is a type of switching regulator that steps down the input voltage to a lower output voltage with high efficiency by switching the power transistor on and off (Zhang et al., 2023). A Low-Dropout Regulator (LDO), on the other hand, provides a stable output voltage even when the input voltage is close to the desired output level and is commonly used for low-power and noise-sensitive applications in ultrasonic power supply designs (Guo et al., 2026).
The rectifier power module design used in this paper is shown in Fig. 2. Through the rectifier bridge, there will be 220 V AC converted into DC, and then this will be filtered by the filter capacitor C1, which will filter out the AC signal and which filters capacitance according to Eq. (1).
In the formula, 0.289 is a constant determined by the ripple coefficient Acv (Liu et al., 2020; Yang et al., 2020; Brezak and Filipović-Grčić, 2017; Xu et al., 2016), f is the reference operating frequency, U is the maximum operating voltage, and I is the maximum operating current. According to the operating frequency of 40 kHz, the maximum output voltage of 220 V, and the maximum output current of 0.5 A, the ripple coefficient Acv is taken to be 0.1, and the capacitance value is calculated to be 780 µF, and a 1000 µF capacitor is selected for filtering considering redundancy.
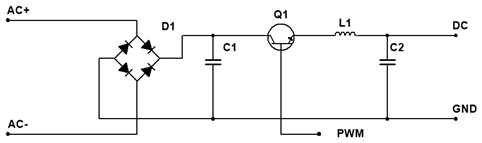
The subsequent regulator circuit uses Q1 as a switching tube to control the voltage's on and off times to change the size of its output voltage and uses the capacitor C2 voltage continuity characteristics of voltage stabilization, along with the use of inductance L1 current continuity characteristics of current continuity, to ensure that the voltage and current are stable and do not jump. At the same time, the use of C2 and L1 forms a low-pass filter to filter out high-frequency signals to maintain a stable output voltage amplitude.
In implementation, the rectifier stage uses a diode-bridge rectifier followed by a DC-link capacitor (C1) to reduce the 50 Hz ripple. The regulated DC bus is then generated by a buck converter using Q1 as the switching device, together with L1 and C2 to form a low-pass output filter. The duty cycle of Q1 is controlled by the microcontroller to adjust the DC bus voltage, which determines the excitation amplitude of the inverter stage.
2.2 Running condition detection circuit design
The circuit needs to sample voltage and current for phase comparison, which, in turn, outputs a phase error signal. Voltage sampling is done using resistor voltage division, and current sampling is done using a current transformer, which has a small phase delay and the precise phase of the sampled value. The power supply uses a microcontroller, STM32F103CBT6; this model has three 10-channel 12 bit analog-to-digital converters (ADCs) and can directly read the signal fed into the microcontroller in order to calculate the transducer operation voltage and current size, vibration frequency, and other information to become the ultrasonic power supply control of the data measurement basis. The sampling circuit is shown in Fig. 3.
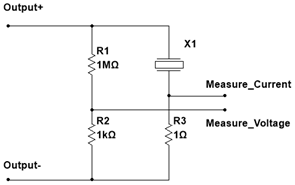
The model of the microcontroller used a voltage of 3.3 V. ADCs cannot recognize a voltage higher than 3.3 V, while the transducer operates at a voltage of more than 100 V to protect the microcontroller from damage by the large voltage; hence, we employ a voltage divider for the sampling of voltage and current The ultrasonic transducer designed in this paper and its vibration system require a maximum voltage amplitude of 200 V; the current is not greater than 1 A while taking into account the impact of reducing the measurement of the vibration system; the selected voltage measurement arm resistances of 1 MΩ and 1 kΩ; and the current measurement arm resistance of 1 Ω.
To ensure safe and accurate acquisition, the high-voltage transducer terminal voltage is scaled down by a high-impedance divider before being fed into the ADC channels of the STM32F103CBT6. The current is measured either by a current transformer with small phase delay (for online tracking) or by the voltage drop across a 1 Ω precision resistor in the validation setup (as shown in Figs. 3 and 10). Both voltage and current signals are conditioned by resistance–capacitance (RC) filtering and shifted to match the ADC input range (0–3.3 V), enabling real-time computation of amplitude and phase difference.
2.3 Control circuit design
This circuit takes digital control to generate ultrasound signals. With the choice of the AD9833 programmable waveform generator, the generator can produce high-precision square-wave outputs. When the main frequency clock is set to 25 MHz, we can achieve a 0.1 Hz resolution output signal; the main frequency clock of 1 MHz can achieve a 0.004 Hz resolution output signal, and the use of three serial interfaces to write data is easy for the microcontroller chip to use in relation to its control. This article uses Altium Designer to draw the ultrasonic power drive control circuit (Fig. 4).
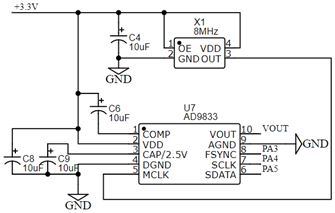
Figure 4Ultrasound power control drive circuit (designed by Altium Designer).
In an ultrasonic power supply, the inverter circuit has a direct voltage connection to the grid, but the control circuit should not be directly connected to the grid. In addition, the operating voltage of the switching circuit varies greatly and also does not allow the control circuit to be directly coupled with it. IR2110 is a self-contained opto-coupler isolation and electromagnetic isolation or drive module, with the advantages of small size and fast speed. Therefore, we chose IR2110 as the core design of the isolation coupling circuit, which, on the one hand, can ensure the stability of the control signal and, on the other hand, can also ensure the safety and reliability of the power supply.
The ultrasonic excitation signal generated by AD9833 is used as the reference for the inverter. The power stage adopts a full-bridge inverter topology to convert the regulated DC bus into a high-frequency AC voltage for driving the transducer. Gate signals are isolated and amplified by IR2110 gate drivers to guarantee safe operation and fast switching. The inverter-switching frequency is updated in real time by the frequency-tracking algorithm, while the excitation amplitude is adjusted through the DC bus regulation (buck stage), forming a dual-loop control for stable output power.
2.4 Control programming
The stabilized output of the ultrasonic power supply is mainly realized by two closed-loop control systems. (1) Power closed-loop control design uses the duty cycle of the PWM (pulse width modulation) signal to adjust the equivalent output voltage of the switching tube, and the output voltage is stabilized and the noise is reduced to obtain the controllable output power. The amplitude of the output voltage is changed to ensure the stabilization of the current flowing through the two ends of the transducer. (2) Frequency closed-loop control design entails collecting the voltage and current at the end of the transducer and its phase difference to be able to calculate the resonant frequency of the ultrasonic vibration system based on the system in order to realize the frequency search and tracking. Therefore, according to the above ideas, this paper adopts the ultrasonic power control program block diagram shown in Fig. 5.
In this control system, the display and matrix keyboard are used to realize human–computer interaction. When the configuration of the ultrasonic power supply system is to be changed, it is only necessary to modify the software parameters through the matrix keyboard without having to modify the hardware or burn in the program from scratch. Therefore, when the resonant frequency of the load transducer is changed, only the internal parameters of the program need to be reconfigured; the circuit does not need to be changed. The control program was developed using Keil5.
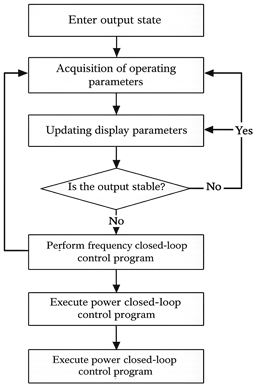
The output state of the transducer only changes significantly with frequency when it is near the resonant frequency, and so it is necessary to search for the initial resonant frequency of the transducer before frequency tracking can be performed. At the series resonant frequency, the ultrasonic transducer is at its lowest impedance, which can be utilized to compare the magnitude of the current at each frequency in the spectral range at the same voltage and to find the resonant frequency of the ultrasonic transducer after mounting by selecting a point where the current is the highest (Casper et al., 2012; Wang et al., 2020; Xing et al., 2012).
The frequency-tracking method proposed in this work operates by sampling the voltage and current signals at both terminals of the ultrasonic transducer. The signals are used to calculate the phase difference, which is then used to reconstruct the equivalent impedance of the transducer. This real-time impedance information is used to estimate and track the resonant frequency of the system. The system operates with a two-step frequency transformation, enabling fast convergence to the resonance frequency without requiring full-range scanning. The control algorithm employs a feedback loop that adjusts the frequency of the inverter, ensuring that the transducer remains at its optimal resonance point even under dynamic load conditions. The integration of this method into the overall system allows the ultrasonic power supply to maintain stable performance and efficient operation during machining despite fluctuations in load or impedance.
3.1 Frequency-tracking principle based on transducer conductance characteristics
The equivalent model of the ultrasonic transducer is shown in Fig. 6. Among them, R0 and C0 are static parameters, which will not change with the change in the ultrasonic transducer's operating condition, and Lc, Rc, and Cc are its dynamic parameters, which will change with the change in the operating condition. The frequency drift of the ultrasonic transducer in operation is reflected in the change in its dynamic parameters, and, conversely, as long as the dynamic parameters are known, the resonant frequency of the ultrasonic transducer in operation can also be calculated inversely.
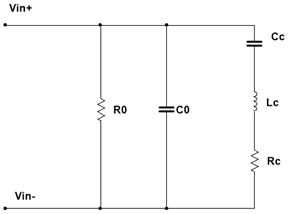
In the equivalent electrical parameters shown in Fig. 7, R0 is a very large resistor, which is usually treated as a broken circuit when in use. C0 is a certain value, which does not change with operating conditions and can be measured in advance. This can be known through the circuit principle. The voltage U, current I, and frequency ω of the whole system can be expressed as
or
Z is the total impedance of the model, and Y is the total conductance.
Included among these,
Expressing this in the form of a conductor, we would obtain
In this equivalent circuit, Y is the total conductance of the piezoelectric device, and Y0 and Y1 are parallel and series branch conductance. The horizontal coordinate is taken to denote the conductance G (real part of the conductance), and the vertical coordinate is taken to denote the conductance B (imaginary part of the conductance).
When the frequency changes in the range around the resonant frequency, the end trajectory of the phase vector of Y1 is represented by Eq. (8).
When the phase vector terminal of Y1 is rotated by 1 week, the phase vector terminal of Y0 is generally small with the frequency change, which is approximated as a constant, and Y0 is a purely imaginary number. Therefore, the trajectory circle of Y1 is translated upward along the longitudinal axis in the complex plane. The trajectory of the phase vector terminals of the total conductance with frequency change can be obtained as shown in Fig. 7, which is the so-called conductance circle.
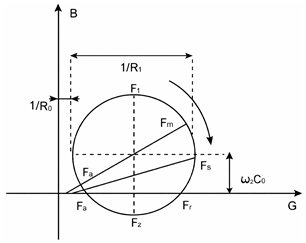
Using the conduction circle diagram, the equivalent circuit of the piezoelectric device and some other important parameters can be derived from the diagram. One can see three pairs of resonance frequencies: Fs mechanical (series) resonance frequency and Fp parallel resonance frequency, Fm maximum conduction frequency and Fn minimum conduction frequency, and Fr resonance frequency and Fa anti-resonance frequency. For routine applications, only Fs and Fp are needed, which, in general, can be approximated as follows: Fs ≈ Fm ≈ Fr and Fp ≈ Fn ≈ Fa. For a circle, only three points are needed to determine the center and radius of the circle. Specifically, for an ultrasonic transducer, the series resonant frequency can be searched for with at least two frequency changes in addition to the operating conditions. Since C0 does not change with operating conditions, the series resonant frequency ω values can be calculated after determining the center and radius of the circle.
It should be noted that the feasibility of using only two frequency transformations is rooted in the admittance behavior of the transducer near resonance. In the resonant neighborhood, the admittance locus of the motional branch can be approximated by an admittance circle on the conductance–susceptance plane, and the total conductance G(f) presents a single-peak characteristic around the series resonance frequency. Therefore, the change trend of conductance between two adjacent excitation frequencies provides sufficient directional information: if G(f2) > G(f1), the excitation frequency is approaching resonance; otherwise, it is moving away from resonance. Based on this monotonic trend in the local neighborhood, the algorithm can rapidly move the excitation frequency into the resonance region and then perform fine adjustment for stable tracking.
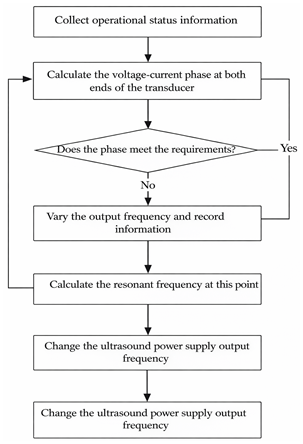
3.2 Frequency-tracking process
The ultrasonic power supply detection module will collect the voltage and current for comparison of zero (values); when the size of the two becomes zero and the time interval is very small, it can be assumed that, at this time, the phases of the two are the same in the state of resonance. When the two over-zero time intervals cannot be ignored, this moment is not in a resonance state, and so the need to adjust the output frequency in relation to the transducer resonance state arises. At this time, one can use the operating conditions collected by this method to calculate the resonant frequency at this moment and to change the output frequency of the ultrasonic power supply so that it remains in the resonant output state. The flow of output frequency tracking of the ultrasonic power supply is shown in Fig. 8.
Because the correction is derived from real-time voltage–current measurements, the proposed method can adapt to resonance drift caused by load changes, temperature rise, and abrasive-assisted machining conditions.
To ensure convergence of the two-step search, the initial frequency step Δf0 should be selected such that the resonance region is not skipped. In practice, this can be satisfied by limiting Δf0 to be smaller than the effective resonance bandwidth, which is related to the mechanical quality factor Q. A commonly used approximation is
thus, Δf0 < ΔfBW is recommended for stable convergence. If the initial step is too large, the conductance monotonicity around resonance may no longer hold, and the algorithm could overshoot the resonance peak. Therefore, the proposed method adopts a coarse-to-fine strategy: a moderate initial step is used to approach the resonance neighborhood, followed by a smaller step for fine tracking.
Compared with sweep-based resonance searching, the proposed method estimates the resonance direction from admittance variation and converges to the series resonance frequency using only two frequency transformations, thereby reducing searching time and suppressing unnecessary frequency oscillations.
In this study, resonance frequency-tracking accuracy and output stability (frequency deviation and power fluctuation) are selected as key indicators to validate the effectiveness of the proposed method because these factors directly affect vibration amplitude stability and machining consistency.
4.1 Experimental verification of ultrasonic power supply frequency tracking
To evaluate the proposed ultrasonic power supply design and frequency-tracking strategy, the following indicators are adopted: (i) resonant-frequency estimation accuracy, quantified by the frequency deviation and relative error with respect to the impedance analyzer measurement; (ii) online tracking feasibility under power-driven excitation, verified by waveform measurement and phase response; and (iii) output stability reflected by reduced frequency oscillation during resonance locking. The impedance analyzer result is used as the reference (ground truth) for resonance frequency comparison.
A prototype ultrasonic power supply was fabricated to validate the proposed design and tracking method, as shown in Fig. 9. The hardware integrates the rectifier and buck regulation stage, the full-bridge inverter, the STM32-based control board, and the voltage and/or current sensing circuits on a custom printed circuit board (PCB). During experiments, the microcontroller unit (MCU) outputs frequency commands to the waveform generator (AD9833), and the inverter drives the transducer with a high-frequency excitation voltage. The sensed voltage and/or current signals are sampled by the ADC, and the resonance frequency is updated online according to the proposed two-step frequency transformation strategy.
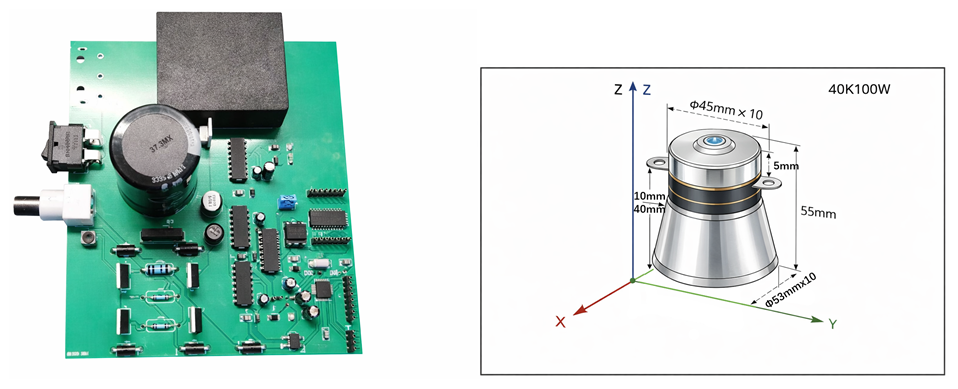
Figure 9Fabricated power supply (left) and used ultrasonic transducer (right). The transducer is rated at 100 W/40 kHz and employs a hard PZT ceramic stack.
Using 60 V to drive the transducer, the current flowing through the transducer can be obtained by measuring the 1Ω precision resistor connected in series to the transducer on the measurement circuit (Fig. 3) with the same structure as this power supply, and then the phase can be calculated by calculating the time difference between the voltage and current crossing the zero point. The voltage–current time difference across the zero point is shown in Fig. 10, and the phase difference is calculated as shown in Eq. (8). In Fig. 10, CH1 is the sampled transducer terminal voltage. CH2 is the current-sensing signal obtained from the voltage drop across the 1 Ω precision resistor connected in series with the transducer. Therefore, Fig. 10 presents the measured voltage and current waveforms for phase calculation rather than the input–output voltages after the transducer.
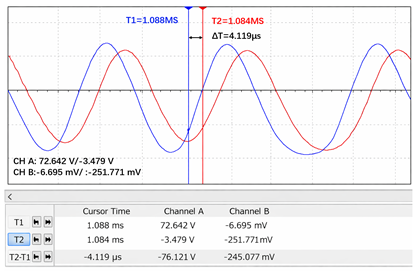
Figure 10The phase difference calculation (CH1 is the transducer terminal voltage, and CH2 is the current-sensing voltage measured across the 1 Ω series resistor).
The phase difference between the voltage and current is calculated as follows:
The selected transducer (which adopts a hard PZT (lead zirconate titanate) piezoelectric ceramic stack as the active element for high-power ultrasonic excitation) is designed with a power of 100 W and a frequency of 40 kHz, and the characteristic parameters of the ultrasonic transducer are measured using a PV520 impedance tester as shown in Table 1, and the resonance frequency of this type of ultrasonic transducer is measured to be 41 262 Hz under no load conditions.
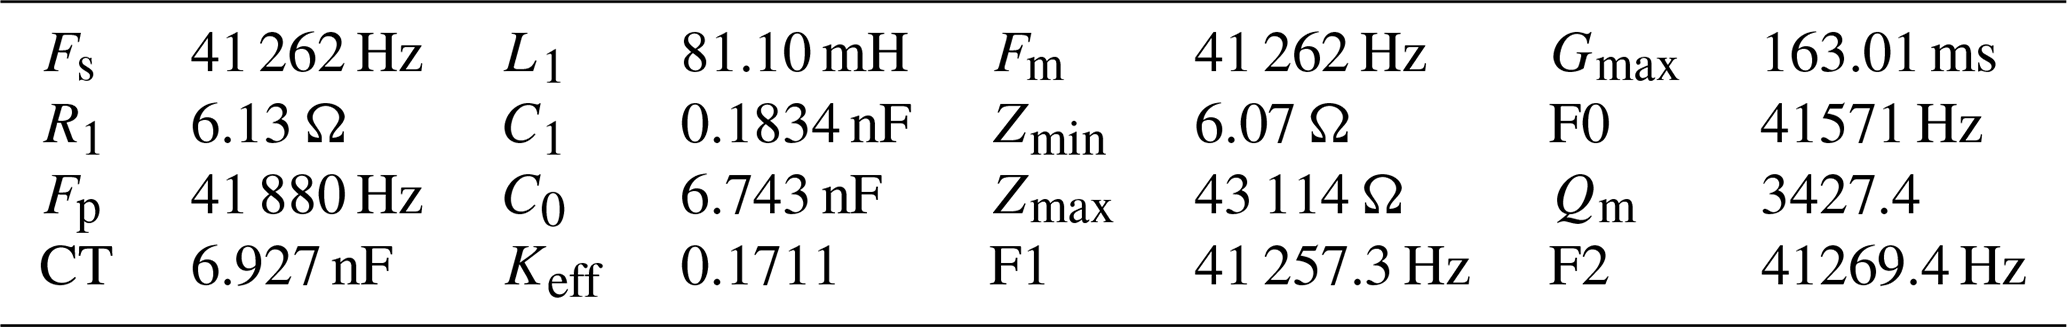
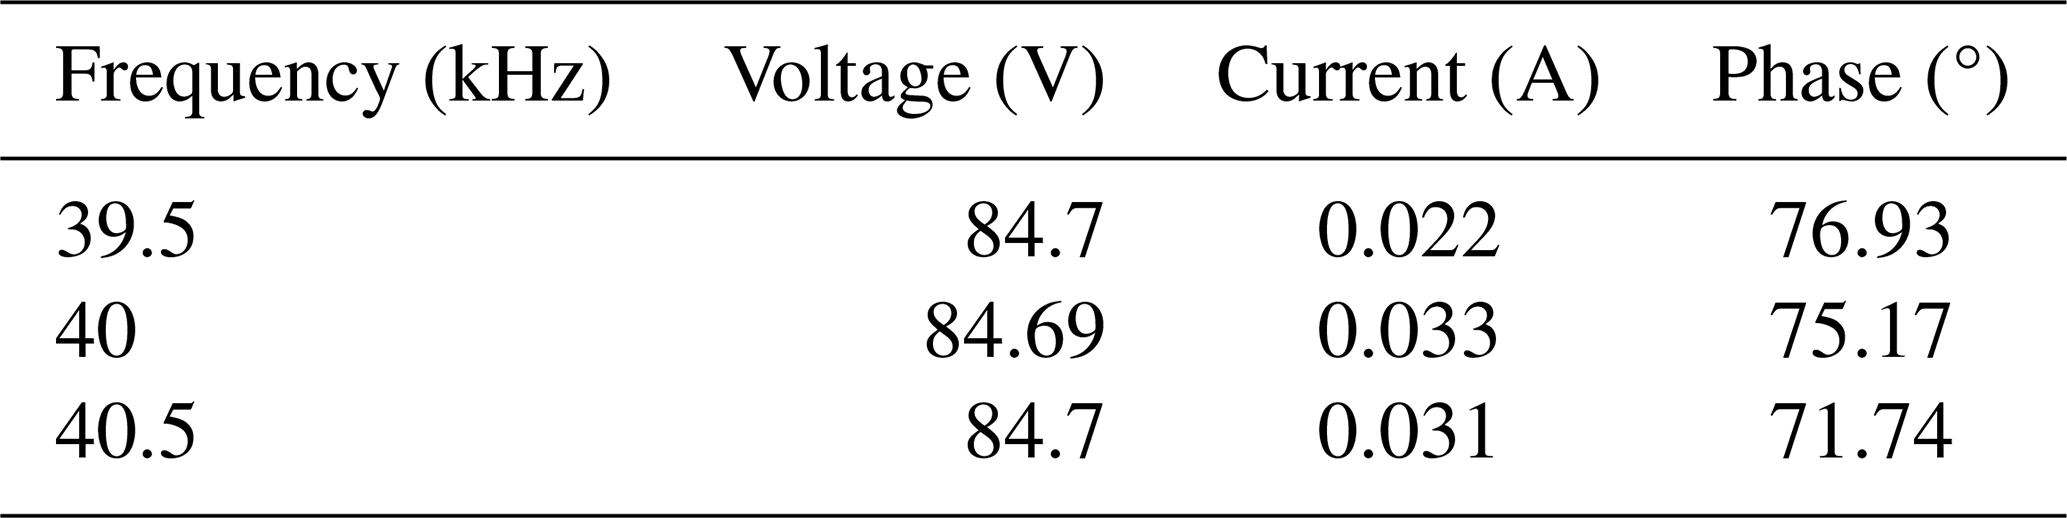
This difference is mainly due to the small-signal measurement condition of the impedance analyzer and the power-driven operating condition used in the proposed method. Considering the fact that the transducer design frequency is 40 kHz, three theoretical calculation frequencies around this frequency – 39.5, 40, and 40.5 kHz – are selected to measure their voltage and current phase data. The measurement results are shown in Table 2.
According to the admittance definition, the magnitude of the admittance is given by
Thus, the conductance and susceptance can be expressed as
Using the measured |Y| and phase angle θ, three representative points on the admittance circle can be obtained.
Based on these three points, the corresponding derivative circle equation is solved as follows:
This gives the series resonant frequency.
The resonance frequency of 41 320 Hz obtained by this method is very close to the 41 262 Hz measured by the impedance tester, with a frequency difference of 58 Hz, which is in the frequency band that allows the ultrasonic transducer to vibrate with high efficiency and can be used to drive the ultrasonic transducer, proving that it is possible to search for and track the resonance frequency of the ultrasonic transducer using this method. These results demonstrate that the proposed method achieves accurate resonance estimation (58 Hz deviation, 0.14 % relative error) with fast convergence since only two frequency transformations are required instead of full-range scanning.
The practical impact of this 58 Hz deviation on electro-acoustic conversion efficiency depends on the resonance bandwidth (related to the mechanical quality factor Q). Since the deviation is only about 0.14 % relative to 41 262 Hz, it represents a small detuning in typical high-power ultrasonic systems and is expected to cause only a limited reduction in conversion efficiency and acoustic amplitude while maintaining stable power output. Moreover, the impedance analyzer measures the transducer under small-signal conditions, whereas the proposed method identifies the effective resonance under actual power excitation, where temperature rise and nonlinear behavior may shift the operating resonance frequency slightly. Therefore, a small offset between these two measurements is reasonable in high-power operation.
The proposed resonance frequency-tracking method has direct relevance to ultrasonic-machining applications. In ultrasonic machining, the resonant frequency of the transducer can drift due to changes in load, temperature, and material properties. These variations can lead to fluctuations in the ultrasonic power output, affecting machining efficiency and precision. By continuously tracking the resonant frequency in real time, the proposed method ensures stable operation of the ultrasonic system, maintaining consistent power output even under dynamic conditions. This stability is critical for improving the consistency and quality of ultrasonic-machining operations, such as cutting, drilling, and polishing of hard materials.
4.2 Robustness under load variation and abrasive machining conditions
During ultrasonic machining, the operating load may vary significantly due to changes in contact force, material removal conditions, and the presence of abrasive particles in the processing medium. Such variations modify the mechanical damping and boundary constraints of the transducer–horn–tool system, which results in changes in the transducer's equivalent electrical parameters and resonance characteristics. In practice, these effects are manifested as a drift of the resonance frequency and a change in the admittance and/or conductance response around resonance.
The proposed two-step frequency-tracking strategy is intended to be robust under these disturbances because it determines the frequency correction direction based on the measured voltage and current at the transducer terminals (i.e., admittance and/or conductance characteristics) rather than depending solely on phase-locking behavior. Specifically, when load variations cause a sudden resonance shift, the first step performs a coarse frequency correction to rapidly move the excitation frequency back into the resonance neighborhood. The second step then carries out a fine adjustment to reduce unnecessary frequency oscillations and to improve steady-state stability of the output power. Therefore, under typical machining disturbances (including abrasive-assisted conditions), the method is expected to maintain stable resonance tracking with limited detuning and improved power stability.
It should be noted that, under extremely rapid or highly nonlinear load disturbances, the algorithm may require additional iterations to re-enter the resonance neighborhood. However, since the method continuously updates the frequency based on real-time electrical response, it can still converge to the effective operating resonance and maintain stable ultrasonic excitation.
4.3 Comparison with conventional resonance tracking methods
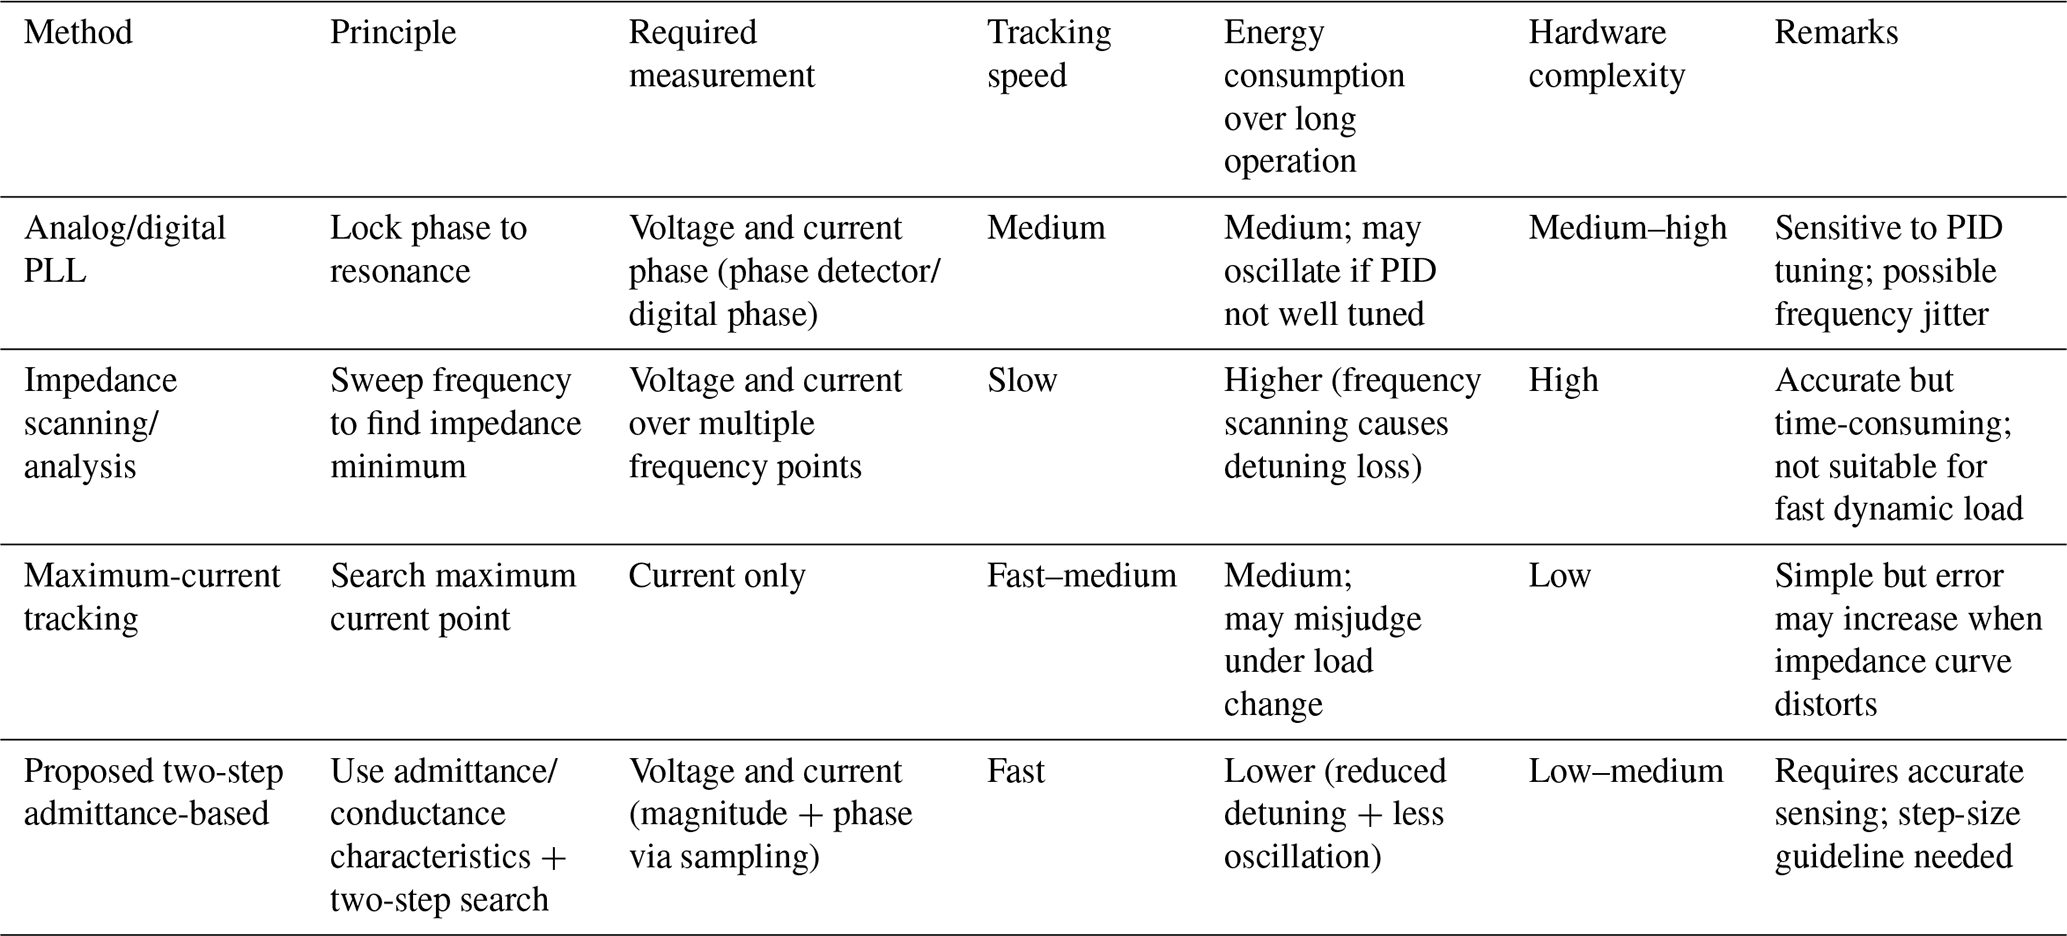
Conventional resonance tracking methods for ultrasonic power supplies mainly include PLL-based tracking, impedance scanning and/or analysis, and maximum-current searching. PLL-based approaches achieve resonance tracking by phase locking; however, their dynamic response and stability strongly depend on PID parameter tuning. Under continuously drifting resonance, PLL control may lead to frequency jitter and power oscillation. Impedance-scanning methods can provide high accuracy by sweeping multiple frequency points, but the scanning process is time-consuming and may introduce extra detuning loss, resulting in increased energy consumption and reduced suitability for rapidly changing loads. Maximum-current tracking has low hardware complexity, but it may become less reliable under varying load conditions because the current peak can be distorted by changes in the matching network and load-dependent impedance characteristics.
In contrast, the proposed two-step method determines the frequency correction direction based on the real-time electrical response (admittance and/or conductance features) of the transducer under operating conditions. The resonance neighborhood can be reached with only two frequency transformations, which improves tracking speed and reduces unnecessary frequency oscillations. Over extended operation periods, this contributes to reduced reactive power circulation and detuning loss, improving output power stability and potentially lowering energy consumption. The hardware implementation remains relatively simple, requiring only voltage and/or current sampling and microcontroller-based computation without additional dedicated phase detector modules or impedance sweep functions. A summary comparison is provided in Table 3.
Table 3Comparison of resonance frequency-tracking methods for ultrasonic power supplies.
4.4 Dynamic response comparison under load variations
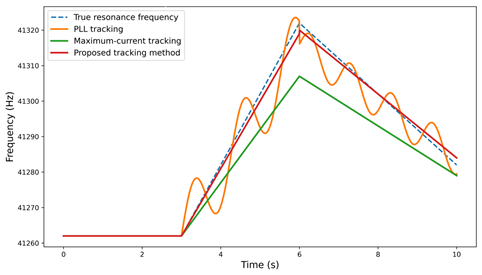
Under practical machining conditions, the resonance frequency of the transducer–horn–tool system may drift due to temperature rise and load variation. For PLL-based tracking, the closed-loop response is highly dependent on PID tuning; when resonance drifts rapidly, the PLL may show overshoot or oscillate, resulting in frequency jitter and power instability. In contrast, maximum-current searching detects the resonance based on the current peak, which is computationally simple; however, under varying load and matching network changes, the current peak may shift and become distorted, leading to tracking bias and degraded accuracy.
The proposed two-step admittance-based method relies on real-time voltage–current measurements and admittance-related characteristics, which reflect the effective operating resonance under actual driving conditions. When a sudden load variation occurs, a coarse update rapidly drives the excitation frequency back into the resonance neighborhood followed by a fine adjustment to suppress oscillation. As a result, the proposed method is expected to provide improved robustness against temperature drift and transducer characteristic variation, with reduced steady-state frequency jitter and enhanced power stability. A qualitative comparison of dynamic response among the three methods is illustrated in Fig. 11.
4.5 Resonant-frequency shift analysis
A small but consistent frequency offset is observed between the resonance frequency identified by the proposed power supply and the resonance obtained from the impedance analyzer. This discrepancy can be explained by three main factors.
-
Small-signal vs. power-driven operating condition. The impedance analyzer characterizes the transducer under small-signal excitation, while the proposed method identifies the effective resonance under actual driving power. During high-power operation, temperature rise and mild nonlinear electromechanical behavior may shift the effective resonance frequency, leading to an offset relative to the small-signal reference.
-
System latency. In the proposed implementation, the sampling of voltage and/or current, the digital computation, and the PWM update introduce a finite delay, which may cause a slight bias when the resonance drifts. Nevertheless, since the observed offset is stable and small, latency is considered to be a secondary contributor.
-
Algorithmic discretization. The frequency search uses a finite step size and a stopping criterion. As a result, the identified resonance may deviate by a small amount within the step resolution. This residual deviation may also contribute to the observed offset.
Overall, the impedance analyzer result can be treated as a small-signal reference, whereas the proposed method provides an in situ estimation of the effective operating resonance under real excitation conditions, which is more relevant for stable power transfer during ultrasonic machining.
4.6 Limitations and further validation
It should be noted that the current experiments mainly validate the feasibility and resonance estimation accuracy of the proposed method using a fabricated prototype and impedance analyzer benchmarking. Comprehensive dynamic tests under varying machining loads, temperature rise, and different boundary constraints were not included in the current work.
In practical ultrasonic machining, rapid load variation, thermal drift, and boundary condition changes may lead to continuous resonance migration and transient disturbance. Since the proposed strategy reconstructs admittance information from real-time voltage and/or current sampling, it has the potential to compensate for resonance drift online without full-range scanning, which is promising for dynamic operating conditions.
This paper presented an ultrasonic power supply design and a fast resonance frequency-tracking strategy based on the transducer admittance characteristics under operating conditions. The proposed approach reconstructs the admittance information from real-time voltage and/or current sampling and estimates the series resonance frequency using a two-step frequency transformation, thereby reducing unnecessary frequency oscillations and improving output stability in ultrasonic-machining applications.
The main conclusions and contributions of this work can be summarized as follows:
- 1.
An admittance-based resonance estimation and tracking method was developed for ultrasonic power supplies. Unlike conventional PLL-based tracking methods, which may suffer from controller–parameter sensitivity and frequency jitter, the proposed strategy estimates resonance behavior through operating-point admittance reconstruction and avoids full-range frequency scanning. This significantly improves the robustness and stability of the ultrasonic power supply under dynamic operating conditions, such as load changes and temperature variations.
- 2.
A prototype ultrasonic power supply with integrated voltage and/or current sensing and embedded control was fabricated to validate the proposed method. Experiments with a 100 W and 40 kHz piezoelectric transducer showed that the resonance frequency estimated by the proposed method was 41 320 Hz compared with the 41 262 Hz measured by an impedance analyzer. The frequency deviation is 58 Hz, corresponding to a relative error of 0.14 %, which demonstrates the accuracy of the proposed resonance estimation strategy under power-driven conditions.
- 3.
The proposed method can locate and lock the resonance frequency using only two frequency transformations, demonstrating fast convergence and low implementation complexity. This is particularly beneficial for real-time ultrasonic-machining applications, where resonance drift frequently occurs due to varying loads and temperature conditions. By ensuring continuous and stable power output, the proposed method contributes to enhanced machining consistency, efficiency, and precision in ultrasonic processing tasks.
Future work will include conducting systematic experiments under varying mechanical loads, temperature rise conditions, and boundary constraints. Further evaluation of dynamic tracking performance will be conducted, focusing on convergence time, steady-state frequency jitter, and the impact of real-world machining conditions on the accuracy of the resonance tracking method.
The datasets supporting the conclusions of this article are included within the article.
Dongxing Du was in charge of the whole trial; Heng Yue and Qiang Mao wrote the paper. Jinxing Kong assisted with the sampling and laboratory analyses. All of the authors read and approved the final paper.
The contact author has declared that none of the authors has any competing interests.
Publisher's note: Copernicus Publications remains neutral with regard to jurisdictional claims made in the text, published maps, institutional affiliations, or any other geographical representation in this paper. The authors bear the ultimate responsibility for providing appropriate place names. Views expressed in the text are those of the authors and do not necessarily reflect the views of the publisher.
The authors sincerely thank senior engineer Dongxing Du of the Institute of Mechanical Manufacturing Technology, China Academy of Engineering Physics, for his critical discussions and thorough reading during the preparation of this paper.
This research has been supported by the National Natural Science Foundation of China (grant no. 51805498).
This paper was edited by Qingyu Yao and reviewed by Hojong Choi and five anonymous referees.
An, Y.-N., Ri, M.-S., Choe, K.-C., Yun, Y.-I., Ahn, U., and Ryu, H.-C.: A rational frequency tracking method for phase-shift PWM inverter using minimum admittance point in high-intensity ultrasonic power control, Phys. Scripta, 100, 125243, https://doi.org/10.1088/1402-4896/ae2963, 2025.
Brezak, D. and Filipović-Grčić, D.: Improvement of ultrasonic method for testing of power transformers, Procedia Engineer., 202, 189–201, https://doi.org/10.1016/j.proeng.2017.09.707, 2017.
Casper, A., Liu, D., and Ebbini, E. S.: Realtime Control of Multiple-focus Phased Array Heating Patterns Based on Noninvasive Ultrasound Thermography, IEEE T. Bio-Med. Eng., 59, 95–105, https://doi.org/10.1109/TBME.2011.2162105, 2012.
Duan, Z., Gong, X., Zhang, K., and Xiangli, K.: Design of Ultrasonic Power Supply Matching Network and Frequency Auto-Tracking, in: 22023 9th International Conference on Mechanical and Electronics Engineering (ICMEE), Xi'an, China, 17–19 November 2023, IEEE, 33–37, https://doi.org/10.1109/ICMEE59781.2023.10525543, 2023.
Festas, A., Ramos, A., and Davim, J. P.: Machining of titanium alloys for medical application – a review, P. I. Mech. Eng. B-J. Eng., 236, 309–318, https://doi.org/10.1177/09544054211028531, 2021.
Fu, Y., Fu, T., and Wang, A.: A Design of Wide-range Frequency-tracking Ultrasonic Power Supply, J. Phys. Conf. Ser., 1345, 032095, https://doi.org/10.1088/1742-6596/1345/3/032095, 2019.
Graff, K. F.: Power ultrasonic transducers, Power Ultrasonics, 188, 127–158, https://doi.org/10.1016/B978-1-78242-028-6.00006-5, 2015.
Guo, N., Cheng, J., Yue, C., Chen, C., Liu, C., and Dong, L.: A High-PSRR LDO with Low Noise and Ultra-Low Power Consumption, Micromachines, 17, https://doi.org/10.3390/mi17010091, 2026.
Guo, N., Luo, X., Yan, H., Liu, C., Yang, W., Zhao, L., and Dong, L.: Design of an Automatic Resonance Frequency Tracking Chip for Power Ultrasonic Transducer With a Center Frequency Below 100 kHz, IEEE Sens. J., 23, 9848–9858, https://doi.org/10.1109/JSEN.2022.3232155, 2023.
Hemsel, T., Bornmann, P., Morita, T., Sondermann-Wölke, C., and Sextro, W.: Reliability analysis of ultrasonic power transducers, Arch. Appl. Mech., 86, https://doi.org/10.1007/s00419-014-0965-4, 2014.
Hourmand, M., Sarhan, A. A. D., Sayuti, M., and Hamdi, M.: A Comprehensive Review on Machining of Titanium Alloys, Arab. J. Sci. Eng., 46, 7087–7123, https://doi.org/10.1007/s13369-021-05420-1, 2021.
Jung, U. and Choi, H.: Active echo signals and image optimization techniques via software filter correction of ultrasound system, Appl. Acoust., 188, 108519, https://doi.org/10.1016/j.apacoust.2021.108519, 2022.
Li, D. and Qin, Q.: The invention relates to an intermediate frequency power supply fast start and digital phase locked loop control technology, J. Phys. Conf. Ser., 2137, 012016, https://doi.org/10.1088/1742-6596/2137/1/012016, 2021.
Liu, H., Zhang, D., Wang, Z., Hou, X., Zhang, H., and Liu, Z.: A Model Reference Voltage Mode Control for Ripple Cancellation Buck Converter of Wide-Operation Range, in: 2020 IEEE 3rd International Conference on Electronics Technology (ICET), Chengdu, China, 8–12 May 2020, IEEE, 314–318, https://doi.org/10.1109/icet49382.2020.9119512, 2020.
Rehman, M. R. U., Hejazi, A., Ali, I., Asif, M., Oh, S., Kumar, P., Pu, Y., Yoo, S.-S., Hwang, K. C., Yang, Y., Jung, Y., Huh, H., Kim, S., Yoo, J.-M., and Lee, K.-Y.: Ultra-Low-Power 2.4 GHz All-Digital Phase-Locked Loop With Injection-Locked Frequency Multiplier and Continuous Frequency Tracking, IEEE Access, 9, 152984–152992, https://doi.org/10.1109/access.2021.3123167, 2021.
Wang, J.-D., Jiang, J.-J., Duan, F.-J., Cheng, S.-Y., Peng, C.-X., Liu, W., and Qu, X.-H.: A High-Tolerance Matching Method Against Load Fluctuation for Ultrasonic Transducers, IEEE T. Power Electr., 35, 1147–1155, https://doi.org/10.1109/tpel.2019.2921384, 2020.
Xing, X. Q., Gao, C. Q., and Zhu, X. J.: Monitoring and Research of Power Ultrasonic Honing Vibration Frequency, Adv. Mat. Res., 605–607, 937–940, https://doi.org/10.4028/www.scientific.net/amr.605-607.937, 2012.
Xu, L., Yang, M., Li, S., Zhuang, X., Yang, T., and Zhou, M.: An improved frequency tracking strategy in ultrasonic transducer, 2016 Symposium on Piezoelectricity, Acoustic Waves, and Device Applications (SPAWDA), Xi'an, China, 21–24 October 2016, IEEE, 32–36, https://doi.org/10.1109/spawda.2016.7829950, 2016.
Yang, P., Cao, J., Shang, Z., Cai, Y., and Xu, J.: Double-Line Frequency Ripple Suppression of a Quasi-Single Stage AC–DC Converter, IEEE T. Circuits-II, 67, 2074–2078, https://doi.org/10.1109/tcsii.2019.2948942, 2020.
Ye, L. and Cai, H.: Hippopotamus Optimization-Sliding Mode Control-Based Frequency Tracking Method for Ultrasonic Power Supplies with a T-Type Matching Network, Electronics, 14, https://doi.org/10.3390/electronics14173358, 2025.
Ye, S., Peng, T., Long, Z., Jiang, Z., Li, X., and Cao, Z.: Investigation to resonant frequency control of high power ultrasonic transducer based on the beating model, Ultrasonics, 137, 107195, https://doi.org/10.1016/j.ultras.2023.107195, 2024.
Ye, S., Long, Z., Li, Y., Zhao, H., and Li, X.: An novel algorithm of vibration resonance control for power ultrasonic device via extremum seeking control based maximum conductance searching, Appl. Acoust., 230, 110409, https://doi.org/10.1016/j.apacoust.2024.110409, 2025.
Zhang, C., Zou, D., Mazur, M., Mo, J. P. T., Li, G., and Ding, S.: The State of the Art in Machining Additively Manufactured Titanium Alloy Ti-6Al-4V, Materials, 16, 2583, https://doi.org/10.3390/ma16072583, 2023.
Zhang, K., Gao, G., Zhao, C., Wang, Y., Wang, Y., and Li, J.: Review of the design of power ultrasonic generator for piezoelectric transducer, Ultrason. Sonochem., 96, 106438, https://doi.org/10.1016/j.ultsonch.2023.106438, 2023.