the Creative Commons Attribution 4.0 License.
the Creative Commons Attribution 4.0 License.
 | 18 Nov 2025
A straw-inspired statically balanced compliant torque coupling
Xiaochen Yang
Jiayao Ma
Yan Chen
Statically balanced compliant mechanisms (SBCMs) can always maintain equilibrium without external forces and energy input, enabling accurate force and displacement transmission widely applied in engineering. However, structural designs to achieve high-efficiency torque and rotation transmission through neutral stability remain underdeveloped. In this paper, inspired by the azimuthal stability of the bendy straw in its bent state, we propose a statically balanced compliant torque coupling (SBCTC) composed of series-connected frustum shells. Numerical simulations based on the enlarged bendy-straw prototype to investigate the bending stability indicate that for SBCTCs with an identical outer radius, steeper base angles and larger radial differences are inclined to achieve bistability of the original extended and bent states. Based on geometrical characteristics from numerical results, a simplified beam model was built to accurately predict the bent state, enabling programmable SBCTC design. Subsequently, the bent SBCTC under torsion was also analysed through numerical simulations, which unveiled that all material elements experience periodic deformation along the closed circumferential path of the frustum shell. Simultaneously, the strain energy among material elements compensates for and coordinates with each other, thereby maintaining a constant total strain energy with an unchanged overall geometry during torsion. High-precision CT scanning technology was then employed on the physical prototype to quantitatively validate our numerical results and shape conservation. Finally, a specialised test platform was constructed here to test the torque transmission capabilities and limitations of the SBCTCs under different loads. As a result, our SBCTC can bend over 90° while maintaining a transmission efficiency of over 75 %, significantly surpassing existing industrial flexible couplings.
- Article
(14554 KB) - Full-text XML
- BibTeX
- EndNote


Statically balanced compliant mechanisms (SBCMs) are compliant mechanisms that maintain constant strain energy through precise internal component coordination (Gallego and Herder, 2010; Wang et al., 2021). This exquisite design endows SBCMs with zero stiffness (zero actuation force), enabling energy-free motion and near-perfect transmission efficiency (de Lange et al., 2008; Tolou et al., 2011). Since first proposed in 2000 (Herder and van den Berg, 2000; Herder, 2001), this design concept has been widely applied to various beam systems, including space-deployable structures (Schenk et al., 2007) and medical instruments (Tolou and Herder, 2009). When extended to shell structures, these SBCMs can maintain static equilibrium throughout their entire range of motion, also known as neutral stability (Thomson and Tait, 1867; Tarnai, 2003). For these neutrally stable structures, the strain energy was initially stored in the form of pre-stress and was then redistributed within the structure itself to trigger deformation without any additional energy needed (Kok, et al., 2021; Radaelli, 2021; Lachenal et al., 2023).
In 2004, Murphey and Pellegrino (2004) bonded two laminae with perpendicular curvature axes and opposing curvatures together to develop a composite tape spring with neutral stability. Another pre-stressed cylindrical slender shell, shaped through plastic bending, maintains a constant principal curvature when it smoothly transitions from helical to cylindrical states while preserving zero-stiffness characteristics and neutral stability (Guest et al., 2011; Seffen and Guest, 2011). Additionally, Hamouche et al. (2017) further extended the slender disc to a circular disc as a gearless flexible actuator, which was also moulded into a cylindrical shape via plastic deformation. However, in practice, introducing controlled pre-stress is rather challenging due to sensitivity and complexity (Kok et al., 2021). Instead, it is more feasible to impose boundary conditions to generate appropriate self-stress through structural design. For example, when two fan-shaped sheets are bonded along their shorter edges and partially inverted, neutral stability can occur and propagate through the transition zone, as in the 3D-printed model (Kok et al., 2023). In fact, common closed-loop structures can inherently develop self-equilibrium pre-stress distribution due to geometric constraints. The elastic beam, formed into a circular loop, can keep rotating around its centroidal axis, maintaining a state of neutral stability without requiring additional energy (Thomson and Tait, 1867). Another example is a closed-loop tape spring, whose localised folds served as rotational joints, while straight sections acted as variable-length links. Owing to its neutral stability, the structure remained statically balanced in any position without precise control (Vehar et al., 2004). In curved-crease origami, concentric alternating mountain-valley folds induced cyclic curvature propagation through torsion while preserving a saddle-shaped global configuration (Dias et al., 2012). Remarkably, the four aforementioned structures, i.e. the gearless flexible disc, the closed circular beam, the closed-loop tape spring, and the curved-crease ring, can maintain their global shape unchanged with constant strain energy during continuous deformation due to their high symmetry, thereby achieving zero-elastic energy modes (ZEEMs) (Baumann et al., 2018).
Regarding closed-loop symmetric structures, we note the common bendy straw composed of cylindrical frustum shells connected in series with alternating orientations. Each unit exhibits three independent stable states: the original extended state, the retracted state via full inversion of the frustum shell, and the special bent state via partial inversion of the frustum shell (Bende et al., 2018). Current theoretical research focuses on the mechanical and geometric characteristics of stable states and mutual transitions. Through numerical simulations based on beam hinges and discretised stiffness models (Wo and Filipov, 2022; Liu et al., 2022), the effects of geometric parameters, inherent stress distribution, and cross-sectional profiles (Ben-Abu et al., 2024b) on multistable behaviours were systematically investigated to design 3D pixel metamaterials for energy absorption (Pan et al., 2019), reconfigurable metawires (Liu et al., 2022) for shape fitting, and soft robots for obstructed environments (Ben-Abu et al., 2023, 2024a). However, the intrinsic shell morphology of the bent state still lacks detailed analysis of the intrinsic shell morphology of the bent bendy straw. The reconfigurable capability in applications further illustrates that the bent bendy straw can remain stable at any circumferential position with unchanged geometry, demonstrating typical neutral stability and a zero-elastic energy mode. Here, this behaviour prompts us to investigate the underlying mechanisms and explore its application potential for designing a novel torque coupling with neutral stability (Kim et al., 2024; Carton et al., 2025).
In this paper, we design and study a novel statically balanced compliant torque coupling (SBCTC), which contains series-connected conical frustum shells to achieve high-efficiency torque transmission. Numerical simulation and experimental validation demonstrate that our SBCTC can bend over 90° while maintaining a transmission efficiency of over 75 %, remarkably outperforming conventional rubber and other industrial flexible couplings (typically with efficiency < 50 %). The layout of the paper is listed as follows. Section 2 presents the geometry of the SBCTC unit and the fundamental setup for numerical simulations of the SBCTC unit during bending and torsion. In Sect. 3, by abstracting the geometric characteristics from the finite-element model, a simplified beam model is established to elucidate the geometric features, thereby enabling precise prediction of the steady-state behaviour. Additionally, a parametric study is carried out to provide a theoretical basis for the optimal parameter selection of the SBCTC. Section 4 provides numerical methods to unveil the constant strain energy of the SBCTCs with an unchanged shape during torsion, further verified by geometrical construction of 3D scanning results. Subsequently, precise experiments are conducted to verify the stable and efficient torque transmission performance of the SBCTCs in different working scenarios in Sect. 5. Finally, conclusions are presented in Sect. 6.
2.1 Geometry
To design a compliant coupling capable of transmitting torques stably at variable angles, the core is to develop a closed curved surface. The surface must maintain static balance during torsion and possess bistability in its bent state to ensure stable torque transmission at variable angles. Inspired by a bendy straw, the basic unit of the SBCTC is a tandem pair of different conical frustum shells connected at a special “crease”-like region. Similar large-sized structures are also applied in drain hoses and toy pop glow tubes (Ningbo Miracle Creative Technology Co. Ltd.), typically fabricated from polypropylene (PP) via a blow-moulding process, as detailed in Fig. 1a. This manufacturing process leads to the thinnest convex hinge-like regions with wrinkles, followed by the bottom conical frustum shell with medium thickness, while the upper frustum shell is the thickest. Therefore, the simplified SBCTC unit, as shown in Fig. 1b and c, can be described by the identical outer radius R, inner radius r, slant angle α, and shell thickness t1 for the bottom frustum shell and slant angle β and shell thickness t2 for the upper frustum shell. In addition, the concave hinge-like region where two frustum shells are connected is filleted by the smaller chamfer circles of radius rf1 with shell thickness tf1, and the concave hinge-like region is filleted by the larger chamfer circles of radius rf2 with shell thickness tf2, as shown in Fig. 1d. All these parameters – R, r, rf1, rf2, α, β, t1, t2, tf1, and tf2 – define the geometry of the SBCTC unit completely. Its unit height h can then be obtained as
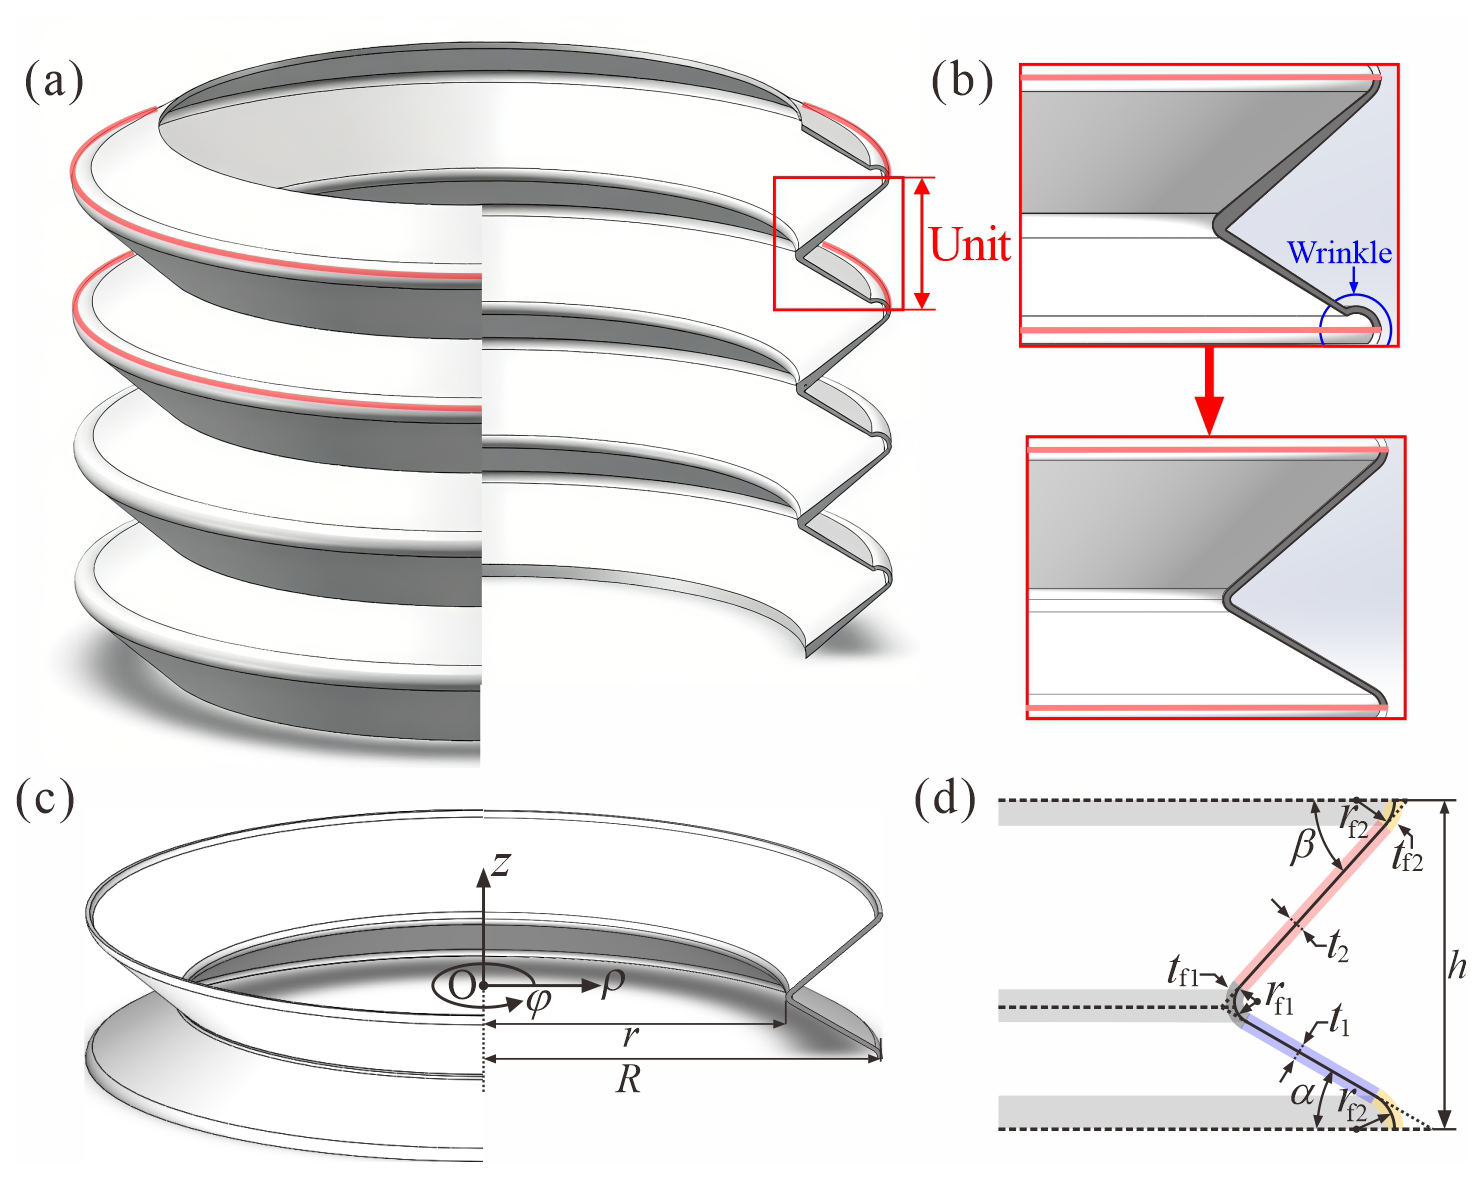
Figure 1(a) Pop glow tube composed of five units from a perspective view; (b) detailed geometry of one unit of the pop tube and optimised geometry from a sectional view. (c) SBCTC unit from a perspective view; (d) geometry of an SBCTC unit from a sectional view.
2.2 Numerical modelling
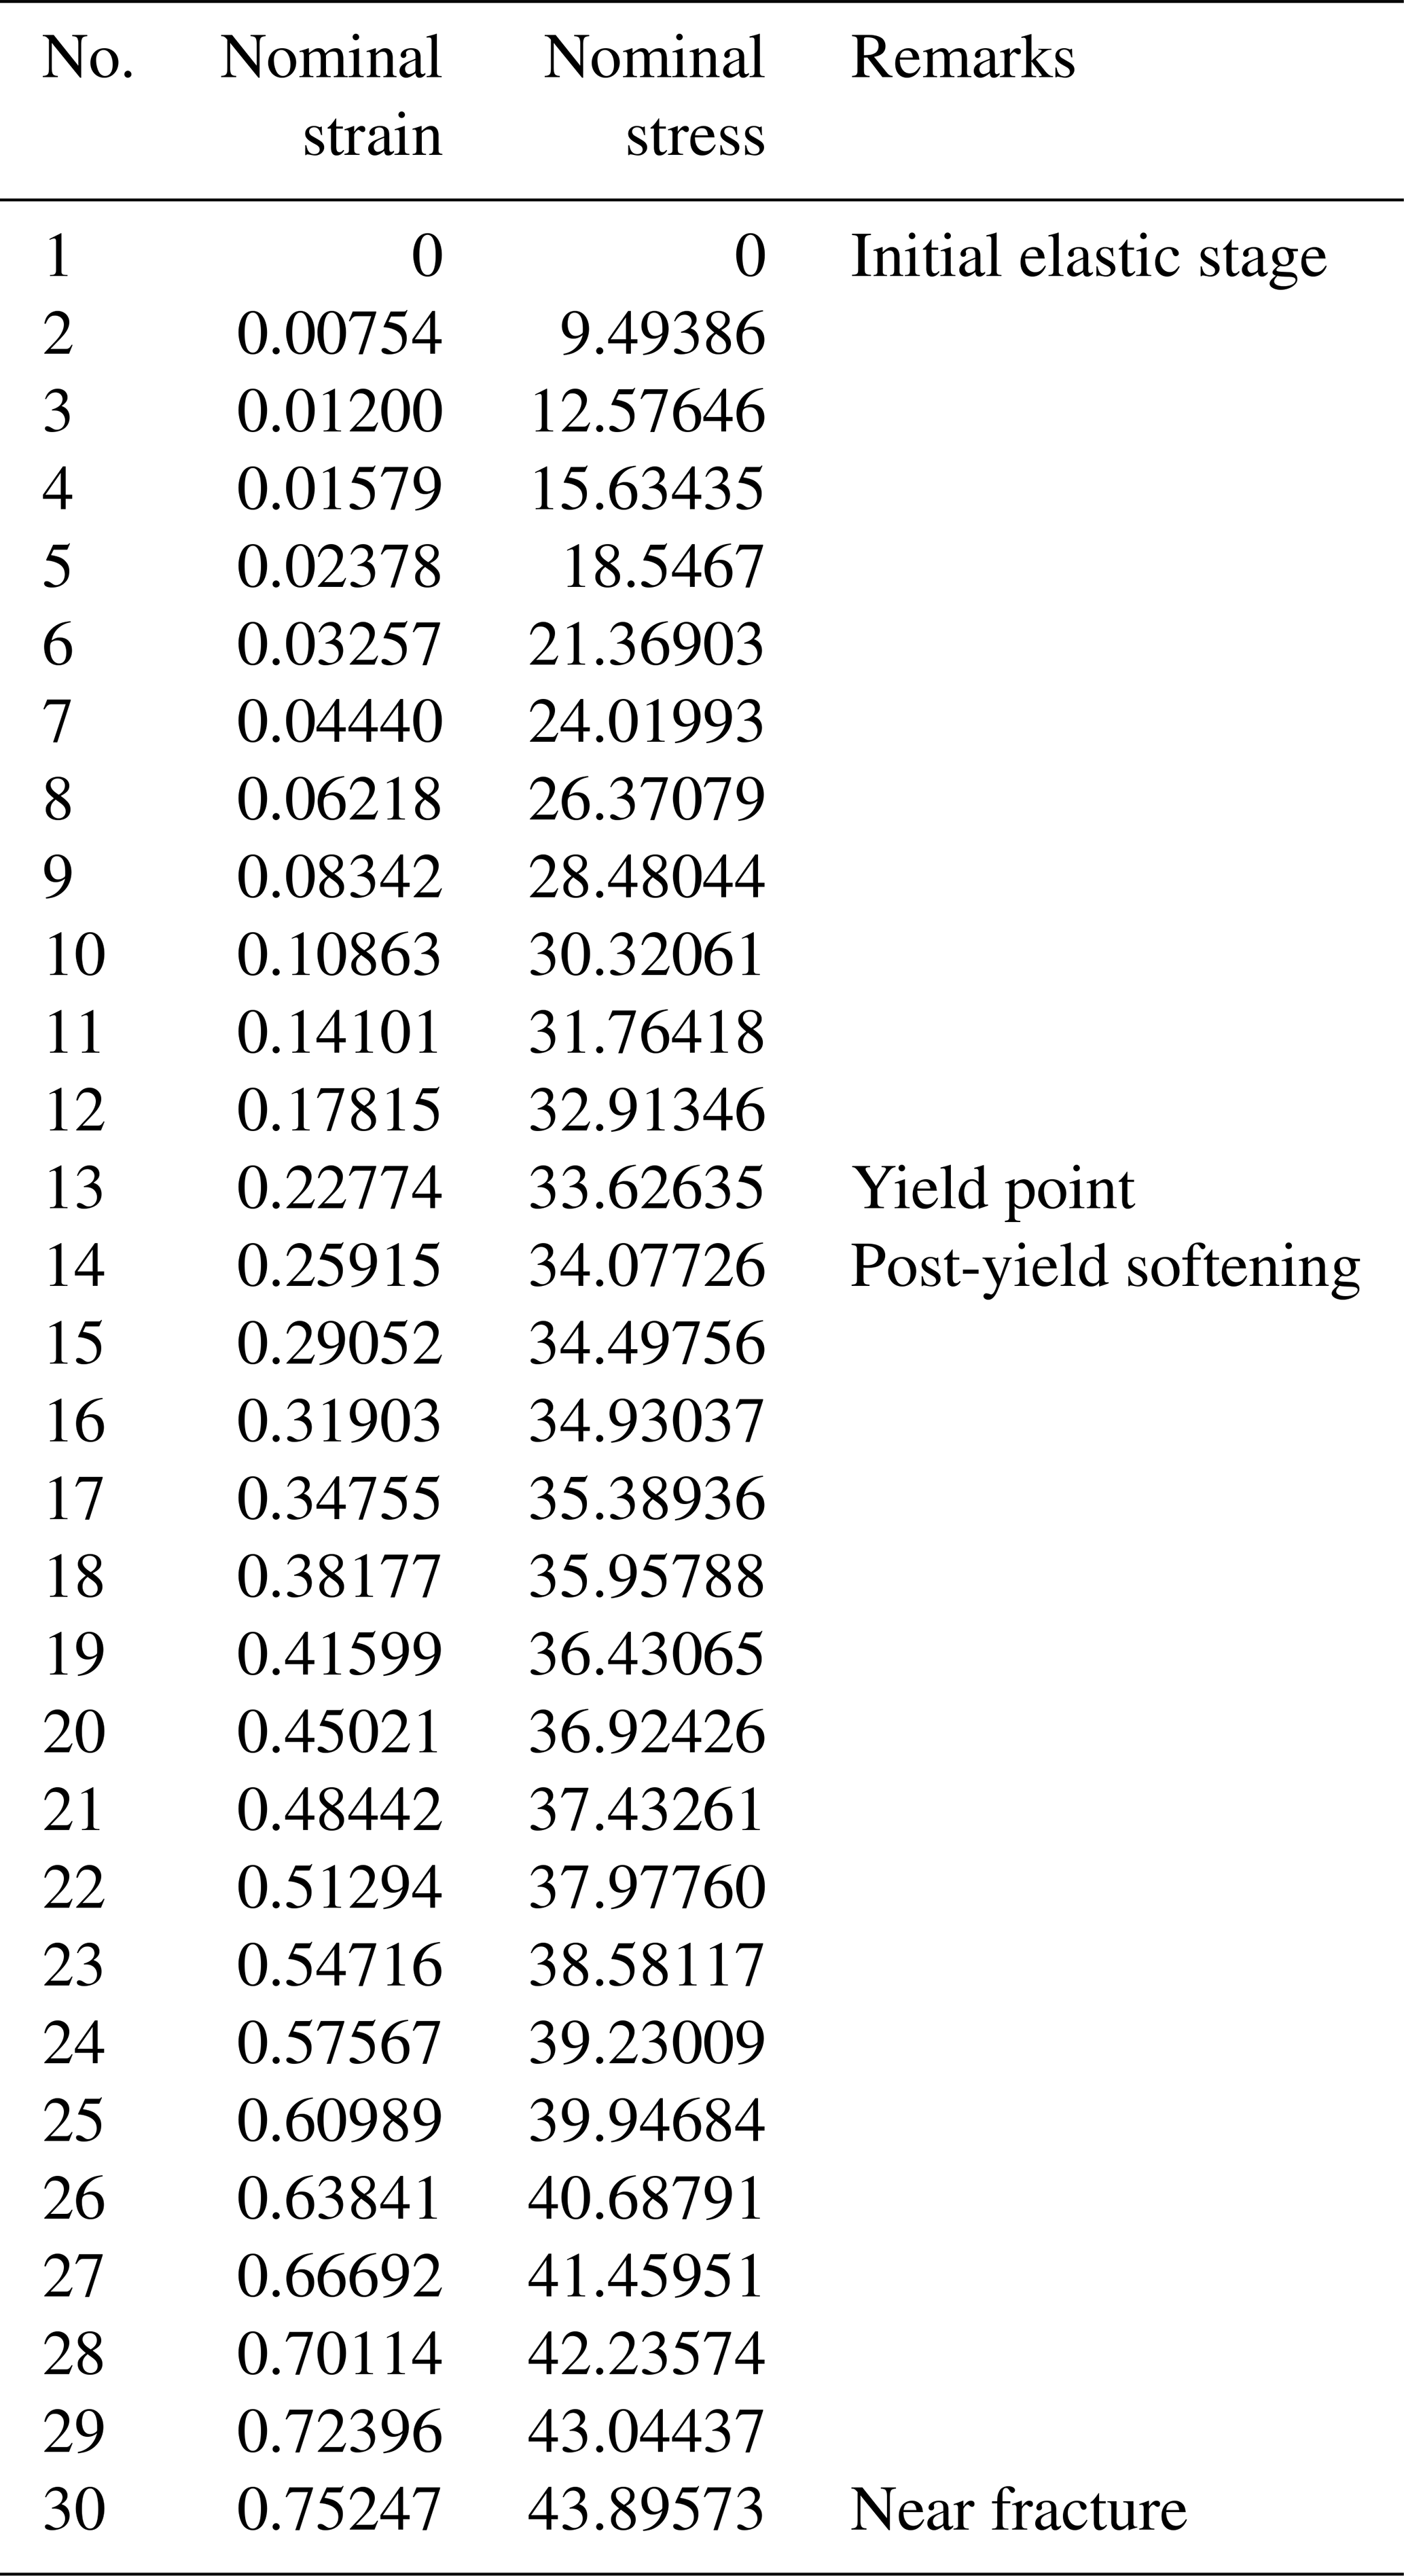
To investigate the influence of design parameters on stability during the bending and torsion process, three independent parameters, r, α, and t2, are systematically varied on the premise that ° and remain unchanged according to the actual conditions of blow-moulded formation. The outer radius R of the circular tube is maintained at 14.50 mm to ensure broad applicability of the coupling. Finite-element models of the SBCTC units were built and analysed using the static/implicit commercial software package ABAQUS/Standard. PP is adopted here as the material for the SBCTC unit, with the following material properties: density ρ = 897 kg m−3, Young's modulus E = 1.32 GPa, Poisson's ratio ν = 0.42, yield stress σY = 33 MPa, and yield tensile elongation εY = 0.23, and detailed strain–stress data are also provided in Appendix A. The material was modelled as hyperelastic using the Marlow strain energy function, calibrated against our experimental stress–strain data. The SBCTC unit was meshed using S4R elements with an average mesh size of 0.25 mm, while additional refinement was applied to the hinge-like regions, as shown in Fig. 2a. Convergence tests in terms of mesh density and analysis time were also conducted, from which an analysis time of 1.0 s was determined to be suitable and adopted in the analysis.
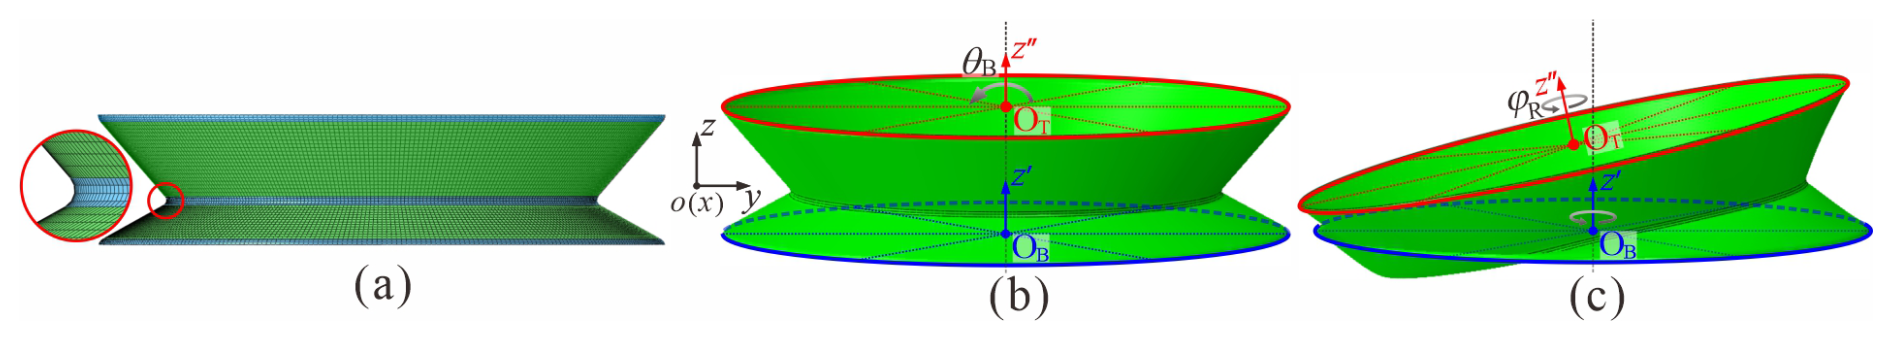
Figure 2Numerical models of (a) the meshed SBCTC unit with a refined mesh at the hinge-like region marked in blue, (b) the SBCTC unit for bending, and (c) the SBCTC unit for torsion.
Then, kinematic coupling constraints rigidly link all 6 degrees of freedom (DOFs) of the bottom-rim node set (marked in blue) to the circle centre OB, which was fully fixed in space, while the top-rim node set, marked in red, was also rigidly coupled to the circle centre OT, enabling a θB unidirectional rotation about the x axis by constraining rotation about the y and z axes, which allowed the straw to bend into its stable state, as shown in Fig. 2b. During the torsion process, the constraint of the bottom coupling point OB was released, which allowed the free in-plane rotation of the bottom rim about the z′ axis. Meanwhile, the top coupling point OT was configured for a φR unidirectional rotation about the z′′ axis in Fig. 2c. Self-contact was employed to model the contact among different parts of the SBCTC unit. Friction was taken into consideration, and the friction coefficient was taken as 0.44. The strain energy and responsive moment during deformation were both extracted and recorded.
3.1 Bending process of the SBCTC unit
The deformation process of the SBCTC unit with corresponding logarithmic strain (LE) contour maps is presented in Fig. 3a. During bending, the overall deformation of the unit predominantly occurs in the inverted region of the bottom frustum, while the upper frustum exhibits relatively minor deformation (ε<0.024). Although noticeable local deformation also occurs at the hinge-like regions connecting adjacent frustums, its contribution to the total strain energy remains below 3.64 %. Therefore, we focus solely on the behaviour of the bottom frustum in the following analysis, neglecting the influence of the hinge-like region and the upper frustum.
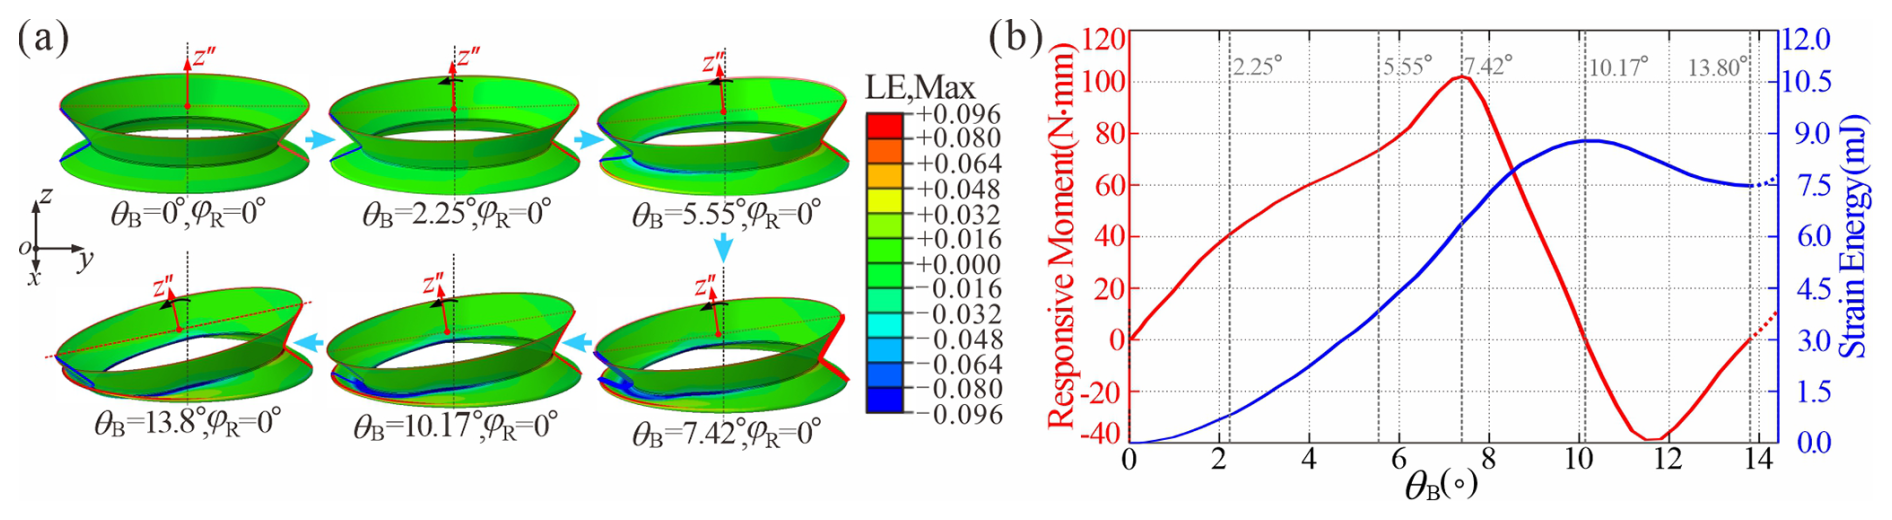
Figure 3(a) Numerical deformation process of the SBCTC unit and (b) numerical strain energy and responsive moment versus bending angle θB during bending.
Furthermore, the responsive moment and strain energy versus bending angle θB in Fig. 3b both exhibit typical “N”-shaped curves, indicating the bistability of the structure. The points where the moment is zero and the strain energy reaches its extreme correspond to the stable extended state and bent state, with θBS reaching 13.80° for an SBCTC unit with parameters r = 11.0 mm, α = 30°, and t2 = 0.30 mm, consistent with the measured geometry of the toy pop glow tube. The distinct plateau values observed at the peak and trough points in the torque–angle curve are primarily attributed to the asymmetric deformation of the bistable structure. Meanwhile, the SBCTC unit maintains purely elastic deformation during bending, with peak strain (εMAX = 0.176) lower than the yield threshold εY = 0.23.
3.2 Bending process of the bottom frustum
To further conduct morphological characterisation of the partially inverted bottom frustum, a cylindrical coordinate system is set here with its original point OB, where the global x and z axes correspond to the radial ρ and z′ directions of the cylindrical system, respectively, and the circumferential φ direction is determined by the right-hand rule. The cross-sectional contour is marked with a compressed blue generator AB (φ = 180°) and stretched red generator CD (φ = 0°). Here, the geometric configuration can be characterised by the generalised radial curvature κr and circumferential curvature κθ of any point P on the deformed bottom frustum, as shown in Fig. 4.
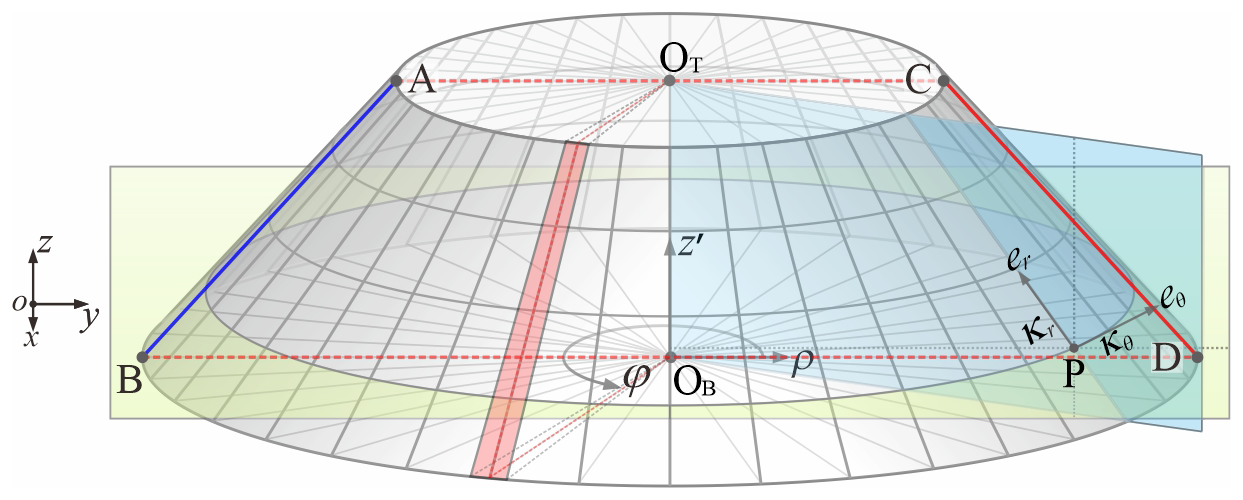
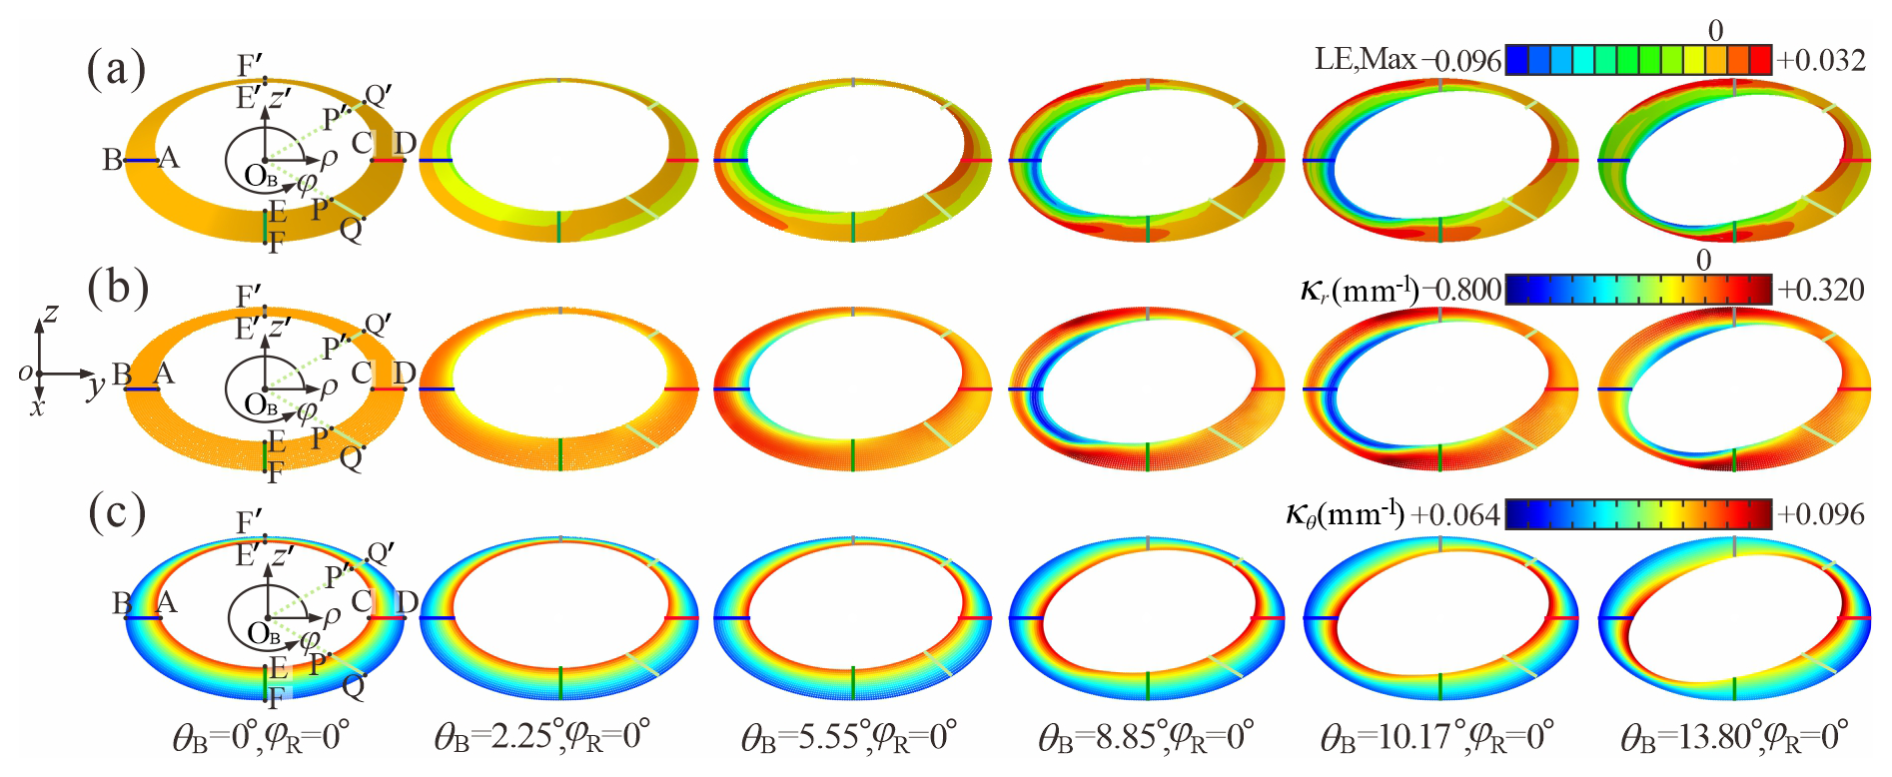
Figure 5(a) Numerical deformation process of the bottom frustum during bending and (b–c) the contour map of (b) the radial curvature κr and (c) the circumferential curvature calculated from the numerical results.
Following this, the spatial coordinates of the partially inverted bottom frustum during bending were extracted along both the radial and the circumferential directions, er and eθ. Polynomial curve fitting was performed using the MATLAB Curve Fitting Toolbox (R2 > 0.98) to calculate the corresponding curvatures κr and κθ (Fig. 5b–c), in comparison with logarithmic strain (LE) contour maps, as illustrated in Fig. 5a. To further elucidate its mechanism, the circumferential distribution of radial strain energy was analysed by integrating the strain energy of a random set of elements distributed along generators (marked in pale red in Fig. 4) and plotting the corresponding angular energy density distribution along the circumferential angle φ during bending, as shown in Fig. 6. Additionally, the deformation process of the blue generator AB and the red generator CD in the cross-section is illustrated in Fig. 7.
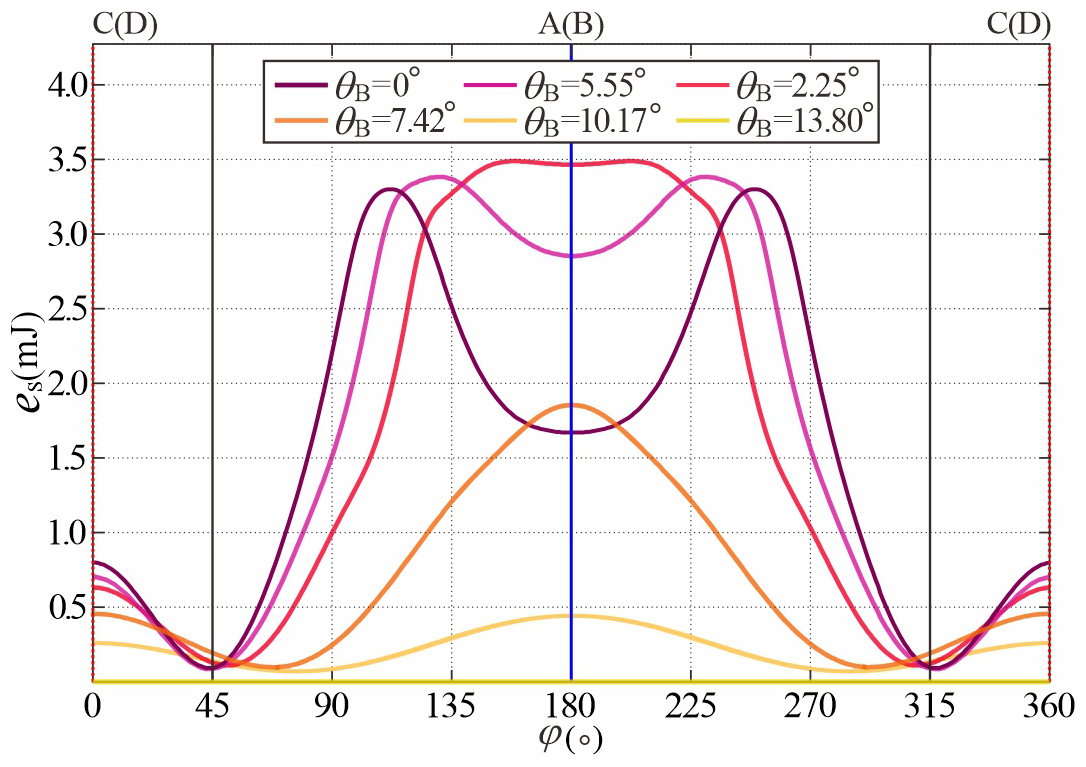
Figure 6Angular energy density distribution eS versus circumferential angle φ during bending.
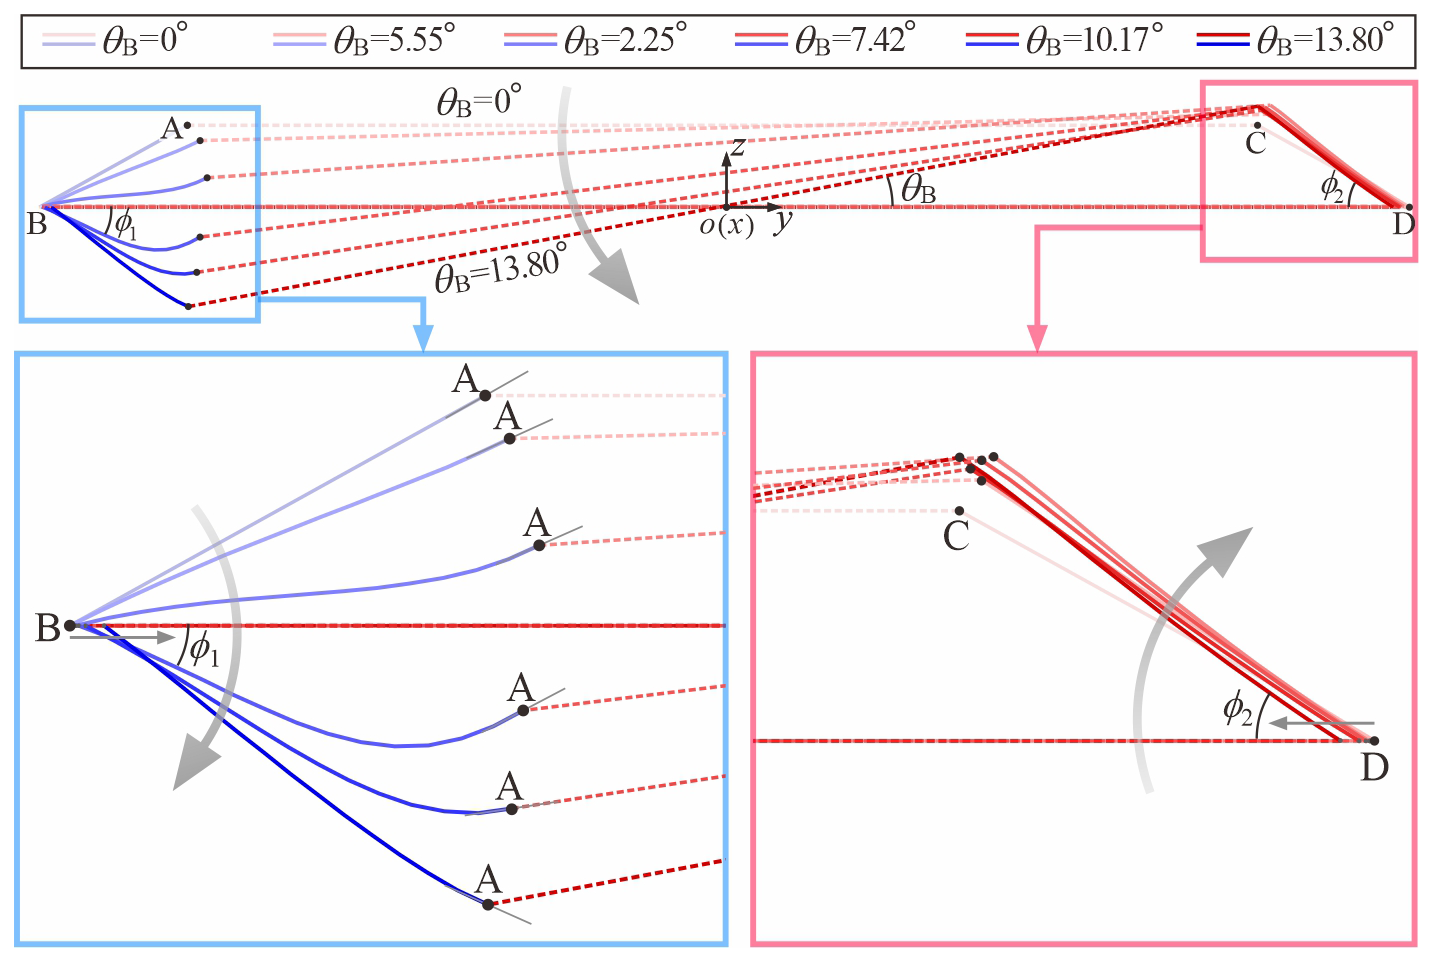
Figure 7Deformation process of the blue generator AB and the red generator CD during bending.
The contour maps in Fig. 5a and b reveal highly consistent colour distributions with a ratio of about half the thickness , which indicates that surface deformation is primarily induced by changes in radial curvature κr. Initially, the inner zone of the blue generator AB, starting from point A, develops a negative curvature κr with reverse material bending, while κr remains positive in other regions. At this stage, the energy density eS of generator AB (φ = 180°) surpasses all other regions, as illustrated in Fig. 6. Meanwhile, the circumferential flow of the material causes the stretching angle ϕ2 between BD and CD to rapidly increase in this stage and quickly reach its stable position, after which the angle remains constant during bending, as shown in Fig. 7. Then, the negative curvature zone expands radially and circumstantially from point A with intensified reverse bending. Meanwhile, material adjacent to the reverse bending region is compressed and flows in circumferential and radial directions, causing a remarkable increase in positive κr on the compressive side, while positive κr on the tensile side around generator CD remains unchanged. Once the bending angle θB reaches 8.85°, the circumferential energy density eS attains its peak value of 3.52 mJ at generator AB (φ = 180°) during the entire bending process, corresponding to the curvature trough κr = 0.7655 mm−1 in Fig. 6, which can be referred to as “the local maximum energy state”. During advanced bending stages, the region of negative κr exhibits simultaneous radial contraction and circumferential expansion, accompanied by the decreasing absolute κr. At this stage, the continuous circumferential flow of the nearby material causes further bending deformation in the region of positive κr. The phenomenon is echoed by the energy distribution in Fig. 6, which demonstrates that while eS at generator AB (φ = 180°) declines, the spatial extent of the high-energy zone widens, resulting in an overall energy peak for the entire bottom frustum at θB of 10.17°. It should be particularly noted that the tangent line at point B of generator AB in Fig. 7 completely coincides with line AC. As the subsequent bending deforms towards a stable state at θBS of 13.80°, the majority of the compressive region becomes flat, in which negative κr only exists in a narrow region near the inner diameter. Meanwhile, the region of high positive κr continuously migrates towards the mid-circumferential position. It can also be inferred that at the transitional junction between the compressive and tensile radiation zones, there will be a transition region where the curvature approaches zero. In Fig. 6, the energy density eS around φ = 45 and 315° remains the lowest throughout the entire bending process, which exactly corresponds to this transition region. Moreover, the generators PQ (φ = 315°) and P′Q′ (φ = 45°), marked in green in Fig. 5b, also maintain the near-zero curvature during the whole bending process, further validating this conclusion.
Figure 5c shows that the circumferential curvature κθ is distributed symmetrically in both the left–right and the top–bottom directions during bending. Thus, we only need to focus on one-quarter of the bottom frustum (section ABEF). Throughout the initial bending process with θB from 0 to 5.55°, the curvature κθ of both the top and the bottom rims remains constant, consistently maintaining its initial circular geometry. In the subsequent deformation process, the curvature κθ decreases gradually from point A to point E at the top rim, whereas κθ increases progressively from point B to point F at the bottom rim. This is because material flows circumstantially from region AB towards the mid-circumferential position on both sides, resulting in compression along the EE′ direction at the top rim and simultaneous tension along the FF′ direction at the bottom rim. Conversely, in the perpendicular direction, the top rim is stretched in the AC direction, while the bottom rim is compressed in the BD direction. As shown in the enlarged figure in Fig. 7, the distance between points B and D becomes shorter.
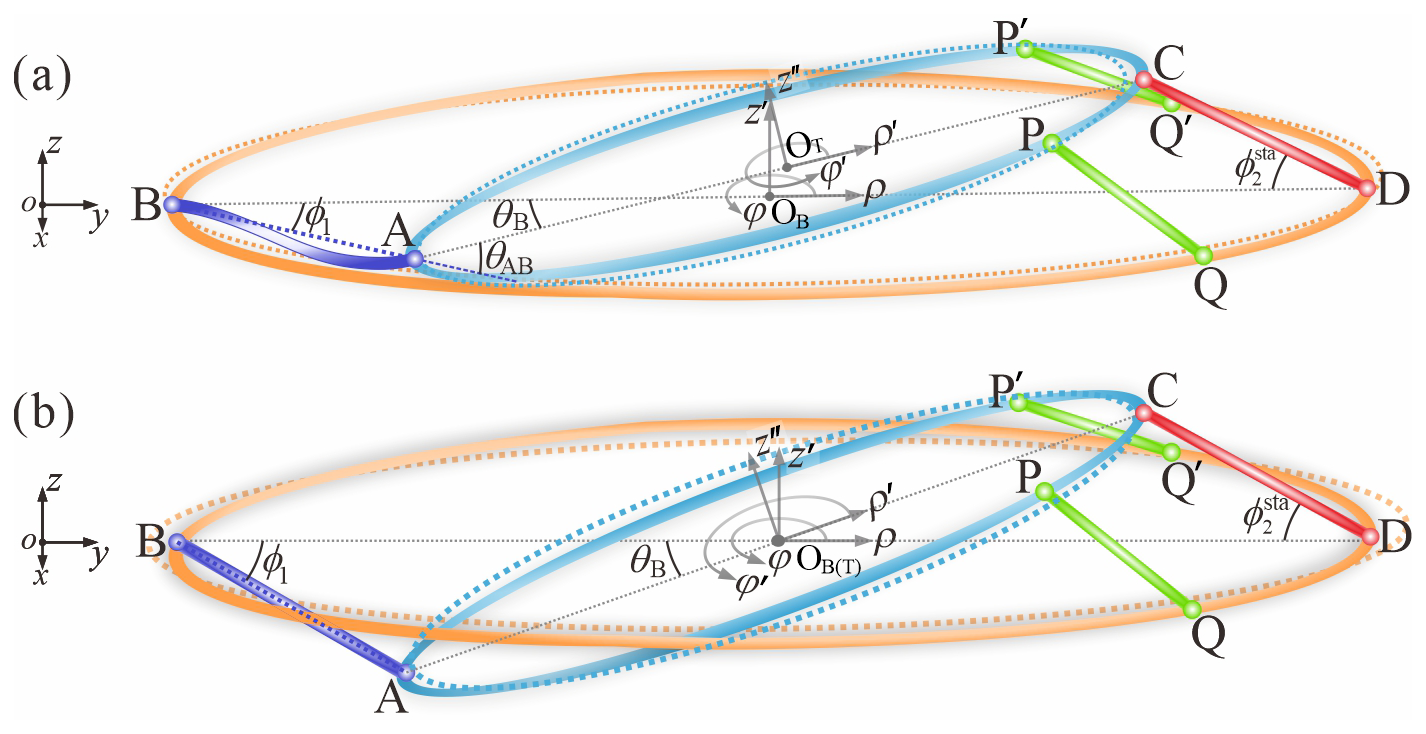
Figure 8A simplified beam model for the bottom frustum (a) containing maximum strain energy during bending and (b) at the stable bent state.
3.3 A simplified beam model based on geometric characteristics
Based on the aforementioned underlying mechanism of the bending process, we establish a simplified beam model from the geometric perspective, as shown in Fig. 8a. During the entire deformation process, the lengths of all generators remain unchanged, as bending dominates the mechanical response. Their original length l0 can be derived as follows.
Specifically, we assume that the beams CD (φ = 0°), PQ (φ = 45°), and P′Q′ (φ = 315°) consistently maintain a nearly zero curvature while remaining perfectly straight; i.e.
Meanwhile, beam AB exhibits a typical bistable response. Starting from its initial straight state, it bends under compressive buckling, with curvature κr reaching a peak at “the local maximum energy state”. It then returns to a near-zero curvature state in the steady-state phase, returning to a straight line. According to Fig. 5c, elliptical equations are employed to fit the top and bottom rims, whose foci are located on segments AC and FF′, respectively. And the major axis of the top elliptical edge is AC, while the minor axis of the bottom elliptical edge is BD. The original semi-axis of the circular top and bottom rims is then
Based on numerical results, we assume that the elongation Δl of beam AC on the top rim roughly matches the contraction Δl of beam BD on the bottom rim during bending, corresponding to the changed and . Due to energy minimisation, the rims are more likely to bend rather than to stretch, which keeps the lengths of the top and bottom rims nearly constant. Thus, bT and aB can be derived according to Ramanujan's approximation formula:
The top and bottom elliptical rims are then both expressed in cylindrical coordinates OT () and OB (), respectively, where :
Substituting PQ (φ = 45°) and P′Q′ (φ = 315°) into Eq. (5), the radial coordinates of points P, P′, Q, and Q′ can, respectively, be derived as
We obtained points P (), P′ (), Q (), and Q () in cylindrical coordinates OT and OB, respectively. The geometric constraints of the four-bar linkage are then applied here to transform them into the global Cartesian coordinate system oxyz, whose origin o coincides with point OB.
First, we define ϕ2 as the included angle between beams AB and BD. It should be noted that angle ϕ2 nearly reaches its stable position during the initial bending stage in Fig. 7. The system is simplified to a planar four-bar linkage mechanism for analysis. The limited angle is calculated in Eq. (7), when beam CD reaches the forward dead centre (FDC) with collinear beam AC and beam AB.
Through massive numerical analysis, the fitted relationship between the initial angle α, the limit angle , and the inner and outer radii r and R can be mathematically derived as follows, where kϕ equals 0.01306.
At this point, the included angle ϕ1 between beams AB and BD and the theoretical bending angle θB can also be obtained with the undetermined length lAB.
Now, the transformation relationships between the two cylindrical coordinate systems, OB () and OT (), and the global Cartesian coordinate system, oxyz, can be expressed as follows:
Substituting coordinates of P (), P′ (), Q (), and Q () into Eq. (10), lPQ and can be obtained and satisfy the boundary condition in Eq. (5).
Here, we observe that on the left-hand side of Eq. (12), parameters ρQ and depend solely on the unknown parameter Δl. The other parameters, θB, yT, and zT, are related to unknown parameters Δl and lAB, according to Eqs. (10)–(11). Our analysis in Sect. 3.2 has illustrated that beam AB experiences compression during bending. While its beam length sAB remains constant at original l0, the distance lAB shortens significantly. This small-strain, large-deformation characteristic can be expressed by the following generalised elastica-similarity equation in Eq. (13) to fit the curved beam AB:
In the original formulation, F and M characterise the end force and moment, whereas they are treated as undetermined coefficients during parameter optimisation. The boundary conditions of the endpoints A and B also need to be satisfied:
For beam AB, three parameters in Eqs. (13)–(14), F, M, and θ0, need to be determined, requiring three extra conditions. The maximum curvature at θ = 90° can also be fitted here with the inner and outer radii r and R and slant angle α, where α equals 0.01306.
When the bottom frustum reaches the peak of its overall strain energy, the maximum curvature of beam AB occurs close to point A; hence θ0 equals 90°. Additionally, the line segment AC is tangent to the curved beam AB at point B, as shown in Fig. 8a. We define the angle θAB between line AB and the tangent line at point A. The boundary condition can be derived as
Now, the three independent conditions in Eqs. (15)–(16) are sufficient to uniquely define the geometry of beam AB. By substituting the derived distance lAB into Eqs. (10)–(12), we can completely reconstruct the beam model and calculate the bending angle when the bottom frustum reaches its maximum strain energy. Considering a typical SBCTC unit with the following geometric parameter, r = 11 mm, α = 30°, and t2 = 0.30 mm, Fig. 9 illustrates good agreement between our beam model in solid blue lines with the corresponding numerical cross-sectional profiles in dotted blue lines. The fitted result here is 9.87° in comparison to the numerical of 10.17°, thereby validating the accuracy of our beam model.
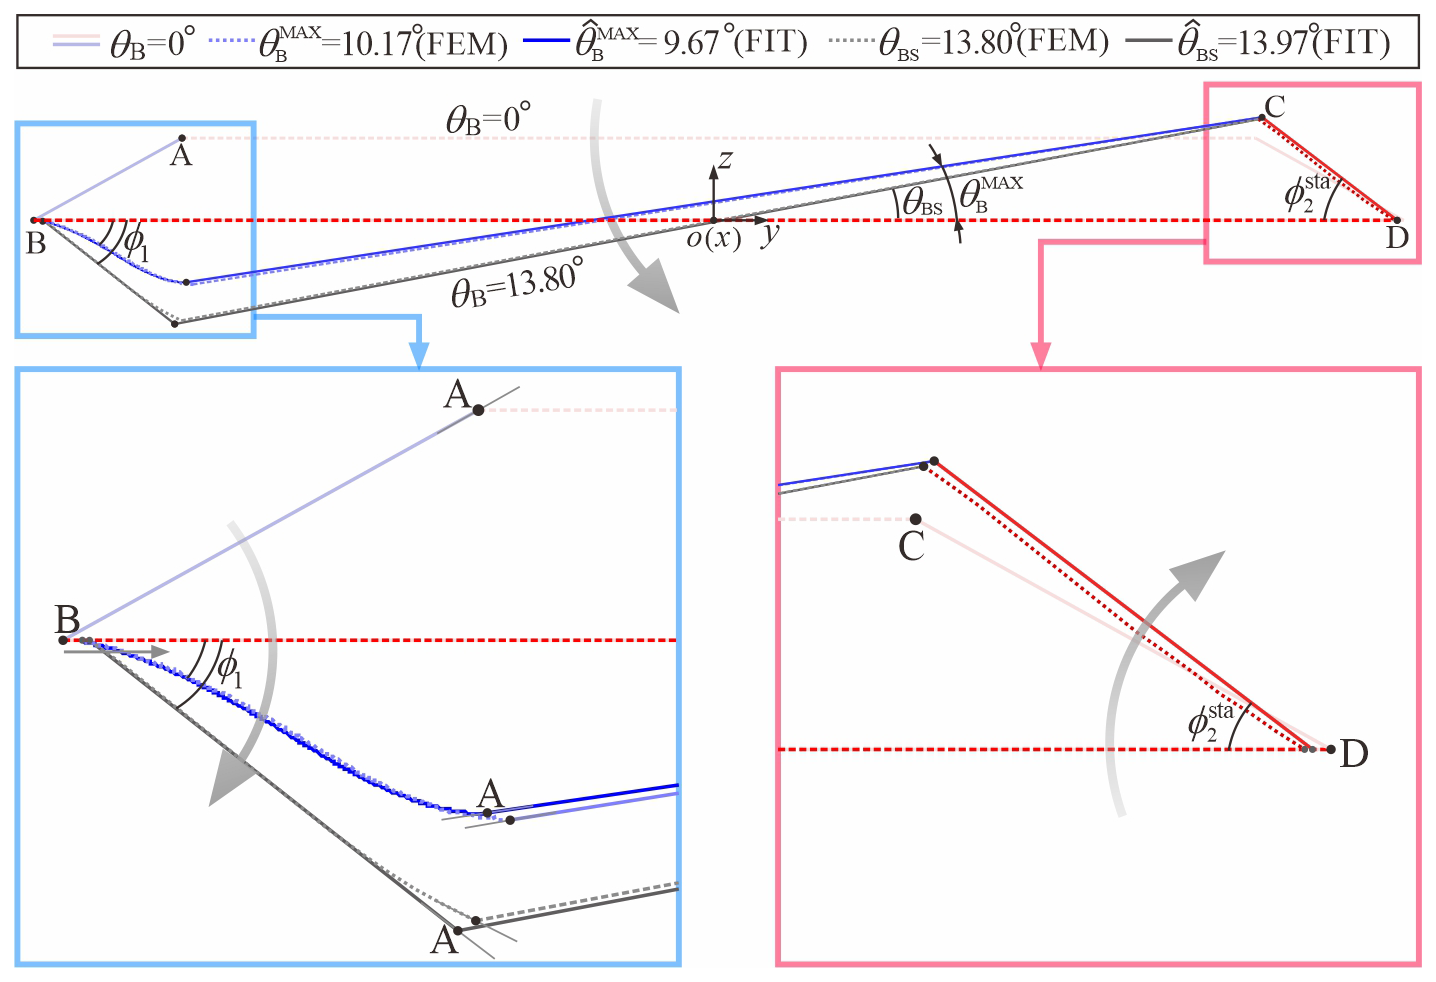
Figure 9Cross-sectional comparison of the numerical results in dotted lines and the beam model results in solid lines. The blue line represents the maximum strain energy state, while the black line represents the stable bent state.
Furthermore, when the bottom frustum achieves its stable bent state, beam AB straightens, and the distance lAB returns to its original length l0, as shown in Fig. 8b. Thus we can derive Δl by solving Eq. (11), and the fitted bending angle θBS in the stable state can be obtained through Eq. (10). Considering a typical SBCTC unit with the same geometric parameters as above, the calculation yields an elongation Δl of 0.394 mm and of 13.97°, showing minimal deviation from the finite-element analysis results (Δl = 0.401 mm, θBS = 13.80°). This agreement is further validated by the almost-identical numerical and fitted profiles (dotted versus solid black lines) in Fig. 9, confirming the reliability and precision of our simplified beam model.
3.4 Effects of geometric parameters on the bending stability
Having investigated the underlying mechanism of the SBCTC unit during the bistable behaviour, the effects of three design parameters (α, r, and t2) are further studied in this section to fulfil the task of programmability. A total of 60 models, with slant angle α varying from 12 to 30° at an interval of 3°, inner radius r from 6.625 to 12.75 mm at an interval of 0.875 mm, and fixed thickness t2 from 0.24 to 0.36 mm at an interval of 0.03 mm, are analysed numerically, whose ranges align with the actual conditions of blow-moulding production for plastic tubular structures (Lee, 2006). The geometric parameters of the models are listed in Table 1, in which the notation α-r-t2 is adopted.
Table 1Bending stability for the SBCTCs with different geometric parameters.
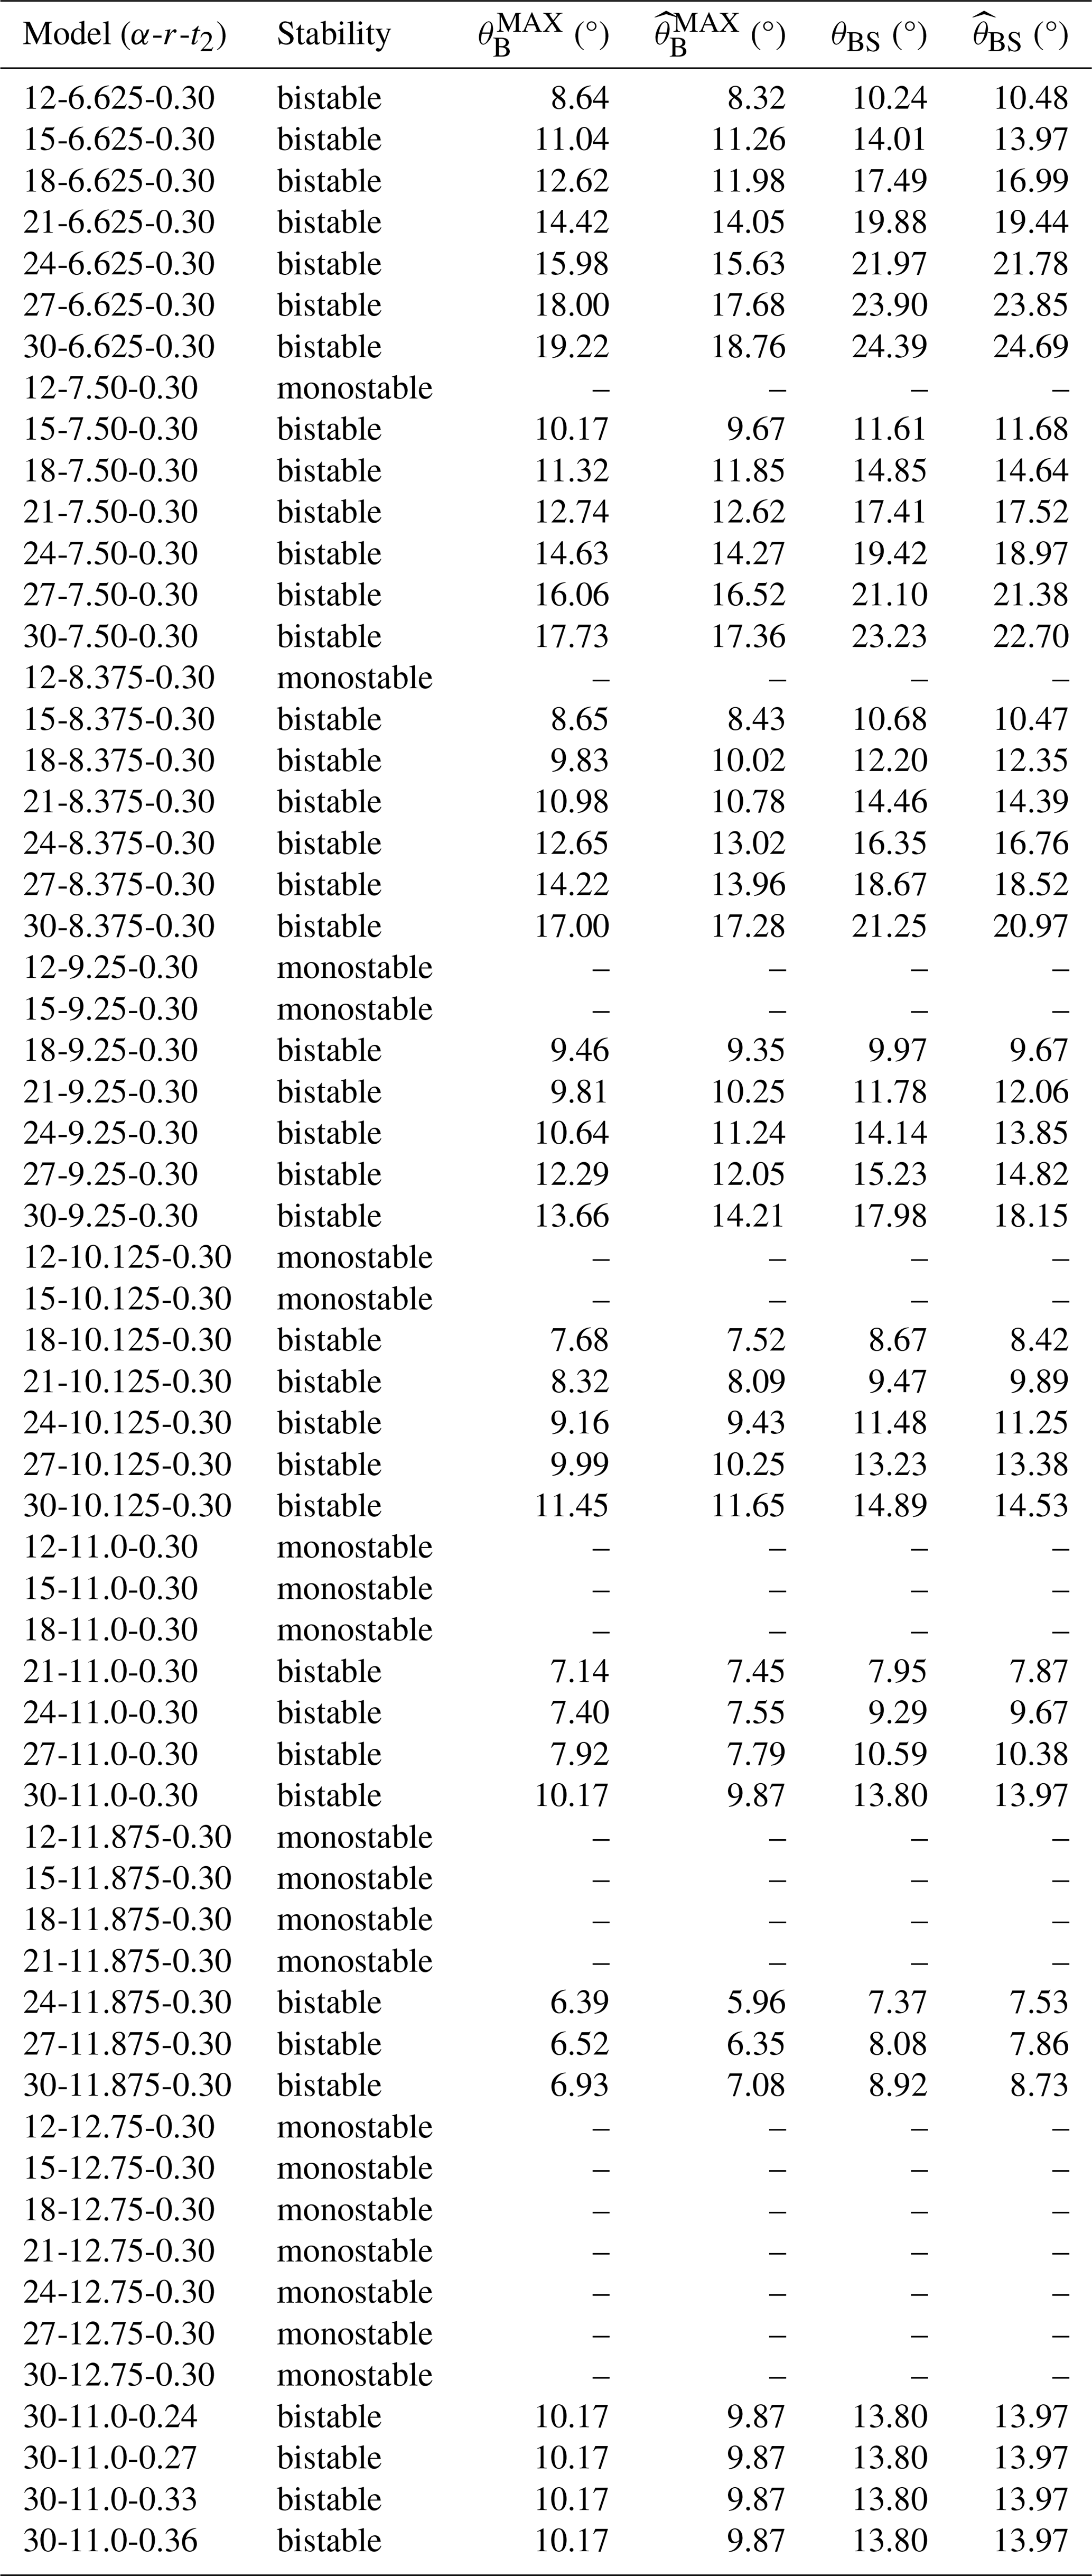
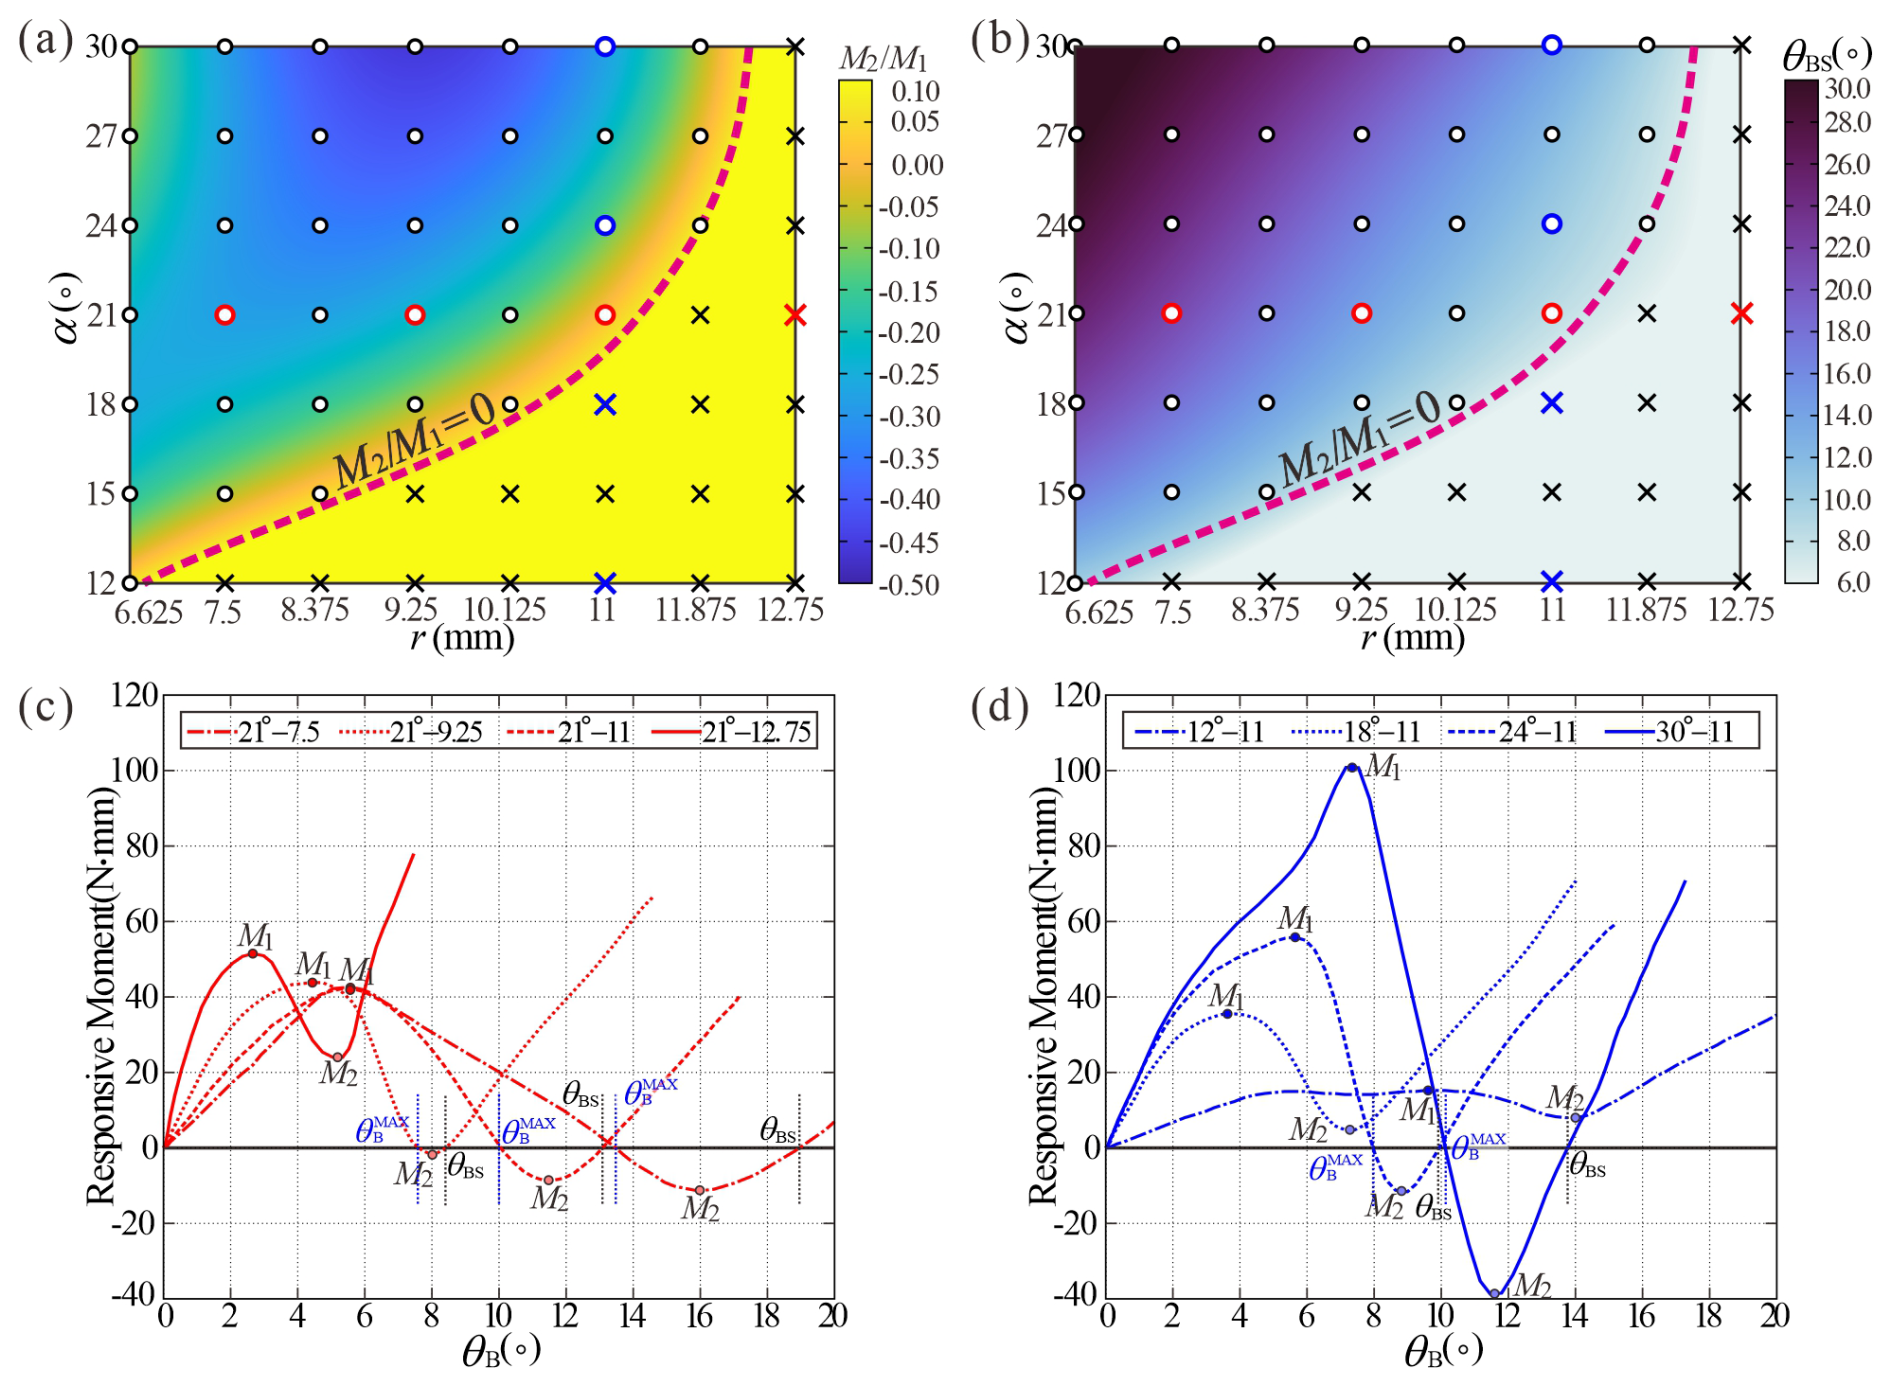
Figure 10The bistability of the SBCTC unit with fixed thickness t2 = 0.30 mm. (a) A phase map showing the outcomes of bistability from numerical analysis across various α and r values. (b) A phase map showing the stable angle θBS from numerical analysis across various α and r values. (c) Characteristic moment–angle curves for SBCTC units with identical α that distinguish between bistable and monostable behaviour. (d) Characteristic moment–angle curves for SBCTC units with identical r that distinguish between bistable and monostable behaviour.
First, consider the effect of inner diameter r and slant angle α while fixing the thickness t2 of 0.30 mm. The phase map in Fig. 10a outlines the bistability conditions of an SBCTC unit derived from numerical analysis, which identifies two distinct regions: bistable and monostable. Local maximum (M1) and minimum (M2) moments occur at two inflection points, as shown in Fig. 8c. The ratio is used to evaluate their bending stability and classify the parameter ranges into bistable ( < 0) and monostable ( > 0) categories, with boundary lines at = 1. Generally, higher α values and smaller r values both increase the likelihood of bistability in the SBCTC unit. However, when r is too small, the significant increase in the bending angle θBS leads to a slower bistable transition rate, reducing the absolute values of both M1 and M2. As a result, the ratio decreases slightly, as seen in the upper-left region, but the unit still maintains its bistable state.
The contour map in Fig. 10b demonstrates that increasing the slant angle α or decreasing the inner radius r significantly enhances the bending angle θBS of the stable state, with excellent agreement (error < 2.35 %, Table 1) with predicted from the beam model. A set of typical parameters was selected based on the slant angle α and the inner radius r, respectively, with the corresponding points of these parameters marked in blue and red in Fig. 10a and b. The moment-deformation curves corresponding to models with the same slant angle α are marked in red (Fig. 10c), while those corresponding to models with the same inner radius r are marked in blue (Fig. 10d). Regardless of specific values, all curves exhibit a typical “N”-shaped profile. Specifically, with constant angle α, reducing the inner diameter r simultaneously increases both the magnitude of M2 and the stable angle θBS, while at fixed inner diameters r, increasing the slant angle α increases the stable angle θBS with the lower M2 value. In contrast, the angle at which the maximum strain energy occurs follows the same trend as θBS, with obtained from the beam model shown in Table 1, exhibiting a deviation of 3.29 % from the numerical results, further validating the accuracy of the beam model. These systematic variations confirm that enhanced geometric incompatibility is the key factor governing the mechanical behaviour of SBCTC units.
The phase map in Fig. 10a outlines the bistability conditions of an SBCTC unit derived from numerical analysis, which identifies two distinct regions: bistable and monostable. Local maximum (M1) and minimum (M2) moments occur at two inflection points, as shown in Fig. 8c. The ratio is used to evaluate their bending stability and classify the parameter ranges into bistable ( < 0) and monostable ( > 0) categories, with boundary lines at = 0. Generally, higher α values and smaller r values both increase the likelihood of bistability in the SBCTC unit. However, when r is too small, the significant increase in the bending angle θBS leads to a slower bistable transition rate, reducing the absolute values of both M1 and M2. As a result, the ratio decreases slightly, as seen in the upper-left region, but the unit still maintains its bistable state.
Furthermore, when α and r are obtained to achieve a bistable SBCTC unit, the maximum and minimum moments M1 and M2 are both found to increase approximately linearly with the cubic power of shell thickness t2 lower than 0.33 mm, which is clearly shown in Fig. 11. Moreover, here θBS also remains consistent. The reason for this is that bending strain energy dominates during the deformation of the SBCTC unit, which causes the total strain energy to exhibit an approximately cubic relationship with t2. When the thickness t2 increases to 0.33 mm, the bottom and top frustums touch prematurely before the unit reaches the bending angle θBS, causing both the maximum moment M1 and the minimum moment M2 to decrease in magnitude, which is lower than the predicted cubic relationship.
According to the parametric analysis, designing a desired torque coupling with a fixed outer radius R can be carried out in the following three steps: (1) divide the required transmission angle to determine a suitable stable angle θBS between 10 and 30° for a single SBCTC unit; (2) derive feasible pairs of the slant angle α and inner radius r that satisfy the bent angle θBS and the bistable conditions in reverse, with preference for larger α and smaller r; and (3) increase thickness t2 appropriately while keeping θBS constant, ultimately enhancing bistable behaviour by minimising the ratio and M2. Our theoretical model is subject to specific boundaries and limitations and only applies to bistable models within our defined geometric parameter range. In particular, the frustum thickness must not exceed a critical value to ensure the structure reaches its bistable position. Moreover, the PP material should always remain within its elastic range during motion.
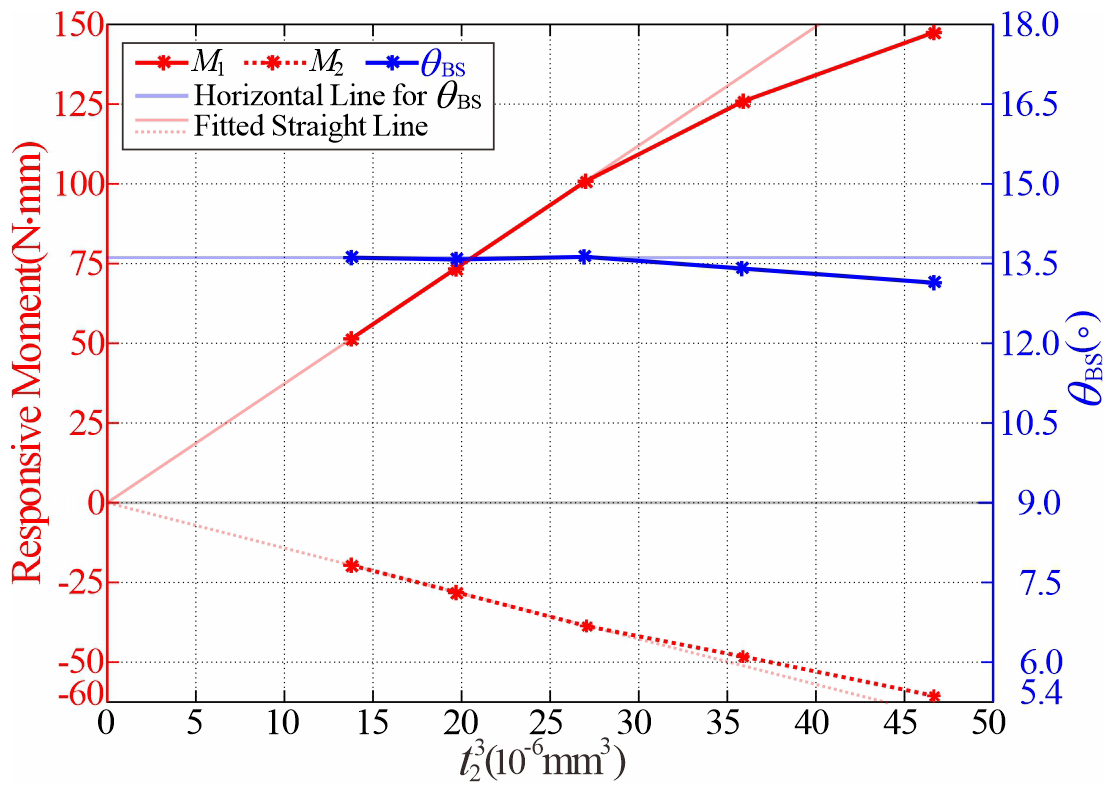
Figure 11Relationship between maximum moment, minimum moment, and stable angle θBS versus the cubic power of shell thickness t2 for models with α = 30°; r = 11 mm; and t2 = 0.24, 0.27, 0.30, 0.33, and 0.36 mm.
4.1 Torsion process of the SBCTC unit
In the previous sections, we systematically investigated the bending stability of the SBCTC unit. A numerical analysis of the torsion process was conducted following the numerical setup in Sect. 2.2, and the resulting corresponding LE contour maps, strain energy, and responsive moment versus twisting angle φR during torsion are presented in Fig. 12b. It can be observed that during a complete 360° anticlockwise torsion cycle (TR), the SBCTC unit maintains a constant strain energy and zero responsive moment, thereby achieving typical neutral stability.
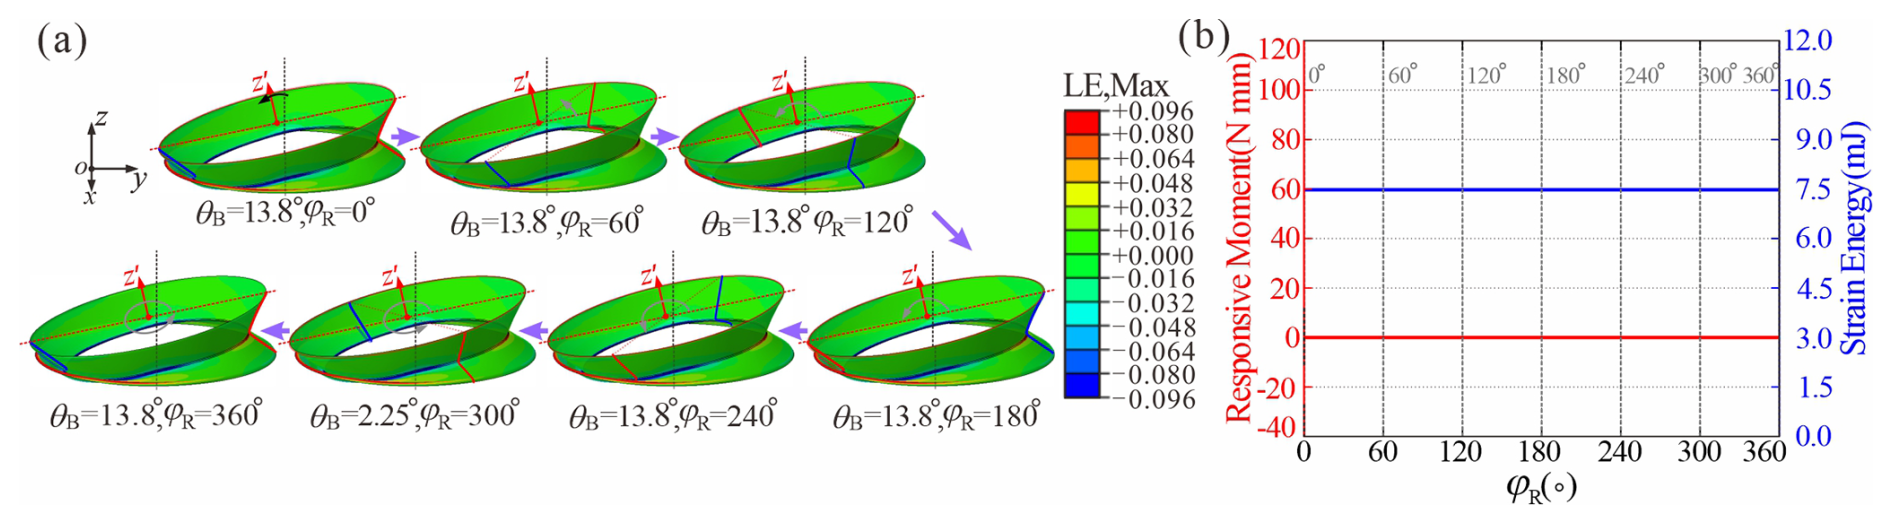
Figure 12(a) Numerical deformation process of the SBCTC unit and (b) numerical strain energy and responsive moment versus twisting angle φR of the bellow.
4.2 Torsion process of the bottom frustum
Consistent with the bending process, we also focus on the deformation of the bottom frustum during torsion. Figure 13 illustrates logarithmic strain (LE) contour maps during torsion, where the strain distribution remains nearly constant throughout the torsion process and aligns with the distribution of the bent bottom frustum.
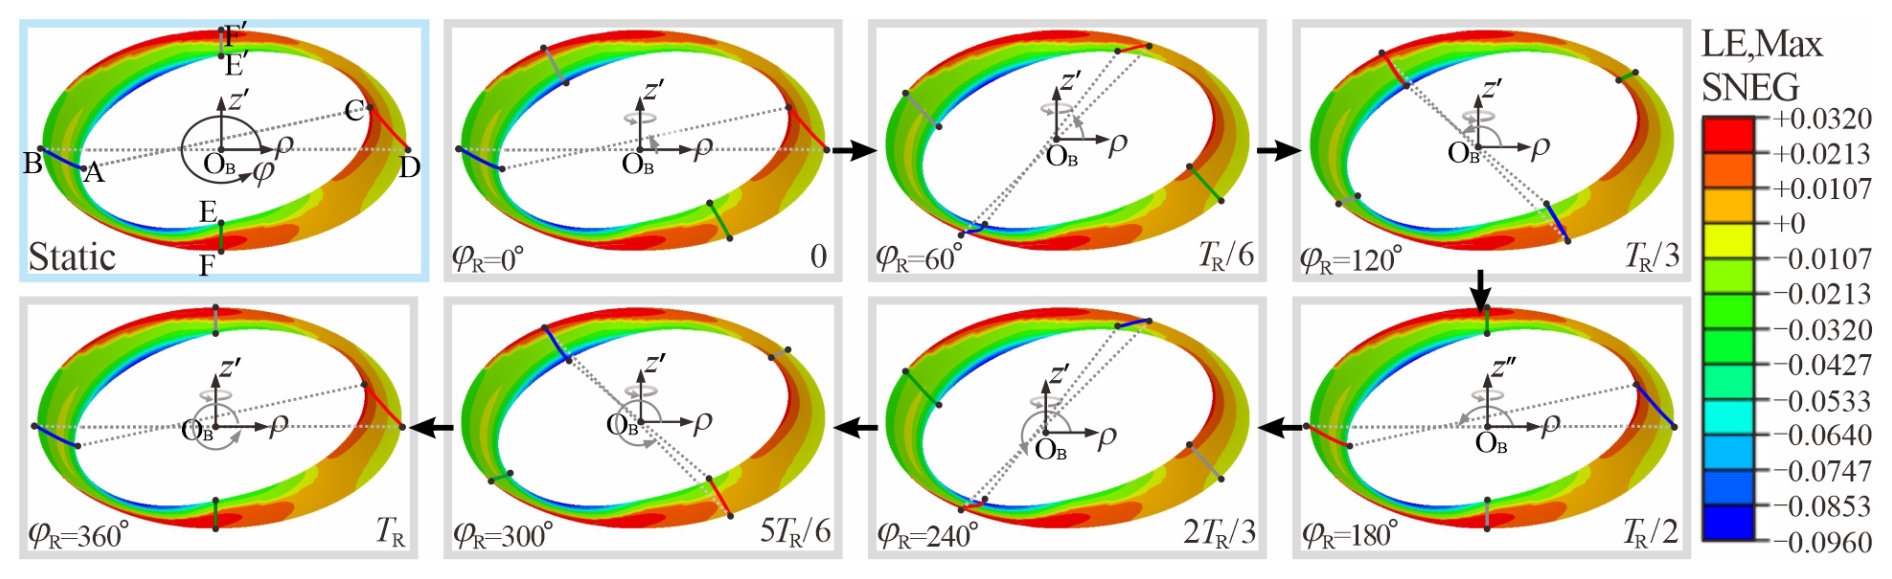
To elucidate the neutral stability mechanism during torsion, the evolution of strain energy density eS along generators CD, AB, E′F′, and EF at φ = 0, 90, 180, and 270° was tracked over a complete torsional cycle, as shown in Fig. 14. Tracking the blue generator (φ = 0°) along the circumferential direction, the deformation proceeds as follows. Starting at φR = 0° in the tensile zone, the generator first encountered the compressive–tensile transition interface near φR = 45°, where curvature κr flattened to near zero, while strain energy density eS dropped to its global minimum. As the generator rotates into the compressive region, eS increases continuously with curvature κr until achieving its peaks at φR = 108° due to the maximum curvature induced by material accumulation. Thereafter, it arrives at the mirror-symmetric compressive position at φR = 180° with eS dropping back down, completing the first half cycle. From φR = 180 to 360°, the path is retraced in reverse through compression, transition, and the tension zone, while the eS profile remains a perfect mirror of the 0–180° segment, yielding a closed, symmetric loop.
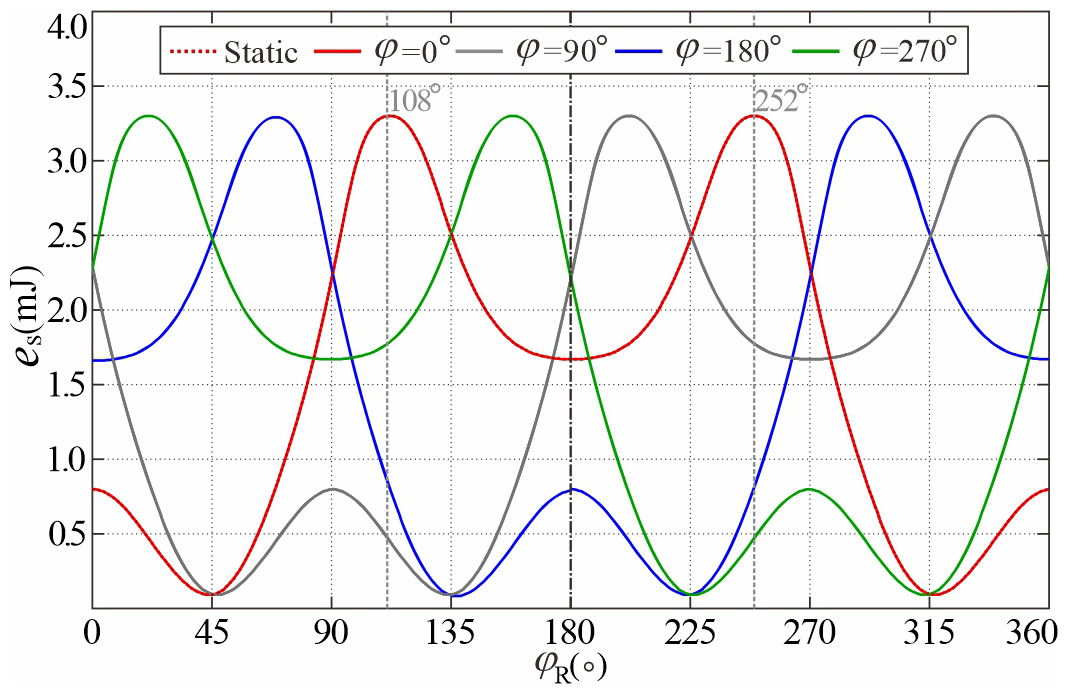
Figure 14Angular energy density distribution eS versus generators at during one complete torsion cycle.
Its periodicity can be expressed by the 2π periodic function as . Here, the φR–eS curve of φ = 0° is observed to coincide exactly with the angular energy distribution of the static bent bottom frustum in Fig. 6. From the energy perspective, the generator under torsion “traversed” the known steady-state distribution around the circumference. Likewise, the φR–eS curves for the generators at φ = 90, 180, and 270° retain the same shape as the φ = 0° curve and are simply shifted along the φR axis by their respective phase angles φ, each differing by a quarter of the period. The strain energy density eS of the generator at φ after twisting φR can be described as . Now, the strain energy of the bottom frustum can be integrated as
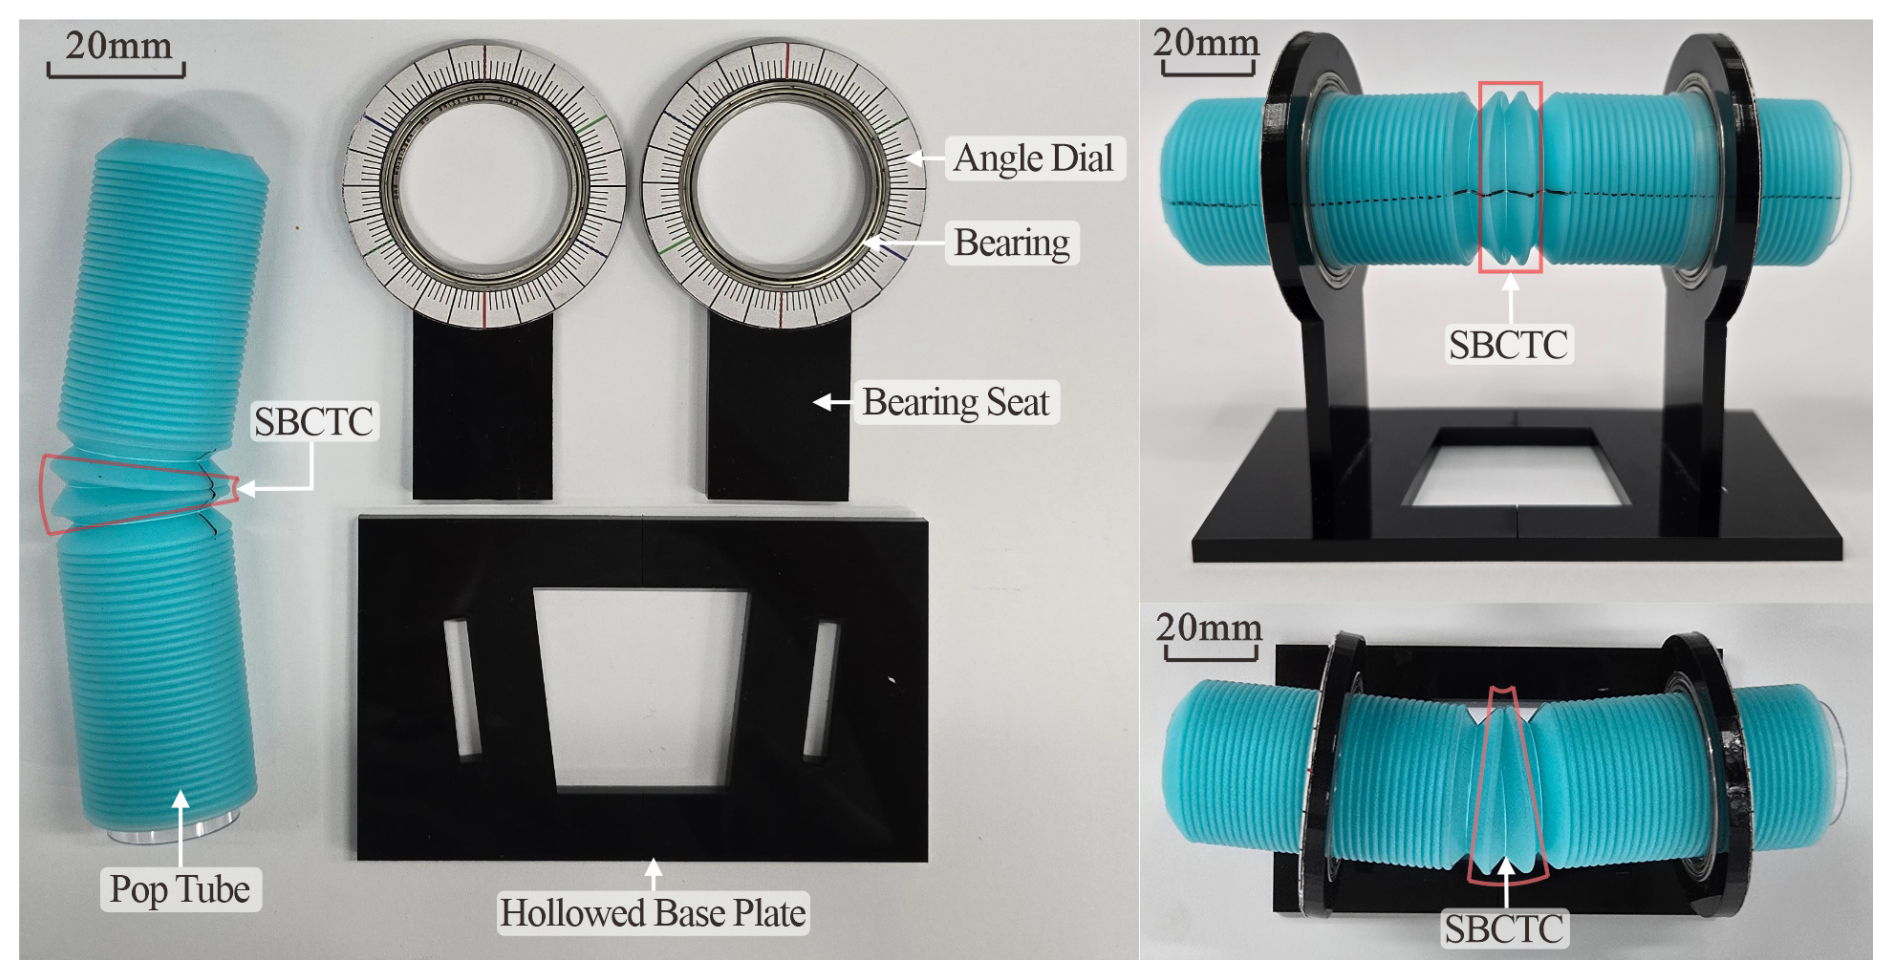
To verify their twisted geometric configuration, the industrial computed tomography (CT) technology (GE Phoenix v tome x s240) was applied here to capture the 3D profile of the bent prototype (Mideer glow pop tube) with speckles at a density of 31.52 mm−2. One unit of the pop tube was bent as a specific SBCTC unit, and its adjacent units were stretched to prevent scanning interference from corrugated wrinkles. The bent specimen was then secured on a hollow-bottomed fixed-bearing bracket, with angle dials marked on the bearing seats to read the rotation angle φR, as shown in Fig. 15. Subsequently, the bracket and specimen were placed into the CT machine for scanning, and the sample was twisted from φR = 0 to 360° at an interval of 60° for a scan until completing a full torsion TR. Figure 16a presents the surface profiles of the bent bottom frustum unit extracted and reconstructed from each scanning result.
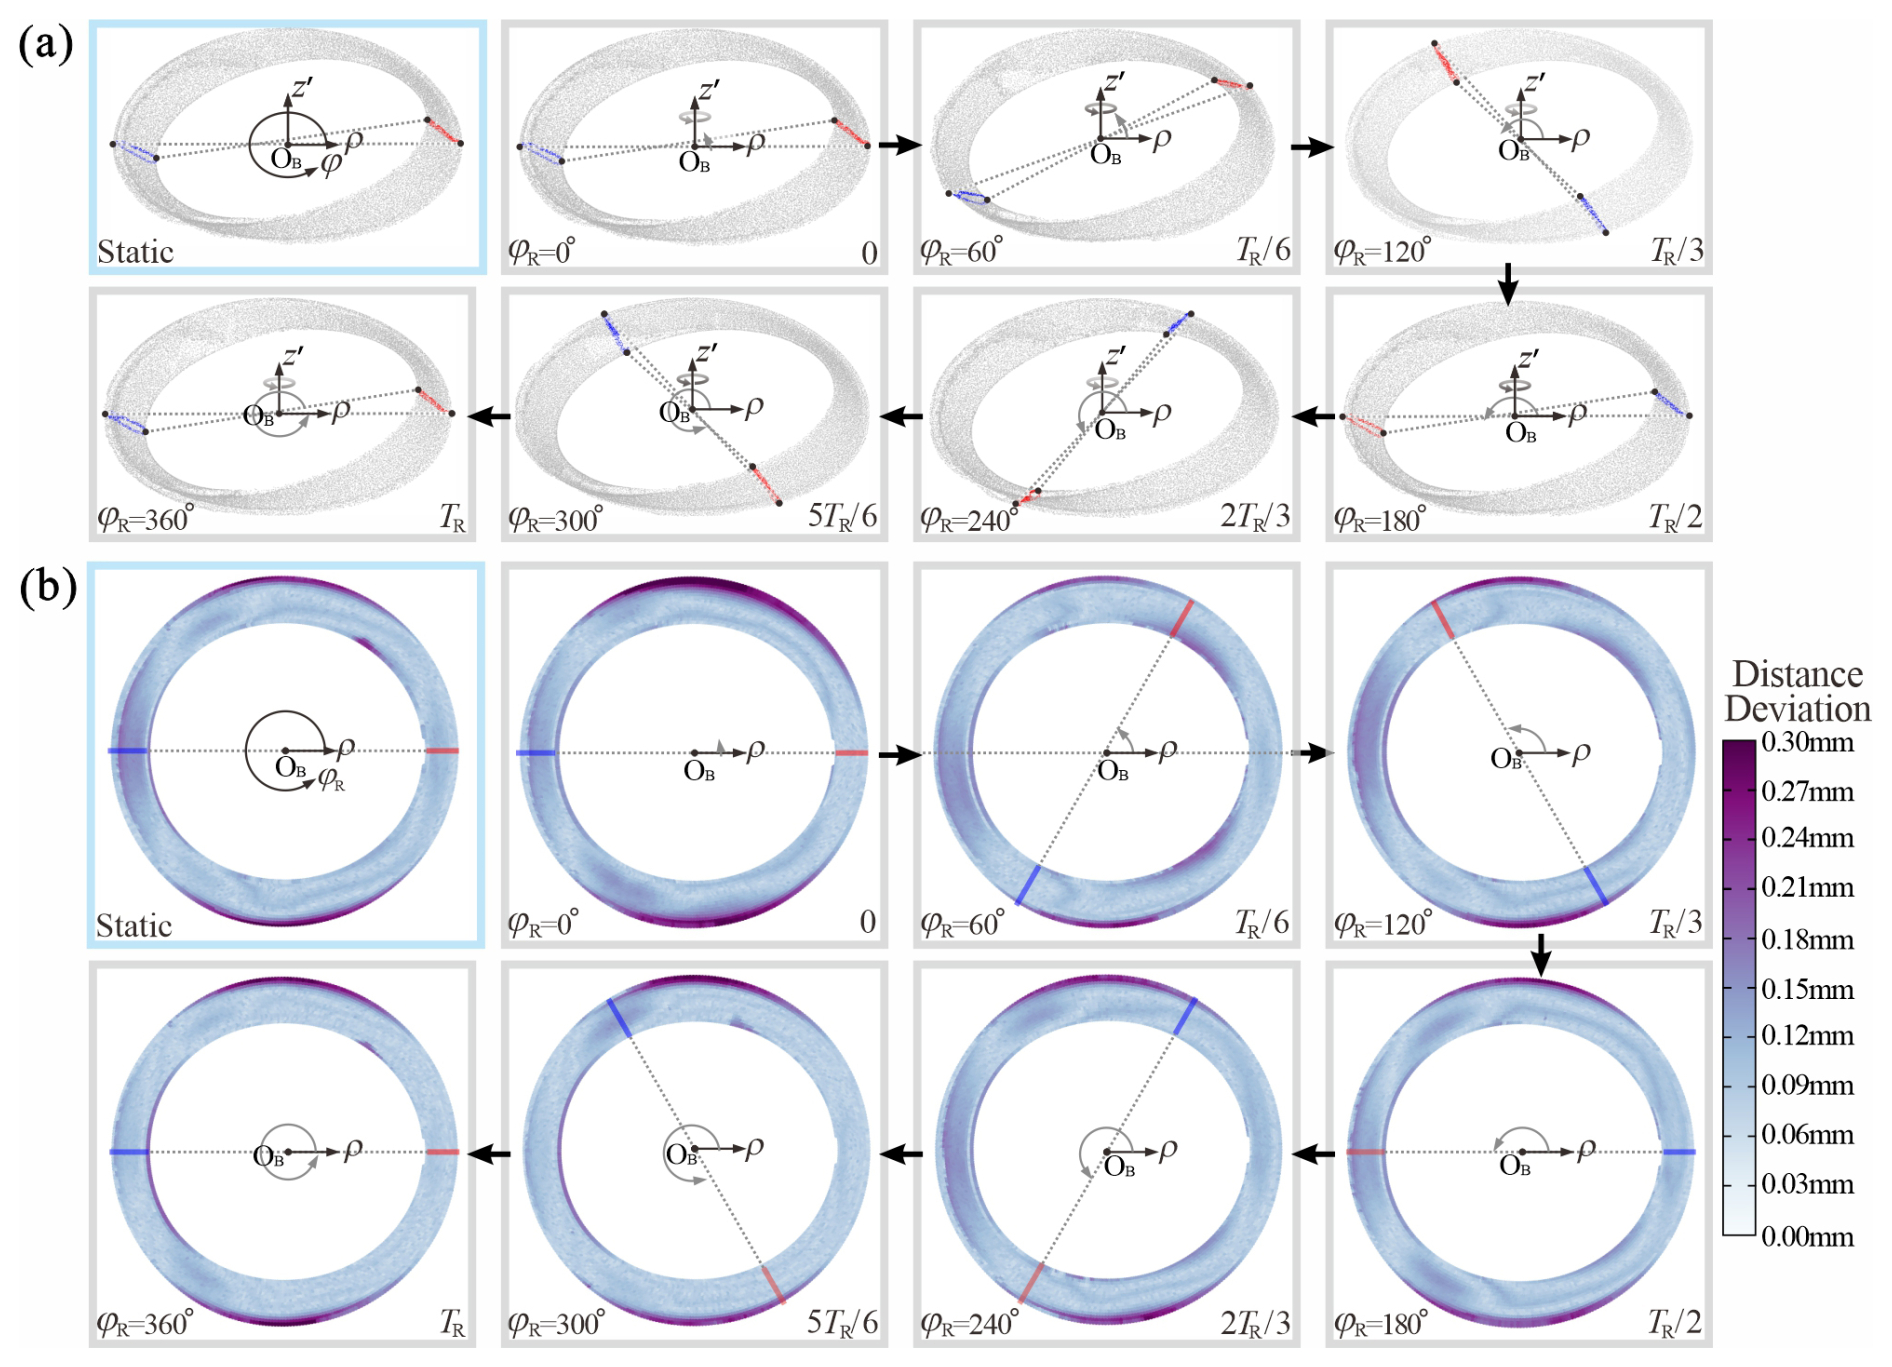
Figure 16(a) Experimentally reconstructed geometric bottom frustum during one complete torsion cycle TR and (b) comparison between the numerical model and the experimentally reconstructed bottom frustum based on CT scanning.
Here, we quantitatively assessed the geometrical similarity of numerical and experimental models by measuring the shortest distance between corresponding points on the numerical simulation surface and the scanned surface. For the specimen in both the initial bent state and the various twisting angles φR, we compared the 3D scanning results of the bottom frustum in Fig. 16a with the simulated geometric profiles in Fig. 13 under corresponding φR. As shown in Fig. 16b, the deviation is found to be within 0.30 mm in 98.4 % of the areas and with a mean deviation of 0.087 mm, indicating the accuracy of the numerical model. It can also be noted that the derivation primarily focuses on the outer rims of the bottom frustum, which echoes the geometric optimisation presented in Fig. 1. According to the geometric invariance observed in the numerical results in Fig. 13, the small derivation also further demonstrates that the entire geometry of the bottom frustum remains almost unchanged during torsion; thus its strain energy remains almost constant, indicating its neutral equilibrium for energy-free motion with perfect torque transmission.
5.1 Experimental setup
The numerical simulations and CT-scanned results in Sect. 5 indicated that the SBCTC unit can maintain static balance with negligible energy dissipation during torsion, thus theoretically reaching 100 % torque transmission efficiency. This can be validated through the following experiments. For the experimental setup, N units of the glow pop tube were bent and selected for the soft coupling test, while the non-test units were kept in a contracted state to serve as fixed ends (Fig. 17a). Despite the independent mechanical behaviour between units, we still utilised 502 adhesive glue to lock the non-test units and inserted a PVC pipe with an outer radius of r to enhance their radial stiffness and prevent deformation in the non-test area. Before testing, radial reference lines marked in blue and red were used as deformation calibration, as shown in Fig. 17b. Then, the specimen was horizontally assembled between two fixed bearing seats (YLV Explorer UCP206 D1) with perpendicular alignment, with their included angle as torque transmission angle θT. The testing system is composed of three parts connected in series: the input end, the transmission coupling, and the output end. The input end was driven by a stepper motor connected to a dynamic torque tester for real-time input torque monitoring, while the output end was equipped with an adjustable torque damper as the load. The input end is driven by a geared speed-adjustable stepper motor (Shinano Kenshi, S43D114-MC020) and is connected to a dynamic torque sensor (STBD, S2000A-2NM, error < 0.20 %) to monitor the input torque τInput at a 20 Hz sampling rate for real-time monitoring. The output end is equipped with an adjustable torque damper (Hongli MTB-06, range: 100–500 N mm) as the output torque τOutput, as shown in Fig. 17c.
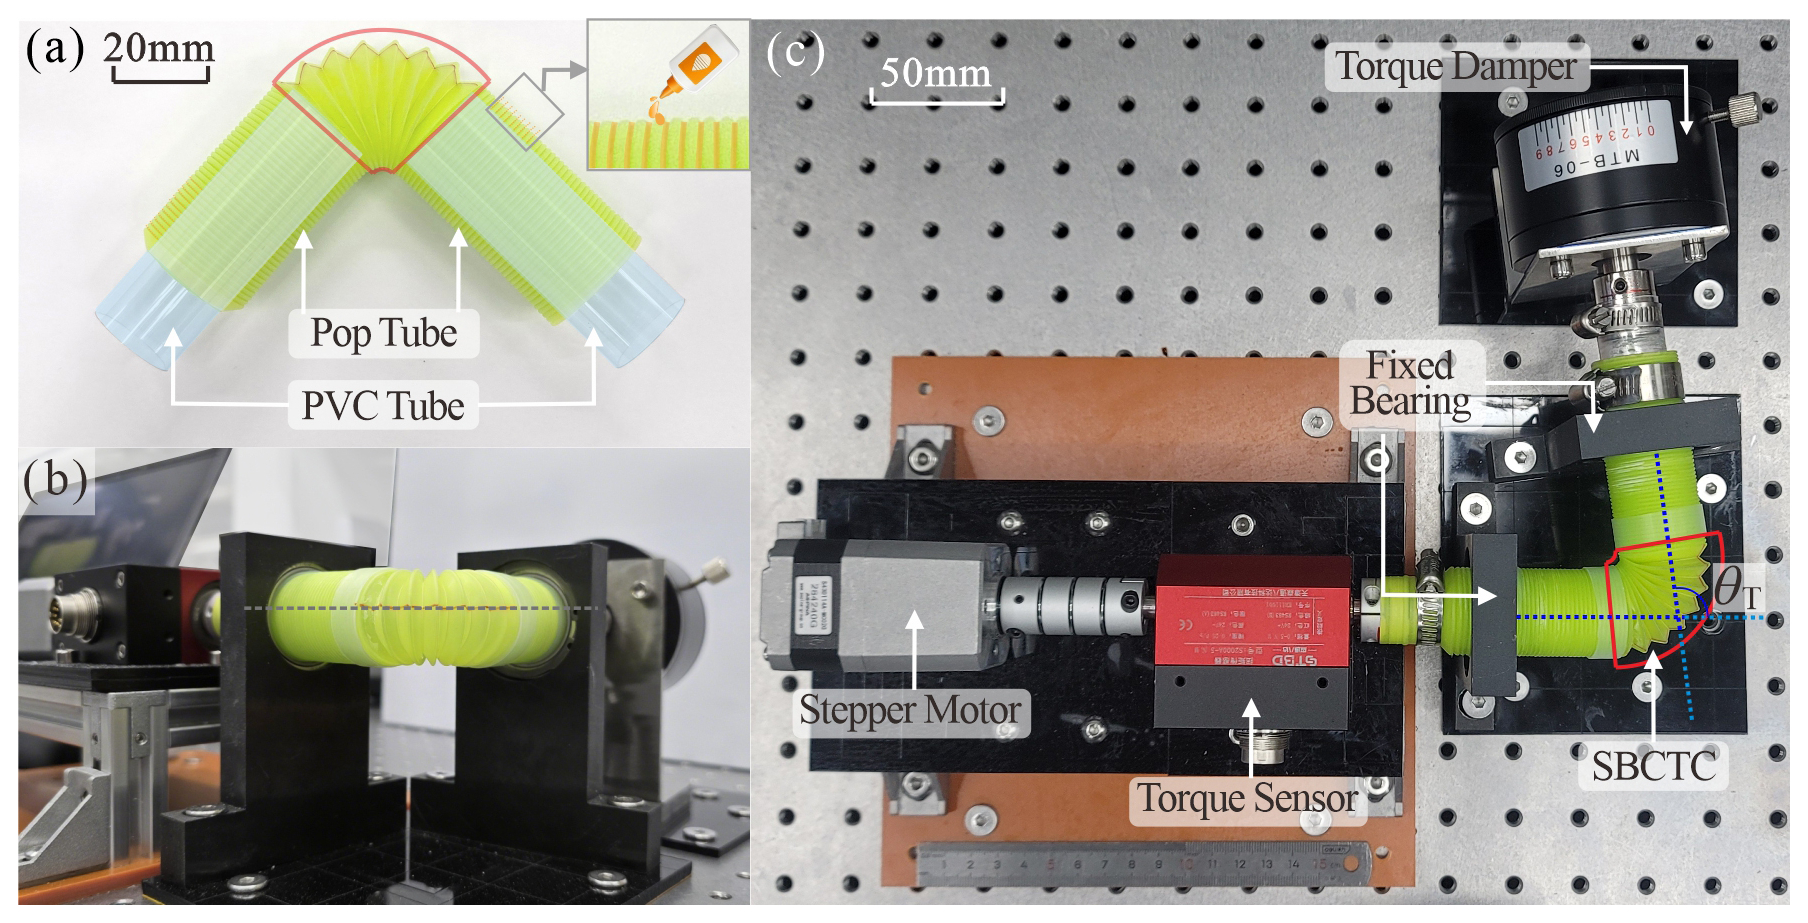
Figure 17Experimental setup for torque transmission efficiency testing of the SBCTC. (a) Selected N units for the soft coupling test and the non-test units that served as fixed ends. (b) Side view of the assembled SBCTC. Radial reference lines marked in blue and red for deformation calibration. (c) Top view of the testing system, including the input end driven by a geared speed-adjustable stepper motor, the dynamic torque sensor for real-time input torque monitoring, and the adjustable torque damper at the output end.
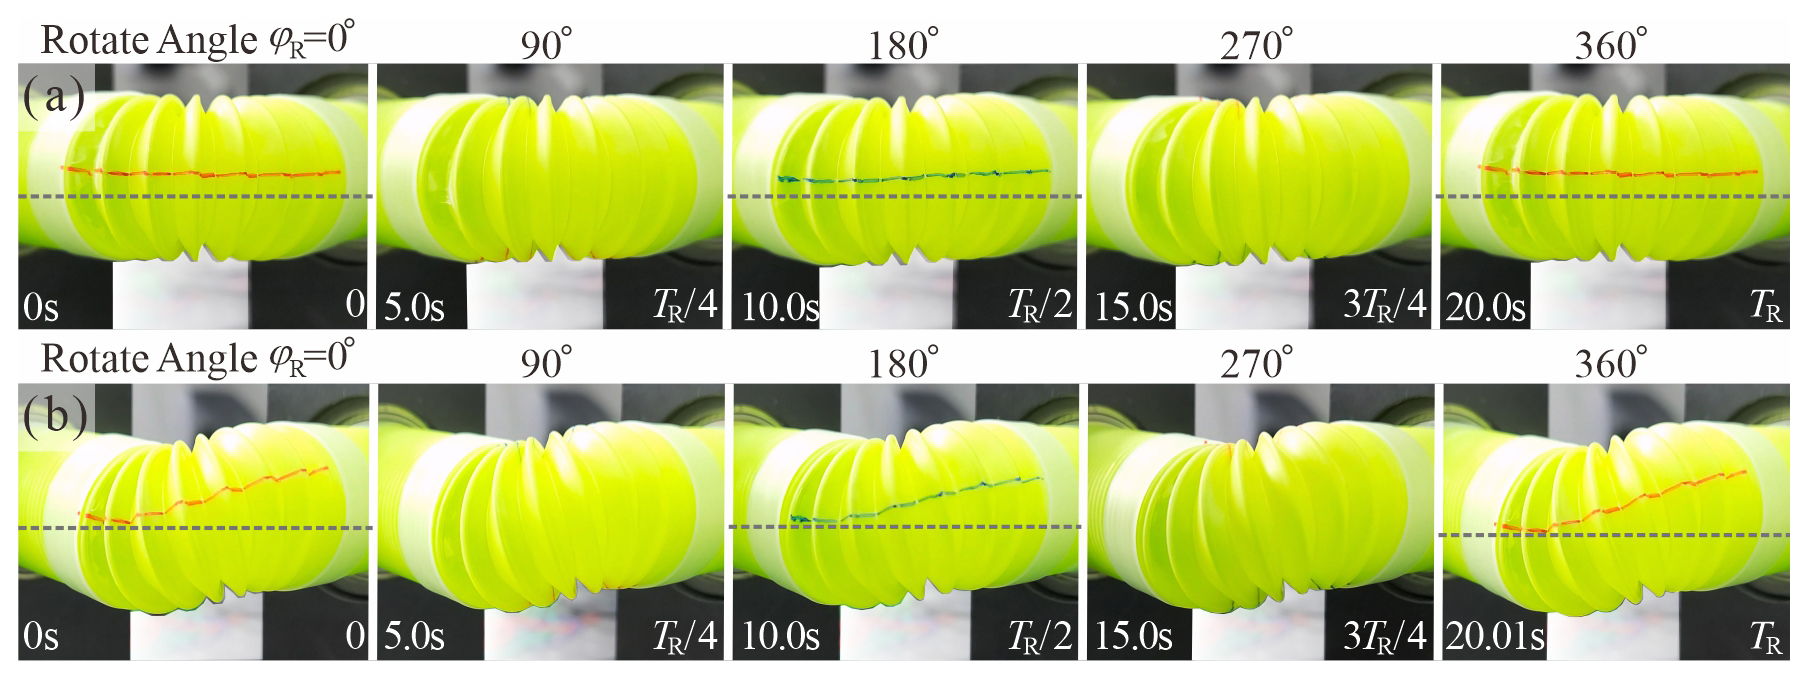
Figure 18Typical scenarios of the same coupling under different loads: (a) steady torque transmission and (b) unsteady torque transmission.
It should be noted that to enhance interlocking stability, the experimental bending angle θB was set to 14° per unit, slightly exceeding the 13.80° predicted by numerical analysis, which provides ° for a system comprising N bent units. In addition, Fig. 18a and b illustrate the two typical scenarios of the same coupling. Under the lower loads, the red marker line remains horizontal from the side view, and each unit can still maintain a stable bending state during torsion. However, under excessive loads, the coupling experienced torsional deformation along with visible tilting and bending of the marker line, causing unsteady torque transmission.
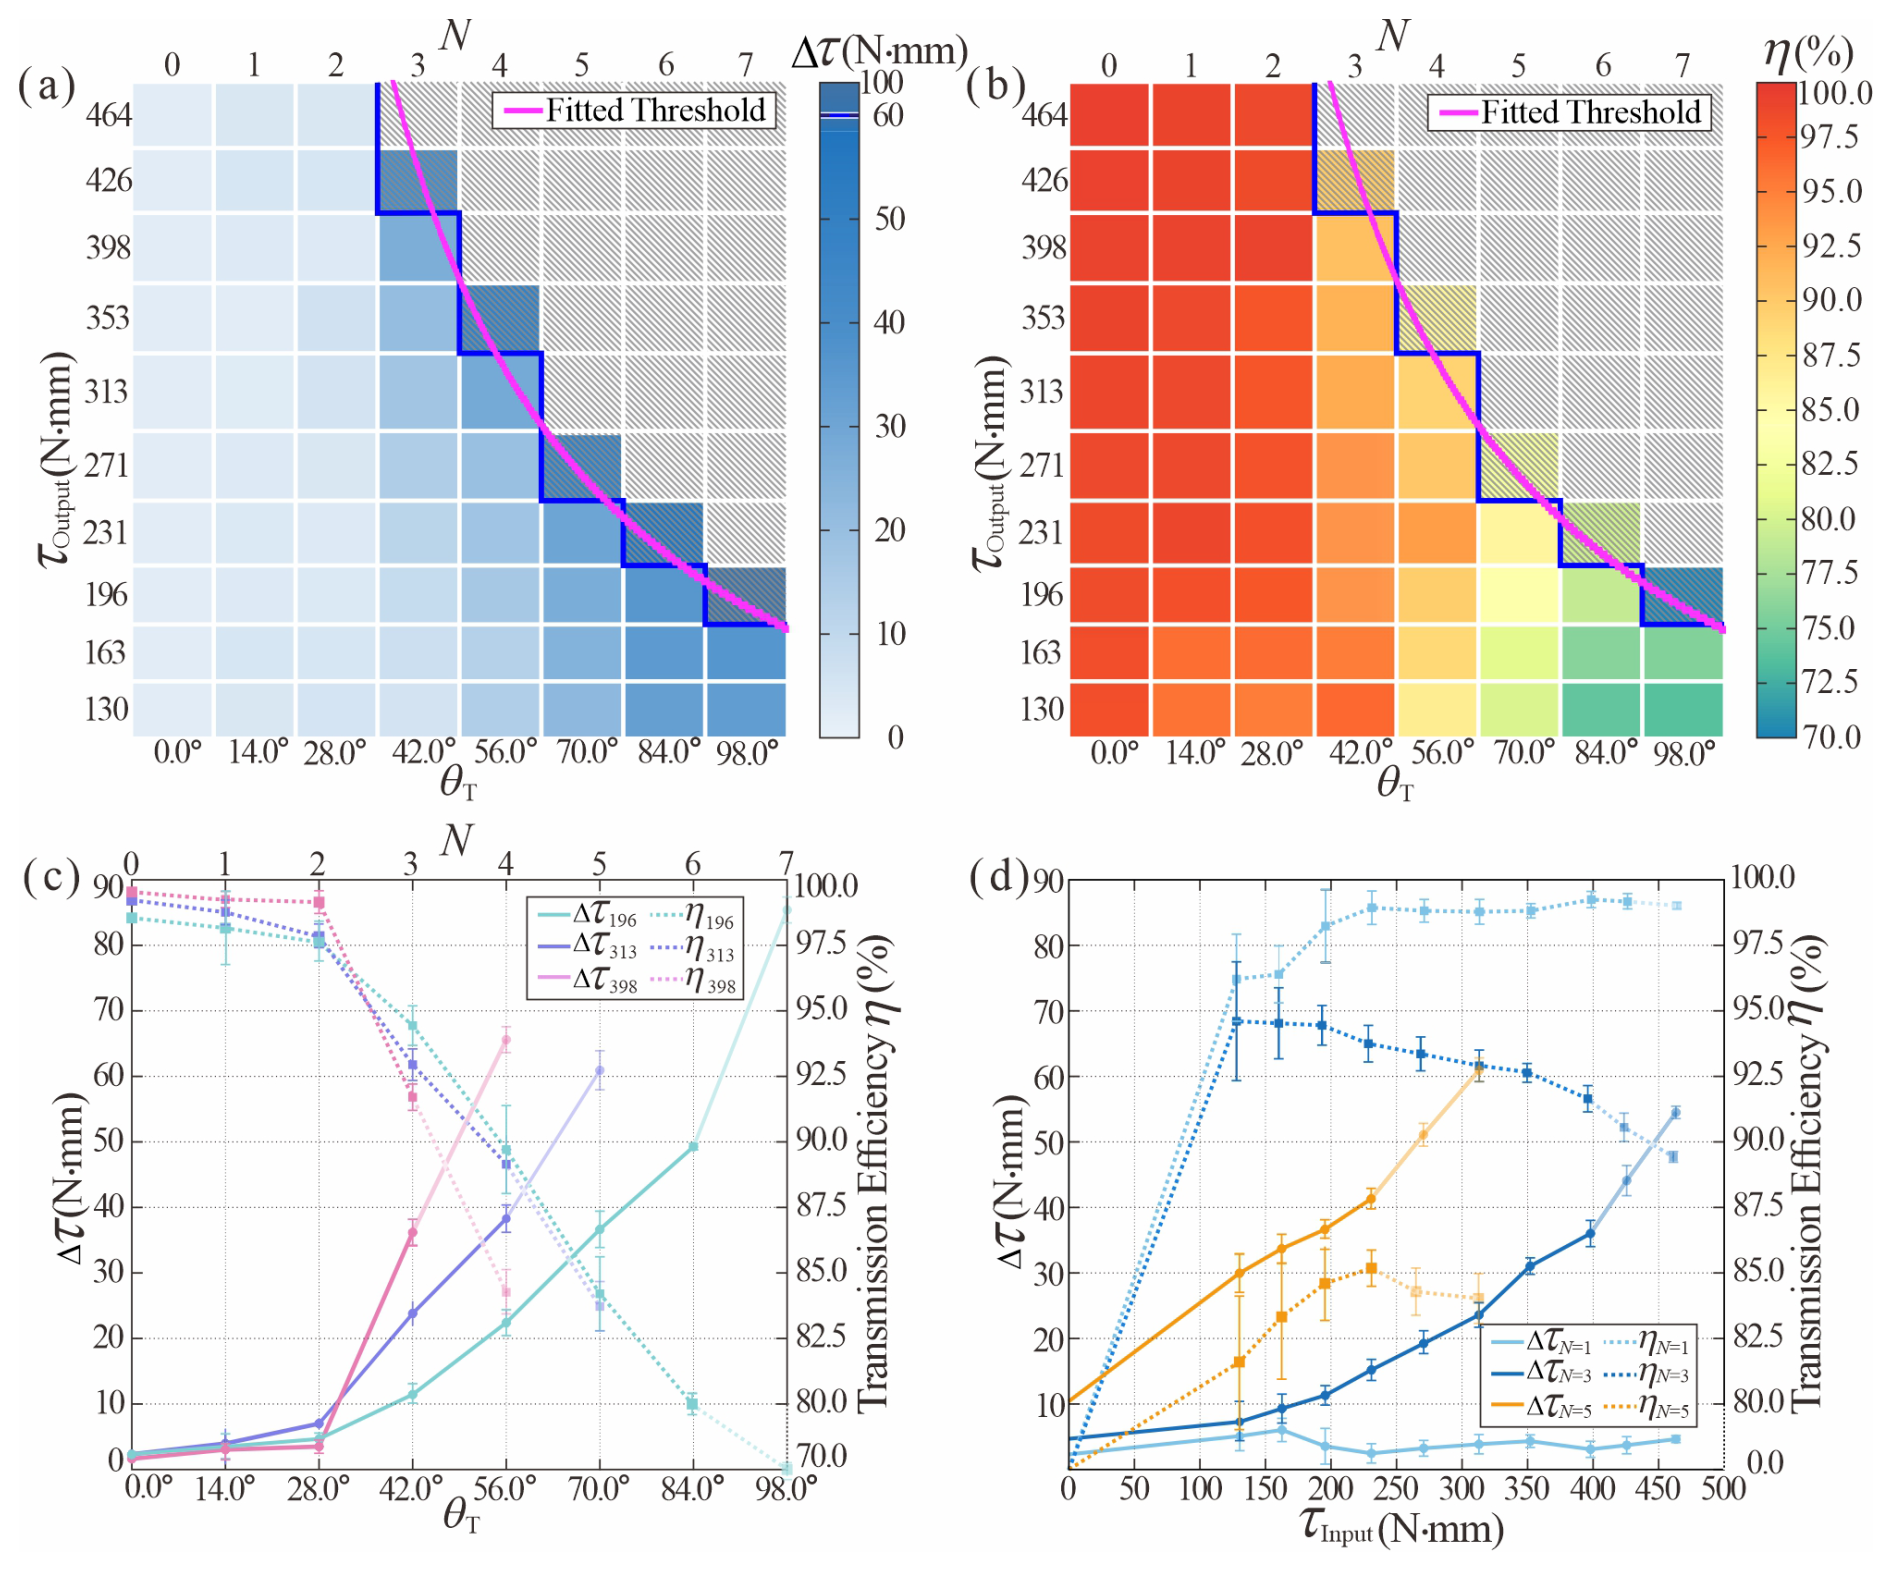
Figure 19(a) The contour map represents the torque difference (Δτ) varied with the torque transmission angle θT (i.e. the number of bent units N) and applied load τOutput. The local motion becomes unsteady above the magenta threshold lines. (b) The contour map represents the efficiency (η) varied with θT and τOutput. (c) The Δτ and η with a varied torque transmission angle θT at τOutput = 196, 313, and 398 N mm and a fixed rotational speed of 3 r min−1. (d) The Δτ and η with a different applied load τOutput at N = 1, 3, and 5 and a rotational speed of 3 r min−1.
5.2 Parametric study
With the designed experimental platform, we can systemically investigate the effects of the torque transmission angle θT (i.e. the number of bent units N), output torque τOutput, rotational speed of the stepper, and fatigue life on torque transmission and determine whether the torque transmission is steady based on typical scenarios in Fig. 18. Furthermore, the difference Δτ and efficiency η between the input and output torques τIntput and τOutput are introduced as parameters for the quantitative analysis of torque transmission, which can be expressed as follows.
First, the torque transmission angle θT is varied from 0 to 98°, corresponding to N = 0 to 7, with the torque damper ranging from 100 to 500 N mm with 9 discrete levels, while fixing the stepper motor rotational speed at 3.0 r min−1. As shown in Fig. 19a, Δτ increases with both transmission θT and load τOutput. However, when θT is 0° (i.e. N = 0), the system demonstrates constant Δτ0 = 2.079 N mm regardless of applied load, primarily attributed to the inherent friction of bearings. We also observe that when the torque difference Δτ exceeds the critical threshold of 60 N mm, the torque transmission of the coupled system can no longer remain steady. Furthermore, fitting analysis of the experimental data reveals that the critical load torque τcrit of the coupling is in inverse proportion to the given number of units N, with the specific relationship given by τcrit = 1314/N N mm, as indicated by the magenta marker in Fig. 19a. For the efficiency η, the results can be derived from the derived Δτ and load τOutput according to Eq. (18), as shown in Fig. 19b.
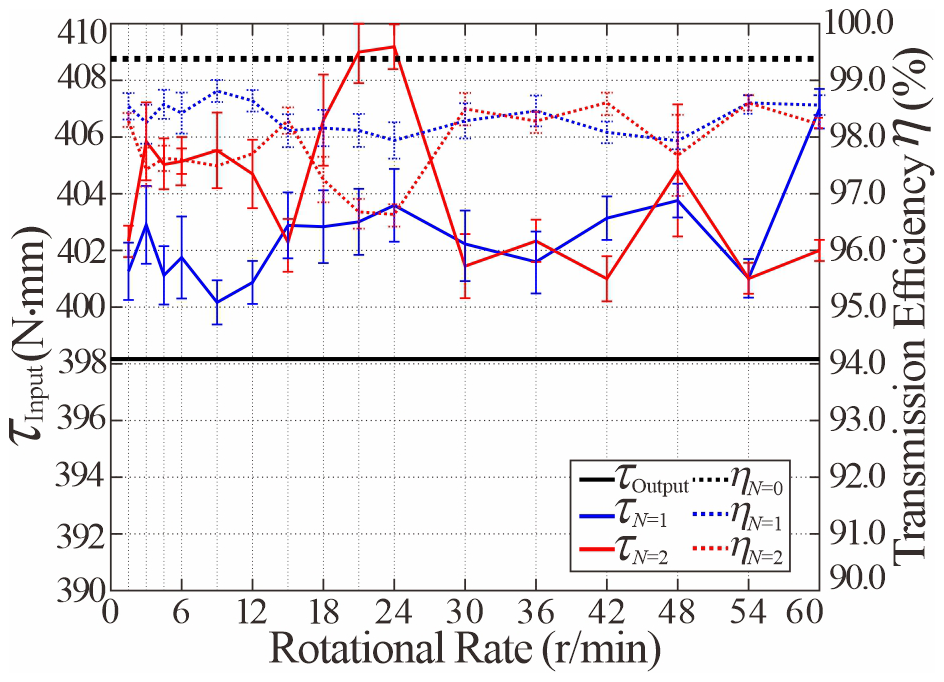
Figure 20Input torque τInput and transmission efficiency η vs. rotational speed for the SBCTC with N = 1 and N = 2 units at fixed torque τOutput = 398 N mm.
Table 2Bending stability for the SBCTCs with different geometric parameters.
In addition to the load and the angle of torque transmission, we also investigated the rotational speed of the motor and the fatigue resistance of the SBCTC. During the experiments, the applied load was kept at 398 N mm, and tests were performed on soft couplings with N = 1 or 2 SBCTC units, respectively. The experimental result in Fig. 20a illustrates that the input torques τN=1 and τN=2 remained within the ranges of 402.82 ± 1.33 and 406.29 ± 2.16 N mm, respectively, with corresponding transmission efficiencies τN=1 and τN=2 of 98.80 ± 0.33 % and 97.95 ± 0.54 %, which indicates high efficiency of our SBCTC regardless of rotational speed, as shown in Fig. 20. Furthermore, to demonstrate the fatigue resistance of SBCTC (Karger-Kocsis, 1999), the N = 1 specimen successfully completed 19 200 operational cycles. With increasing cycle numbers, the input torque τN=1 fluctuated around 402.73 N mm, maintaining η around 98.83 % without observed failure, as shown in Fig. 21. However, it can be noted that the fluctuation range of the torque expanded from 10.53 to 15.96 N mm due to material fatigue.
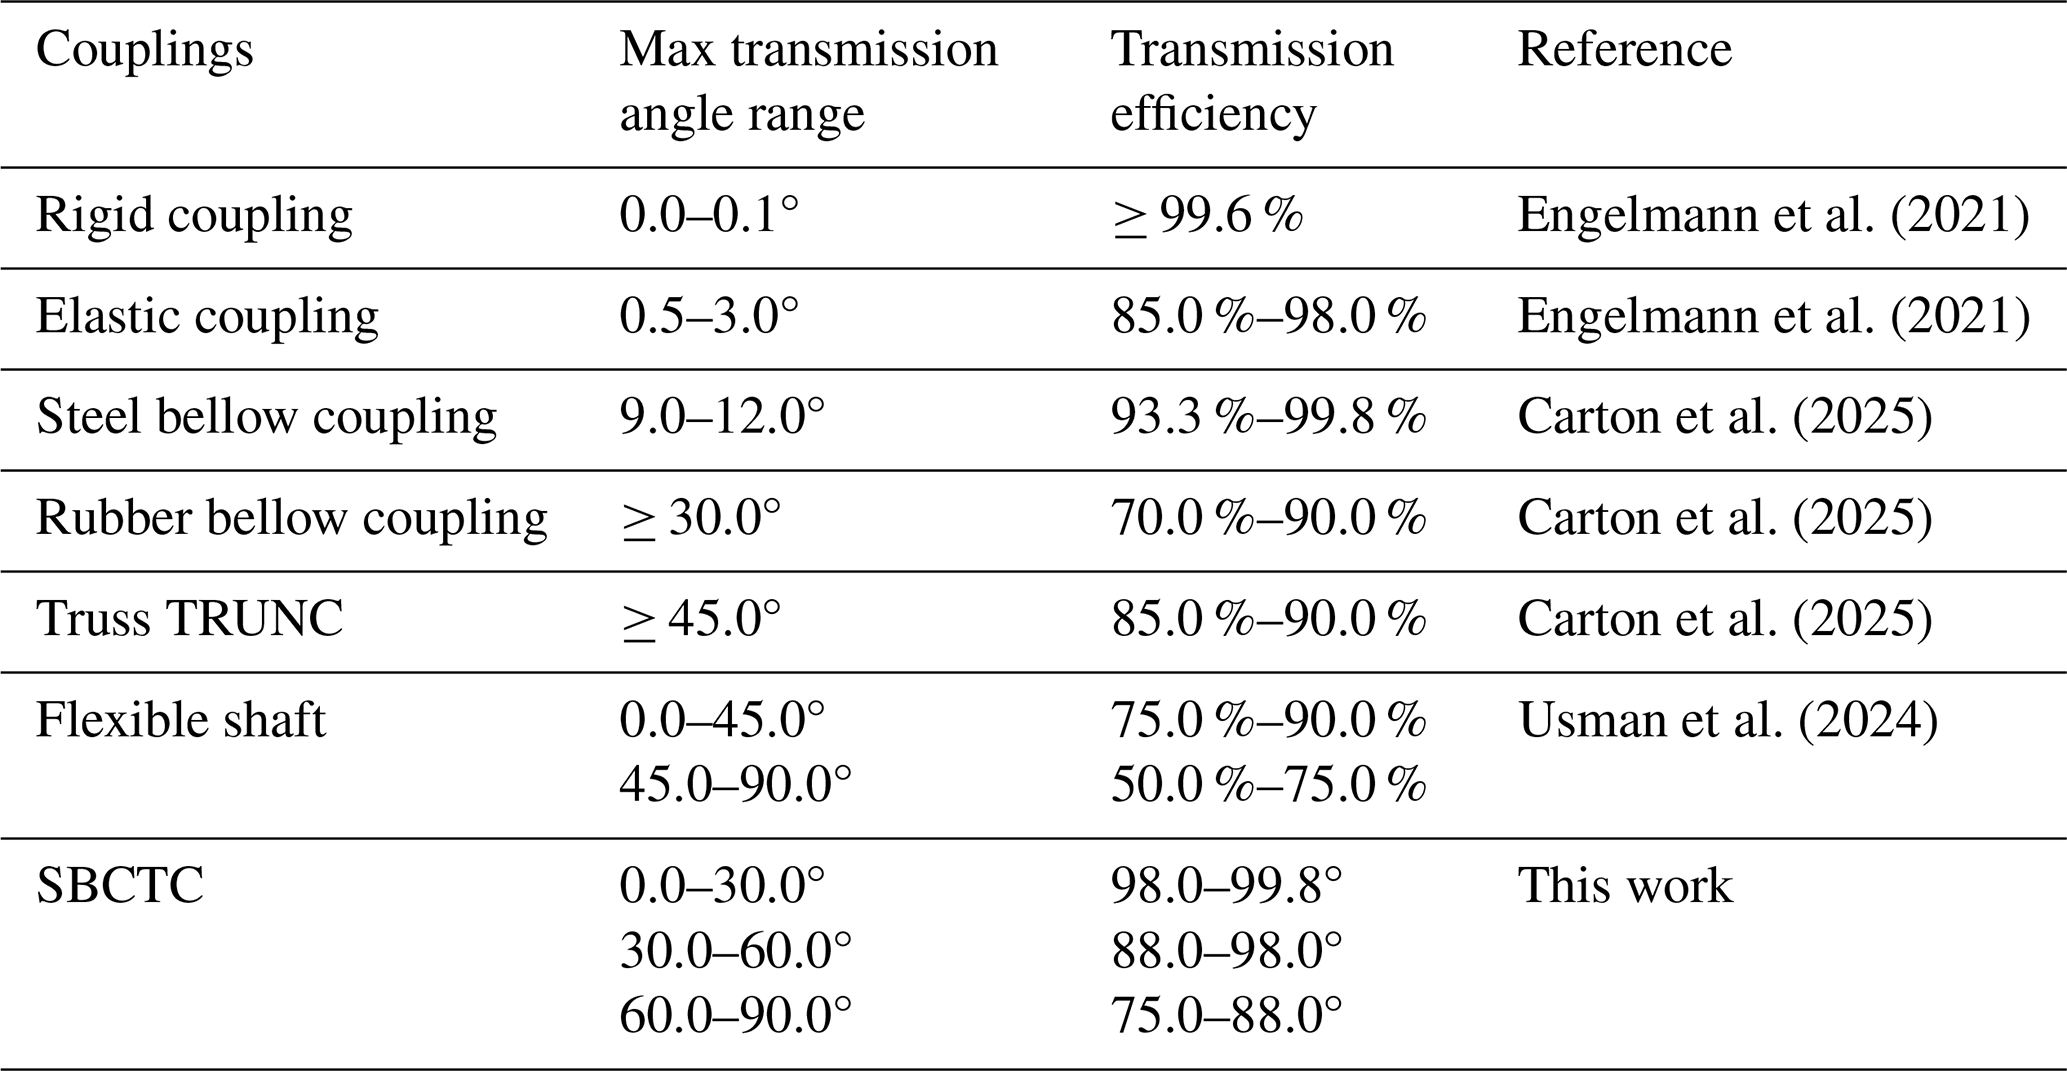
Here, when θT (N = 0, 1, 2) is less than 30°, the efficiency reaches 97 % and remains stable over a long period under different rotational speeds, demonstrating robust fatigue resistance. η stays close to 90 % with θT less than 60° (N = 3, 4). Even when θT exceeds 90° (N = 7), η remains above 75 %. Given static balance during torsion, our cost-effective SBCTCs demonstrate outstanding transmission efficiency and a broad torque transmission angle compared to common soft couplings (Carton et al., 2025).
In conclusion, prompted by the observation that a bendy straw can bend in any circumferential direction to a stable state, we successfully designed a novel compliant toque coupling. This coupling, constructed from series-connected frustum shells, adeptly transforms the azimuthal stability of the bent bendy straw into static balance during torsion, allowing the ideal coupling to achieve perfect torque transmission without external force or energy input. Through numerical analysis of the bending process, we have investigated mechanical behaviour and geometric evolution, particularly curvature distribution. Parametric studies identified key factors influencing bending stability, enabling the development of a simplified beam model to predict stable states and guide parameter selection for torque transmission. Subsequently, numerical analysis of the bent SBCTC under torsion unveiled the fact that periodic circumferential deformation of material elements and mutual strain energy compensation ensure conservation of total energy and overall geometry, validated by experimentally reconstructed frustum shells. Additionally, precise experiments further verified the stable and efficient torque transmission capabilities of the SBCTC under different loads and operating conditions, significantly outperforming existing industrial flexible couplings.
However, our current SBCTC still exhibits certain limitations. Notably, the research lacks a corresponding theoretical model, which will be a focus of our future work. Experimental results indicate that its torque transmission capacity is subjected to a distinct upper limit under large transmission angles, which is inferior to that of industrial alternatives. To extend its applicability, developing robust multi-scale models is also essential for SBCTC to perform reliably across different scales. Nevertheless, in comparison with commercial couplings in Table 2, we anticipate that our lightweight and low-cost SBCTCs of varying scales will enable ultra-efficient torque transmission across dimensional scales, advancing applications from fore-front robotics systems to precision micro-manufacturing beyond this prototype.
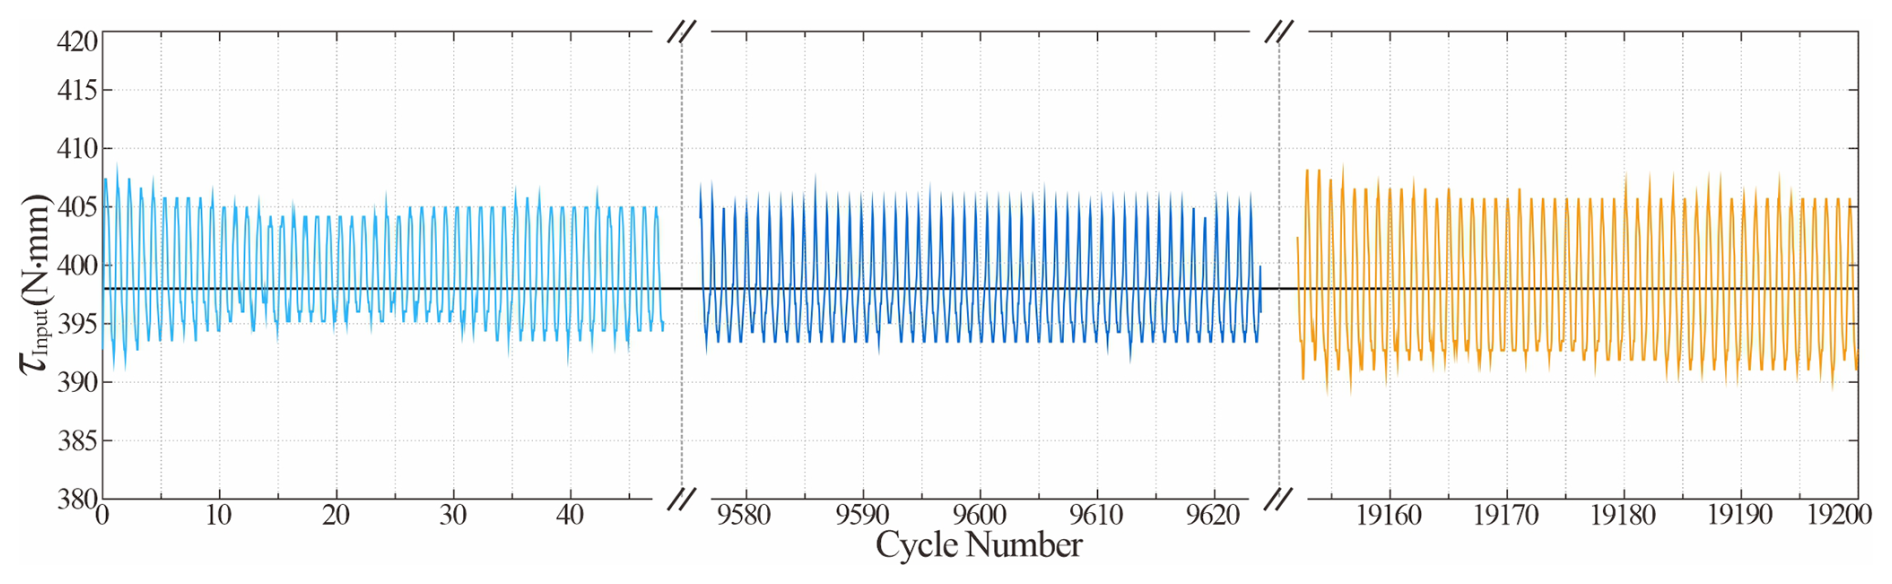
Figure 21Input torque τInput vs. cycle number for the SBCTC with N = 1 unit at fixed torque τOutput = 398 N mm.
The tensile test was conducted on copolymer polypropylene (PP) at room temperature (25 °C) with a tensile speed of 5 mm min−1. The experimental results were obtained by averaging the test data from three dog-bone specimens.
Table A1Nominal strain–stress data of polypropylene (PP) material.
A mesh convergence study was conducted on the bending process of model 30-11.0-0.30 to ensure that the simulation accuracy was independent of the mesh size. Six mesh models with increasing refinement were generated with element sizes ranging from approximately 0.75 to 0.125 mm. The total strain energy was monitored as the key output parameter, which demonstrates a clear convergence trend, as shown in Fig. A1. The strain energy between the “fine” mesh with an element size of 0.25 mm and the “finer” mesh with an element size of 0.125 mm was less than 0.75 %. Therefore, the fine-mesh model was selected for all subsequent simulations to achieve an optimal balance between computational accuracy and cost.
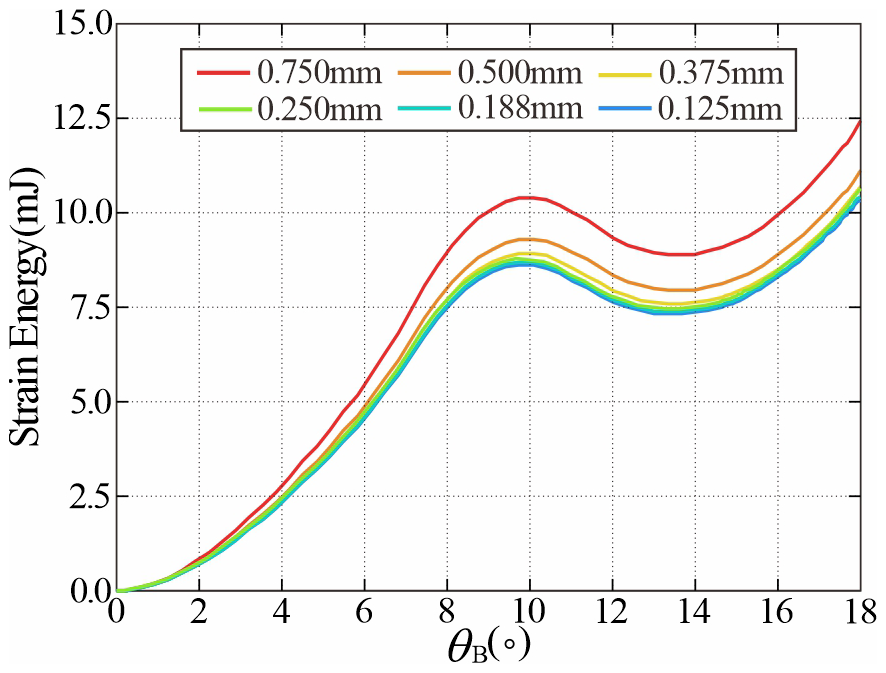
Figure B1Mesh convergence test of model 30-11.0-0.30 with element sizes ranging from approximately 0.25 to 0.05 mm.
The data that support the findings of this study are available from the corresponding author upon reasonable request.
X. Yang: methodology, investigation, validation, visualisation, writing – original draft preparation. J. Ma: conceptualisation, supervision, writing – review and editing. Y. Chen: conceptualisation, supervision, project administration, funding acquisition.
The contact author has declared that none of the authors has any competing interests.
Publisher's note: Copernicus Publications remains neutral with regard to jurisdictional claims made in the text, published maps, institutional affiliations, or any other geographical representation in this paper. While Copernicus Publications makes every effort to include appropriate place names, the final responsibility lies with the authors. Views expressed in the text are those of the authors and do not necessarily reflect the views of the publisher.
The authors greatly acknowledge the support of the National Natural Science Foundation of China (projects 52422502, 52375022, 52320105005,and 52192631).
This research has been supported by the National Natural Science Foundation of China (project nos. 52422502, 52375022, 52320105005, and 52192631).
This paper was edited by Guimin Chen and reviewed by Yang Li and one anonymous referee.
Baumann, A., Sánchez-Ferrer, A., Jacomine, L., Martinoty, P., Houerou, V. L., Ziebert, F., Kuliæ I. M.: Motorizing fibres with geometric zero-energy modes, Nature Materials, 17, 523–527, https://doi.org/10.1038/s41563-018-0062-0, 2018.
Ben-Abu, E., Veksler, Y., Elbaz, S., Zigelman, A., and Gat, A. D.: Growing structure based on viscous actuation of constrained multistable elements, Adv. Mater. Technol., 8, 2202184, https://doi.org/10.1002/admt.202202184, 2023.
Ben-Abu, E., Abramov, Y., Fine, A., Elbaz, S., Zemah, N., Zigelman, A., Ram, O., and Gat, D. G.: Directed instability as a mechanism for fabricating multistable twisting microstructure, Adv. Eng. Mater., 26, 20240070, https://doi.org/10.1002/adem.202400070, 2024a.
Ben-Abu, E., Zigelman, A., Veksler, Y., Givli, S., Filipov, E., Lipson, H., and Gat, A. D.: Reprogrammable 3D shapes from 1D metamaterial, Adv. Mater. Technol., 10, 240113, https://doi.org/10.1002/admt.202401113, 2024b.
Bende, N. P., Yu, T., Corbin, N. A., Dias, M. A., Santangelo, C. D., Hanna, J. A., and Hayward, R. C.: Overcurvature induced multistability of linked conical frusta: how a “bendy straw” holds its shape, Soft Matter, 14, 8636–8642, https://doi.org/10.1039/C8SM01355A, 2018.
Carton, M., Kowalewski, J. F., Guo, J., Alpert, J. F., Garg, A., and Revier, D.: Bridging hard and soft: mechanical metamaterials enable rigid torque transmission in soft robots, Sci. Rob., 10, https://doi.org/10.1126/scirobotics.ads0548, 2025.
de Lange, D. J. B. A., Langelaar, M., and Herder, J. L.: Design of a statically balanced compliant laparoscopic grasper using topology optimisation, ASME International Design Engineering Technical Conferences & Computers & Information in Engineering Conference American Society of Mechanical Engineers, https://doi.org/10.1115/DETC2008-49794, 2008.
Dias, M. A., Dudte, L. H., Mahadevan, L., Santangelo, C. D.: Geometric mechanics of curvedcrease origami, Phys. Rev. Lett., 109, 114301, https://doi.org/10.1103/PhysRevLett.109.114301, 2012.
Engelmann, M., Grote, K., and Guthmann, T.: Handbook of Machine Elements, 2nd edn., Springer, https://doi.org/10.1007/978-3-030-47035-7, 2021.
Gallego, J. A. and Herder, J. L.: Criteria for the static balancing of compliant mechanisms. Asme International Design Engineering Technical Conferences and Computers and Information in Engineering Conference, https://doi.org/10.1115/DETC2010-28469, 2010.
Guest, S. D., Kebadze, E., and Pellegrino, S.: A zero-stiffness elastic shell structure, J. Mech. Mater. Struct., 6, 203–212, https://doi.org/10.2140/jomms.2011.6.203, 2011.
Hamouche, W., Maurini, C., Vidoli, S., and Vincenti, A.: Multi-parameter actuation of a neutrally stable shell: a flexible gear-less motor, Proceedings of the Royal Society. Mathematical, physical and engineering sciences, 473, 2204, https://doi.org/10.1098/rspa.2017.0364, 2017.
Herder, J. L.: Energy-free systems: theory, conception, and design of statically balanced spring mechanisms, Mechanical maritime & materials engineering, https://repository.tudelft.nl/record/uuid:8c4240fb-0315-462a-8b3b-efbd0f0e68b6 (last access: 12 August 2025), 2001.
Herder, J. L. and van den Berg, F. P. A.: Statically balanced compliant mechanisms (SBCM's), an example and prospects, Proceedings ASME DETC 26th Biennial, Mechanisms and Robotics Conference, 10–13 September 2000, Baltimore, Maryland, paper no. DETC2000/MECH14144, https://doi.org/10.1115/DETC2000/MECH-14144, 2000.
Karger-Kocsis, J.: Polypropylene: An A–Z Reference, Kluwer Academic Publ., 227–232, https://doi.org/10.1007/978-94-011-4421-6_31, 1999.
Kim, T., Kaarthik, P. and Truby, R. L.: A flexible, architected soft robotic actuator for motorized extensional motion, Adv. Intell. Syst., 6, 2300566, https://doi.org/10.1002/aisy.202300866, 2024.
Kok, S., Radaelli, G., Nobaveh, A. A., and Herder, J.: Neutrally stable transition of a curved-crease planar shell structure, Extreme Mechanics Letters, https://doi.org/10.1016/j.eml.2021.101469, 2021.
Kok, S., Nobaveh, A. A., and Radaelli, G.: Neutrally stable double-curved shells by inflection point propagation, J. Mech. Phys. Solids, 171, 105133, https://doi.org/10.1016/j.jmps.2022.105133, 2023.
Lachenal, X., Daynes, S., and Weaver, P. M.: A zero torsional stiffness twist morphing blade as a wind turbine load alleviation device, Smart Mater. Struct., 22, 065016, https://doi.org/10.1088/0964-1726/22/6/065016, 2023.
Lee, N. C.: Practical guide to blow moulding, Smithers Rapra Technology, ISBN 9781847350351, 2006.
Liu, Y., Pan, F., Ding, B., Zhu, Y., Yang, K., and Chen, Y.: Multistable shape-reconfigurable metawire in 3D space, Extreme Mech. Lett., 50, 101535, https://doi.org/10.1016/j.eml.2021.101535, 2022.
Murphey, T. W. and Pellegrino, S.: A novel actuated composite tape-spring for deployable structures, 45th AIAA/ASME /ASCE/AHS/ASC Structures, Structural Dynamics & Materials Conference, https://doi.org/10.2514/6.2004-1528, 2004.
Pan, F., Li, Y., Li, Z., Li, J., Liu, B., and Chen, Y.: 3D pixel mechanical metamaterials, Adv. Mater., 31, 1900548, https://doi.org/10.1002/adma.201900548, 2019.
Radaelli, G.: Reverse-twisting of helicoidal shells to obtain neutrally stable linkage mechanisms, Int. J. Mech. Sci., 202–203, 106532, https://doi.org/10.1016/j.ijmecsci.2021.106532, 2021.
Schenk, M., Guest, S. D., and Herder, J. L.: Zero stiffness tensegrity structures, Int. J. Solids & Struct., 44, 6569–6583, https://doi.org/10.1016/j.ijsolstr.2007.02.041, 2007.
Seffen, K. A. and Guest, S. D.: Prestressed Morphing Bistable and Neutrally Stable Shells, J. Appl. Mech., 78, 011002, https://doi.org/10.1115/1.4002117, 2011.
Tarnai, T.: Zero stiffness elastic structures, Int. J. Mech. Sci., 45, 425–431, https://doi.org/10.1016/S0020-7403(03)00063-8,2003.
Thomson, W., Tait, P. G.: Treatise on Natural Philosophy, Volume 1, 2nd edition, Cambridge University Press, https://doi.org/10.1017/CBO9780511703928, 1867.
Tolou, N. and Herder, J. L.: Concept and modelling of a statically balanced compliant laparoscopic grasper, ASME International Design Engineering Technical Conferences 2009, 163–170, https://doi.org/10.1115/detc2009-86694, 2009.
Tolou, N., Henneken, V. A., and Herder, J. L.: Statically Balanced Compliant Micro Mechanisms (SB-MEMS): Concepts and Simulation, ASME International Design Engineering Technical Conferences & Computers & Information in Engineering Conference 2010, https://doi.org/10.1115/DETC2010-28406, 2011.
Usman, M., Khorasani, A., Hubert, T., Furnémont, R., Khorasani, A., Vanderborght, B., Lefeber, D., Van de Perre, G., and Verstraten, T.: Modeling of flexible shaft for robotics applications, Mech. Mach. Theory, 197, 105647, https://doi.org/10.1016/j.mechmachtheory.2024.105647, 2024.
Vehar, C., Kota, S., and Dennis, R.: Closed-loop tape springs as fully compliant mechanisms-Preliminary investigations, ASME International Design Engineering Technical Conferences & Computers & Information in Engineering Conference American Society of Mechanical Engineers, https://doi.org/10.1115/DETC2004-57403, 2004.
Wang, S., Yang, X., Chen, Y., and Ma, J.: A theoretical design of a bellow-shaped statically balanced compliant mechanism, Mech. Mach. Theory, 161, 104295, https://doi.org/10.1016/j.mechmachtheory.2021.104295, 2021.
Wo, Z. and Filipov, E. T.: Bending stability of corrugated tubes with anisotropic frustum shells, Journal of Applied Mechanics, 89, 041005, https://doi.org/10.1115/1.4053267, 2022.