the Creative Commons Attribution 4.0 License.
the Creative Commons Attribution 4.0 License.
Effect of the gap between the diffuser blade and impeller blade on the internal complex flow and aerodynamic performance of a centrifugal compressor
Jinxi Chen
Yuqian Zhang
Zhengdao Wang
Hui Yang
Wei Zhang
Zuchao Zhu
In this paper, the impact of the ratio (Rd= ) between the diffuser inlet radius (R2) and the impeller outlet radius (R1) on internal complex flow and the aerodynamic performance of a centrifugal compressor is deeply studied through numerical simulations. The study investigates how variations in Rd affect the efficiency, differential pressure and minimum allowable mass flow rate of the compressor. The difference in pressure, velocity and turbulent kinetic energy of the centrifugal compressor is demonstrated at three different values of Rd. Additionally, the spatiotemporal evolution of the complex internal flow of the centrifugal compressor is captured under an unsteady operational state. The characteristics of pressure and velocity fluctuations in the centrifugal compressor are deeply analyzed by fast Fourier transform (FFT) spectral analysis, which reveals that with increasing Rd, the intake conditions are significantly improved at the diffuser inlet. The findings offer physical insights into enhancing the efficiency and lowest allowable mass flow rate of the centrifugal compressor by minimizing energy loss from airflow impacting the diffuser blades.
- Article
(15487 KB) - Full-text XML
- BibTeX
- EndNote
Centrifugal compressors are widely utilized in a variety of industrial fields, including coal, power and petrochemicals, owing to their excellent efficiency and reliability. Diffusers are a crucial component of centrifugal compressors and have the capacity to significantly increase the pressurization efficiency of the compressor. Diffusers are commonly classified into two types: vaned and vaneless. The former have a greater capacity for pressurization and a more compact construction. The airflow distribution at the impeller outlet is uneven, both in the circumferential and width directions, which affects the diffuser blades. A small gap between the impeller and vaned diffuser improves the intake conditions at the diffuser inlet domain. The aerodynamic performance of a centrifugal compressor is influenced by the gap size. The purpose of this paper is to clarify the effect of gap size on the aerodynamic performance of centrifugal compressors using numerical simulation.
Numerous studies have focused on understanding the physical mechanisms by which diffusers impact centrifugal compressors. Lawless (1994) and Zhang et al. (2020) investigated how vaneless and vaned diffusers influence rotating stalls in centrifugal compressors and through air injection to control it. Engeda (1997) studied three different types of diffusers (vaneless diffuser, conventional vaned diffuser and low solidity vaned diffuser) that affect the rotating stall and surge characteristics of centrifugal compressors. Skoch (2003, 2005) and Spakovszky (2004) explored the rotating stall in high-speed centrifugal compressors, enhancing the stability of centrifugal compressors through air injection. Han et al. (2014) employed numerical simulations to analyze the rotating stalls of centrifugal compressors equipped with vaned diffusers. The results showed that the geometry of the diffusers significantly influences the aerodynamic performance of centrifugal compressors. Justen et al. (1999) utilized experimental methods to investigate the unsteady flow phenomena in centrifugal compressors with variable-geometry vaned diffusers. Hildebrandt and Genrup (2007) investigated how changes in back sweep angles and width affect flow patterns at the outlet of centrifugal compressors with vaneless diffusers. Numerous studies have examined various geometries, including leading-edge slotted, half-guide vaned, pipe and low solidity vaned diffusers, to enhance diffuser performance (Zhang et al., 2019; Yoshinaga et al., 1987; Reeves, 1977; Mukkavilli et al., 2002). Li et al. (2023a) investigated the impact of boundary conditions on the diffuser with non-uniform velocity on the characteristics of the jet and the internal flow field. Li et al. (2022) investigated new design principles for the vaned diffusers and proposed some design reference principles for it. Engeda and Messele (2018) and Wang et al. (2018) applied intelligent methods to optimize three-dimensional vaned diffusers, although these techniques are difficult to implement in industrial settings. Kim et al. (2008) compared three vaned diffuser types, finding that the NACA 65-4A10 diffuser has better performance and satisfied a more comprehensive operating range. Zeng et al. (2023) proposed an inverse design method using the blade load distribution for diffuser design, although its application as a universal principle remains challenging.
Koth (1981) first examined the interference between the internal flows of the impeller and the vaned diffuser and discovered that the internal flow of the diffuser had a negligible effect on the impeller. Arndt et al. (1990) explored the vaned diffuser and centrifugal impeller interaction through an experimental study and discovered that the pressure fluctuation at the front of the diffuser blade decreases with increasing radial gaps between the impeller and diffuser. Justen et al. (1999) experimented by examining the effects of the installation angle and the radial position of diffuser blades on the rotor–stator interaction flow field; they found that the installation angle exerts a more significant influence on the pressure fluctuation of the flow field than the radial position. Ziegler et al. (2003a, b) investigated the interaction mechanism of the impeller-diffuser and found that it is possible to optimize the flow configuration in the diffuser channel by adjusting the radial gap ratio for each specific scenario. Boncinelli et al. (2007) conducted a numerical simulation to examine the interaction between the impeller and diffuser by utilizing experimental data from existing literature to aid their investigation. The numerical simulation results are highly consistent with Ziegler's experimental results. Xue et al. (2019) conducted multi-position dynamic pressure measurements on an industrial centrifugal compressor equipped with a variable vaned diffuser through experiments and simulations, and there was a small error between the experimental results and the simulation results. Chen et al. (2021) investigated the influence of the diffuser-to-impeller gap length on centrifugal compressor performance and found that a suitable extension of the gap length will positively impact the aerodynamic performance of the centrifugal compressor. However, excessive gap length will reduce the aerodynamic performance of the compressor. Liu et al. (2025) developed a novel CFD model for centrifugal pump impeller angular misalignment, quantifying progressive hydraulic degradation and amplified radial forces/pressure pulsations, validated via pump performance curves. Xu et al. (2022) established a flexible rotor dynamics model integrating unbalanced mass effects and bearing forces. They experimentally verified the frequency prediction accuracy and captured nonlinear vibration transitions in rotating systems.
The comprehensive literature review and observations indicate that the geometry of the diffuser and its interaction with the impeller significantly influence the aerodynamic performance of centrifugal compressors. While prior studies have established the general trend that larger radial gaps Rd improve flow uniformity and compressor stability, this study provides three novel insights: first, increasing Rd () significantly suppresses low-velocity zones at the impeller outlet, thereby enhancing flow uniformity in both the impeller and diffuser domains. Second, when Rd=1.14, high turbulent kinetic energy regions at the diffuser inlet are eliminated, reducing energy dissipation compared to Rd=1.06. Finally, fast Fourier transform analysis proves that larger Rd attenuates pressure/velocity fluctuation amplitudes, shifting dominant frequencies toward lower harmonics.
This paper is organized as follows: in Sect. 2, the numerical models and governing equations are first briefly described. After that, the detailed steady and unsteady numerical simulation results are discussed in Sect. 3. Finally, Sect. 4 summarizes some constructive conclusions.
2.1 Governing equations of fluid flow
The Reynolds-averaged equations, composed of the conservation laws of mass, momentum and energy, can be utilized to solve the flow field of the centrifugal compressor under steady and unsteady conditions. The three-dimensional compressible continuity equation is as follows (Li et al., 2023b):
where ρ is density, t is time and vr, vθ, vz are velocities in different directions.
The momentum conservation equation is as follows:
where p is pressure.
The total energy equation is as follows:
where K is the heat transfer coefficient of the fluid medium.
2.2 Turbulence model
In this study, the SSTk−ω turbulence model is implemented in the numerical simulations. The SST model utilizes the k−ω model near the wall and transitions to the k−ε model as it moves away from the boundary layer through a blending function. Bourgeois et al. (2014) determined the accuracy of the SST model, the SST-reattachment modification (RM) model, the k−e model, and the Speziale, Sarkar and Gatski Reynolds stress model (RSM-SSG). Their analysis identified the SST model as being suitable to predict the compressor performance (Ma et al., 2021; Zeng et al., 2023). The SSTk−ω turbulence model is mainly composed of turbulent kinetic energy and the specific dissipation rate; the expression is as follows (Li et al., 2024):
where k is the turbulent kinetic energy; ω is the specific dissipation rate; β∗, σk, γ, β, σω, and are constants; μt is the kinetic viscosity; and F1 is the mixing functions. vt is the kinematic eddy viscosity, the expression of which is as follows:
where a1 is the structural parameter, the value of which is 0.31, and F2 is the boundary layer mixing function.
Here, ui is the velocity vector in the x direction in Cartesian coordinates, τij is the Reynolds stress and δij is the Kronecker symbol. The model constants are calculated by the mixing function F1, which is expressed as follows:
where ϕ1 is the model constant of the k−ω original model, ϕ2 is the model constant of the k−ω standard model and ϕ is the model constant of the SST turbulence model. Other correlation functions are expressed as follows:
where v is the viscosity coefficient of molecular motion and y is the minimum distance to the wall.
2.3 Geometry and mesh generation
The centrifugal compressor model used in this study was simplified to include only the impeller, diffuser and volute. The main geometrical parameters of the simplified centrifugal compressor are shown in Table 1.
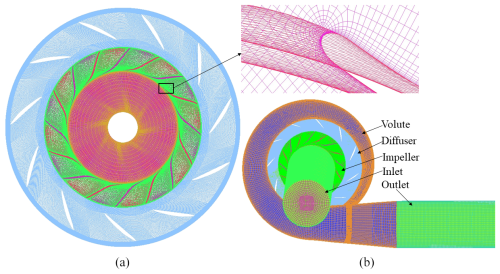
Figure 1Mesh of the centrifugal compressor: (a) impeller and diffuser and (b) whole computational domain.
In addition to mesh division for the impeller, diffuser and volute, necessary extensions at the inlet and outlet are essential to accurately define the boundary conditions. The whole computational domain is shown in Fig. 1.
Figure 1 shows the mesh of the centrifugal compressor. Figure 1a shows the mesh of the impeller and diffuser, as well as some detailed views of the impeller. Figure 1b shows the entire numerical simulation model. The green part at the top of the impeller is the extended inlet computational domain, and the green part at the volute outlet is the extended outlet computational domain. To improve the quality of the numerical simulation and obtain accurate information about the flow field, the mesh near the wall of the blade, which is displayed in an enlarged view, represents densification. In this research, the meshes of all components for the compressor are structured meshes.
The designed rotation speed and mass flow rate of the centrifugal compressor used in this numerical simulation are 18 000 rpm and 0.47 kg s−1, respectively. To investigate the relationship between the distance between the impeller blades and the diffuser and its effect on the aerodynamic performance of the compressor, three different diffusers were examined in a numerical model.
In the numerical simulation of centrifugal compressors, refinement of near-wall grids is crucial to ensure that y+ values meet the requirements of the SST k−ω model in ANSYS CFX (Ekradi and Madadi, 2020; Liu et al., 2022). The height of the first grid layer was set to m, whereby y+ values throughout the computational domain are all less than 5.
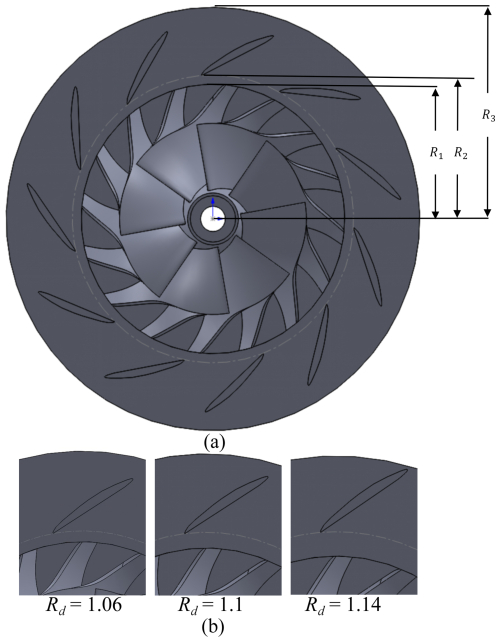
Figure 2Relative position relationship of impeller and diffusers with three different Rd values: (a) impeller and diffuser and (b) three different diffusers.
Figure 2 depicts the relative position relationship of the impeller and diffusers with three different Rd values. Figure 2a shows the impeller and the diffuser, where R1 represents the outlet radius of the impeller, R2 represents the inlet radius of the vaned diffuser and R3 represents the outlet radius of the vaned diffuser. R1 and R3 are constants, and is a dimensionless parameter that indicates the gap size between the impeller and vaned diffuser. Figure 2b exhibits the relative position of the impeller and diffuser for Rd values of 1.06, 1.1 and 1.14.
The radial gap ratios (Rd=1.06, 1.10, 1.14) represent three critical design philosophies within the dominant industrial range (). The lower bound Rd=1.06 approaches structural limits for compact configurations, below which blade vibration amplification and premature rotating stall occur. The upper bound Rd=1.14 corresponds to efficiency-optimized designs where further clearance expansion incurs casing size penalties and diffusion efficiency degradation.
2.4 Simulation settings
In this paper, all numerical simulations are carried out using the software ANSYS CFX 2022 R1. Throughout these simulations, the SST turbulent model is employed. The fluid medium selected is the ideal gas, with the reference pressure set to 0. At the boundary conditions, a non-slip boundary and a smooth wall are adopted, and the heat transfer is configured as adiabatic. For the inlet boundary condition, the total pressure and total temperature are specified, with values of 101 325 Pa and 288.15 K, respectively. The simulation environment is closely aligned with that of Li et al. (2024).
2.5 Verification of mesh independence
The accuracy of numerical simulations depends on the mesh quantity and quality. The mesh quality in this study exceeds 0.3, ensuring the accuracy of the numerical simulation. Increasing the number of meshes in the model enhances detail accuracy, but too many meshes will slow down the simulation. Therefore, it is imperative to conduct mesh independence tests to achieve an optimal equilibrium between computational fidelity and velocity.
Figure 3 illustrates the isentropic efficiency and pressure difference for six groups with varying grid numbers at the designed mass flow rate and Rd=1.1. The details of the mesh number for different components are shown in Table 2.
When the number of mesh cells is 1.63 million, the isentropic efficiency is 81.3 % and the pressure difference is 14.95 kPa. When the mesh resolution is increased to 3.0 million, the above values rise to 82.22 % and 15.25 kPa, respectively. Further refining the mesh to 3.79 million results in negligible changes. Therefore, when the number of mesh cells exceeds 3.0 million, its impact on the isentropic efficiency and pressure difference is negligible. Based on this result, 3.0 million mesh cells will be adopted in subsequent numerical simulations.
3.1 External characteristics of the centrifugal compressor
Rd is a crucial dimensionless parameter for a vaned diffuser equipped with centrifugal compressors. To investigate the effect of Rd on compressor aerodynamic performance, centrifugal compressors with three different Rd values were examined using numerical simulation.
Figure 4 presents the polytropic efficiency and the pressure differential curves for the centrifugal compressor. Figure 4a shows three polytropic efficiency curves: the blue curve denotes Rd=1.06, the red curve denotes Rd=1.1 and the yellow curve denotes Rd=1.14. The optimum efficiency point for all Rd values occurs at Q=0.47, which is consistent with the design. At the same mass flow rate, the polytropic efficiency of the compressor was determined to be maximum at Rd=1.14 and minimum at Rd=1.06 for the compressor. Figure 4b shows the pressure difference curves for the centrifugal compressor at three Rd values. Rd=1.14 yields the highest pressure difference, and Rd=1.06 results in the lowest at the same mass flow rate. As marked as the minimum allowable flow rate in the three curves, the minimum allowable mass flow rate is Q=0.41, 0.39 and 0.37 at Rd=1.06, 1.1 and 1.14, respectively. Consequently, the minimum allowable flow rate decreases as Rd increases.
The analysis of Fig. 4 shows that the polytropic efficiency and the pressure difference of the centrifugal compressor increase with increasing Rd at the same mass flow rate, and the minimum allowable mass flow rate of the centrifugal compressor decreases with increasing Rd. It is obtained that raising the value of Rd from 1.06 and 1.14 greatly enhances the aerodynamic performance of the compressor and increases its operating range, in alignment with the findings of Chen et al. (2021).
3.2 Axial and circumferential analysis of the velocity and pressure fields
Airflow from the impeller outlet is unevenly distributed, circumferentially and widthwise, impacting the vaned diffuser blades and causing impact losses.
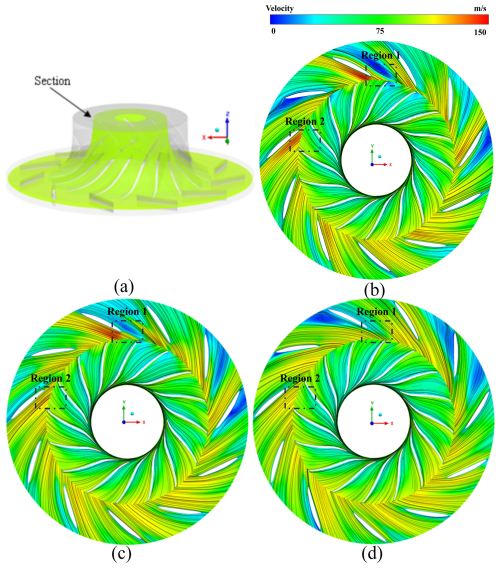
Figure 6Velocity streamline for the circumferential cross-section: (a) position, (b) Rd=1.06, (c) Rd=1.1 and (d) Rd=1.14.
Figure 5 illustrates the velocity and streamline distributions at the axial interface for Q=0.47. Figure 5a shows the location of the section. The streamline and velocity distributions for Rd=1.06, 1.1 and 1.14 are presented in Fig. 5b, c and d, respectively. This analysis focuses on the variations in velocity and streamline patterns across three different Rd values in regions 1 and 2. In region 1, for Rd=1.06, there is a significant loss of energy in the mainstream resulting from low-velocity zones on the pressure surface of the blades caused by the uneven distribution of airflow width at the impeller outlet. At Rd=1.1, uneven distribution of the airflow at the impeller outlet in the width direction is improved, although the low velocity persists on the pressure surface of the vaned diffuser blades. As Rd increases to 1.14, airflow from the impeller outlet becomes uniform, and the low-speed airflow mass disappears. In region 2, The shape of the vaned diffuser primarily influences the velocity and streamline distributions. At Rd=1.06, the diffuser blade causes fluctuations in airflow velocity in the affected section. As the diffuser blade extends outward for Rd=1.1 and Rd=1.14, its influence on the flow field velocity diminishes due to the increased distance from the section.
Figure 6 indicates the velocity and streamline distributions at the circumferential section at 50 % blade height for Q=0.47. Figure 6a shows the location of the cross-section in the centrifugal compressor. Figure 6b, c and d present the streamline and velocity distributions for Rd values of 1.06, 1.1 and 1.14, respectively. As shown in Fig. 6b, it is easily observed that many low-velocity regions and high-velocity regions in the flow passage of the diffuser obstruct the mainstream and lead to energy losses. As shown in Fig. 6c, one can see that when Rd increased to 1.1, the regions of low-velocity airflow and the high-velocity region significantly decreased but still exist in region 1 and region 2. These internal flow phenomena reveal the internal mechanism of efficiency increase and operating margin widening with the increase in Rd. Additionally, low-velocity airflow on the suction surface of the trailing edge in the impeller domain for Rd=1.06, which obstructed the airflow in the impeller domain, is newly found. As Rd increases to 1.1, the low-velocity airflow gradually disappears.
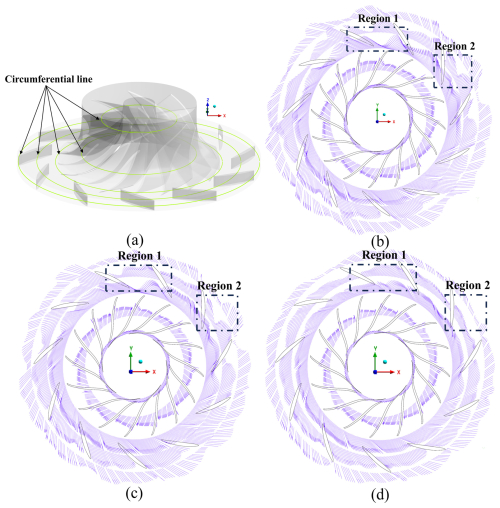
Figure 7Absolute velocity vector for the circumferential line: (a) position of the circumferential line, (b) Rd=1.06, (c) Rd=1.1 and (d) Rd=1.14.
In region 1, plotted in Fig. 6d, the high-velocity region and low-velocity region in the diffuser domain noticeably decrease as Rd increases to 1.14, and the flow paths of the diffuser exhibit good overall permeability. The low-velocity airflow on the suction surface of the trailing edge in the impeller domain disappears, and the airflow in the impeller outlet becomes uniform. Increased Rd provides sufficient diffusion length for impeller wake energy dissipation before entering the diffuser passage. This mitigates jet-wake distortion impacts on the diffuser blades, as evidenced by suppressed velocity gradients in the circumferential distributions.
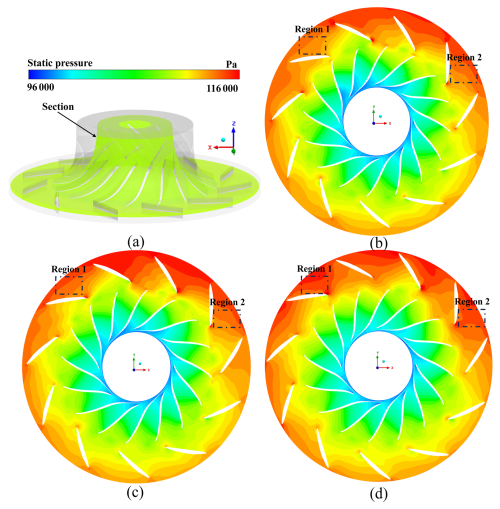
Figure 8Static pressure for the circumferential section: (a) position of the section, (b) Rd=1.06, (c) Rd=1.1 and (d) Rd=1.14.
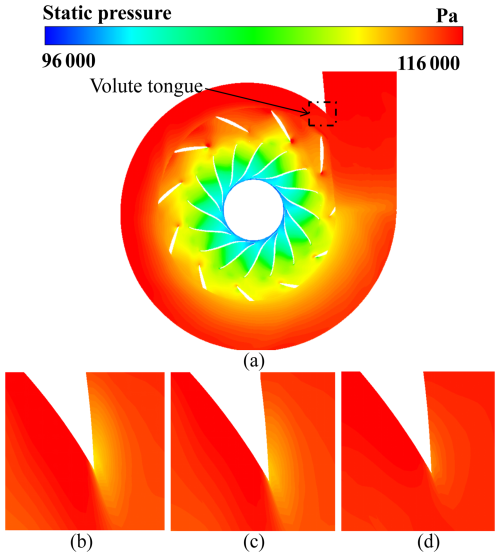
Figure 9Pressure field near the volute tongue for different Rd values: (a) position of the section, (b) Rd=1.06, (c) Rd=1.1 and (d) Rd=1.14.
An analysis of the absolute velocity vectors is carried out to further understand the mechanism of the influence of Rd on the internal flow of centrifugal compressors. Figure 7 depicts the distribution of the absolute velocity vector at the circumferential section at 50 % blade height for Q=0.47. Figure 7b, c and d present distributions of the absolute velocity vectors for Rd values of 1.06, 1.1 and 1.14, respectively. The arrow and its length indicate the magnitude and direction of the absolute velocity. The distribution of velocity vectors offers an intuitive understanding of internal flow separation in the impeller and diffuser. It is evident by examining the diffuser's absolute velocity vector distribution that changing Rd causes the absolute velocity vector distributions to fluctuate significantly. Figure 7b displays the uneven distribution of absolute velocity vectors around the circumference of the impeller outlet. There might be inhomogeneous airflow in region 1, which could affect losses on the diffuser blades owing to the absolute velocity vector being shorter in length on the suction side and greater in length on the pressure side of the diffuser blade. Similarly, in region 2, the distribution of absolute velocity vectors in the middle of the diffuser is not uniform. As displayed in Fig. 7c, there is gradual uniformity in the absolute velocity vector distribution within the diffuser, although the airflows in regions 1 and 2 are still not uniform. As Rd increases to 1.14, Fig. 7d shows that the absolute velocity vector distribution at the inlet becomes more uniform, aligning closely with the diffuser blade design, and noticeably reduces fluctuations within the diffuser. The improved flow uniformity at larger Rd stems from reduced impeller wake distortion. At Rd=1.06, jet-wake structures directly impact the diffuser blades, creating secondary flows (region 1). Larger Rd allows wake dissipation before diffuser entry, enabling circumferential momentum redistribution.
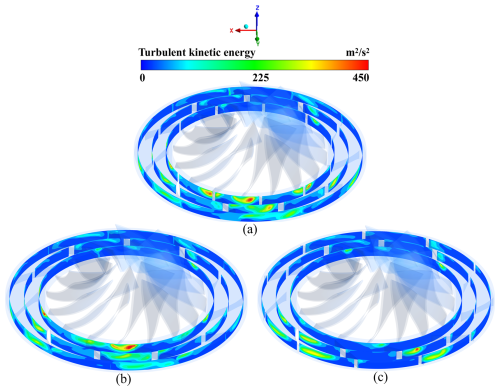
Figure 10Circumferential surface distributions of TKE in the diffuser: (a) Rd=1.06, (b) Rd=1.1 and (c) Rd=1.14.
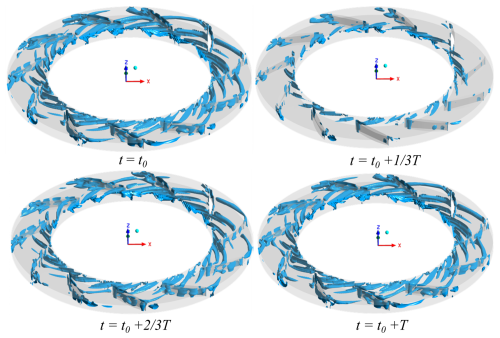
Figure 11Temporal evolution of the vortex structure (Q-criterion) in a diffuser with Rd=1.1 and Q=0.47.
Figure 8 shows the static pressure distributions at the circumferential section at 50 % blade height for Q=0.47. The airflow entering the vaned diffuser from the impeller quickly transforms dynamic pressure into static pressure. Figure 8b, c and d present distributions of static pressure for Rd values of 1.06, 1.1 and 1.14, respectively. It is evident that an increase in Rd enhances the efficiency of converting dynamic pressure into static pressure in the airflow within the diffuser. As displayed in Fig. 8b, the static pressure is most minimal in regions 1 and 2, where the conversion efficiency is lowest. As displayed in Fig. 8c, the conversion efficiency is enhanced as Rd increases. As displayed in Fig. 8d, the conversion efficiency reaches peaks in these regions as Rd increases to 1.14. Increased Rd optimizes the coordination between the inflow direction and diffuser blade geometry, minimizing leading-edge flow separation through attenuated adverse pressure gradients. The effect is conclusively demonstrated by the elimination of low-pressure zones at the diffuser throat, where the most pronounced flow separation previously occurred under smaller Rd configurations.
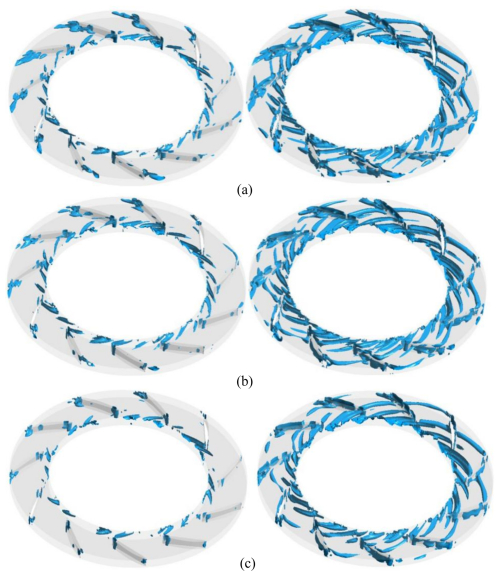
Figure 12The most and the fewest vortex structures in the diffuser region: (a) Rd=1.06, (b) Rd=1.1 and (c) Rd=1.14.
Figure 9 shows the pressure field near the volute tongue for different Rd values with Q=0.47. The non-uniform pressure field due to the volute tongue quickly decreases as Rd increases. Figure 9b, c and d present the pressure field near the volute tongue for Rd values of 1.06, 1.1 and 1.14, respectively. As displayed in Fig. 9b, the pressure field near the volute tongue fluctuates considerably. As illustrated in Fig. 9c, upon Rd reaching 1.1, a slight decline in the pressure field fluctuation near the volute tongue occurs. Further, as shown in Fig. 9d, when Rd is increased to 1.14, a substantially more pronounced reduction in the pressure field fluctuation within the identical region is evident.
Subsequent to the analysis, it is inferred that the augmentation of the Rd value facilitates the amelioration of inlet airflow conditions within the diffuser, thereby substantially mitigating the impact losses attributed to the airflow on the diffuser blades, which culminates in the amplification of the performance of the centrifugal compressor.
3.3 Analysis of turbulent kinetic energy
Turbulent kinetic energy (TKE) is typically employed to evaluate the intensity of turbulent fluctuations, positively correlated with velocity fluctuations and indicative of energy dissipation in the flow region. The equation for TKE is
where K represents the turbulent kinetic energy, v indicates velocity and I represent the intensity of turbulent flow.
Figure 10 displays the distribution of TKE over three circumferential surfaces within the diffuser domain for three different Rd values at Q=0.47.
Figure 10a demonstrates the turbulent kinetic energy (TKE) distribution at Rd=1.06, revealing intense energy dissipation in the circumferential section of the diffuser inlet. This phenomenon primarily stems from wake–impeller interaction suppression: close proximity amplifies impeller wake impacts on diffuser blades, generating high-shear layers and secondary flows that elevate TKE production. As Rd increases to 1.1 (Fig. 10b), TKE concentration decreases significantly due to improved flow alignment. Larger Rd allows circumferential velocity homogenization before diffuser entry, aligning inflow angles with the blade geometry. At Rd=1.14 (Fig. 10c), high TKE regions virtually disappear as energy dissipation transitions from turbulence-dominated to pressure-recovery-dominated regimes.
3.4 Unsteady flow of the centrifugal compressor
This subsection analyzes the complex internal flow characteristics of the centrifugal compressor by numerical simulation at different values of Rd. Time steps below s (corresponding to 2° of impeller rotation) induce negligible changes in isentropic efficiency and pressure rise. Smaller steps significantly increase computational costs without improving accuracy. Therefore, this value was adopted for unsteady simulations, representing of the rotational period. The stability operation data after 16 rotations of the centrifugal compressor were chosen for data analysis to ensure the accuracy of the numerical simulation.
To precisely identify the flow-separation phenomenon in the diffuser domain, the Q-criterion was employed to analyze the spatiotemporal evolution of the vortex. The value of Q denotes the region occupied by the vorticity; a negative value indicates a region dominated by the strain rate or viscous stress (Xu et al., 2022). Therefore, the isosurfaces of the Q value can accurately represent the structure of turbulence. The equation of the Q-criterion is described as follows:
where Sij denotes the strain rate tensor and Ωij represents the vorticity tensor.
Figure 11 captures the temporal evolution of vortex structures within the diffuser domain, revealing the complex internal flow at a Q level of 0.01. t0 marks the moment at which the impeller completes 20 revolutions, t represents the current time and T denotes the time required for one full revolution of the impeller. Figure 11 depicts the evolution of the vortex structure distribution in the diffuser between the 20th and 21st impeller rotations. At t=t0, the Q value was 5.06×10⁶ [s−2], and numerous vortices were observed simultaneously on the suction and pressure surfaces of the diffuser blades, in the flow passages, and at the diffuser inlet. These obstructions to the prevailing airflow led to energy losses. As time evolved to , the Q value reached 1.38×10⁷ [s−2]. At this time, the vortex regions were observed to have decreased significantly compared to their state at t0. Only a limited number of vortices were found at the diffuser inlet and along the leading and trailing edges of the vaned diffuser blades. As time evolved to , the Q value decreased to 6.18×10⁶ [s−2], and vortices were observed to reappear in the flow passage and on both the suction and pressure surfaces of the diffuser blades, though their number remained lower than at t=t0. At , the distribution of vortex structures mirrored that at t=t0. For Rd=1.06 and Rd=1.14, the spatiotemporal evolution characteristics of the vortex structure are well consistent with 1. The above phenomenon indicates that the distribution pattern of the vortex structure is periodic.
Figure 12 presents the variation in vortex structure density within the diffuser domain across different Rd values. Figure 12a, b and c depict the vortex structures for Rd=1.06, 1.1 and 1.14, respectively. Quantitative analysis revealed that the vortex density declined with increasing Rd. The maximum density occurred at Rd=1.06; the Q value min was 4.11×10⁶ [s−2], and the max was 1.35×10⁷ [s−2]. A slight decrease was evident at Rd=1.1; the Q value min was 4.20×10⁶ [s−2], and the max was 1.40×10⁷ [s−2]. The minimum vortex density was found at Rd=1.14; the Q value min was 4.24×10⁶ [s−2], and the max was 1.42×10⁷ [s−2].
Figure 13 illustrates the locations of monitoring points for measuring the pressure and velocity. Points 1 to 4 are situated in the diffuser region, 5.96 mm from the reference plane Z, while points 5 and 6 are in the volute region, 20 mm from the reference plane Z.
Figure 14 shows the pressure fluctuations and their amplitude spectrum of monitoring points at three different Rd values and Q=0.47. Figure 14a, b and c present the pressure fluctuation characteristics for Rd values of 1.06, 1.1 and 1.14, respectively. It is observed that the pressure fluctuation curves at each monitoring point exhibit periodic behavior, further verifying that the pressure fluctuations in the diffuser and the volute are periodic. The pressure fluctuations at points 5 and 6 are substantially less than those at the other monitoring locations because they are near the outlet of the volute and away from the impeller. Analyzing the variations in pressure fluctuation amplitudes at six monitoring points across three different Rd values reveals a clear trend: the pressure fluctuation amplitudes decrease as Rd increases. The above phenomena verify that the airflow becomes more uniform as Rd increases from 1.06 to 1.14.
Figure 15a, b and c present the amplitude spectrum of pressure fluctuations based on the fast Fourier transform (FFT) at monitoring points for Rd values of 1.06, 1.1 and 1.14, respectively. The x axis results from the dimensionless normalization of the frequency relative to the rotational frequency of the impeller. The y axis denotes the different monitoring points. The z axis represents the amplitude. As illustrated by the three figures above, the rotational frequency of the impeller and its multipliers are the dominant characteristic frequencies of pressure fluctuations for the monitoring points. The amplitude changes with frequency for neighboring monitoring points in Fig. 15a and b are almost identical. In Fig. 15c, the amplitudes at all monitoring points are significantly lower than in the other figures. This suggests that the stability of the pressure improves with increasing Rd.
Figure 16 shows the velocity fluctuation and the amplitude spectrum of monitoring points at three different Rd values and Q=0.47. Figure 16a, b and c present velocity fluctuation characteristics for Rd values of 1.06, 1.1 and 1.14, respectively. In Fig. 16a and c, points 5 and 6 are located close to the outflow of the volute and distant from the rotating center, experiencing a significant drop in velocity. Velocity fluctuation curves at all monitoring points exhibit periodic behavior. The fluctuation curves of points 1 and 2 are almost overlapping. In Fig. 16b, points 1 and 4 are situated on the pressure surface of the blade, while points 2 and 3 are located on the suction surface. Consequently, the average velocity at points 2 and 3 is higher than at points 1 and 4.
Figure 17a, b and c show the FFT analysis of velocity fluctuations at all monitoring points for different Rd values. The dominant characteristic frequencies are the impeller's rotational frequency and its octave, which are similar to the FFT of pressure fluctuations. The variation in amplitude at points 5 and 6 is minimal.
The spectral characteristics revealed by FFT analysis qualitatively correlate with the acoustic performance. Pressure fluctuation harmonics at blade-passing frequencies exhibit amplitude attenuation with increasing Rd, suggesting reduced discrete tone generation. Concurrently, suppression of sub-synchronous velocity fluctuation energy correlates with diminished broadband noise excitation sources. These spectral modifications align with improved flow uniformity observed in circumferential distributions, indicating potential acoustic benefit.
This study conducts numerical simulations to analyze the aerodynamic performance of the centrifugal compressor, examining both steady and unsteady flow characteristics with three different Rd values. The primary findings are outlined as follows.
First of all, the aerodynamic performance of centrifugal compressors can be significantly improved by increasing Rd, as it reduces the energy lost from airflow collisions and the structural stress carried on by airflow pulsation. Additionally, the operational range of the compressor is effectively expanded by increasing the pressure differential between the inlet and outlet of the centrifugal compressor. The impact of Rd on the aerodynamic performance of the compressor shows a high degree of consistency with previous research findings.
Furthermore, the study of the mechanism of the centrifugal compressor is mainly affected by Rd through internal flow field analysis. The velocity and streamline distributions demonstrate that with increases in Rd, as the diffuser blades extend outward, the intake conditions are enhanced and minimize the impact loss produced by the airflow colliding with the diffuser blade. In addition, a new finding is that Rd not only affects the airflow in the diffuser inlet area but also the airflow in the impeller outlet area. The distribution of static pressure shows that increasing Rd will enhance the pressurization effect in centrifugal compressors. According to the distribution of turbulent kinetic energy, the diffuser domain exhibits a notable region of high turbulence at Rd=1.06, which results in a significant loss of kinetic energy.
Finally, the temporal evolution analysis of the centrifugal compressor suggests the periodicity of the velocity and pressure. The characteristics of the pressure and velocity fluctuation distribution at various monitoring locations with varying Rd values show that increases in Rd will decrease both pressure and velocity fluctuation. Therefore, the internal complex flow characteristics of a centrifugal compressor are improved by increasing the value of Rd. In addition, the rotational frequency of the impeller and its multipliers are the dominant characteristic frequencies of pressure fluctuations, so the main noise resource of the diffuser is the rotational impeller.
The numerical simulations for this study were conducted using the commercial software ANSYS CFX 2022 R1. The specific simulation case files and data resulting from this proprietary software can be made available from the corresponding author upon reasonable request.
JC led the study conceptualization, original draft preparation and data curation. YZ assisted in data collection and validation. ZW and HY jointly performed critical review, editing and language refinement. ZZ optimized the visualization and figure design. YW coordinated the project administration and supervised the research execution. All authors reviewed and approved the final paper.
The contact author has declared that none of the authors has any competing interests.
Publisher’s note: Copernicus Publications remains neutral with regard to jurisdictional claims made in the text, published maps, institutional affiliations, or any other geographical representation in this paper. While Copernicus Publications makes every effort to include appropriate place names, the final responsibility lies with the authors.
This research has been supported by the National Natural Science Foundation of China (grant no. U22A20589), the Zhejiang University Student Science and Technology Innovation Activity Plan (grant no. 2021R1009), the Natural Science Foundation of Zhejiang Province (grant no. LZ22E060002), the Science and Technology Plan Project of Zhejiang Province (grant no. LGG21E060003), and the Science and Technology Key Plan Project of Zhejiang Province (grant no. 2021C01049 and 2022C01227).
This paper was edited by Liangliang Cheng and reviewed by two anonymous referees.
Arndt, N., Acosta, A. J., Brennen, C. E., and Caughey, T. K.: Experimental Investigation of Rotor-Stator Interaction in a Centrifugal Pump With Several Vaned Diffusers, J. Turbomach., 112, 98–108, https://doi.org/10.1115/1.2927428, 1990.
Boncinelli, P., Ermini, M., Bartolacci, S., and Arnone, A.: Impeller-Diffuser Interaction in Centrifugal Compressors: Numerical Analysis of Radiver Test Case, J. Propul. Power, 23, 1304–1312, https://doi.org/10.2514/1.27028, 2007.
Bourgeois, J. A., Martinuzzi, R. J., Savory, E., Zhang, C., and Roberts, D. A.: Assessment of Turbulence Model Predictions for an Aero-Engine Centrifugal Compressor, ASME J. Turbomach., 136, 107–117, https://doi.org/10.1115/1.4001136, 2014.
Chen, X., Xu, W., Yang, S., Du, Y., and Dou, H. S.: Effects of vaneless region length on the performance of centrifugal compressor with vaned diffuser, J. Braz. Soc. Mech. Sci., 43, 277, https://doi.org/10.1007/s40430-021-02952-3, 2021.
Ekradi, K. and Madadi, A.: Performance improvement of a transonic centrifugal compressor impeller with splitter blade by three-dimensional optimization, Energy, 201, 117582, https://doi.org/10.1016/j.energy.2020.117582, 2020.
Engeda, A.: Comparative rotating stall and surge characteristic of a centrifugal compressor with three different types of diffusers, in: Proc. ASME 1997 Int. Gas Turbine Aeroengine Congr. Exhib., Orlando, FL, USA, 2–5 June 1997, 97-GT-245, https://doi.org/10.1115/97-GT-245, 1997.
Engeda, A. and Messele, M.: Investigation of Three Types of Diffusers for a Centrifugal Compressor Stage, AIAA Aerospace Sciences Meeting, https://doi.org/10.2514/6.2018-0073, 2018.
Han, G., Lu, X. G., Zhao, S. F., Yang, G. W., and Zhu, J. Q.: Parametric studies of pipe diffuser on performance of a highly loaded centrifugal compressor, J. Eng. Gas Turbines Power, 136, 122604, https://doi.org/10.1115/1.4027867, 2014.
Hildebrandt, A. and Genrup, M.: Numerical investigation of the effect of different back sweep angle and exducer width on the impeller outlet flow pattern of a centrifugal compressor with vaneless diffuser, J. Turbomach., 129, 421–433, https://doi.org/10.1115/1.2447873, 2007.
Justen, F., Ziegler, K. U., and Gallus, H. E.: Experimental investigation of unsteady flow phenomena in a centrifugal compressor vaned diffuser of variable geometry, J. Turbomach., 121, 763–771, https://doi.org/10.1115/1.2836730, 1999.
Kim, H. W., Park, J. I., Ryu, S. H., Choi, S. W., and Ghal, S. H.: The Performance Evaluation With Diffuser Geometry Variations of the Centrifugal Compressor in a Marine Engine (70MW) Turbocharger, J. Eng. Gas Turbines Power, 131, 012201, https://doi.org/10.1115/1.2967733, 2008.
Koth, H.: A study on centrifugal impeller and vaned diffuser flow, J. Eng. Gas Turbines Power, 103, 688–697, https://doi.org/10.1115/1.3230791, 1981.
Lawless, P. B.: An analytical and experimental investigation of the active control of rotating stall in a low speed centrifugal compressor, PhD thesis, Purdue University, ProQuest Dissertations & Theses Global, AAI9420860, https://docs.lib.purdue.edu/dissertations/AAI9420860/ (last access: 14 October 2025), 1994.
Li, K., Song, L., Zhang, X., Wang, Q., and Hua, J.: Study of Influence of Boundary Condition of Diffuser with Non-Uniform Velocity on the Jet Characteristics and Indoor Flow Field, Energies, 16, 1079, https://doi.org/10.3390/en16031079, 2023a.
Li, Q., Sun, Z., Lu, X. G., Zhang, Y., and Han, G.: Investigation of New Design Principles for the Centrifugal Compressor Vaned Diffusers, Int. J. Aerosp. Eng., 2022, 4480676, https://doi.org/10.1155/2022/4480676, 2022.
Li, Y., Zhang, B., Chen, Y., Wang, Z., Yang, H., and Wei, Y.: Temporal Flow Characteristics of Three-Dimensional Centrifugal Impeller Suction System at Vacuum Conditions, J. Appl. Fluid Mech., 16, 2540–2555, https://doi.org/10.47176/jafm.16.12.1875, 2023b.
Li, Y., Zhang, J., Liu, Z., Shu, Y., Wang, Z., Yang, H., Zhang, W., and Wei, Y.: Spatiotemporal characteristics of rotating stall in a centrifugal compressor with a volute at low-flow rate conditions, Phys. Fluids, 36, 037152, https://doi.org/10.1063/5.0197097, 2024.
Liu, C. Y., Tong, Z. T., Ju, P. F., and Zhang, C.: Effect of Tip Clearance on Aerodynamic Performance of Supercritical Carbon Dioxide Centrifugal Compressor, Turbine Technology, 64, 183–186+176, https://doi.org/10.3969/j.issn.1001-5884.2022.03.007, 2022.
Liu, J., Fan, W., Huang, S., Wu, Z., Zhou, H., Chai, W., and Zheng, W.: The hydrodynamic characteristics analysis of a centrifugal pump with the impeller angular misalignment fault, Proc. Inst. Mech. Eng. Part A J. Power Energy, 239, 639–652, https://doi.org/10.1177/09576509251322359, 2025.
Ma, Y., Qian, B., Feng, Z., Wang, X., Shi, G., Liu, Z., and Liu, X.: Flow behaviors in a Kaplan turbine runner with different tip clearances, Adv. Mech. Eng., 13, I–15, https://doi.org/10.1177/16878140211015879, 2021.
Mukkavilli, P., Raju, G. R., Dasgupta, A., Murty, G. V. R., and Jagadeshwar Chary, K. V.: Flow Studies on a Centrifugal Compressor Stage With Low Solidity Diffuser Vanes, ASME Turbo Expo 2002: Power for Land, Sea, and Air, Amsterdam, Netherlands, 3–6 June 2002, GT2002-30386, https://doi.org/10.1115/GT2002-30386, 2002.
Reeves, G. B.: Design and Performance of Selected Pipe-Type Diffusers, ASME International Gas Turbine Conference and Products Show, Philadelphia, USA, 27–31 March 1977, 77-GT-104, https://doi.org/10.1115/77-GT-104, 1977.
Skoch, G. J.: Experimental investigation of centrifugal compressor stabilization techniques, J. Turbomach. 125, 704–713, https://doi.org/10.1115/1.1624846, 2003.
Skoch, G. J.: Experimental investigation of diffuser hub injection to improve centrifugal compressor stability, J. Turbomach., 127, 107–117, https://doi.org/10.1115/1.1812779, 2005.
Spakovszky, Z. S.: Backward traveling rotating stall waves in centrifugal compressors, J. Turbomach., 126, 1–12, https://doi.org/10.1115/1.1643382, 2004.
Wang, J., Wen, S., Wang, W., and Xi, G.: Intelligence design method for three-dimensional vaned diffusers in a centrifugal compressor, P. I. Mech. Eng. A-J. Pow., 232, 674–690, https://doi.org/10.1177/0957650917750713, 2018.
Xu, Y., Liu, J., Li, X., and Tang, C.: An Investigation of Vibrations of a Flexible Rotor System with the Unbalanced Force and Time-Varying Bearing Force, J. Vib. Control, 35, 3495–3509, https://doi.org/10.1186/s10033-025-01186-x, 2022.
Xue, X., Wang, T., Shao, Y., Yang, B., and Gu, C.: Experimental and Numerical Analysis of Different Unsteady Modes in a Centrifugal Compressor With Variable Vaned Diffuser, J. Fluids Eng., 141, 101106, https://doi.org/10.1115/1.4043273, 2019.
Yoshinaga, Y., Kaneki, T., Kobayashi, H., and Hoshino, M.: A Study of Performance Improvement for High Specific Speed Centrifugal Compressors by Using Diffusers With Half Guide Vanes, J. Fluids Eng., 109, 359–366, https://doi.org/10.1115/1.3242672, 1987.
Zhang, L., He, R. Y., Wang, S. L., and Zhang, Q.: A review of rotating stall in vaneless diffuser of centrifugal compressor, J. Therm. Sci. 29, 323–342, https://doi.org/10.1007/s11630-020-1261-y, 2020.
Zhang, Y. J., Lu, X. G., Zhang, Y. F., Han, G. and Zhu, J. Q.: Parametric study of slotted diffuser effects on a highly loaded centrifugal compressor, Proc. IMechE A: J. Power Energy, 233, 702–714, https://doi.org/10.1177/0957650918824013, 2019.
Zeng, Y., Wang, H., Sun, M., Wang, C., and Liu, X.: SST turbulence model improvements: Review, Acta Aeronaut. Astronaut. Sin., 44, 98–129, https://doi.org/10.7527/s1000-6893.2022.27411, 2023.
Ziegler, K. U., Gallus, H. E., and Niehuis, R.: A Study on Impeller-Diffuser Interaction–Part II: Detailed Flow Analysis, J. Turbomach., 125, 183–192, https://doi.org/10.1115/1.1516815, 2003a.
Ziegler, K. U., Gallus, H. E., and Niehuis, R.: A Study on Impeller-Diffuser Interaction–Part I: Influence on the Performance, J. Turbomach., 125, 173–182, https://doi.org/10.1115/1.1516814, 2003b.


