the Creative Commons Attribution 4.0 License.
the Creative Commons Attribution 4.0 License.
 | 08 May 2024
Research on the optimal speed of vehicles passing speed bumps on the highway based on an immune algorithm
Zhiyong Yang
Ruixiang Zhang
Zihang Guo
Jieru Guo
Yu Zhou
With the advancement of vehicle technology, there is a growing demand for vehicle comfort in addition to the focus on safety and functionality. On certain accident-prone sections of highways, such as entrance and exit ramps, tunnels, and downhill stretches, continuous speed bumps are typically installed to remind vehicles to reduce their speed. However, while enhancing safety, these measures also introduce a degree of discomfort for passengers and drivers alike. Vehicle speed and the type of road speed bump are key factors influencing vehicle comfort. In order to improve the ride comfort, this paper investigates the problem of adaptive speed control for vehicles passing over different types of continuous speed bumps and proposes a method for solving the optimal speed. In this research, a 4-degree-of-freedom vehicle suspension model and a road excitation model are employed to simulate vehicle vibrations. Simulation optimisation is performed using MATLAB in conjunction with an immune algorithm to obtain the optimal vehicle speeds for traversing three types of continuous speed bumps – sinusoidal, rectangular, and trapezoidal – while adhering to specified constraints. The simulation results demonstrate that this optimisation algorithm effectively enhances the ride comfort of vehicles when navigating speed bumps. The algorithm, when applied, reduces vehicle vertical displacement, acceleration, suspension deflection, and tyre load to varying degrees when crossing speed bumps. It also reduces tyre ground clearance to some extent, achieving a balance between comfort and safety. Furthermore, the study identifies the range of comfortable vehicle speeds for traversing these three types of speed bumps, providing valuable insights for selecting the appropriate speed bump design on roads with varying speed limits.
- Article
(6002 KB) - Full-text XML
- BibTeX
- EndNote


Intelligent driving technology has progressively matured with the rapid development of a new generation of information technology and has developed into a practical application. The driving comfort and safety of the vehicle are crucial as a product for real-world applications. However, the majority of current research on the comfort of vehicles has been carried out with vehicles travelling on flat surfaces, such as in route planning (Motallebi et al., 2020) and suspension optimisation (Gao and Qi, 2021). There are few studies on the comfort and safety of vehicles when passing over uneven surfaces, especially when it comes to passing speed bumps. When drivers encounter speed bumps while driving, they rapidly identify the type of speed bump and adjust their vehicle's speed based on their subjective experience to minimise discomfort during passage (Barreno et al., 2022). In the case of semi-automated driving, forward-facing cameras are used to detect speed bumps on the road ahead, and the driving assistance system assists the driver in adjusting the vehicle's speed to reduce vehicle vibrations (Zein and Darwiche, 2020). However, vehicles lack the capability for subjective evaluation, making it challenging to adjust to an appropriate speed based on comfort requirements when encountering speed bumps. This presents a significant hurdle in achieving the optimal balance between driving comfort and safety.
The discomfort experienced during rides primarily arises from vertical vibrations induced by uneven road surfaces, and vehicle speed also affects the intensity of the vibrations. Therefore, the enhancement of ride comfort predominantly focuses on the suppression of vertical vibrations due to the presence of the driver. The suspension system, as a crucial component ensuring comfort, can absorb vibrations generated by road disturbances and has become an active area of research. To date, numerous studies have been conducted on suspension systems. Researchers such as Yan et al. (2019) have applied H∞ suspension control to quarter-vehicle active-suspension systems to dampen vibrations, thereby enhancing vehicle handling stability and driver safety; however, considering road incentives to be disturbances has limited the guidance of road information. Mahmoodabadi et al. (2020) proposed a method based on optimal fuzzy adaptive robust proportional–integral–derivative (PID) controllers, aiming to minimise the relative displacement between the vehicle body acceleration and tyre spring mass, thereby improving active-suspension performance and ride comfort. Nguyen and Nguyen (2022a) proposed a state-multivariable-based sliding-mode PID-integrated suspension control method combined with a quarter-dynamics model, significantly reducing spring mass displacement and acceleration and thus enhancing vehicle stability and comfort. Further research introduced the optimised sliding-mode control (OSMC) algorithm to control the operation of active-suspension systems, substantially improving vehicle oscillations on uneven road surfaces while effectively preventing wheel separation, further enhancing ride comfort (Nguyen and Nguyen, 2022b). Additionally, an AFSPIDF active-suspension control algorithm, blending PID, SMC, and various fuzzy algorithms, successfully suppressed vehicle vibrations, significantly reducing vertical body displacement and acceleration and ultimately enhancing vehicle stability and comfort (Nguyen and Nguyen, 2023). However, due to the complexity of vehicle systems, the above researchers mainly utilised a quarter-vehicle model in studying ride comfort and safety. Nonetheless, the quarter-vehicle model can only investigate vehicle motion in the vertical direction, overlooking many crucial vehicle vibration characteristics and thus making it challenging to fully capture vehicle system information (Yang et al., 2015). Moreover, the use of more complex models would increase the difficulty of mathematical modelling and dynamic analysis. Therefore, employing the 4-degree-of-freedom (4-DOF) nonlinear vehicle suspension model is a moderately complex yet closer-to-reality approach, enabling more accurate acquisition of vehicle feedback information and providing precise adjustment solutions for vehicles navigating different speed bumps.
For advanced intelligent vehicles, their sensors and network systems have the capability to acquire information about the road ahead. Consequently, based on this context, researchers have proposed novel approaches. For instance, drawing upon road information obtained from networks and forward sensors, Wu et al. (2020) introduced a comfort optimisation strategy capable of coordinating speed variations and suspension vibrations. This approach utilised a hybrid horizon variance (HV) model predictive control (MPC) method, resulting in enhanced comfort for passive suspension vehicles operating at a fixed speed. Building upon this foundation, Liu et al. (2023) developed an integrated approach based on road information, combining preview active-suspension control and longitudinal velocity planning. This integrated approach employed a road-information-based semi-explicit model predictive controller (SE-MPC) for active-suspension control, further elevating the ride comfort of autonomous vehicles. Huang et al. (2023) and others approached the problem from the perspective of adaptive nonlinear control, introducing a novel suspension control method. Leveraging X-shaped biomimetics inspired by the skeletal structures of animals or insects and utilising road information to solve multi-objective optimisation problems, this method significantly enhanced vehicle comfort.
It is evident that forward road information is paramount for speed adjustment, particularly when considering ride comfort. However, current research has not adequately addressed whether speed planning can achieve optimal comfort when navigating uneven road surfaces, especially over speed bumps. In various road segments, such as tunnel entrances, downhill slopes, and pedestrian areas, speed bumps are commonly deployed to control vehicle speed and to enhance the safety of both vehicles and pedestrians. These speed bumps come in different shapes, including rectangular, semi-sinusoidal, and trapezoidal designs. However, current research concerning vehicle traversal of speed bumps predominantly focuses on trapezoidal speed bumps, with limited exploration of other shapes (Walavalkar et al., 2021; Miracle et al., 2021). In fact, different shapes of speed bumps have different optimal passing speeds, and the study of trapezoidal speed bumps alone is relatively homogeneous and lacks universality. In addition, there are different speed limits at different road locations, and the study of what kind of speed bumps should be laid on different speed-limited sections is relatively limited. Hence, conducting research on the optimal vehicle speeds for driving vehicles to navigate different speed bump shapes holds significant importance. Such research endeavours contribute to enhancing the comfort and safety of vehicles, facilitating their adaptation to the diverse road conditions and speed limit requirements.
When adjusting vehicle speed, it is imperative not only to ascertain the optimal speed for comfort but also to comprehensively consider the influence of other factors on comfort. While the immune algorithm (IA) (Gong et al., 2009) is a multi-objective optimisation method constructed by mimicking the biological immune mechanism and integrating the incentive of gene evolution, it has the advantages of self-adaptation, stochasticity, and population diversity, as well as superior global search capabilities, parallelism, and robustness, which overcomes the phenomenon of prematurity that exists in general optimisation. Significantly, the IA has found successful application in the realm of automotive mechatronic systems. For example, Chen (2020) used the IA to optimise the front- and rear-suspension parameters of an off-road vehicle, which enhanced the suspension performance of the off-road vehicle, thus improving the ride comfort and stability of the whole vehicle. Similarly, Shieh et al. (2014) combined the IA with adaptive fuzzy control and finally developed an integrated adaptive fuzzy controller which was integrated into the vehicle suspension system to achieve a balance between comfort and operability. However, it is noteworthy that these studies predominantly treated vehicle speed as a quantitative parameter, focusing on the enhancement of comfort through suspension system parameter improvements. Regrettably, the pivotal role of vehicle speed as a determinant of driving and riding comfort has often been overlooked.
Based on the aforementioned statements, this paper approaches the topic from a different perspective. Utilising the information obtainable with regard to road speed bumps through networks and sensors, the vehicle speed is considered to be an unknown condition. The research focuses on a 4-degree-of-freedom nonlinear vehicle suspension model. It employs the immune algorithm for optimising the speed of vehicles when traversing various speed bumps. This optimisation aims to achieve the ideal speed for navigating speed bumps, thereby reducing vibrations in vehicles. This approach facilitates adaptive speed adjustment in vehicles, ultimately enhancing both ride comfort and safety. Simultaneously, determining the optimal speed for traversing speed bumps provides valuable guidance for the installation of speed bumps in different speed limit zones.
The structure of this paper is as follows: the first part analyses the current state of research on vehicle suspension systems and comfort; the second part introduces the 4-degree-of-freedom nonlinear vehicle suspension model, as well as the trapezoidal, half-sine, and rectangular-wave speed bump models, and also describes the relevant parameters of the models; the third part outlines a multi-objective optimisation algorithm based on the IA; and the fourth part details the experiments on applications in different speed bump scenarios, and the results are analysed.
2.1 The 4-degree-of-freedom nonlinear vehicle suspension model
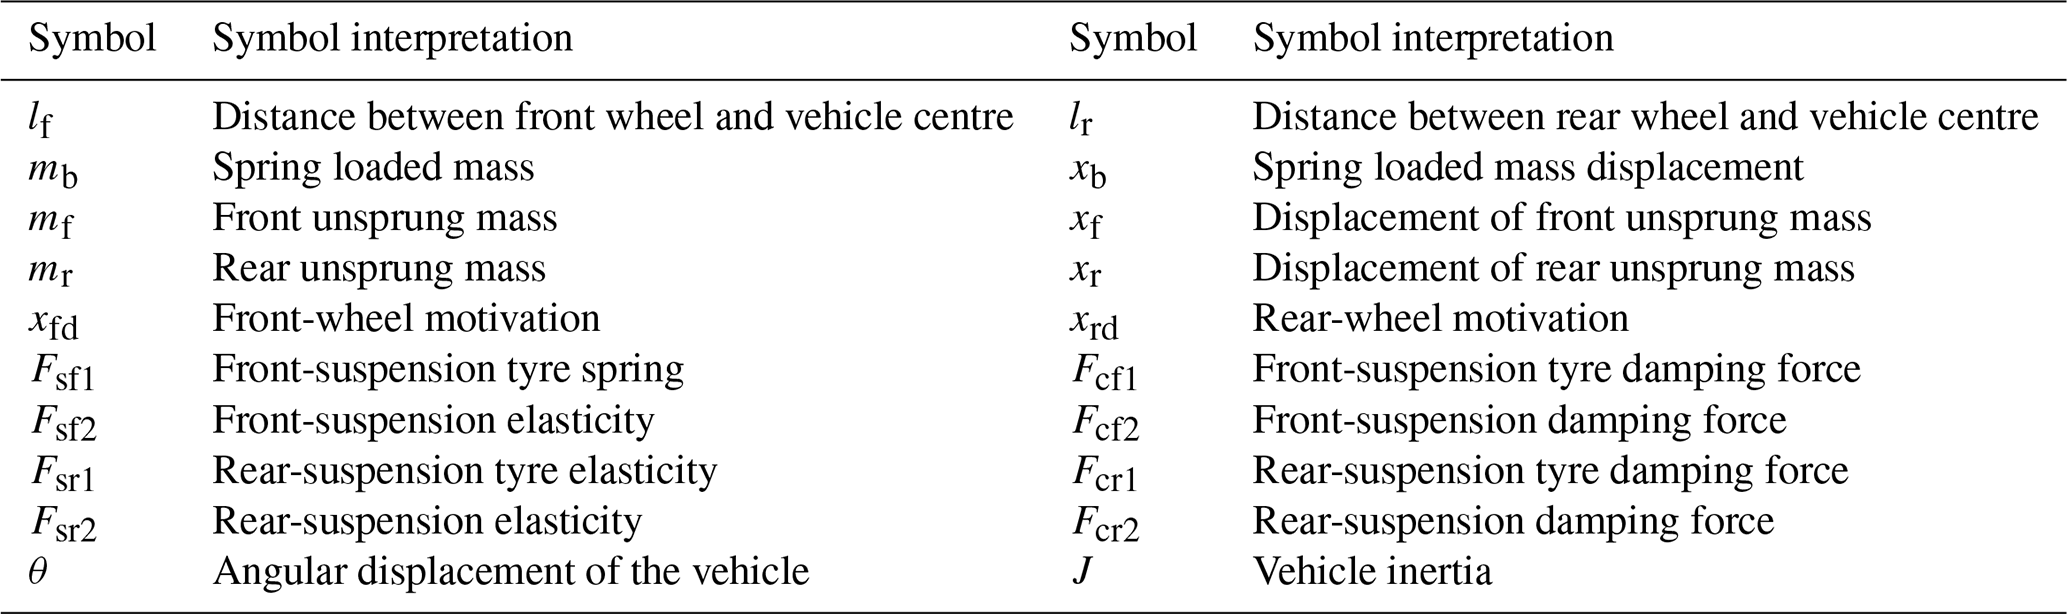
Figure 1 depicts the simplified diagram of the 4-DOF nonlinear vehicle suspension model applied in this paper (Yang et al., 2016). The nonlinear suspension model consists mainly of the vehicle body, unsprung masses of the front and rear suspension, springs, front and rear suspensions, tyres, and dampers. It enables the study not only of the vertical and pitch motion of the vehicle body but also of the vertical motion of the front and rear wheels (Yang et al., 2014). Table 1 shows the definitions of the symbols used in the model shown in Fig. 1.
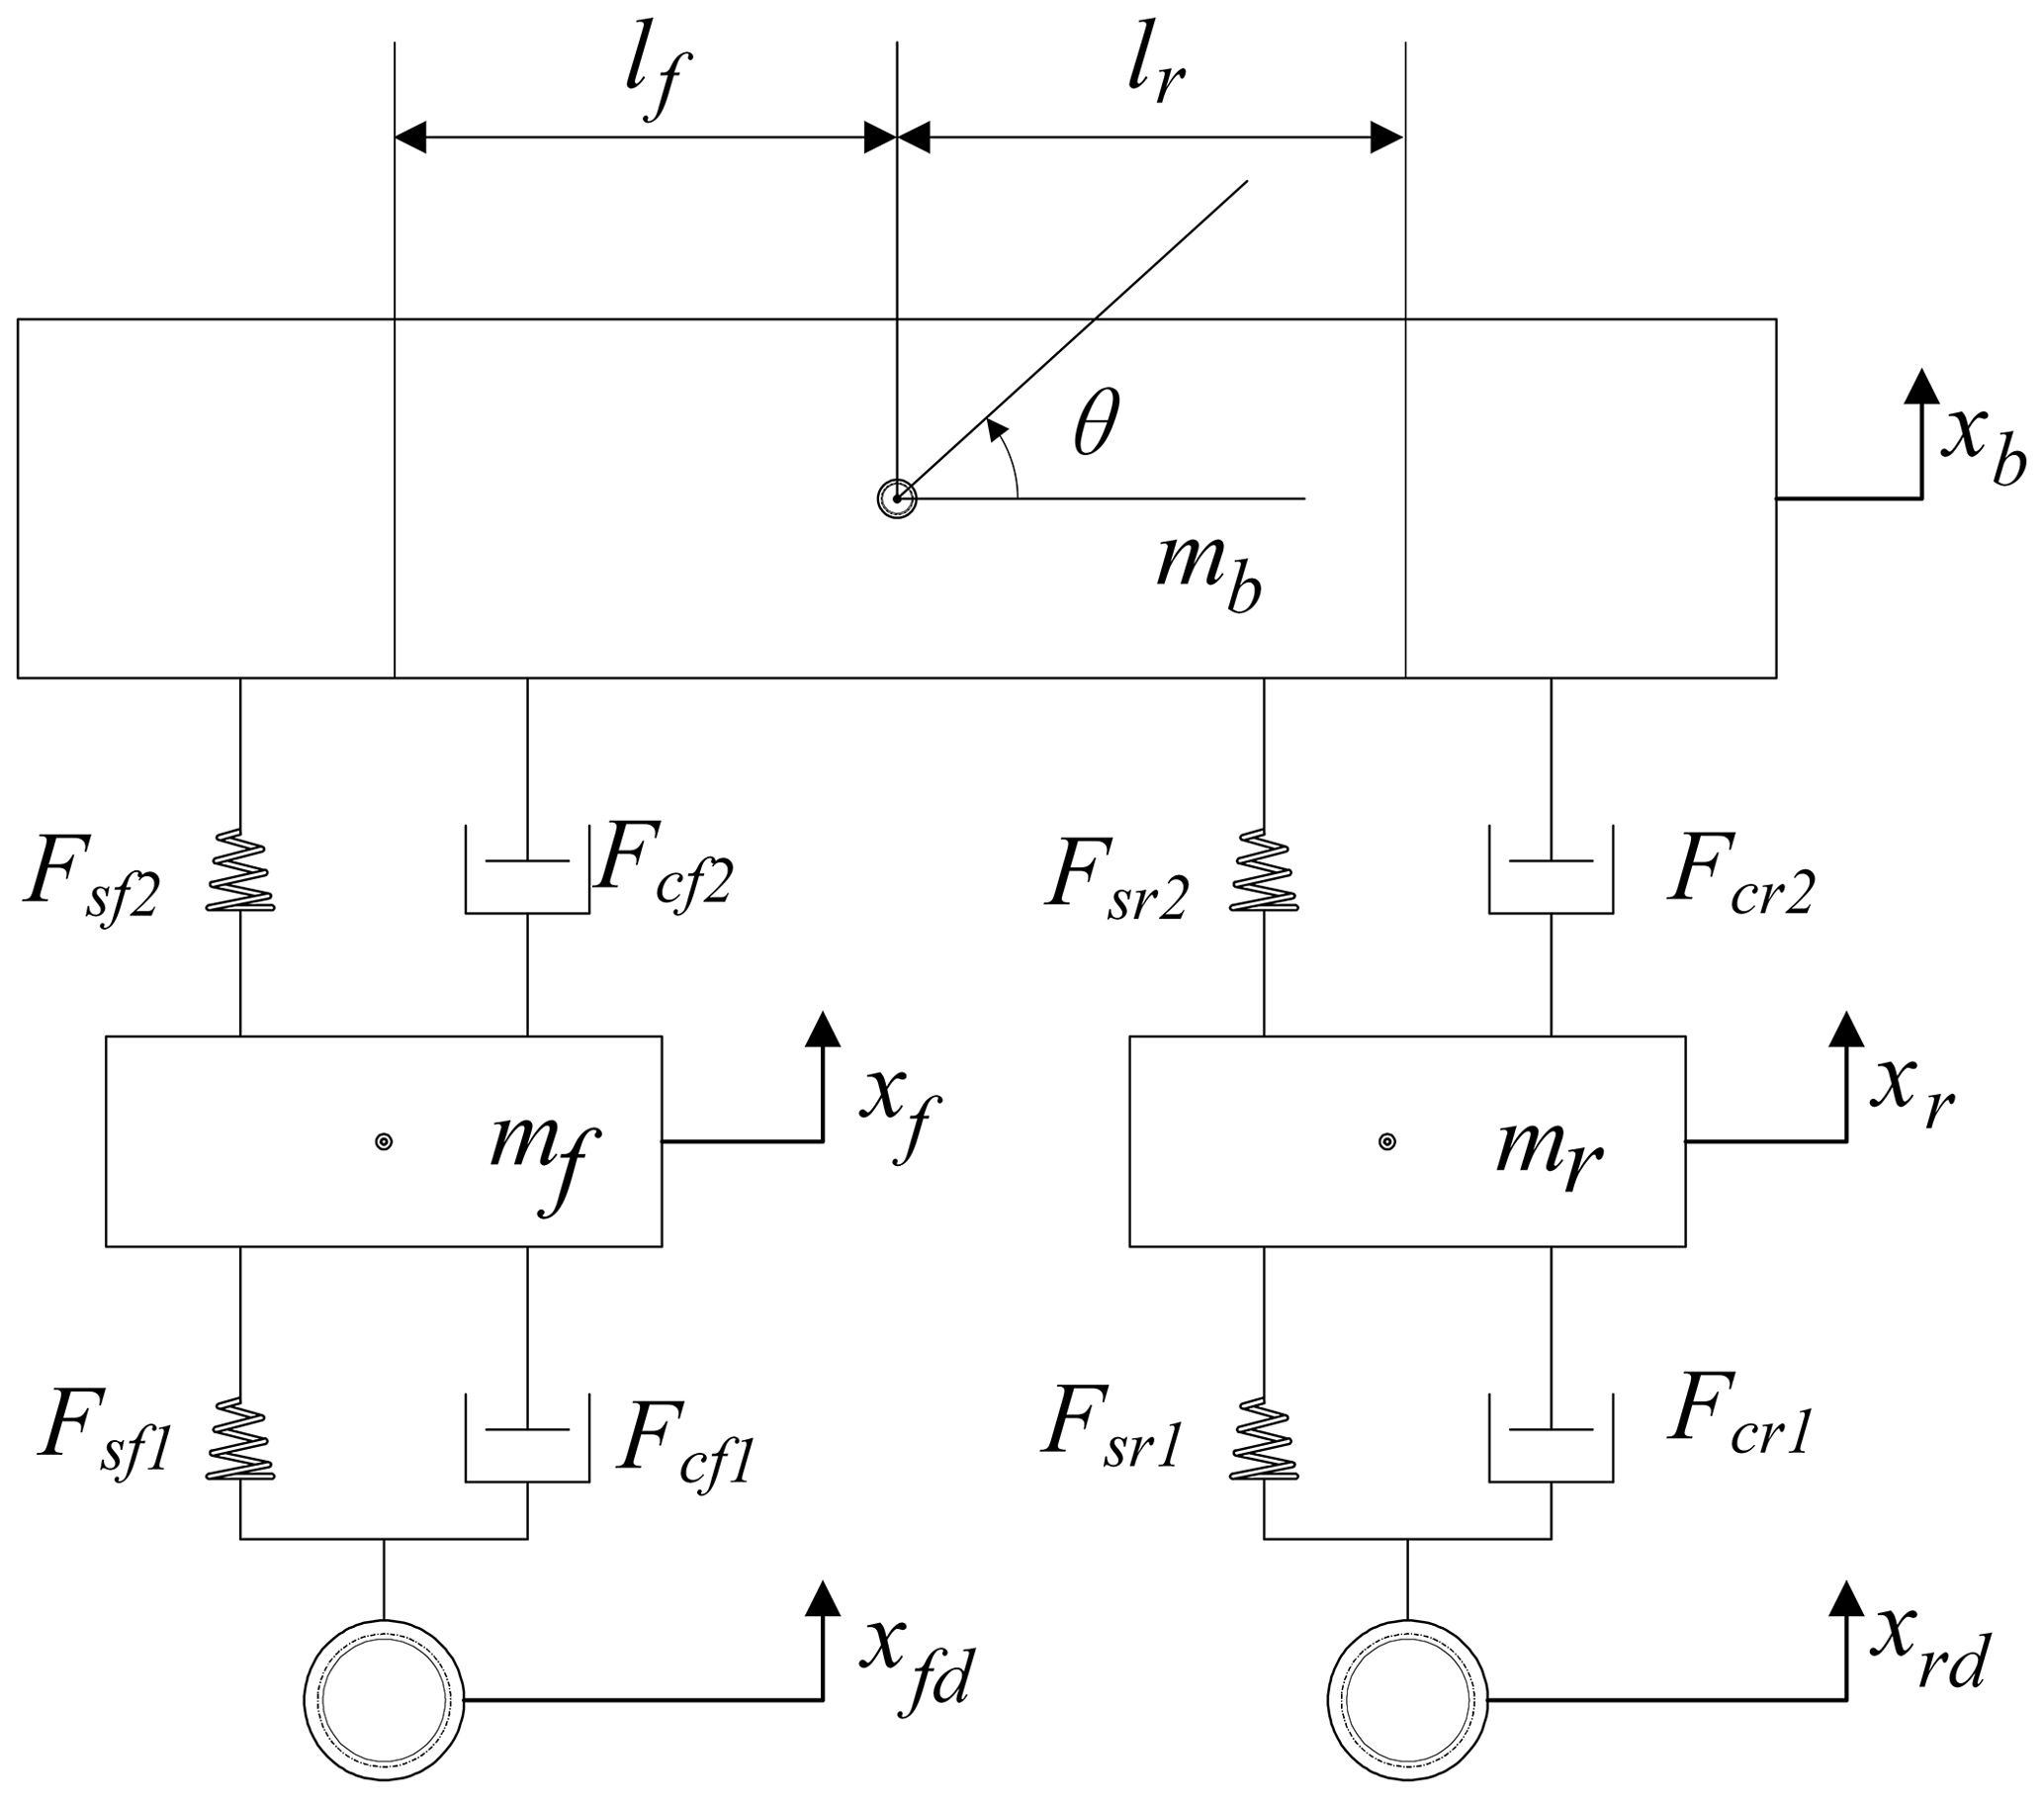
From the d'Alembert principle, the system equation of motion can be expressed as in Eq. (1):
In some simplified nonlinear dynamics studies of vehicle suspension, the suspension spring is regarded to be linear; that is, the deformation amount of the spring has a linear relationship with the spring force range; fs=kΔx holds, where k is the stiffness coefficient, and Δx is the deformation amount of the spring. However, in actual situations, the suspension spring will only be approximately linear when there is a small deformation, and nonlinear motion characteristics will appear when the deformation is large. The suspension spring will exhibit nonlinear deformation under road excitation. To better fit the actual situation, the nonlinear spring characteristics are expressed as follows (Yang et al., 2016):
where fs represents the dynamic spring force, sgn(⋅) denotes the signum function, Δs signifies the deformation of the spring, ks represents the stiffness coefficient of the spring, and n denotes the nonlinearity coefficient of the spring. When n≠1, the spring exhibits nonlinear characteristics; otherwise, it demonstrates linear characteristics. Consequently, the nonlinear characteristics of each spring in the vehicle can be expressed as follows:
where
We express the damping force of the nonlinear suspension system as follows (Yang et al., 2016):
where fsc represents the damping force, signifies the relative velocity of the damper, and cs represents the damping coefficient, which exhibits different characteristics when the damper is stretched and compressed. Therefore, the nonlinear damping forces of various vehicle suspension systems are expressed as follows:
where cf1 and cr1 denote the front- and rear-tyre damping coefficients, and cf2 and cr2 denote the front- and rear-tyre damping coefficients. Furthermore,
Let the state variable x1=xb, , x3=θ, , x5=xf, , x7=xr, and . The equation of state of the 4-DOF nonlinear suspension system is expressed as in Eq. (8):
When the suspension system is in relative static equilibrium, it can be calculated using the following equation:
where and denote the static deformations, which can be obtained from Eq. (4); the masses of the spring load mass mb at the front and rear axes, mbf and mbr, respectively, are expressed as follows:
2.2 Periodic speed bump excitation model
Accurately obtaining road surface information is crucial for analysing and evaluating vehicles. The uneven road surface between speed bumps also serves as a source of vehicle vibrations. When the vehicle's speed changes, the road surface excitation experienced by the vehicle also varies. In other words, the road surface excitation encountered by the vehicle when passing over speed bumps is influenced jointly by the speed bumps and the uneven road surface. Hence, this study takes into consideration the unevenness excitation that the uneven road surface between speed bumps imposes on vehicles and simulates the road surface's unevenness excitation using a sine wave model. Let xh(t) be the excitation function of the speed bumps, let A be the average amplitude of the uneven road surface, and let fr represent the excitation frequency of the uneven road surface. Then the excitations xfd and xrd of the front and rear wheels of the vehicle are represented as follows:
with Δt being the time difference between the front and rear wheels of the vehicle through the road point, approximately equal to .
2.2.1 Periodic trapezoidal speed bumps
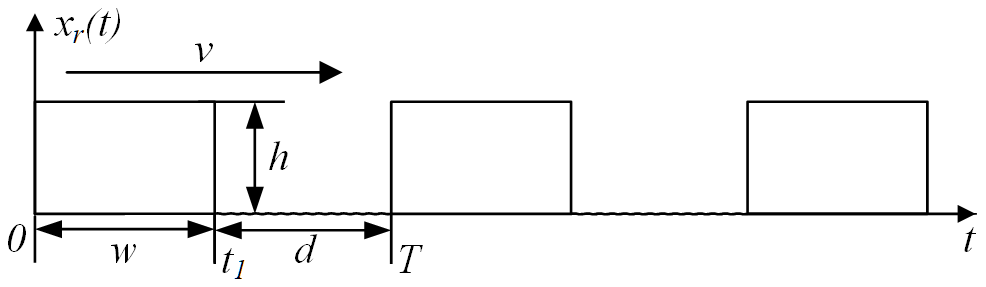
Figure 2 shows the excitation model for the periodic trapezoidal speed bumps (Yang et al., 2022); d is the separation between the speed bumps, and w and h represent the width and height of the speed bumps, respectively. The vehicle passes over the speed bumps with speed v, and then the excitation period of the periodic trapezoidal speed bumps is .
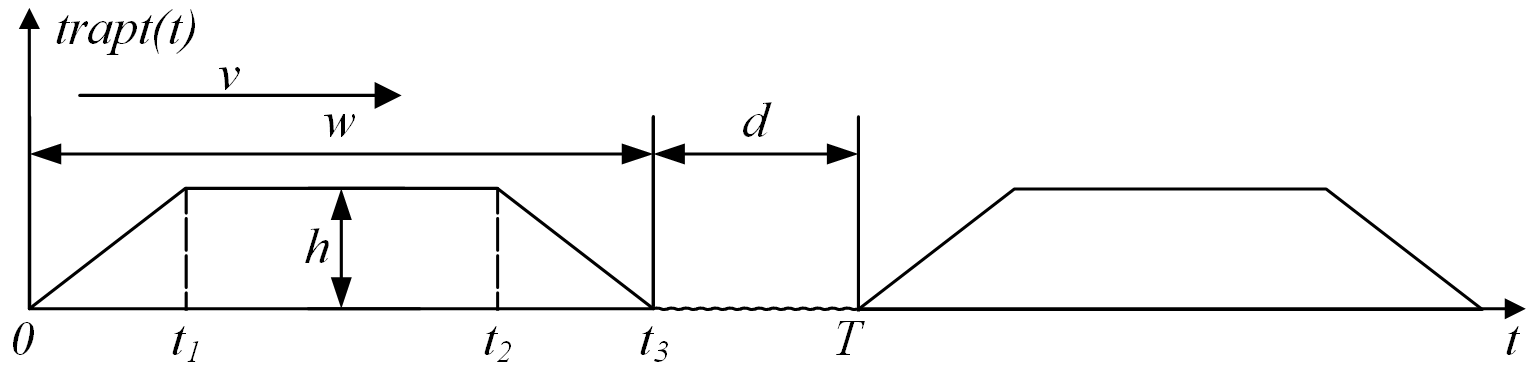
The excitation of the wheels in Fig. 2 is represented as in Eq. (5):
Thus, the excitation of the front and rear wheels of the vehicle on the periodic trapezoidal speed bumps is respectively expressed as follows:
2.2.2 Periodic half-sine speed bumps
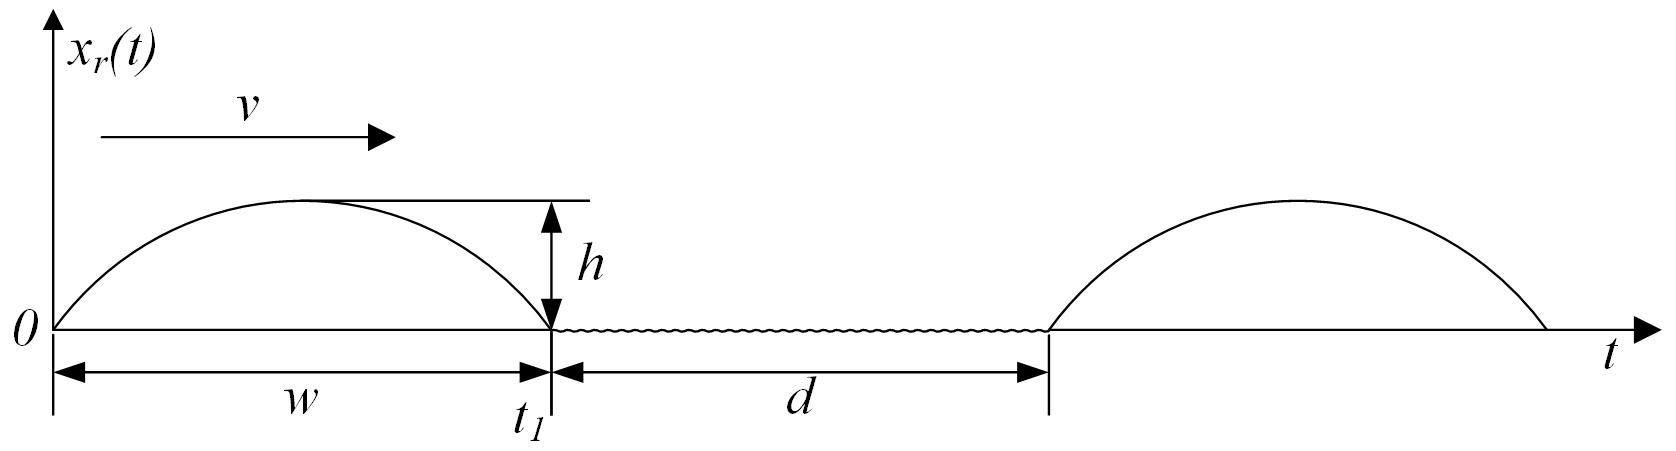
Figure 3 shows the excitation model for the periodic half-sine speed bumps (Zhang and Zheng, 2022); the speed bump's height is h, its width is w, and the separation between the speed bumps is d. After measurement, the width of the speed bump is roughly equal to the separation; that is, w=d. When the vehicle passes over the speed bump with speed v, the excitation of the front and rear wheels of the vehicle on the periodic half-sine speed bump road surface is defined as follows:
2.2.3 Periodic rectangular-wave speed bumps
Figure 4 shows the excitation model for the periodic rectangular-wave speed bumps (Wu et al., 2014). The height and width of the speed bumps are h and w, respectively, and the separation between the speed bumps is d. The speed over the speed bumps of the vehicle is v, and then the excitation of the periodic rectangular-wave speed bump road surface to the front and rear wheels of the vehicle can be expressed as follows:
where square (⋅) denotes the rectangular-wave function.
2.3 Simulation parameters
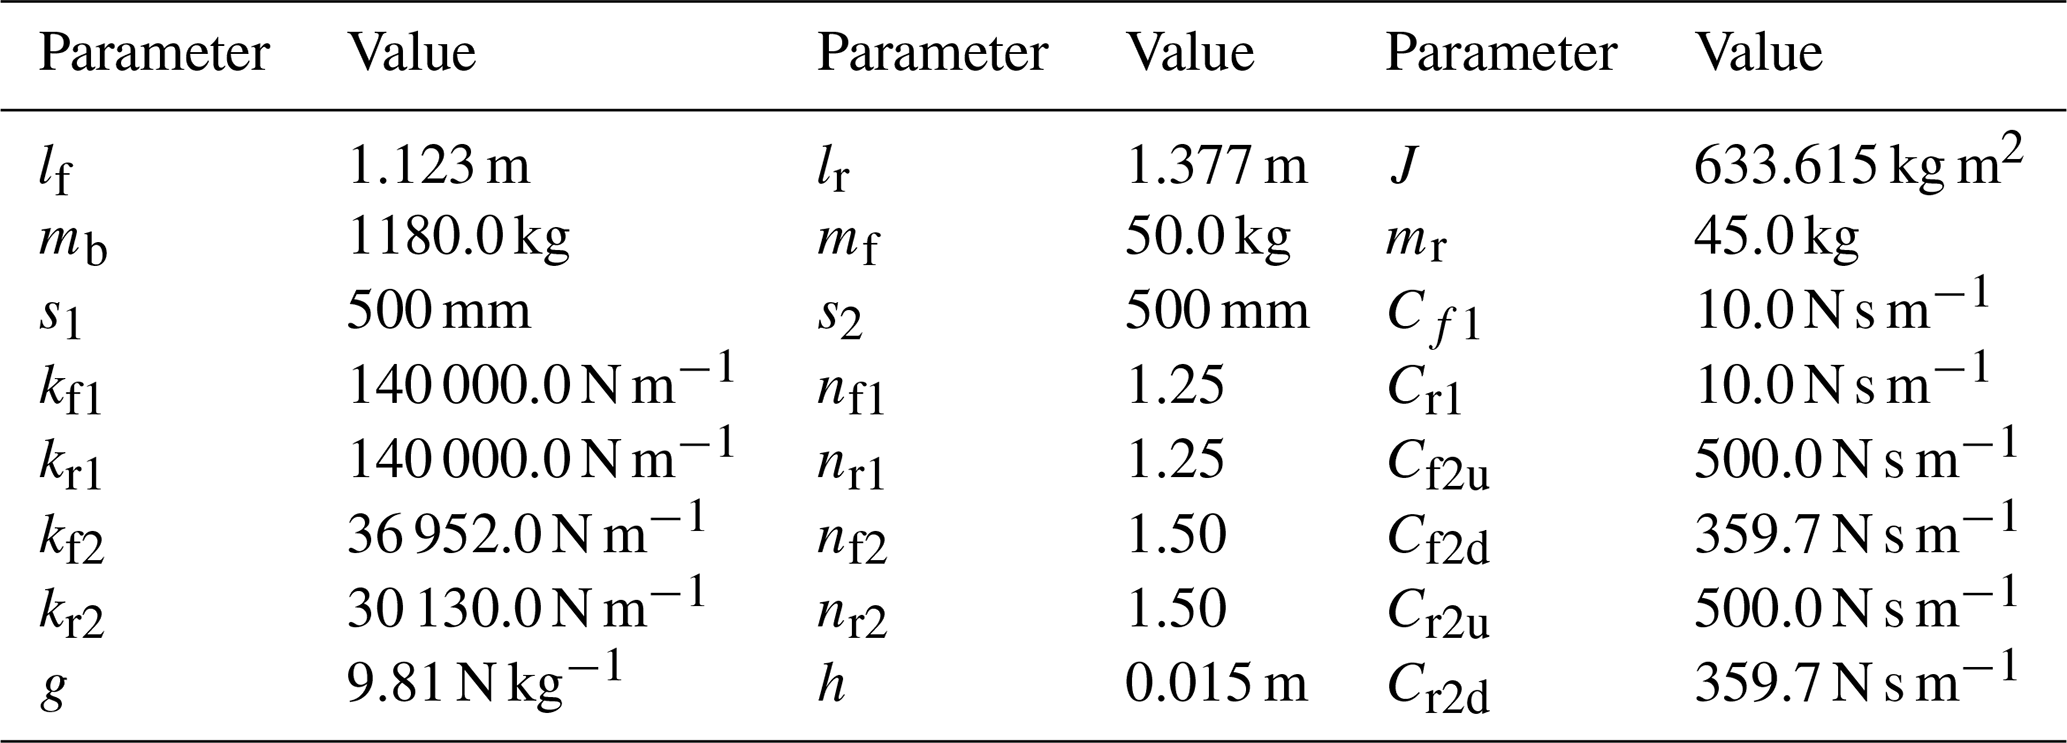
The 4-DOF vehicle suspension parameters used in the simulation are shown in Table 2 (Zhu and Ishitobi, 2004). The simulation takes the static equilibrium point in the vertical direction of the vehicle as the initial condition. Due to the nonlinearity of the differential equations, a numerical investigation of the dynamics of the vehicle model was conducted using a fourth-order fixed-step Runge–Kutta algorithm (Yang et al., 2022).
This chapter aims to discuss the problem of speed adaptive adjustment of vehicles and optimises multiple objectives, such as the speed- and suspension-damping coefficients, simultaneously. Firstly, objective functions are established by combining the optimisation objectives with the vehicle indexes to evaluate the comfort of the optimisation objectives. Then, the optimisation objectives are regarded to be a set of antibodies, and we use the immune algorithm to establish the multi-objective optimisation algorithm for optimisation, which can achieve the purpose of improving the comfort of the vehicle.
3.1 Establish the objective function
The vertical movement of the vehicle body, the dynamic deflection of the front and rear suspension, and the front- and rear-wheel dynamic loads are used as evaluation indexes of the vehicle to assess the overall performance and balance response. In addition, all indexes are combined for a comprehensive assessment of comfort.
The vertical displacement of the body is usually proportional to the vehicle speed when the vehicle passes over speed bumps. Appropriate vertical body vibration displacement can effectively protect the driver and occupants from unevenness excitation of the road surface; thus, this paper takes the vertical body displacement to be the evaluation index of vehicle comfort (Pan and Sun, 2019); combined with Eq. (8), let
The vehicle's suspension deflection directly affects the handling stability of the vehicle. If the dynamic suspension deflection exceeds the design stroke of the vehicle, it will cause damage to the vehicle's suspension components. Therefore, the paper selects the front- and rear-suspension deflection f2f and f2r as indicators for assessing the vehicle's smoothness (Sha et al., 2020); these are expressed as follows:
Vibrations generated by the ground excitation on the wheels will cause discomfort to the driver, and the dynamic loads generated by the vibrations will aggravate the wear of the vehicle and even cause damage. Therefore, the dynamic loads f3f and f3r of the front and rear wheels are used to evaluate the vehicle's safety when driving on the road (Yu et al., 2019). The stiffness coefficients for the front and rear wheels are expressed in terms of kf1 and kr1. Moreover, xfd and xrd represent the road excitations to the front and rear wheels; thus, the dynamic loads of the vehicle are expressed, respectively, as follows:
We use the root-mean-square (rms) value to dimensionlessly process the sub-objectives, such as the vertical displacement of the vehicle body, the dynamic deflection of the suspension, and the dynamic load of the wheels, thereby reducing the influence of incidental factors such as data inequality. Based on the influence level of each sub-objective, the linear weighting method is used to sum up the sub-objectives, and the objective function is expressed as follows (Wang et al., 2022):
Due to the varying impact of different influencing factors on the overall comfort of the vehicle, this study takes the relative weights ω1, ω2f, ω2r, ω3f, and ω3r of each sub-objective as an example, setting them at 0.20, 0.15, 0.15, 0.25, and 0.25, respectively, as examples for investigation. This paper simulates the scenario where the vehicle passes over trapezoidal, semi-sinusoidal, and rectangular speed bumps when exiting a highway ramp with a speed limit of 60 km h−1. The initial speed of the vehicle before optimisation is 40 km h−1. To ensure the accuracy of the simulation, the duration of vehicle motion in the simulation is set to 120 s (Yang et al., 2022).
3.2 Optimisation process based on the immune algorithm
Establishing the objective function facilitates the evaluation of the optimised comfort, which indicates the degree of optimisation. While this part describes the implementation process of the optimisation objective through the immune algorithm, which is to achieve the practical application of the algorithm by optimising the speed of the vehicle passing over the speed bumps and the relevant parameters, the specific flowchart is shown in Fig. 5.
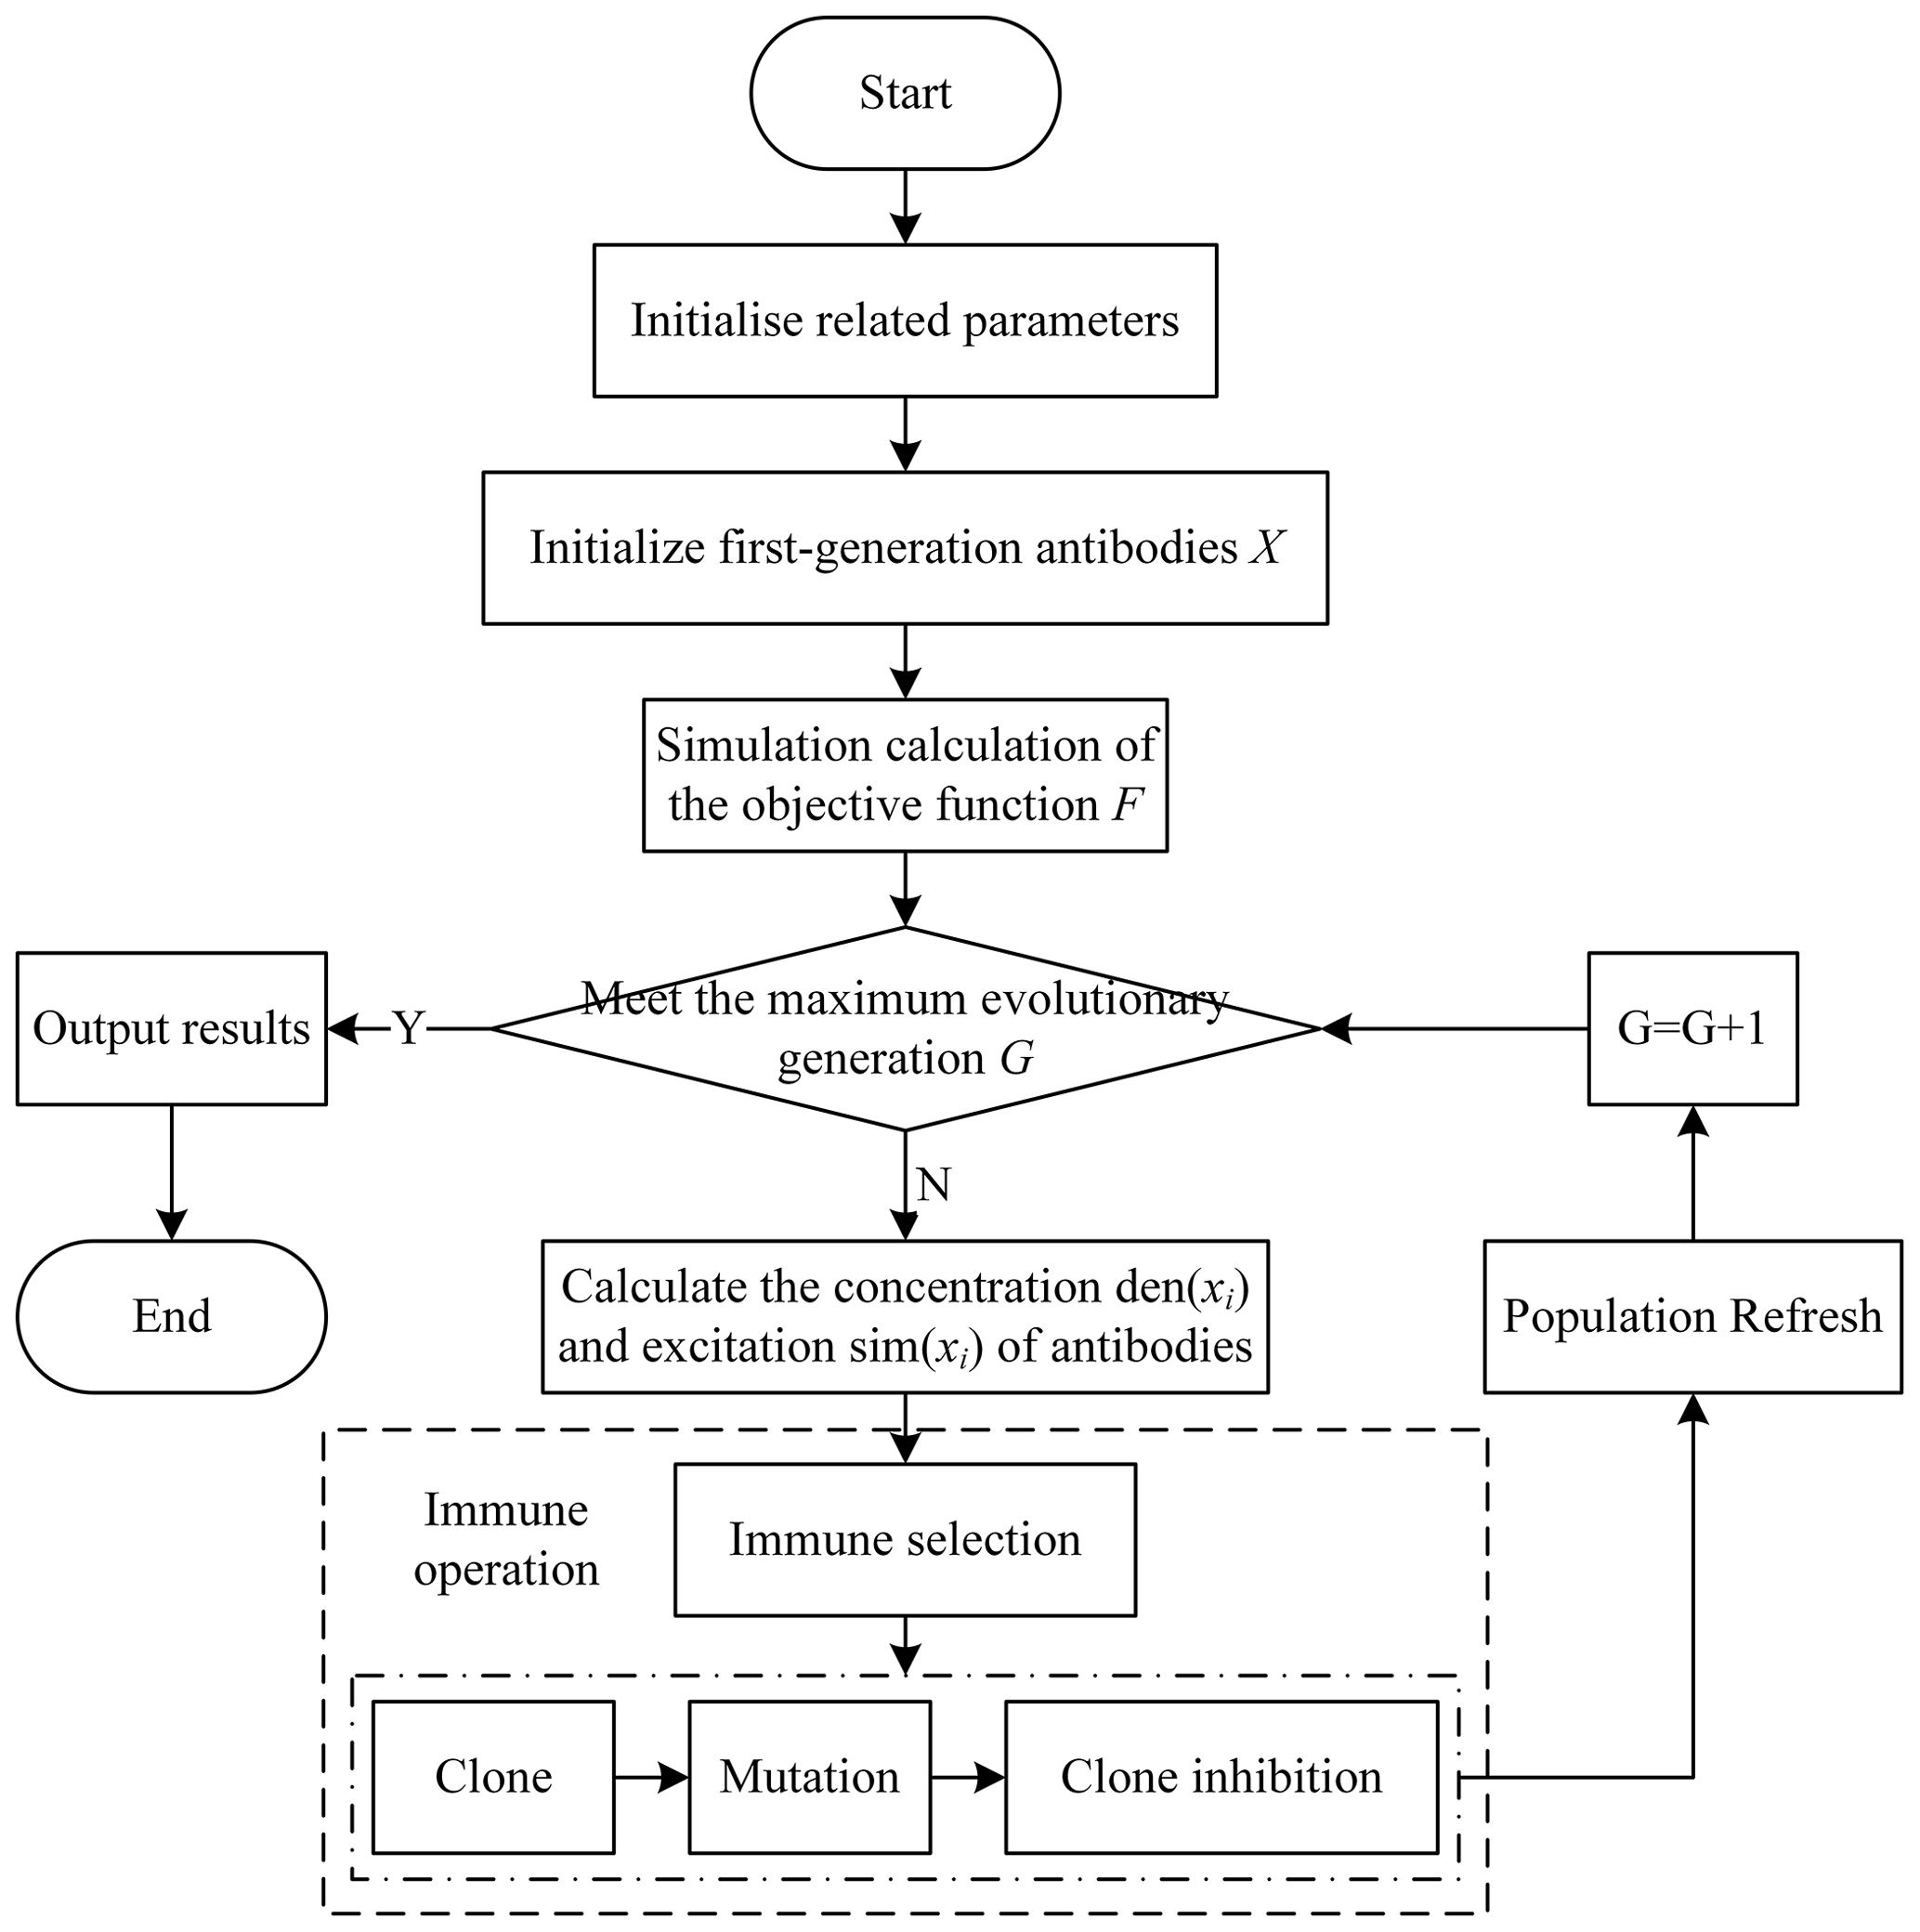
In order to facilitate the acquisition of the vehicle balance response, the relevant vehicle parameters should be initialised to achieve better optimisation of the vehicle's performance. This paper addresses the problem of adaptive control of vehicle speed when passing over speed bumps. It considers a set of antibodies, , where v represents the vehicle speed, and Cf2 and Cr2 denote the front- and rear-suspension damping coefficients. These antibodies form the initial generation of the antibody population using an immune algorithm. Simulations are conducted using the vehicle model to obtain performance feedback, and the objective function (19) is computed accordingly. The affinity of the antibodies is calculated as , where F is the value of the obtained objective function. This affinity assessment is used to evaluate the comfort of the vehicle when passing over speed bumps in conjunction with the reciprocal of the objective function (19) from Sect. 3.1. A higher affinity value implies better comfort when the vehicle traverses speed bumps. While ensuring the algorithm's global search capability, this paper sets the population size N to be 30.
In optimisation problems, it is generally considered to be advantageous to initiate optimisation from the current best data point and to select the nearest data point to the current one for further optimisation. The introduction of heuristic information plays a significant role in aiding the optimisation process. By combining the affinity and concentration of antibodies, the excitation level of each group of antibodies is computed to perform the final assessment of antibody quality. A higher excitation level of antibodies indicates better quality, signifying that the group of antibodies can enhance the comfort of vehicles when traversing speed bumps. The concentration of antibodies is defined as
where N is the population size, and S(xi,xj) is the similarity between the antibodies; the incentive of the antibodies is denoted as
The calculation of the excitation degree suppresses the high antibody concentration, which ensures the diversity of the antibody population and ensures that the algorithm can be optimised to obtain the optimal speed and related parameters after optimisation. Optimising the speed of the vehicle has to satisfy a variety of constraints, such as smoothness and safety, in addition to the optimal comfort of the vehicle over the speed bump; however, the optimal solutions obtained so far do not meet the requirements of the various constraints. In order to obtain the optimal vehicle speed and related parameter solutions for the current problem as much as possible, after multiple experiments and verifications, it was found that the affinity of the antibody in the paper had almost converged before the evolution of 200 generations, and good results could be obtained. However, after the number G was set to 200 generations, the affinity of the antibody rarely continued to increase. Therefore, the maximum generation was set to 200.
In each round of the evolutionary process, immune operations play a crucial role in ensuring the continuous improvement of vehicle comfort. Various immune operations from the biological immune response, including immune selection, cloning, mutation, and clone suppression, are employed to enhance the quality of antibody parameters affecting vehicle comfort and to optimise the comfort of vehicle passage over speed bumps. The immune selection operator filters antibodies in the population, activating high-quality antibodies that improve vehicle comfort, with the immune selection ratio set to 50 % of the population (50 % NP). The cloning operator replicates activated parameter antibodies to generate several copies. In order to ensure that changes in antibodies' variations lead to alterations in vehicle comfort, the cloning quantity (M) is set at 10. The mutation operator is applied to copies of vehicle speed and suspension damping coefficients, using a real-number-encoding algorithm with a certain probability. This mutation is aimed at modifying the vehicle's comfort while traversing speed bumps, maintaining population diversity, and enhancing local search capabilities, as illustrated below:
where the symbol represents the jth dimension of the mth clone of antibody xi, where δ denotes the defined neighbourhood range, and the mutation rate pm is set to 0.7. The clone suppression operator performs a reselection on the results of mutation, suppressing and eliminating parameter antibodies with low vehicle comfort and ensuring that high-quality antibodies that improve vehicle comfort are retained for the next generation. This ensures that the next generation of antibodies has a rich diversity in terms of vehicle comfort results, maintaining diversity in the new antibody population.
To enhance the global search capability of the optimisation algorithm and to obtain new antibodies with different vehicle comfort levels, a population refresh strategy is employed after each round of evolution. This strategy randomly generates new antibodies and eliminates half of the antibodies with low stimulation levels to ensure that the vehicle comfort of the next generation of antibodies entering the new round of evolution is better than the previous generation. When the specified number of evolution generations is reached in the algorithm, the current best antibody, Xbest, is output, which includes the optimal vehicle speed and front- and rear-suspension damping coefficients for passing over speed bumps.
This paper details an optimisation algorithm considering vehicle speed v and front- and rear-suspension damping coefficients Cf2 and Cr2. Simulating the vehicle passing through the highway exit ramp with a speed limit of 40 km h−1, combining the reality and hardware conditions, the constraint ranges of each variable are set to be 0 km h−1 < v≤60 km h−1, 0 kg s−1 < Cf2 ≤2000 kg s−1, and 0 kg s−1 < Cr2 ≤2000 kg s−1.
4.1 Application effects of vehicles passing over periodic trapezoidal speed bumps
After applying the multi-objective optimisation algorithm to the trapezoidal speed bumps, the convergence began in the 173rd generation. The affinity of the best antibody was 1.7419, the vehicle speed v was 17.06 km h−1, the front-suspension damping coefficient Cf2 was 1997 kg s−1, and the rear-suspension damping coefficient Cr2 was 1575 kg s−1.
From Fig. 6, it can be observed that the optimal affinity stabilises and gradually increases after the 54th generation, ultimately converging. Between the 54th and 172nd generations, when both v and Cf2 remain stable and mostly unchanged, only variations in Cr2 contribute to a slight improvement in the optimal antibody's affinity. After the 173rd generation, due to the presence of mutation operators and population refreshing in the optimisation model, mutations in v, Cf2, and Cr2 lead to a sudden change in antibody affinity, yielding antibodies with higher affinities that subsequently stabilise. Afterwards, it becomes increasingly challenging to generate new antibodies that would lead to an improvement in affinity. Affinity has reached a state of near-convergence, indicating that the optimal vehicle speed and related parameters have been obtained.
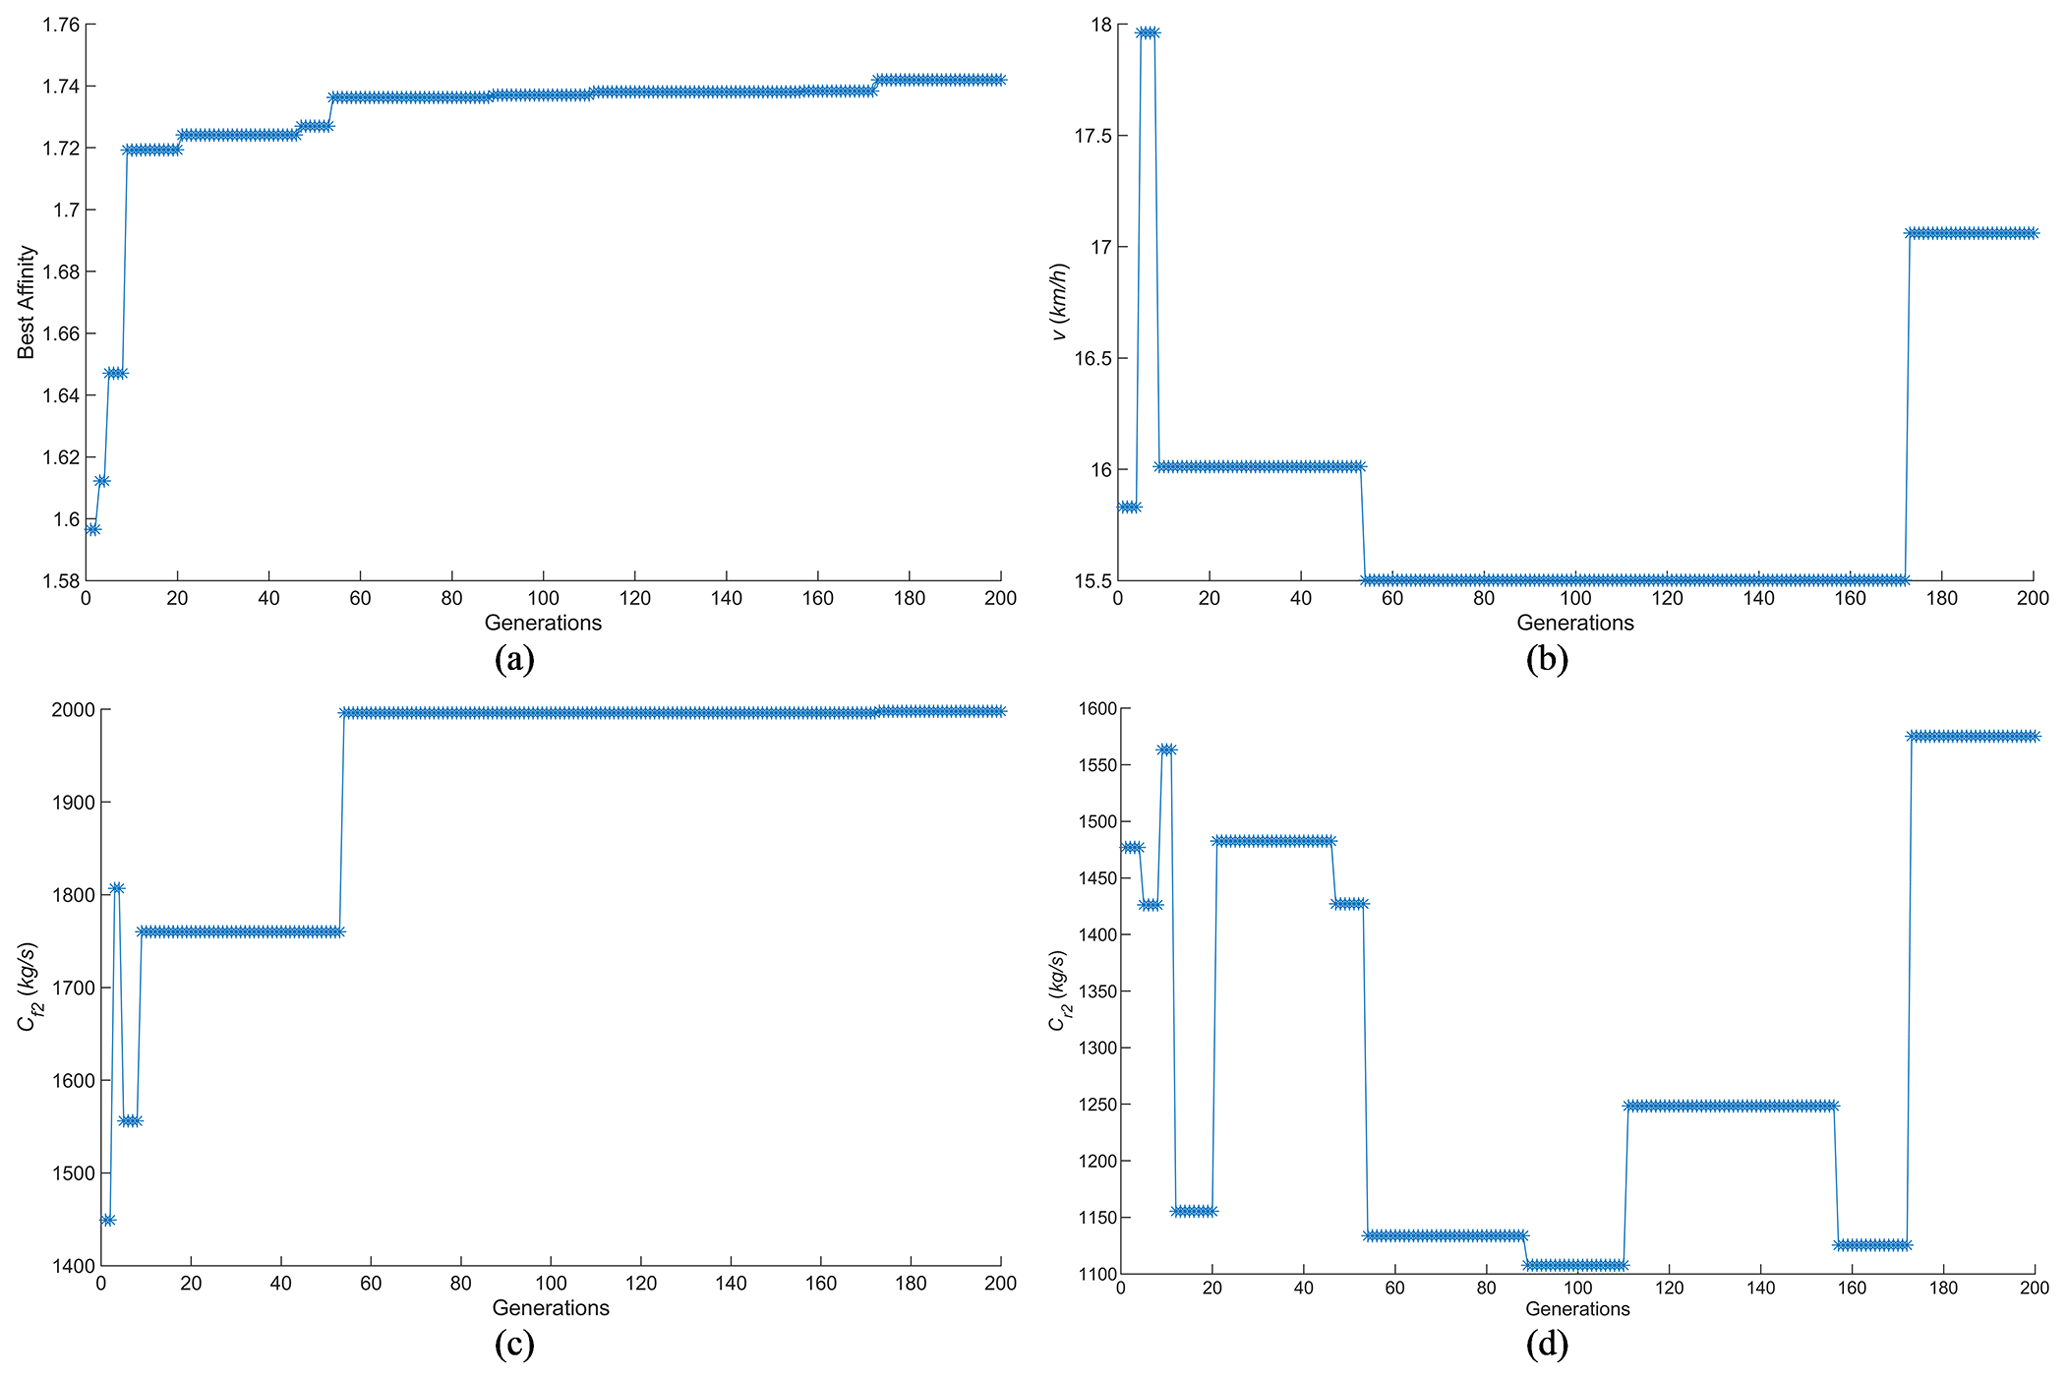
Figure 6Iterative process for each variable of vehicle passing over the periodic trapezoidal speed bumps. (a) Iterative process for optimal affinity. (b) Iterative process for individual optimal v. (c) Iterative process for individual optimal Cf2. (d) Iterative process for individual optimal Cr2.
The response curves of the vehicle suspension system before and after optimisation are plotted in Fig. 7.
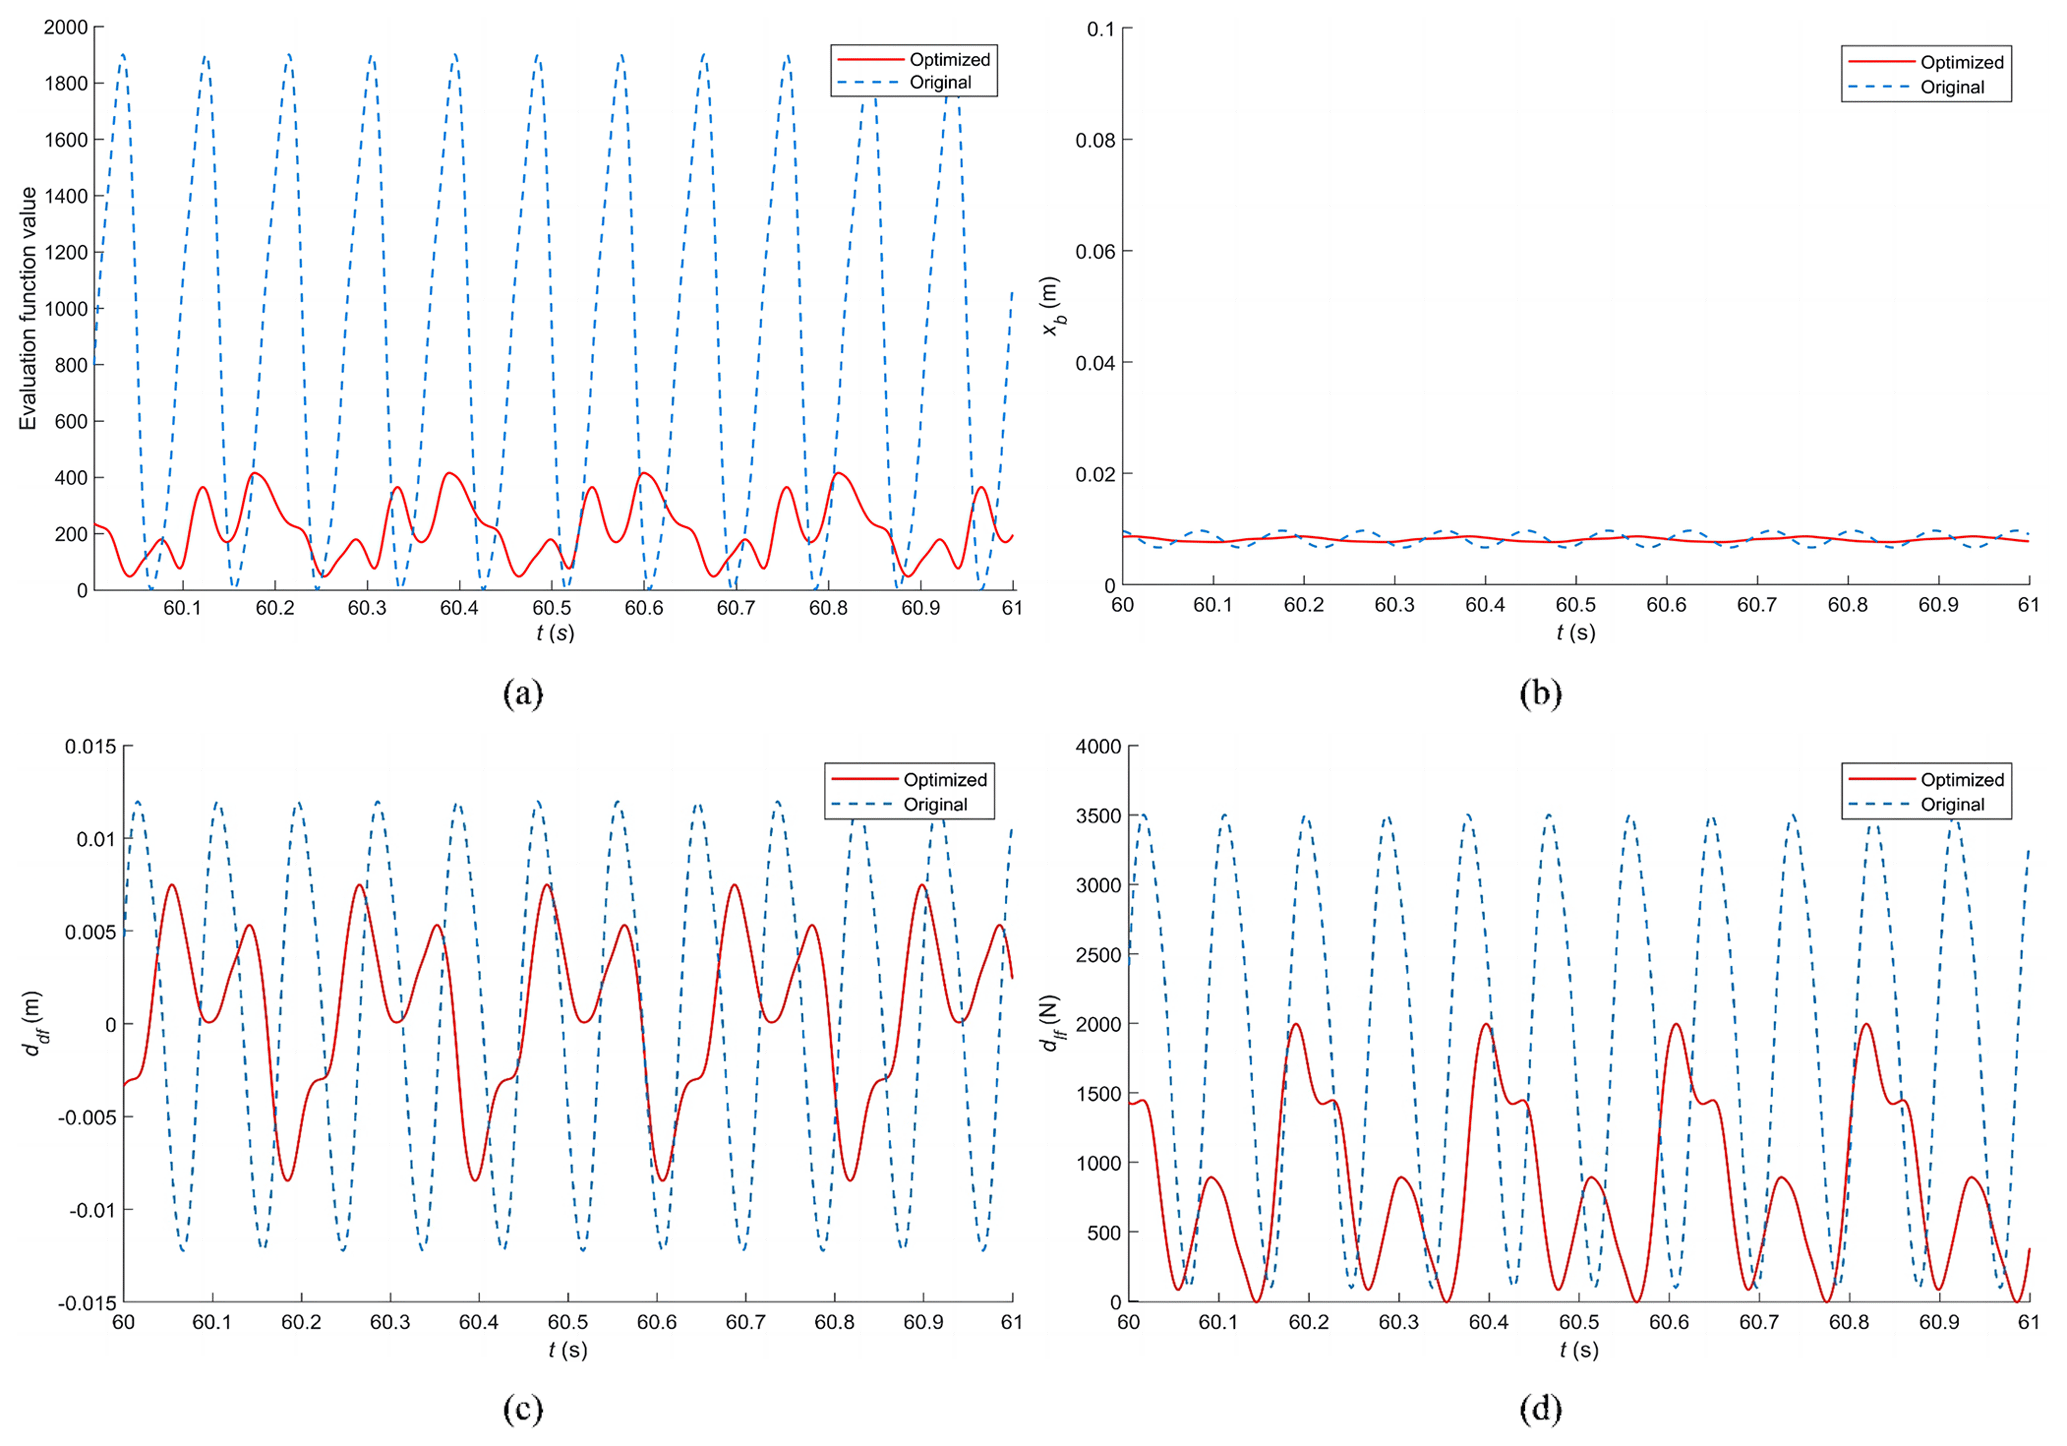
Figure 7Comparison of vehicle response curves over periodic trapezoidal speed bumps before and after optimisation. (a) Response curve for objective function values F. (b) Response curve for vertical body displacement xb. (c) Response curve for front-suspension dynamic deflection ddf. (d) Response curve for front-wheel dynamic load dlf.
Before optimisation, the vehicle speed was 40.00 km h−1, and after optimisation, it was reduced to 17.06 km h−1. Observing Fig. 7, it is evident that the optimised objective function value is significantly lower than before optimisation. The suspension deflection response has decreased from 0.0119 to 0.0054 m, and the wheel dynamic load response has been reduced from 2510.5 to 1106.9 N, both lower than their respective values before optimisation. Additionally, the maximum vertical displacement of the vehicle body has decreased from 0.0816 to 0.0771 m, and according to the rms criterion, the average value of the vehicle body displacement has decreased from 0.0105 to 0.0092 m. This indicates the effectiveness of the optimisation algorithm. These improvements reflect that the optimisation has enhanced the comfort and safety of the vehicle when passing over speed bumps. The spring mass acceleration curves before and after optimisation are shown in Fig. 8.
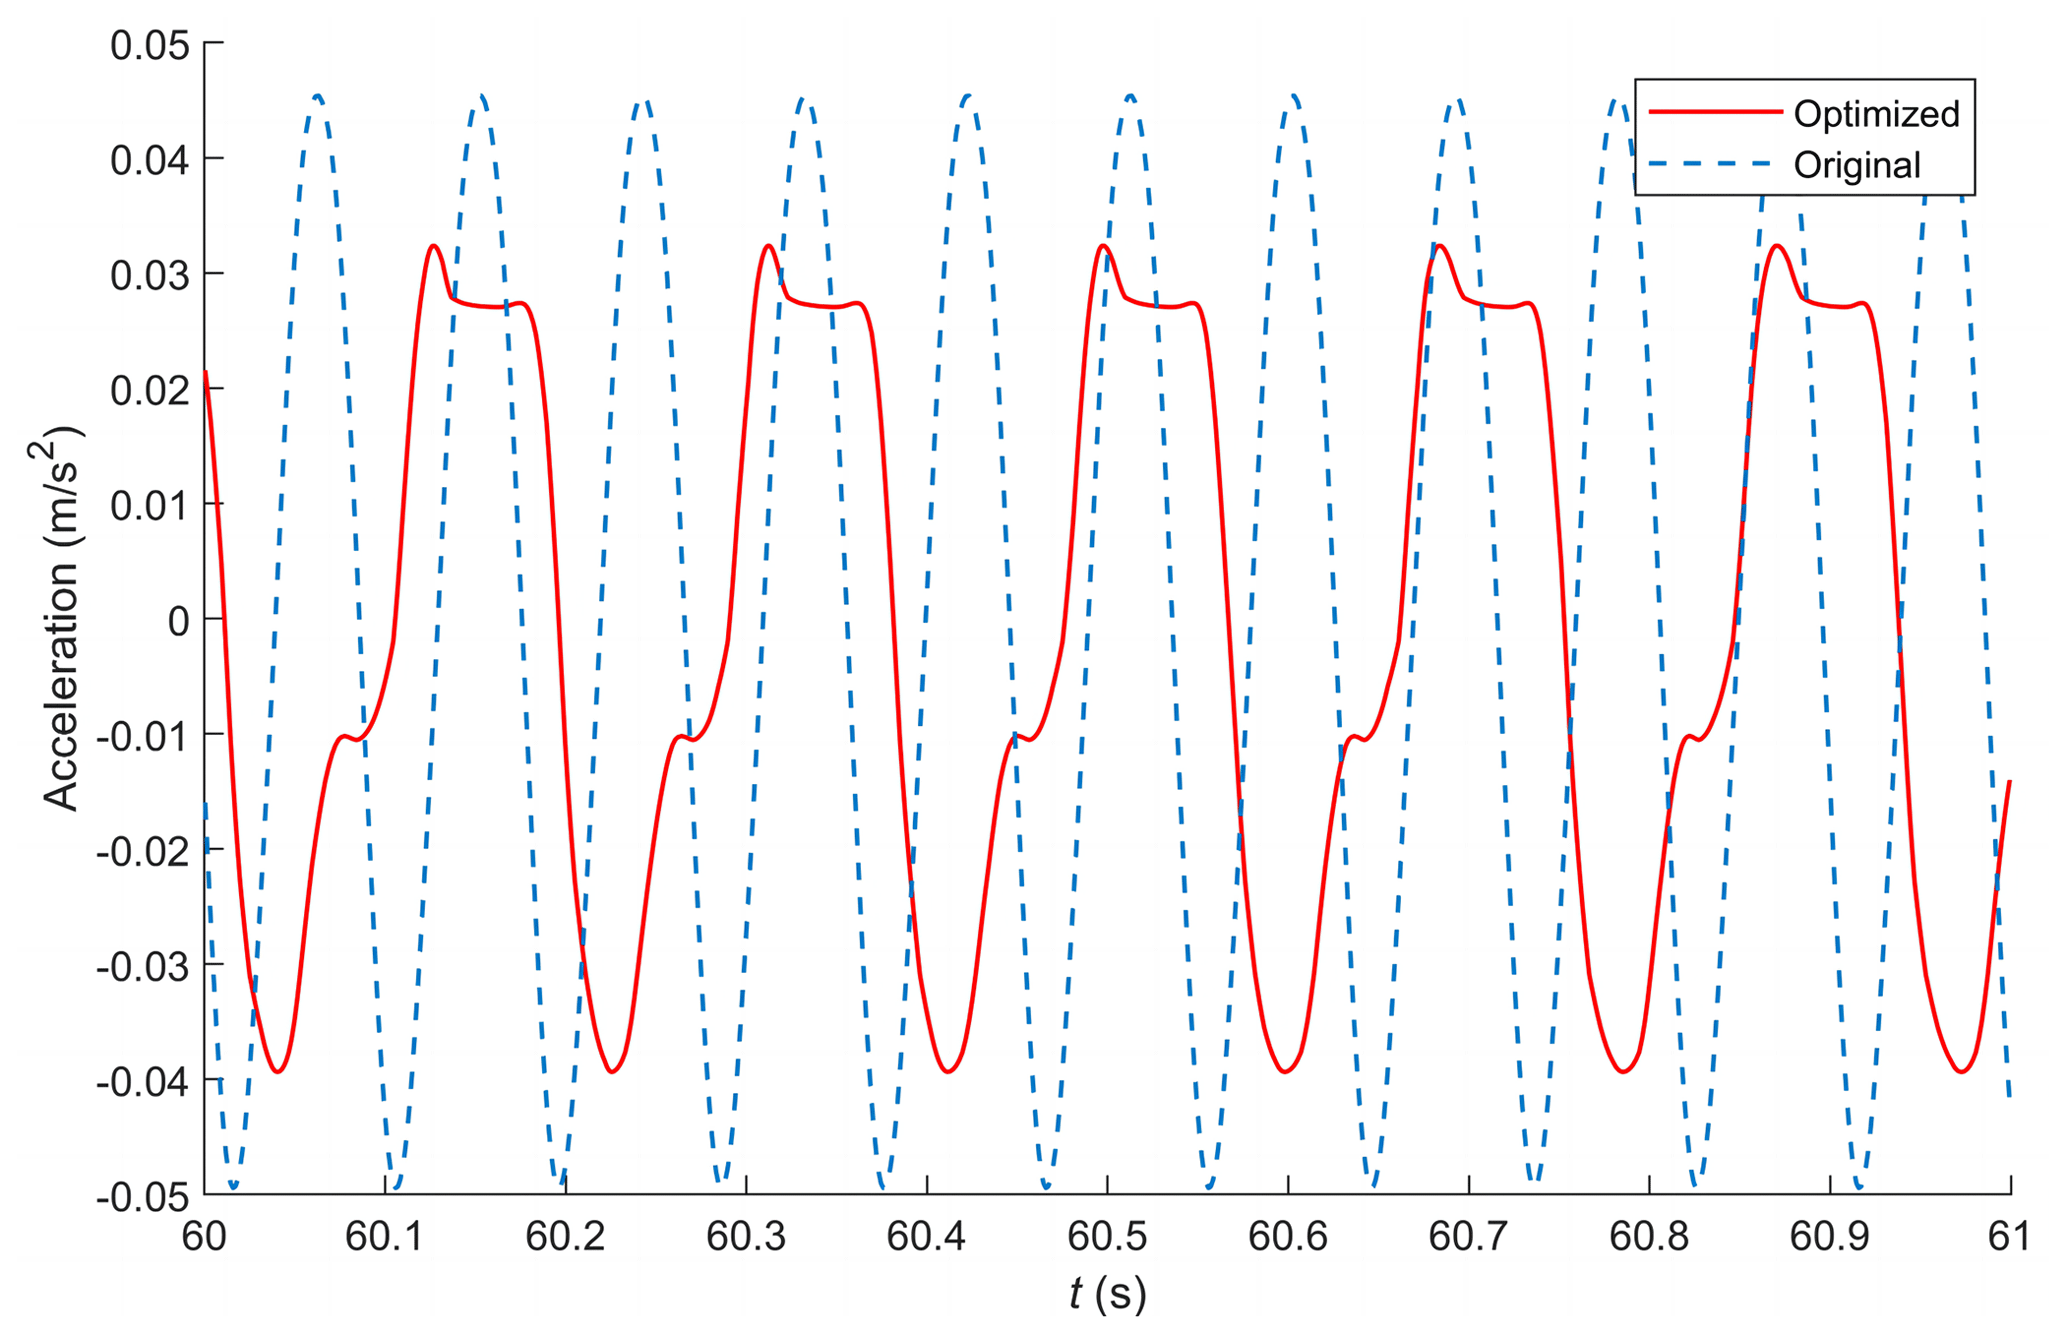
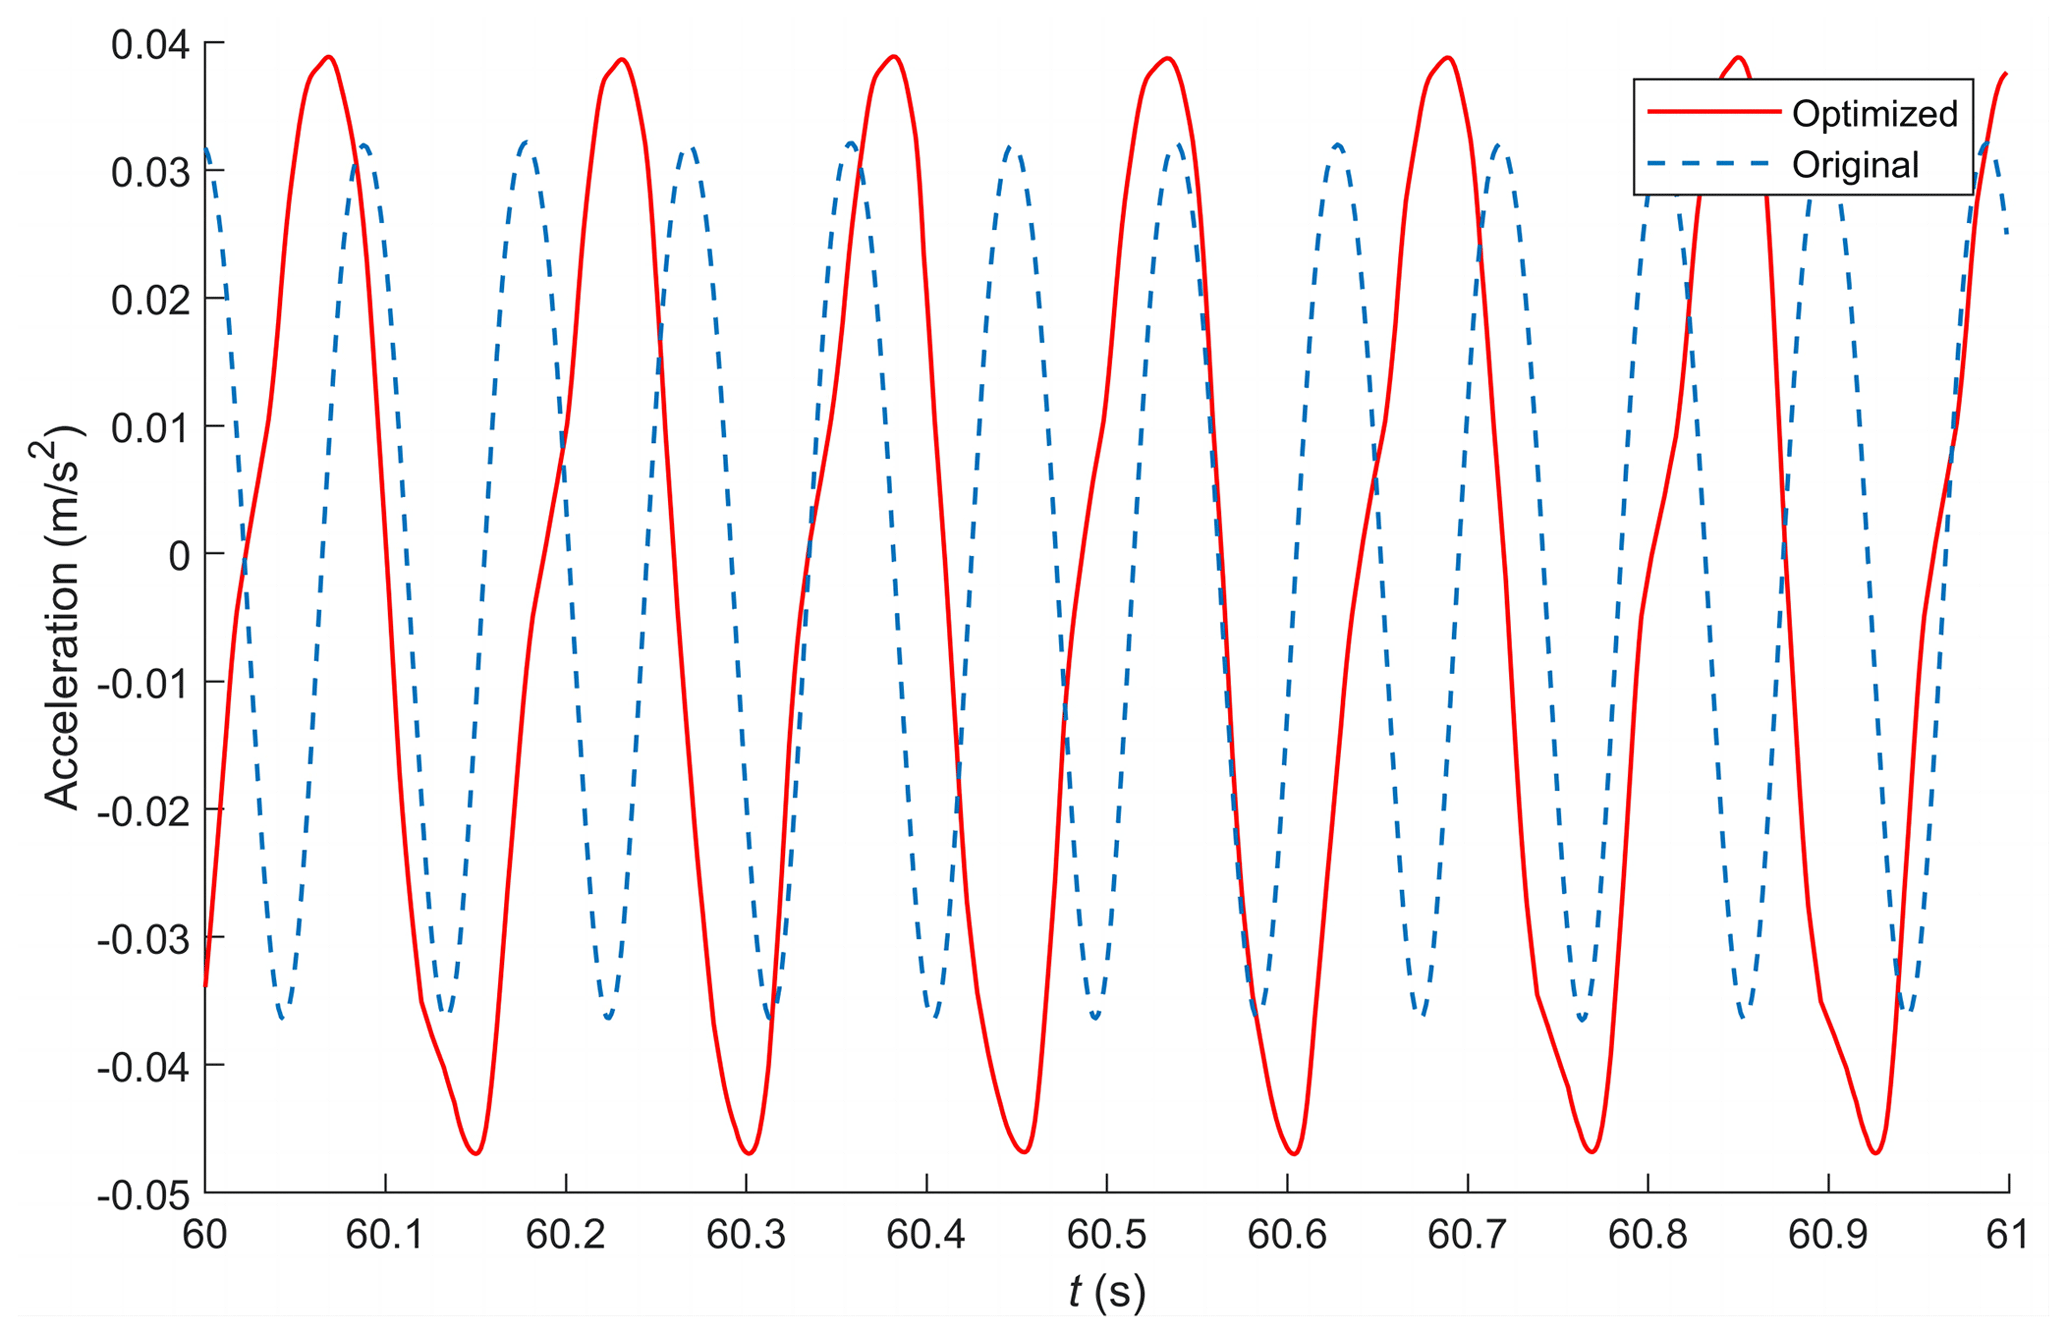
Figure 8Curves of acceleration a before and after optimisation over trapezoidal speed bumps.
Figure 8 shows the acceleration curves before and after optimisation when passing over the trapezoidal speed bump. Prior to optimisation, the maximum acceleration value for the spring mass reached 0.9088 m s−2, which was reduced to 0.7264 m s−2 after optimisation. The average values were 0.0597 m s−2 before optimisation and 0.0557 m s−2 after optimisation. These findings further confirm the improvement in comfort after optimisation.
4.2 Application effects of vehicles passing over periodic half-sine speed bumps
For the half-sine speed bumps, after 200 generations of optimisation, the affinity of the best antibody converges to 1.4321 when the vehicle speed v takes 15.33 km h−1, the front-suspension damping coefficient Cf2 takes 1971 kg s−1, and the rear-suspension damping coefficient Cr2 takes 1819 kg s−1.
From Fig. 9, it can be observed that, between the 51st and 123rd generations, the affinity of the best antibodies remains essentially stable, with minimal variation. During this evolutionary phase, changes in speed v are relatively small. However, there was a notable exchange in the values of the front and rear damping coefficients (Cr2 and Cr2) at the 97th generation due to a mutation, which essentially corresponds to an interchange of front- and rear-wheel damping coefficients, resulting in relatively minor effects on affinity. Between the 130th and 140th generations, vehicle speed gradually starts to converge towards its optimum value. During this period, as the front and rear damping coefficients need to converge continuously around the optimal values, they start to oscillate around this optimum. Consequently, the affinity of the antibodies increases rapidly, leading to improved vehicle comfort. This trend continues until approximately the 170th generation, when the affinity of the antibodies stabilises. At this point, there is little room for further improvement, signifying that the optimal vehicle speed for passing over speed bumps has been obtained.
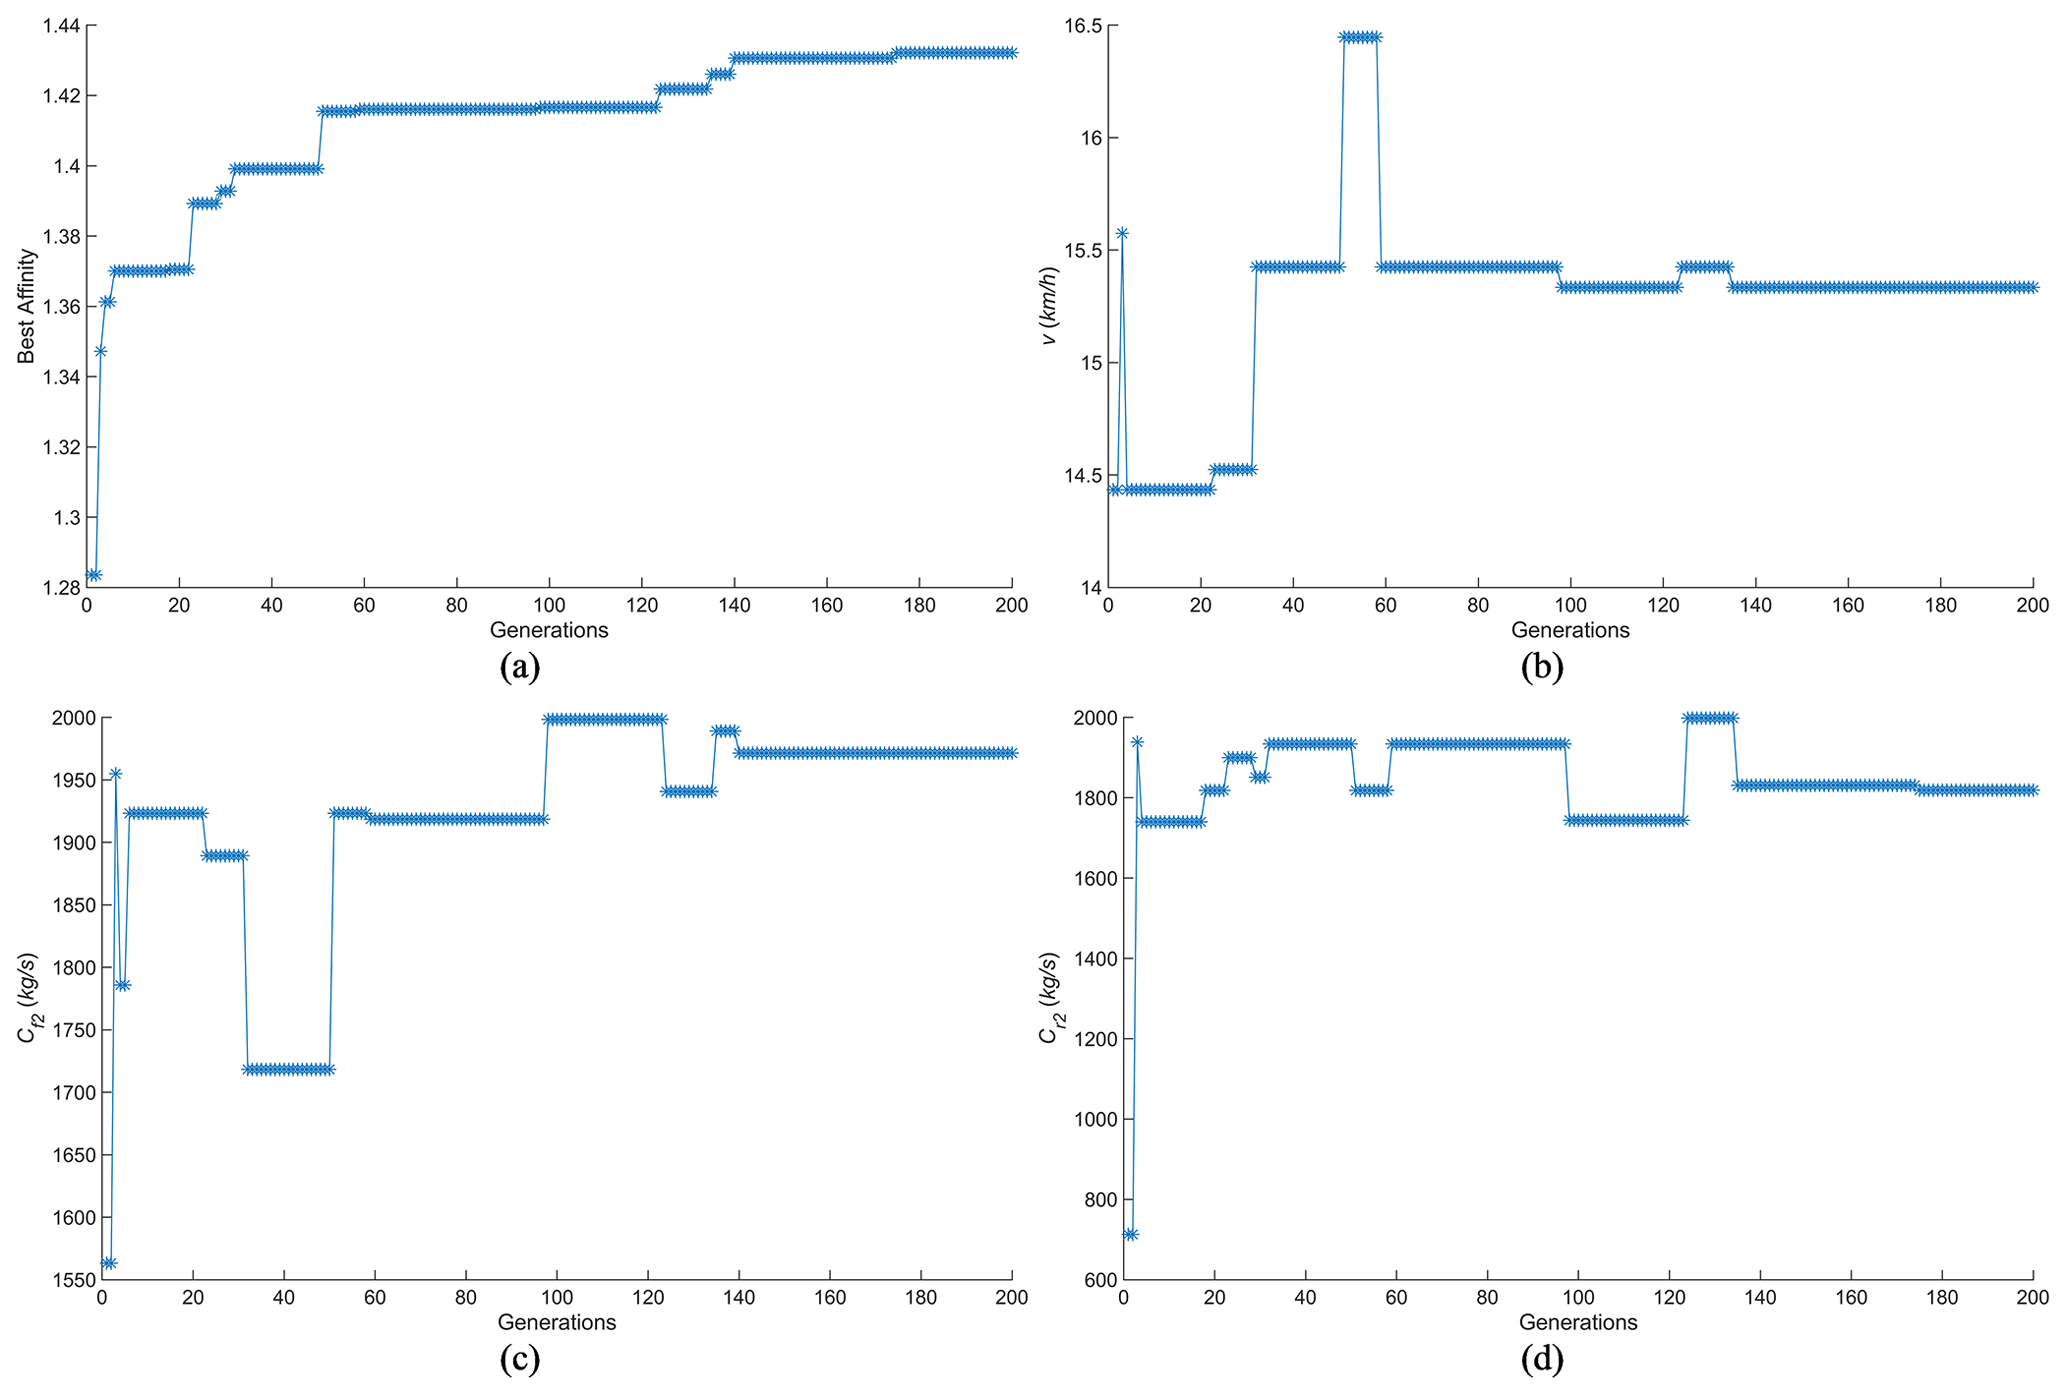
Figure 9Iterative process for each variable of the vehicle passing over periodic half-sine speed bumps. (a) Iterative process for optimal affinity. (b) Iterative process for individual optimal v. (c) Iterative process for individual optimal Cf2. (d) Iterative process for individual optimal Cr2.
Figure 10 shows the system response curves of the vehicle suspension system at steady state; these are contrasted to the response curves prior to optimisation.
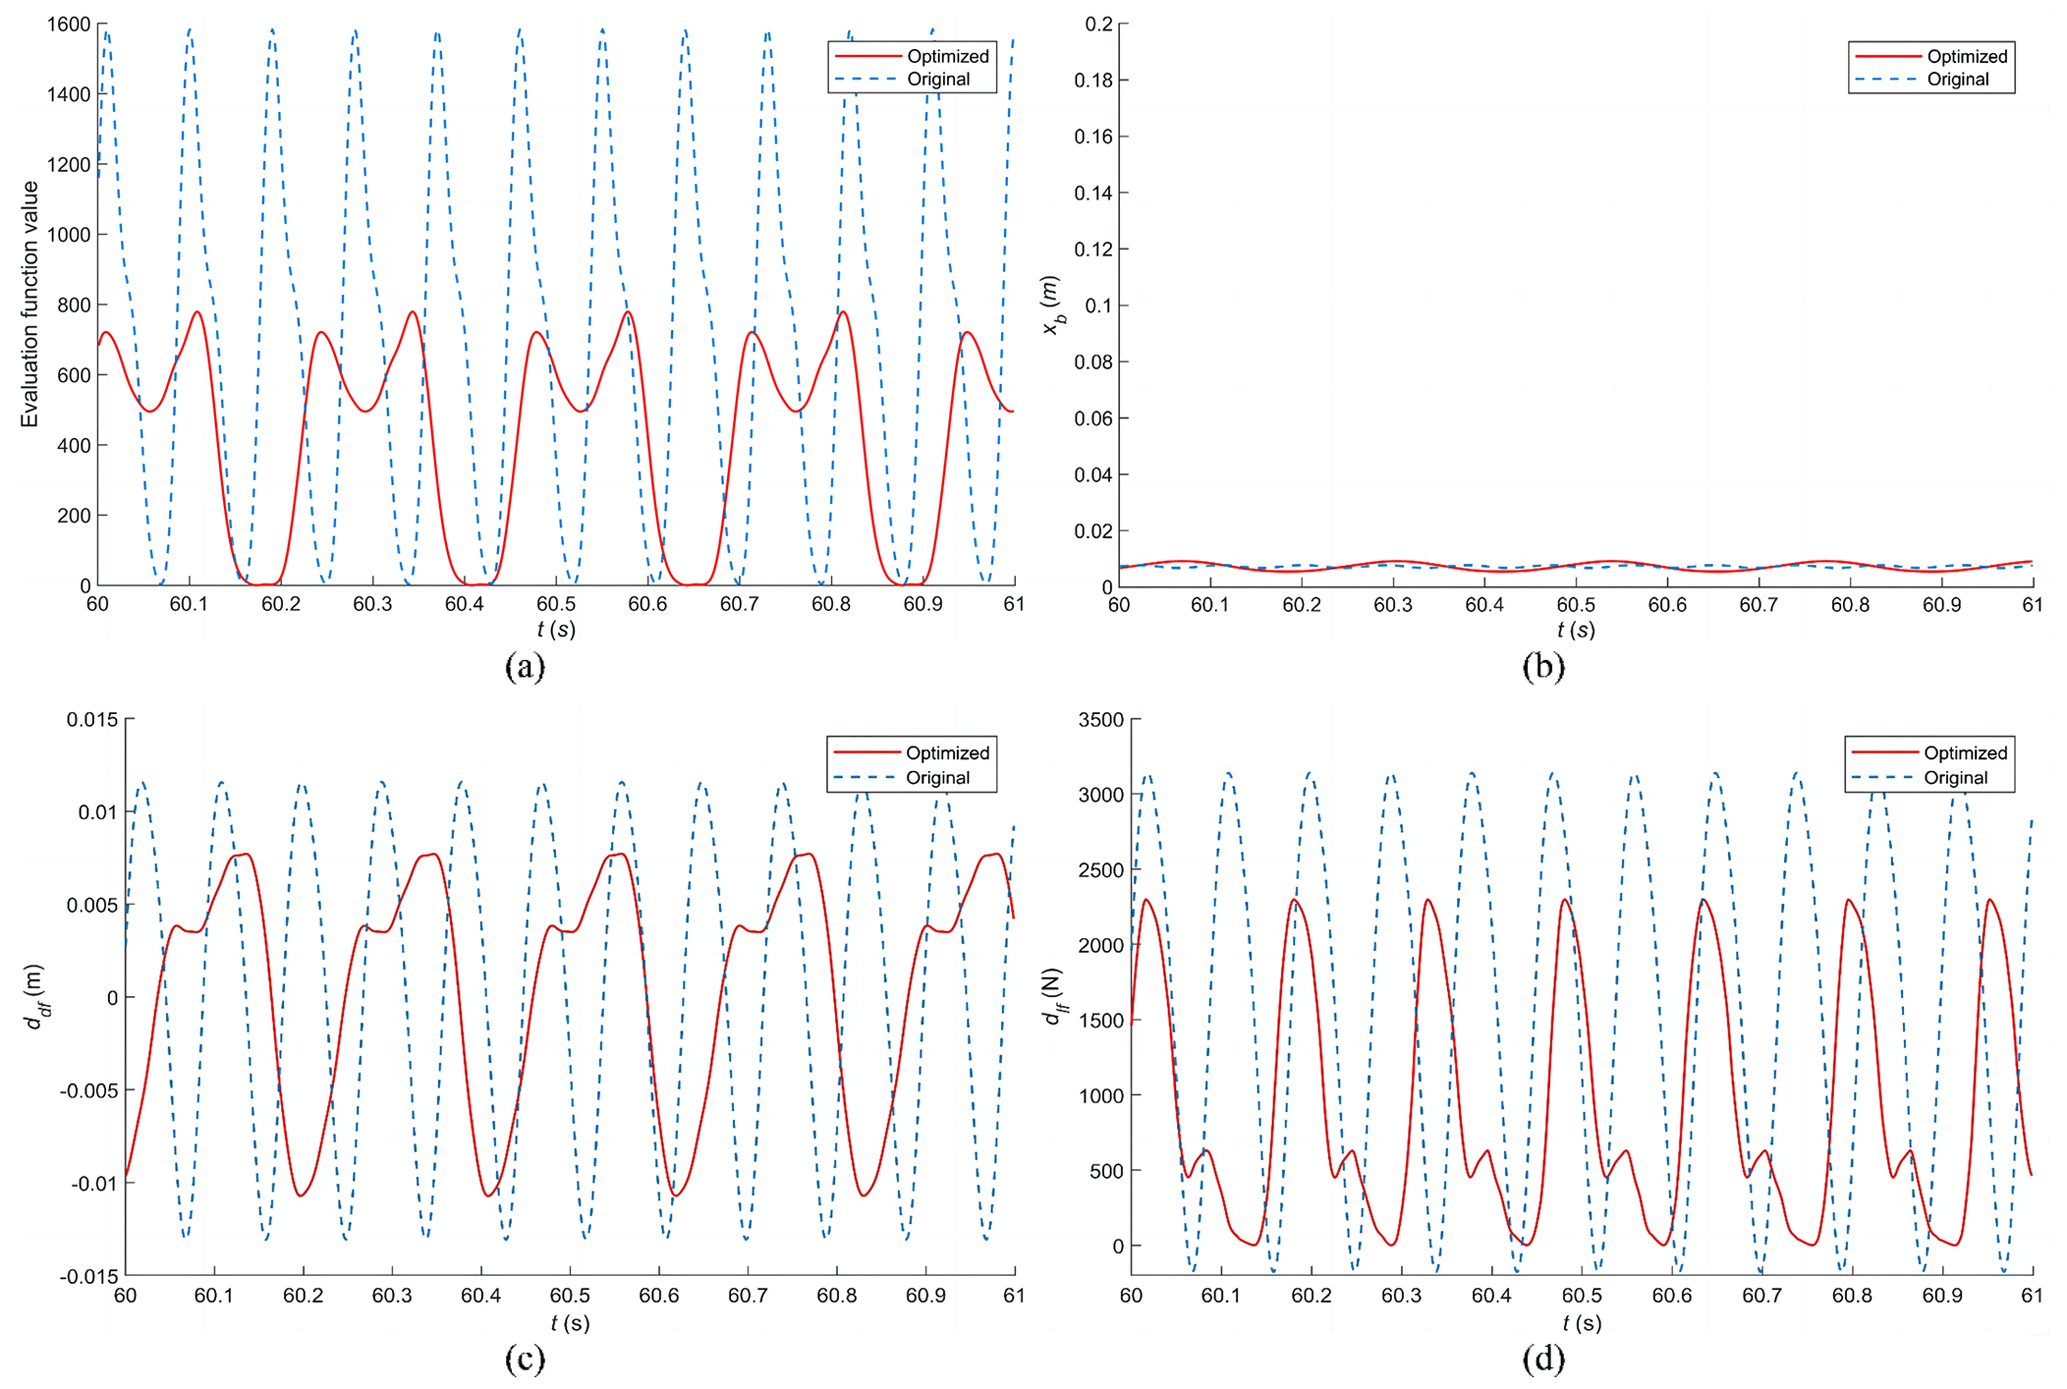
Figure 10Comparison of vehicle response curves over periodic half-sine speed bumps before and after optimisation. (a) Response curve for objective function values F. (b) Response curve for vertical body displacement xb. (c) Response curve for front-suspension dynamic deflection ddf. (d) Response curve for front-wheel dynamic load dlf.
Before optimisation, the vehicle speed was 40.00 km h−1, which was reduced to 15.33 km h−1 after optimisation. Observing Fig. 10, it can be noted that the objective function value after optimisation is significantly lower than before, halving the value from the pre-optimisation state. This indicates an overall improvement in comfort. However, there is a slight increase in vertical body displacement, rising from 0.0097 to 0.0109 m, which has a negligible impact. On the other hand, suspension dynamic deflection decreased from 0.0112 to 0.0086 m, and the wheel dynamic load response was reduced from 2208.8 to 1313.6 N. Further analysis reveals that, before optimisation, there was a risk of wheel lift due to excessive speed, which has been significantly mitigated after optimisation. The spring mass acceleration curve at this stage is shown in the Fig. 11.
The spring mass acceleration has shown a slight increase due to the increase in vertical body displacement. The maximum acceleration value has increased from 0.8828 to 0.9301 m s−2, and the average acceleration has increased from 0.0593 to 0.0645 m s−2. While there is a slight sacrifice in comfort when passing over the semi-sinusoidal speed bump, it ensures the safety and stability of the vehicle.
4.3 Application effects of vehicles passing over periodic rectangular-wave speed bumps
After applying the optimisation algorithm to the rectangular-wave speed bumps, the optimal antibody has an affinity of 1.5087 after convergence, the vehicle speed v is 25.40 km h−1, the front-suspension damping coefficient Cf2 is 1623 kg s−1, and the rear-suspension damping coefficient Cr2 is 1617 kg s−1.
From Fig. 12, it can be observed that the variations in vehicle speed v occur relatively infrequently, and their impact on the optimal affinity of the antibodies is relatively minor. The optimal affinity remains stable between the 160th and 175th generations. Similarly, the rear suspension damping coefficient Cr2 converges around the 175th generation. The trends in changes for the front and rear damping coefficients are relatively similar. Upon comparison, it is evident that the overall optimal affinity increases as the absolute difference between the front and rear damping coefficients decreases. Consequently, when passing over speed bumps of rectangular shape, it is necessary to maintain closely matched front and rear damping coefficients. Ultimately, at around the 190th generation, the optimal affinity nearly converges, indicating that the optimal vehicle speed and related parameters for passing over rectangular speed bumps have been obtained.
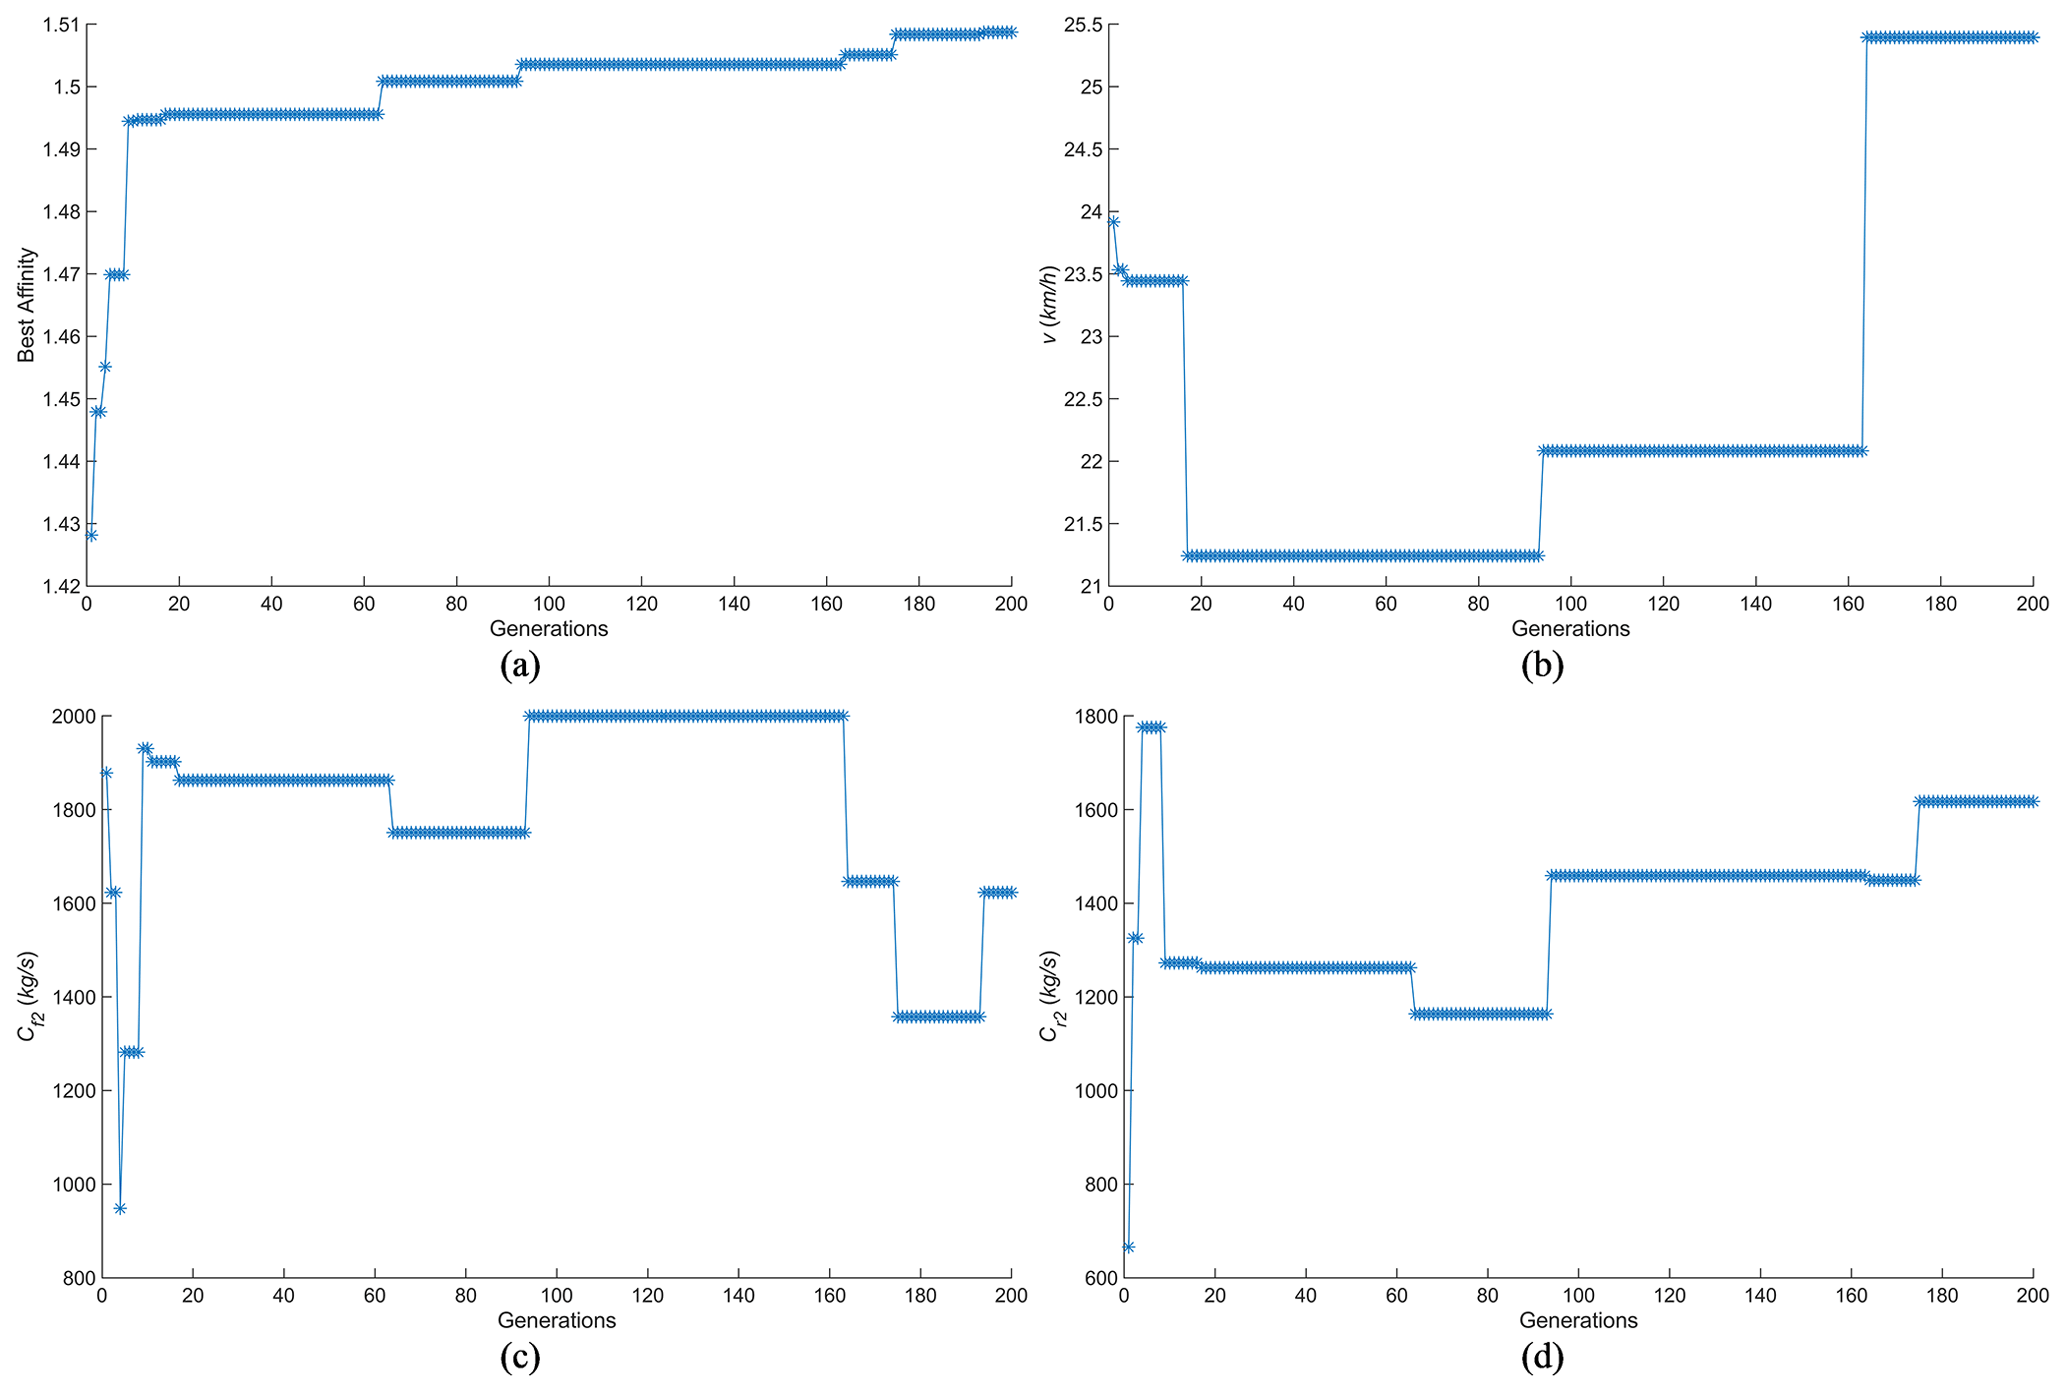
Figure 12Iterative process for each variable of vehicle passing over periodic rectangular-wave speed bumps. (a) Iterative process for optimal affinity. (b) Iterative process for individual optimal v. (c) Iterative process for individual optimal Cf2. (d) Iterative process for individual optimal Cr2.
Figure 13 shows the steady-state response curves of the vehicle suspension system for each parameter system are plotted and contrasted to the response curves prior to optimisation.
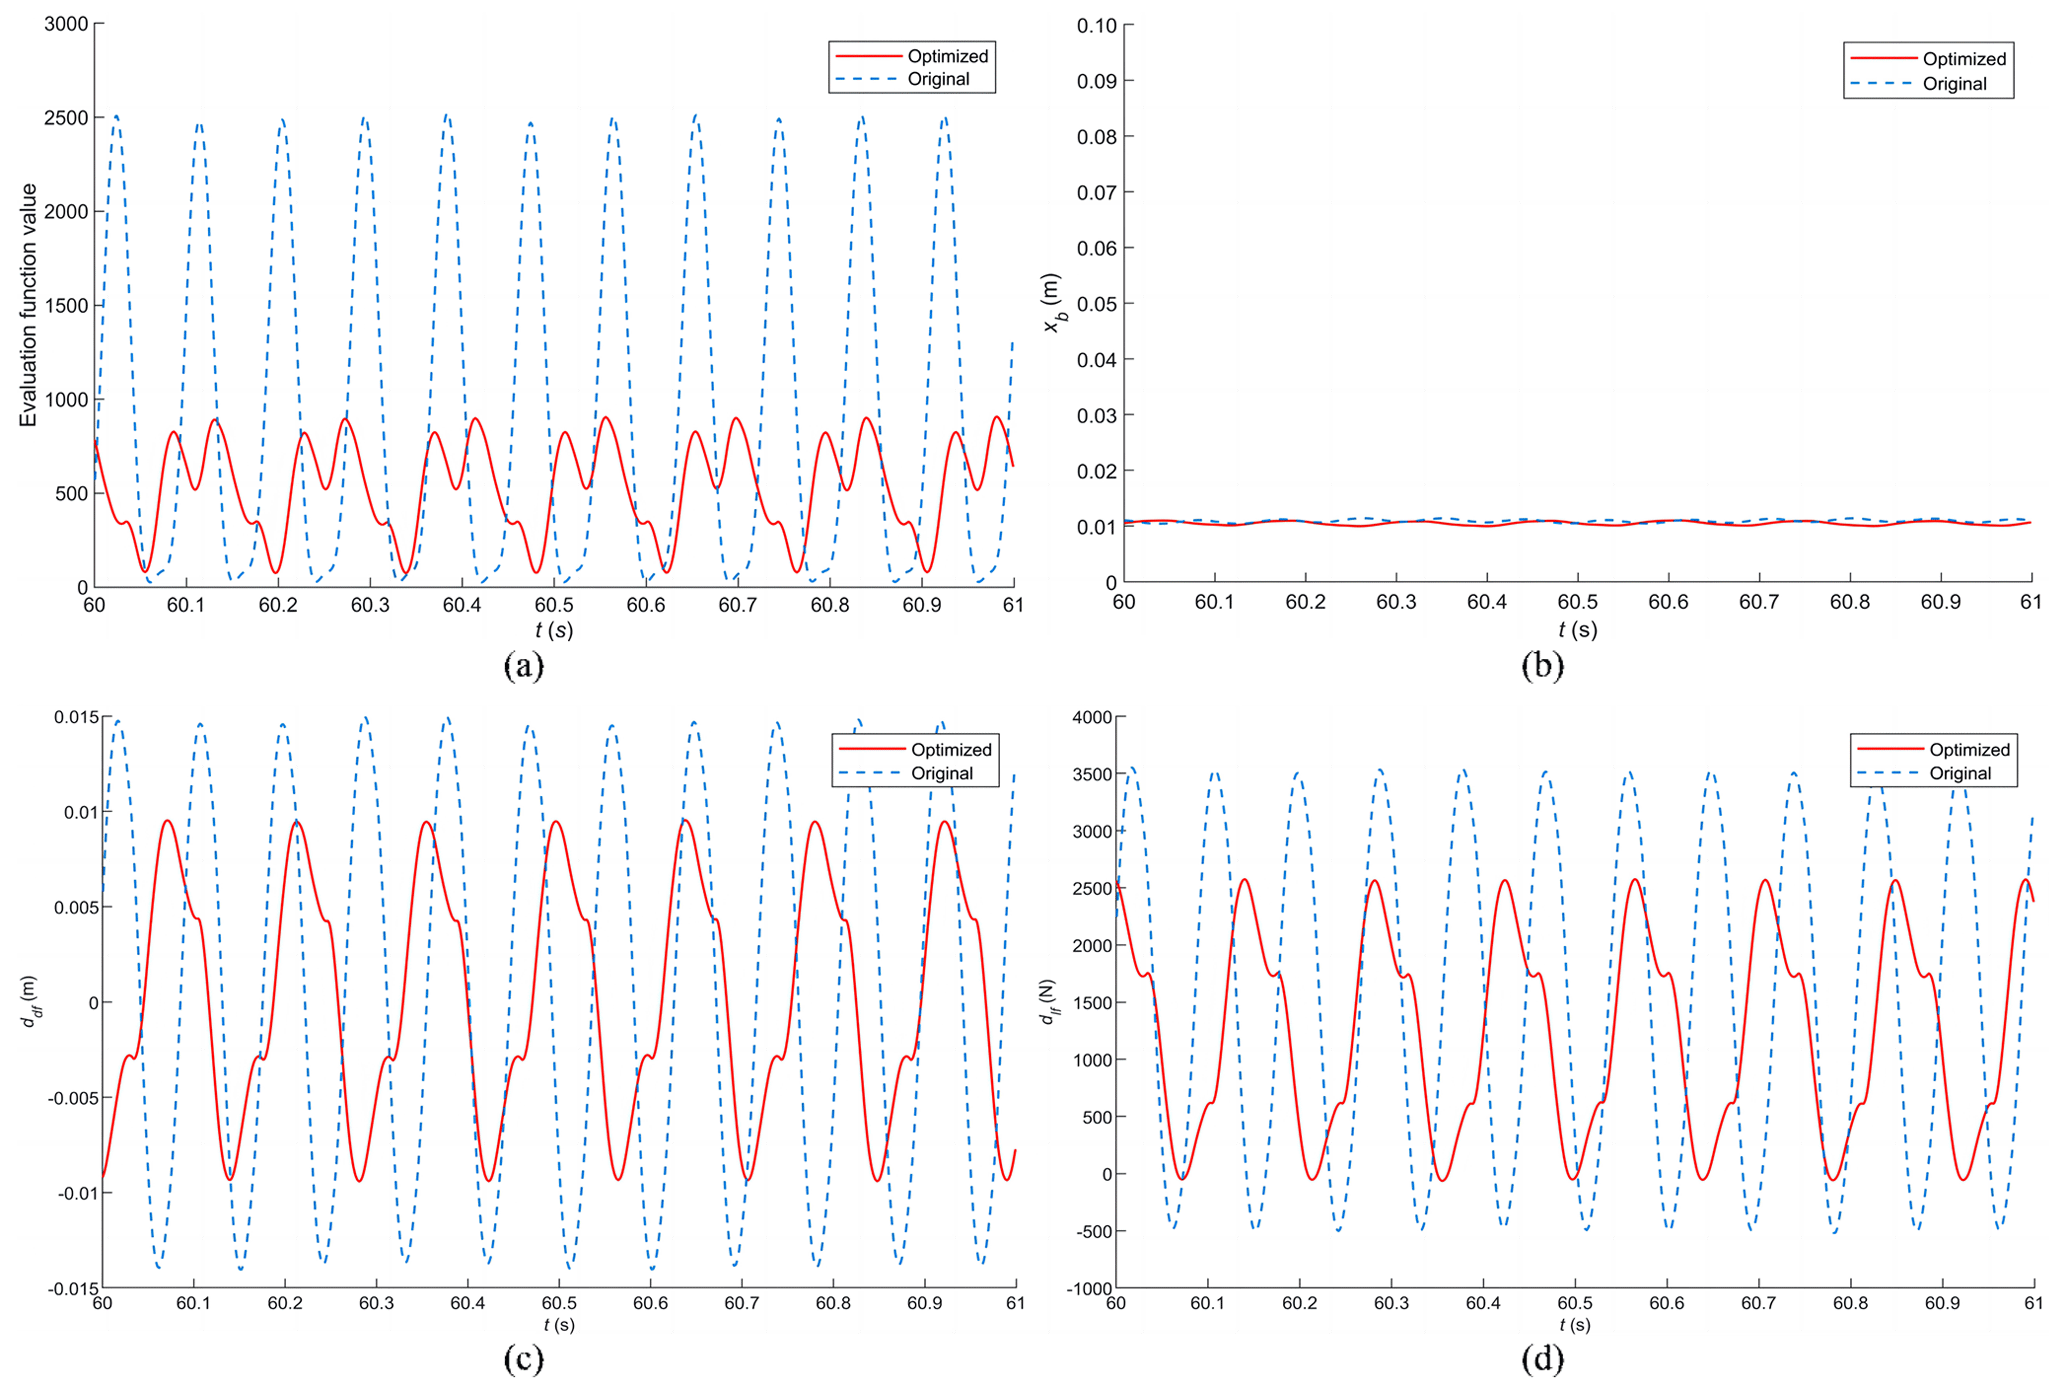
Figure 13Comparison of vehicle response curves over periodic rectangular-wave speed bumps before and after optimisation. (a) Response curve for objective function values F. (b) Response curve for vertical body displacement xb. (c) Response curve for front-suspension dynamic deflection ddf. (d) Response curve for front-wheel dynamic load dlf.
Before optimisation, the vehicle speed was 40.00 km h−1, and after optimisation, it became 25.40 km h−1. Upon observation of Fig. 13, it is evident that the objective function value after optimisation is significantly lower than before. The vertical body displacement has been reduced from 0.0129 to 0.0115 m. Additionally, there have been various degrees of improvement in suspension deflection and wheel load response after optimisation, decreasing from 0.0112 to 0.0054 m and from 2209.1 to 1394.9 N, respectively. These values are considerably lower than the responses before optimisation. Furthermore, it is notable that the risk of wheel lift when passing over rectangular speed bumps, which existed before optimisation, has been reduced. This indicates a substantial increase in the comfort and safety of the vehicle when crossing rectangular speed bumps after optimisation. And the acceleration variation curves of spring mass before and after optimisation are shown in Fig. 14.
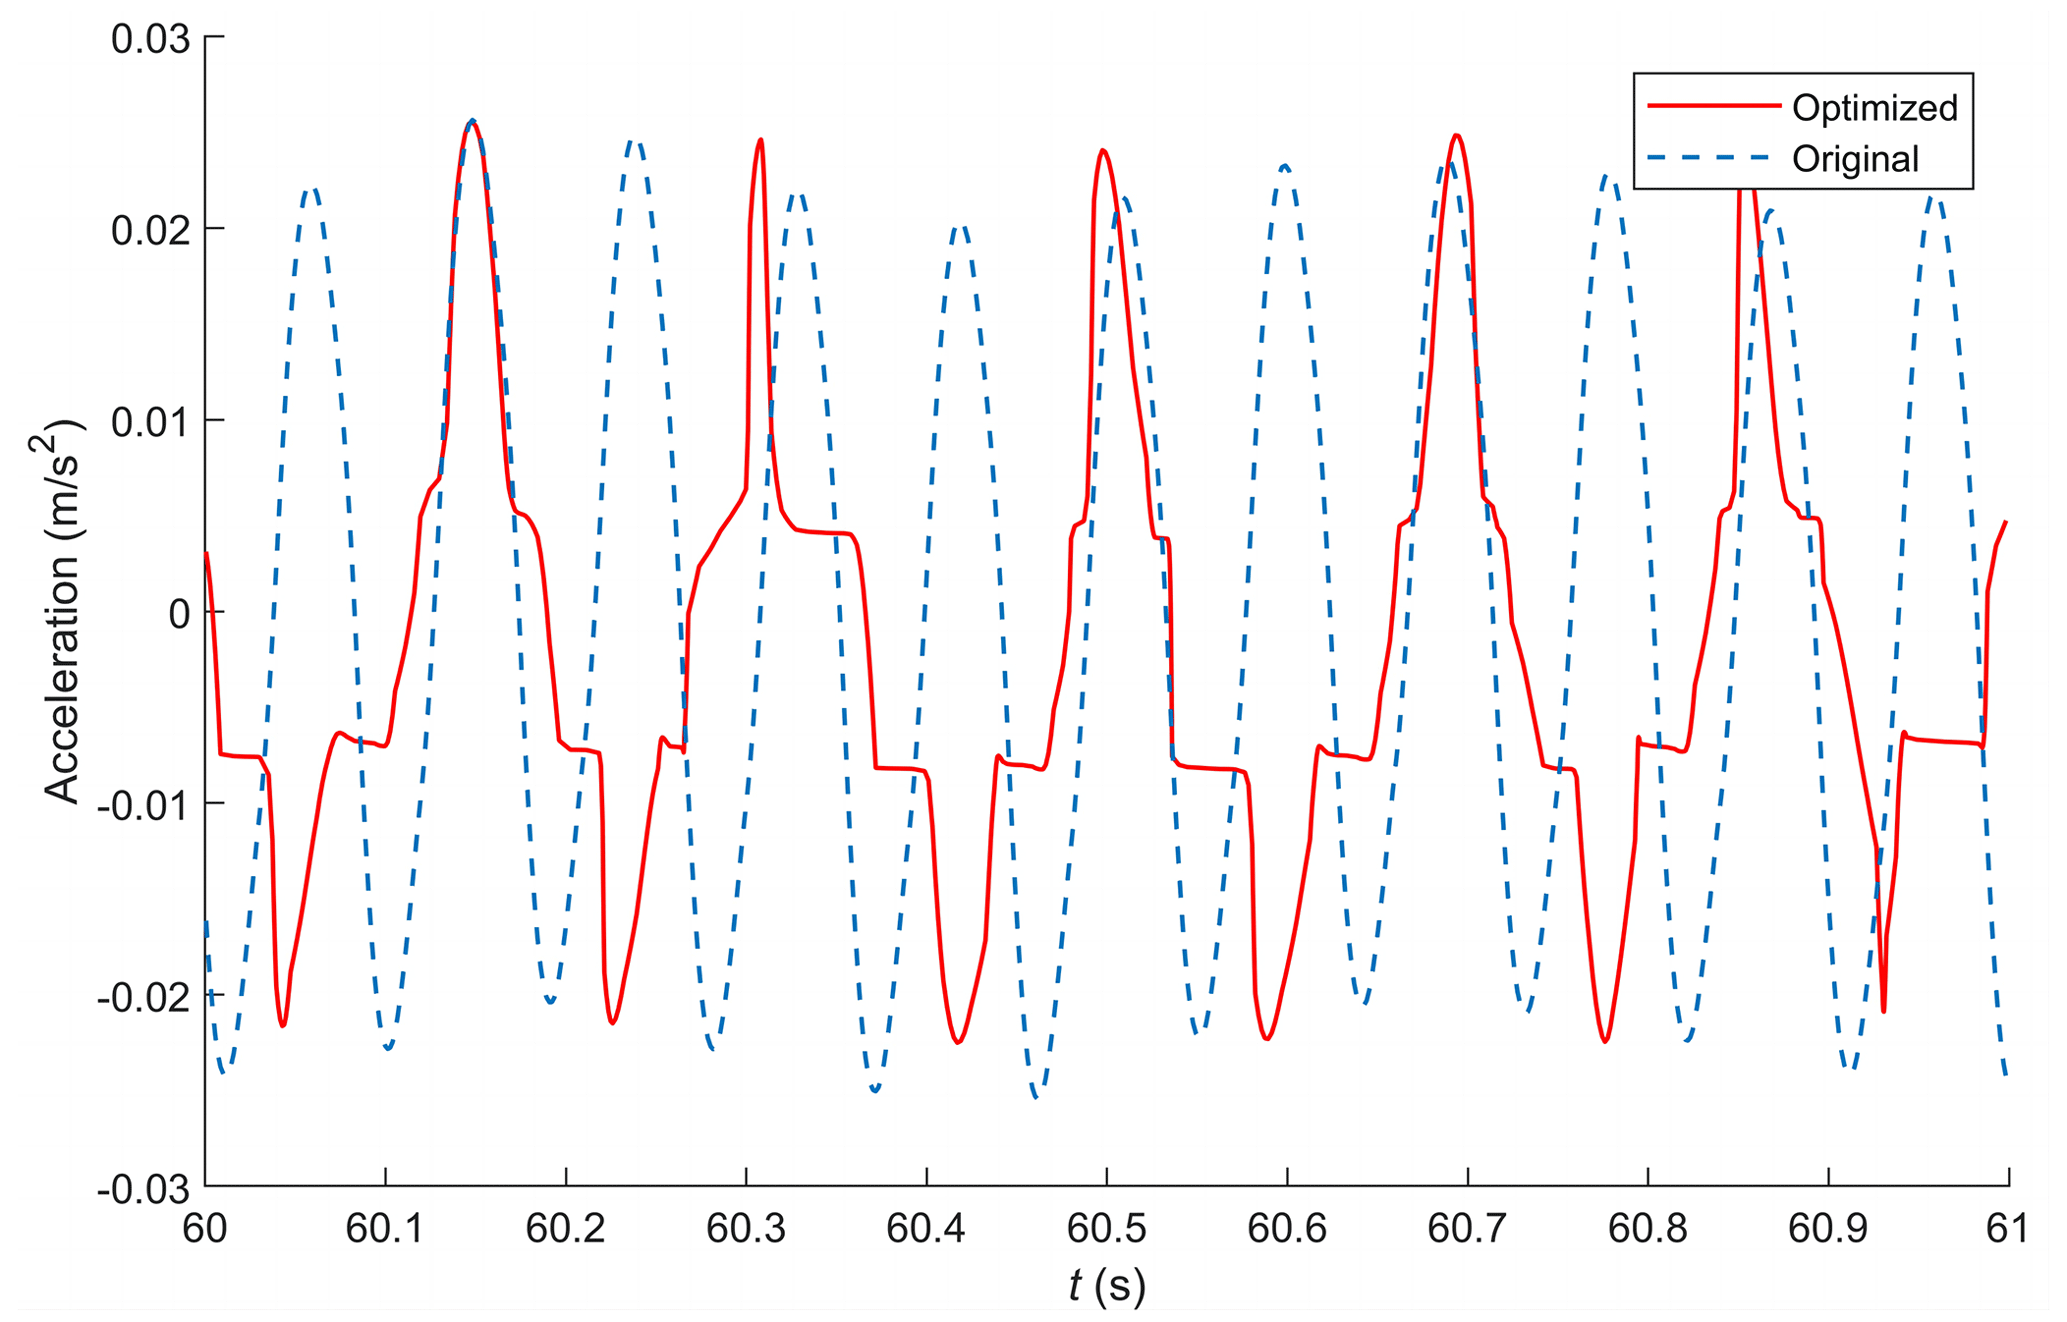
Figure 14Acceleration curves before and after optimisation over rectangular-wave speed bumps.
It can be observed that, after optimisation, there has been a certain degree of reduction in the acceleration of the spring mass. The maximum accelerations before and after optimisation are 0.9807 and 0.9330 m s−2, respectively. According to the rms criterion, the average accelerations before and after optimisation are calculated to be 0.0612 and 0.0543 m s−2, respectively. This indicates that, through optimisation, there has been an improvement in the comfort and safety of the vehicle when crossing rectangular speed bumps.
4.4 Comparative analysis of the optimisation results for vehicles passing over different periodic speed bumps
After the optimisation of the IA, the comparison results before and after the vehicle pass over different types of periodic speed bumps are shown in Table 3.
Table 3Analysis of optimisation results for vehicles passing over three types of speed bumps.
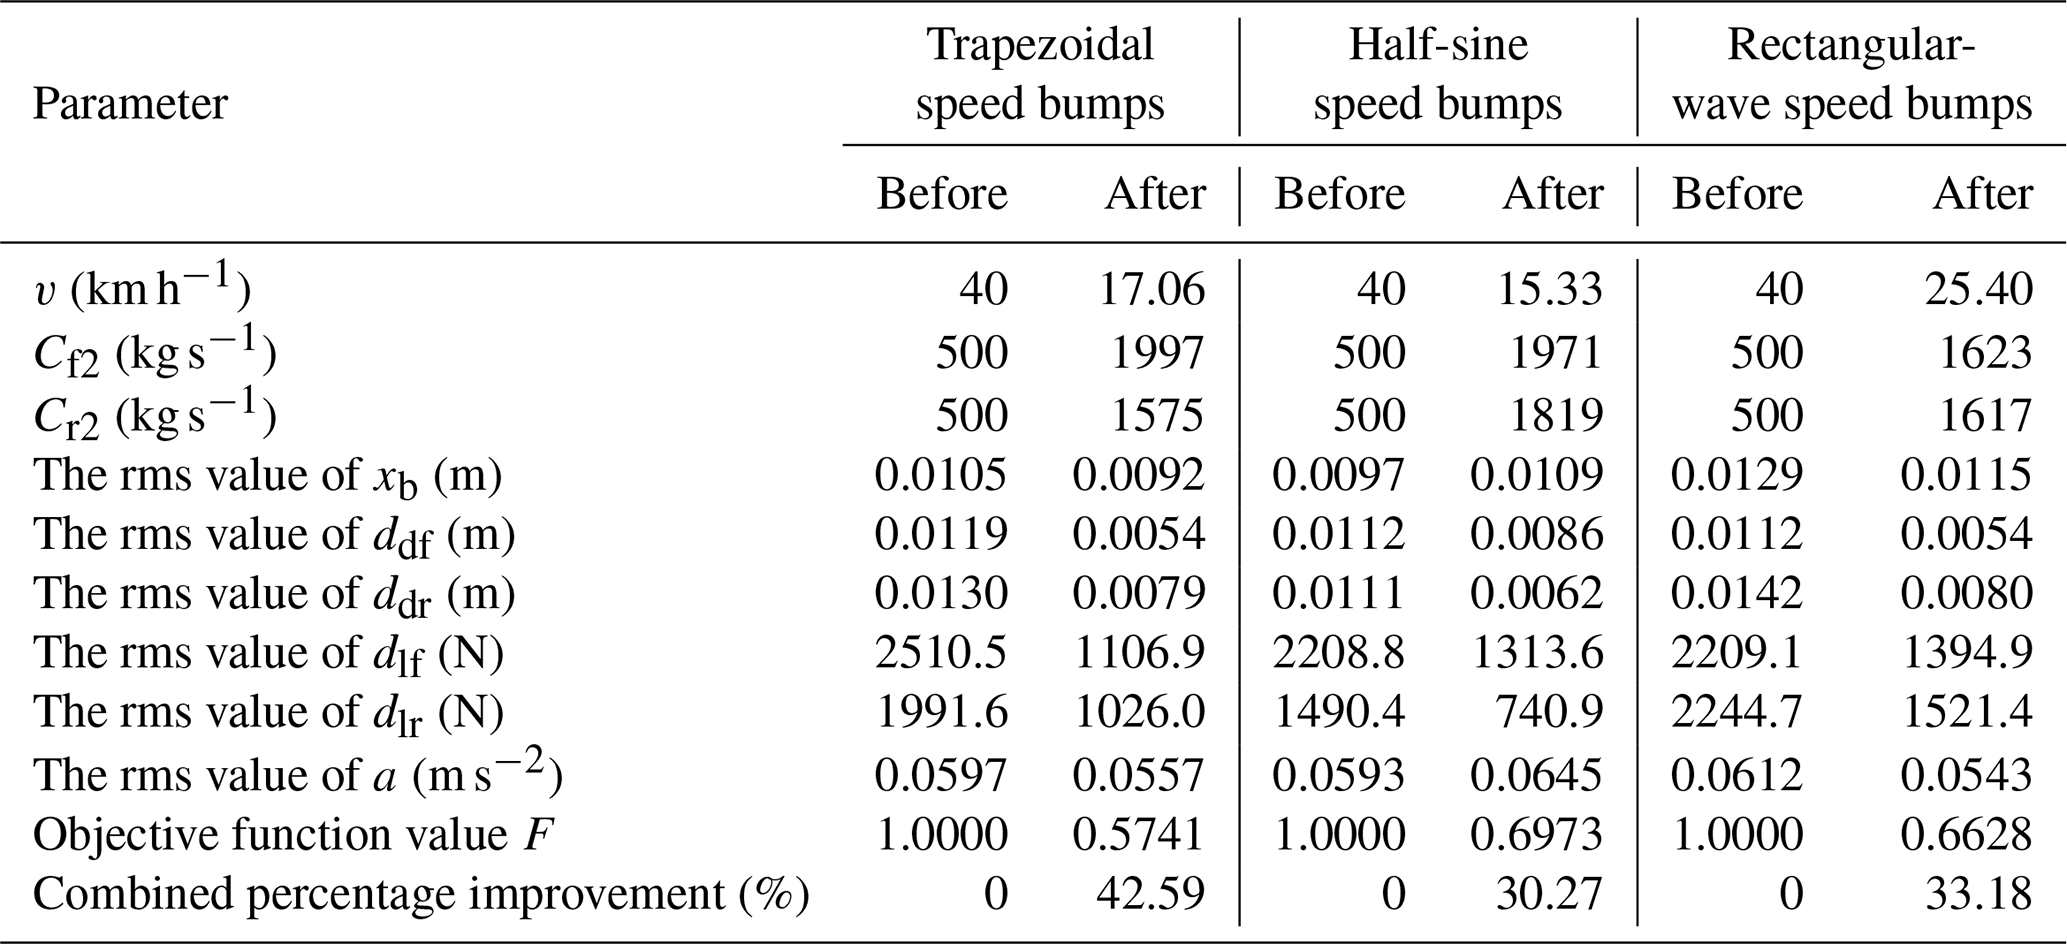
After optimisation of the immune optimisation algorithm, the optimum speeds and the relevant parameters for passing trapezoidal, half-sine, and rectangular-wave speed bumps are obtained. The indicators for measuring vehicle safety and comfort have been vastly improved compared to those before optimisation, and the most obvious is the trapezoidal speed bump.
The following information can be gleaned through horizontal comparison:
-
Under the premise of ensuring the efficiency of passing over speed bumps, the vehicle can maintain better comfort and safety when passing over rectangular-wave speed bumps at a relatively fast speed (25.40 km h−1) while keeping the front and rear damping coefficients of the vehicle within a relatively low range and requiring relatively little from the body suspension.
-
When passing over the half-sine speed bump, it is necessary to maintain a relatively low vehicle speed (15.33 km h−1). However, the relatively large range of the vehicle's front and rear damping coefficients places relatively high demands on the body suspension.
-
The speeds and suspension damping coefficients over the trapezoidal speed bumps are between (1) and (2).
-
Passing over the rectangular speed bumps requires low vehicle suspension. These speed bumps can be passed over faster; they suitable for roads where the speed limits are not very high and do not need to be passed over at a very slow speed. Trapezoidal and half-sine speed bumps have relatively high requirements in terms of the body suspension, and the damage to the body suspension is more significant when passing over quickly. Therefore, these speed bumps are suitable for sections where speed limits are demanding and where passing speeds are slow to ensure the safety of the vehicle.
By comparing results before and after the optimisation, it can be observed that the vehicle has a slight increase in vertical displacement due to the influence of the shape of the speed bumps and the change in the relevant vehicle parameters when passing over the half-sine speed bumps. Although a small part of the vehicle's comfort has been sacrificed, it ensures the safety and stability of the vehicle.
The paper constructs a multi-objective optimisation algorithm based on the IA to optimise the vertical displacement of the body, the dynamic deflection of the suspension, and the dynamic wheel loads. The experiments simulate the 4-DOF vehicle passing over the periodic trapezoidal speed bumps, the periodic half-sine speed bumps, and the periodic rectangular-wave speed bumps to solve for the optimum speed and relevant parameters for passing and draw the following conclusions:
-
After optimisation by the immune optimisation algorithm, the optimum speed of the vehicle can be obtained when driving over various shapes of continuous speed bumps.
-
Various factors will affect the safety and comfort of the vehicle when passing over different speed bumps. In addition to adjusting the speed of the vehicle, the coefficients of the front- and rear-suspension dampers need to be adjusted based on an optimisation algorithm to obtain the optimum level of comfort and safety.
-
After optimisation by the immune optimisation algorithm, the comfort index of the vehicle over the three types of speed bumps was significantly improved, with the most remarkable improvement being in trapezoidal speed bumps, followed by rectangular-wave speed bumps, and finally half-sine wave speed bumps, with improvements of 42.59 %, 33.18 %, and 30.27 %, respectively.
-
Based on the premise of ensuring the efficiency of passing over speed bumps, rectangular-wave speed bumps are suitable for being passed over at a faster speed and can obtain good comfort and safety; they are suitable for road sections with relatively low speed limit requirements and do not need to be passed over very slowly. However, trapezoidal and half-sine speed bumps require relatively high suspension damping coefficients and need to be passed over at a slower speed to obtain good comfort and safety. They are suitable for road sections where the speed limit is strict and need to be passed over carefully and slowly.
The results of the paper offer a solution to the speed adaptation problem of vehicles passing over different speed bumps, provide a scientific basis for the installation of speed bumps on different-speed-limit roads, provide a reliable reference for the study of the comfort and safety of vehicles on uneven roads, and also provide reliable data for subsequent research on the comfort of speed adaptive regulation.
However, the optimisation algorithm is not sufficient to optimise the vehicle passing over the partial speed bumps; it improves the safety when the vehicle passes over the half-sine speed bumps, but the comfort is slightly sacrificed, and further research is needed. Meanwhile, the results of this study are still at the theoretical stage, and further experimental verification and optimisation on actual vehicles are required to achieve a higher level of research results.
Most the data used in this article can be obtained by request from the corresponding author (zyy@cqvie.edu.cn).
ZY and RZ proposed and developed the overall concept of the paper. ZY, RZ, and YZ conducted the experimental realisation and analysis. RZ, ZG, and JG wrote the whole paper.
The contact author has declared that none of the authors has any competing interests.
Publisher’s note: Copernicus Publications remains neutral with regard to jurisdictional claims made in the text, published maps, institutional affiliations, or any other geographical representation in this paper. While Copernicus Publications makes every effort to include appropriate place names, the final responsibility lies with the authors.
The authors are grateful to the Fundamental Research Funds for the Science and Technology Research Project of Chongqing Municipal Education Commission, China (grant no. KJQN201903402); the Fundamental Research Funds for the Natural Science Foundation of Chongqing, China (grant no. cstc2021ycjh-bgzxm0088); and the Fundamental Research Funds for Science and Technology Research Project of Chongqing Municipal Education Commission, China (grant no. KJZD-M202303401), for the support.
This research has been supported by the Natural Science Foundation of Chongqing Municipality (grant no. cstc2021ycjh-bgzxm0088), the Program for Innovation Team Building at Institutions of Higher Education in Chongqing Municipality (grant no. CXQT21032), and the Chongqing Municipal Education Commission (grant no. KJZD-M202303401).
This paper was edited by Marek Wojtyra and reviewed by two anonymous referees.
Barreno, F., Santos, M., and Romana, M. G.: A novel adaptive vehicle speed recommender fuzzy system for autonomous vehicles on conventional two-lane roads, Expert Syst., 41, e13046, https://doi.org/10.1111/exsy.13046, 2022.
Chen, X.: Research on application of artificial intelligence model in Automobile Machinery Control System, Int. J. Heavy Veh. Syst., 27, 83–96, https://doi.org/10.1504/IJHVS.2020.104409, 2020.
Gao, J. and Qi, X.: Study of suspension parameters matching to enhance vehicle ride comfort on Bump Road, Shock. Vib., 2021, 1–20, https://doi.org/10.1155/2021/5806444, 2021.
Gong, M., Jiao, L., Liu, F., and Ma, W.: Immune algorithm with orthogonal design based initialization, cloning, and selection for global optimization, Knowl. Inf. Syst., 25, 523–549, https://doi.org/10.1007/s10115-009-0261-8, 2009.
Huang, T., Wang, J., and Pan, H.: Adaptive bioinspired preview suspension control with constrained velocity planning for Autonomous Vehicles, IEEE Trans. Intell. Veh., 8, 3925–3935, https://doi.org/10.1109/tiv.2023.3273620, 2023.
Liu, Z., Si, Y., and Sun, W.: Ride Comfort Oriented Integrated Design of preview active suspension control and longitudinal velocity planning, Mech. Syst. Signal Process., 208, 110992, https://doi.org/10.2139/ssrn.4545334, 2023.
Mahmoodabadi, M. J. and Nejadkourki, N.: Optimal fuzzy adaptive robust PID control for an active suspension system, Aust. J. Mech. Eng., 20, 681–691, https://doi.org/10.1080/14484846.2020.1734154, 2020.
Miracle, P. U., Bala, J. A., Aibinu, A. M., and Folorunso, T. A.: Intelligent Speed Bump Identification and speed control system for autonomous vehicles: A conceptual design, in: 2021 1st International Conference on Multidisciplinary Engineering and Applied Science (ICMEAS), Abuja, Nigeria, 15–16 July 2021, https://doi.org/10.1109/ICMEAS52683.2021.9692403, 1–6, 2021.
Motallebi, S., Xie, H., Tanin, E., Qi, J., and Ramamohanarao, K.: Route intersection reduction with connected Autonomous Vehicles, Geoinformatica, 25, 99–125, https://doi.org/10.1007/s10707-020-00420-z, 2020.
Nguyen, D. N. and Nguyen, T. A.: A novel hybrid control algorithm sliding mode–PID for the active suspension system with state multivariable, Complexity, 2022, 1–14, https://doi.org/10.1155/2022/9527384, 2022a.
Nguyen, D. N. and Nguyen, T. A.: Evaluate the stability of the vehicle when using the active suspension system with a hydraulic actuator controlled by the OSMC algorithm, Sci. Rep., 12, 19364, https://doi.org/10.1038/s41598-022-24069-w, 2022b.
Nguyen, D. N. and Nguyen, T. A.: Proposing an original control algorithm for the active suspension system to improve vehicle vibration: Adaptive fuzzy sliding mode proportional-integral-derivative tuned by the Fuzzy (AFSPIDF), Heliyon, 9, 19364, https://doi.org/10.1016/j.heliyon.2023.e14210, 2023.
Pan, H. and Sun, W.: Nonlinear output feedback finite–time control for vehicle active suspension systems, IEEE Trans. Industr. Inform., 15, 2073–2082, https://doi.org/10.1109/TII.2018.2866518, 2019.
Sha, S., Wang, Z., and Du, H.: Research on performance of vehicle semi–active suspension applied magnetorheological damper based on linear quadratic Gaussian control, Noise Vib. Worldw., 51, 119–126, https://doi.org/10.1177/0957456520923320, 2020.
Shieh, M., Chiou, J., and Liu, M. T.: Design of immune–algorithm–based adaptive fuzzy controllers for active suspension systems, Adv. Mech. Eng., 6, 916257, https://doi.org/10.1155/2014/916257, 2014.
Walavalkar, S., Tandel, V., Thakur, R. S., Kumar, V. V. P., and Bhuran, S.: Performance comparison of various controllers on semi–active vehicle suspension system, ITM Web Conf., 40, 01001, https://doi.org/10.1051/itmconf/20214001001, 2021.
Wang, L., Yang, Z., Chen, X., Zhang, R. and Zhou, Y.: Research on adaptive speed control method of an autonomous vehicle passing a speed bump on the highway based on a genetic algorithm, Mech. Sci., 13, 647–657, https://doi.org/10.5194/ms-13-647-2022, 2022.
Wu, J., Zhou, H., Liu, Z., and Gu, M.: Ride Comfort Optimization via speed planning and preview semi-active suspension control for autonomous vehicles on uneven roads, IEEE Trans. Veh. Technol., 69, 8343–8355, https://doi.org/10.1109/tvt.2020.2996681, 2020.
Wu, Y., Li, J., Nong, D., and Liu, S.: Nonlinear vibration analysis for automobile stimulated by speed control hump, J. Dyn. Control., 12, 147–152, https://doi.org/10.6052/1672-6553-2013-072, 2014.
Yan, S., Sun, W., He, F., and Yao, J.: Adaptive fault detection and isolation for active suspension systems with model uncertainties, IEEE Trans Reliab, 68, 927–937, https://doi.org/10.1109/TR.2018.2868949, 2019.
Yang, Z., Liang, S., Sun, Y., and Zhu, Q.: Vibration suppression of four degree–of–freedom nonlinear vehicle suspension model excited by the consecutive speed humps, J. Vib. Control., 22, 1560–1567, https://doi.org/10.1177/1077546314543728, 2016.
Yang, Z., Liang, S., Zhu, Q., Zhou, T., and Zeng, C.: Chaotic vibration and comfort analysis of nonlinear full–vehicle model excited by consecutive speed control humps, Math. Probl. Eng., 2014, 1–9, https://doi.org/10.1155/2014/370634, 2014.
Yang, Z., Liang, S., and Zhou, T.: Research on Chaotic Vibration Characteristics of Nonlinear Half Vehicle Model under Quasi–Periodic Excitation, J. Zhengzhou. Univ. (Eng Sci), 2015, 5, https://doi.org/10.3969/j.issn.1671-6833.2015.01.026, 2015.
Yang, Z., Wang, L., Liu, F., and Li, Z.: Nonlinear dynamic analysis of constant–speed and variable–speed of autonomous vehicle passing uneven road, J. Vibroengineering., 24, 726–744, https://doi.org/10.21595/jve.2022.22250, 2022.
Yu, Y., Zhao, L., and Zhou, C.: Influence of rotor–bearing coupling vibration on dynamic behavior of electric vehicle driven by in–wheel motor, IEEE Access, 7, 63540–63549, https://doi.org/10.1109/ACCESS.2019.2916554, 2019.
Zein, Y. and Darwiche, M.: Fuzzy logic velocity optimization of autonomous vehicles based on road bump geometry, BAU J. Sci. Technol., 1, 2, https://doi.org/10.54729/2959-331X.1016, 2020.
Zhang, W. and Zheng, S.: Dynamic Characteristics Simulation Analysis of Tracked Vehicle Tire under Different Road Conditions, Tire Ind., 42, 7, https://doi.org/10.12135/j.issn.1006-8171.2022.01.0003, 2022.
Zhu, Q. and Ishitobi, M.: Chaos and bifurcations in a nonlinear vehicle model, J. Sound Vib., 275, 1136–1146, https://doi.org/10.1016/j.jsv.2003.10.016, 2004.