the Creative Commons Attribution 4.0 License.
the Creative Commons Attribution 4.0 License.
 | 20 Oct 2023
Finite-element method for the analysis of surface stress concentration factor and relative stress gradient for machined surfaces
Guangtao Xu
Zeyuan Qiao
Shaokang Wu
Tianyi Liu
Minghao Zhao
Gang Wang
Surface topography is an important parameter for evaluating the quality of surface machining, and the stress concentrations produced at notches can have a profound effect on the fatigue life of notched components. The stress concentration factor (SCF, Kt) and relative stress gradient (RSG, χ) are important parameters used to quantitatively characterize stress concentration. In this study, a finite-element (FE) method was used to evaluate the surface SCF and RSG and determine the effect of microscopic surface topography on machined surfaces. An FE simulation of the static tension test of V-notched round-bar specimens was performed, and the stress due to the local surface topography was investigated. The FE method was used to analyze the stress concentration of round-bar specimens with Kt=1, and the reliability of the results was verified using a perturbation method. The FE method was used to calculate the surface SCF and RSG with high accuracy. The surface SCF and RSG values increased with the surface roughness, and the local maximum values of the surface SCF and RSG were at the bottom of the local topography. Therefore, the SCF and RSG could be estimated based on a linear relationship involving average roughness.
- Article
(3077 KB) - Full-text XML
- BibTeX
- EndNote


A gear is a core component of a gearbox, and the surface topography of the gear root has a significant impact on its fatigue life. The effect of surface topography on fatigue life is mainly due to fatigue failure caused by surface stress concentration. Fatigue failure usually initiates at a high stress concentration; therefore, investigating the stress concentration of essential components is of great engineering significance. The stress concentration due to the machined surface topography is more complicated than that due to the macroscopic geometrical profile, which greatly influences the fatigue life and wear resistance of the components (Peterson and Plunkett, 1975; Pilkey and Pilkey, 2007; Peng et al., 2023a). Therefore, quantitative evaluation of the effect of surface topography on stress concentration is crucial.
Stress concentration is the phenomenon of a local stress increase due to a size change or notch in the component. The stress concentration factor (SCF) and relative stress gradient (RSG) are key parameters used to quantitatively characterize stress concentration phenomena and can be used as a bridge to study the relationship between surface topography and fatigue life. Inglis (1913) proposed the concept of SCF and quantitatively analyzed the stress concentration effect of a notch based on an elliptical hole problem. Since then, scholars have intensively studied the SCF. The perturbation method rearranges a plane by adding a disturbance to a completely flat reference plane to produce a slight displacement (Ma et al., 2018). The total displacement after the disturbance is equal to the sum of the displacement of the reference plane only subjected to uniform stretching and displacement generated by the disturbance. Moreover, the total stress after the disturbance is equal to the sum of the stress of the reference plane only subjected to uniform stretching and stress generated by the disturbance. Rice (1985) provided an explicit solution for tensile loadings opening a half-plane crack in an infinite body and proposed a new three-dimensional (3D) weight function theory, which relates the weight function and Green's function of the crack problem. This study provided a theoretical method for subsequent analysis of stress concentrations using the perturbation method. Based on the application of Rice's perturbation approach to the stress intensity factor, Gao (1991) analyzed the stress field under uniform tension on a continuous surface with slight fluctuations and obtained the first-order solution of the SCF. Grekov and Makarov (2004) used the perturbation method to analyze the stress concentration caused by the slight bending of a vehicle surface, aiming to investigate the occurrence of semicircular dislocations on the surfaces of semiconductor hetero-epitaxial structures. By using complex potentials and Muskhelishvili representations (Muskhelishvili, 1977), the effect of nano-sized surface asperities arising on an initially planar surface were studied and integral equations of the nth-order approximation were given (Grekov and Kostyrko, 2016). Combining the first-order perturbation approach with the Hilbert transform and Parseval's theorem, Medina and Hinderliter (2014) developed an analytical solution of SCF for a slightly roughened random surface. Medina (2015) derived the first-order perturbation equations for stress concentration formula suitable for multiple shallow irregularities and extended them to the high-order analysis for the surface under the plane stress condition by using the Hilbert transform. Cheng et al. (2017, 2020) derived analytical solutions for the stress concentration of slightly undulating two-dimensional (2D) and 3D surfaces using the first-order perturbation method. Cheng et al. (2022) derived an analytical approach to calculate the stress distribution in machined round bars with a slightly axisymmetric surface topography. Perez et al. (2020) proposed an analytical method for calculating the SCF of a 3D surface topography in different loading directions. Sun et al. (2020) provided a finite-element (FE) method for studying the relationship between the grinding surface topography and SCF using a notch model to analyze and calculate the SCF of the grinding surface micro-topography.
The stress concentrations generated by the geometric profile of a notched component can significantly affect the fatigue life of a specimen (Sehitoglu, 1983). Adib-Ramezani and Jeong (2007) investigated the influence of the stress gradient at the notch root on the component life and proposed that not only the SCF but also the stress gradient affect the notch life. Wang et al. (2013) investigated the factors affecting notch fatigue life. By introducing the stress gradient into the fatigue life prediction equation, they proposed a fatigue life prediction method that comprehensively considered the average stress, stress gradient, and size effect. Therefore, both SCF and RSG are important for evaluating stress concentration, and the influences of both factors can be considered comprehensively in the evaluation. Ma et al. (2018) extended the perturbation method to 2D random surfaces. The rough surface profile was represented by a Fourier series, and the analytical solutions of the SCF and RSG were derived using a stress expression. This part of the study produced an important method for the comprehensive evaluation of stress concentration problems.
For the surface topography generated by machining, the concave area perpendicular to the direction of machining tool marks is prone to stress concentration. Thus, it is important to investigate the stress distribution in the concave area rather than in the entire surface topography. Machining marks occur on the surfaces of the machined parts and are analogous to small notches. These notches produce stress concentrations in the valleys on the component surfaces, which ultimately affect the fatigue life. The stress concentration due to the surface topography has a significant effect on the surface integrity and fatigue life of components (Taylor and Clancy, 1991; Peng et al., 2023b; Ardi et al., 2015; Suraratchai et al., 2008). Researchers have investigated the relationship between stress and geometry from single notches to multiple ones, no elliptical single notches, and multiple periodic notches and sinusoidal continuous surfaces (Medina et al., 2015). Neuber (2001) proposed a semi-empirical equation for the SCF, explored the relationship between the SCF and surface roughness, and studied the effects of the SCF on fatigue. Arola and Williams (2002) proposed the Arola–Ramulu model, which can theoretically modify Neuber's semi-empirical equation. The complex surface topography was simplified to ideal sinusoidal micro-notches, and the maximum error between the experimental and theoretical results was only 2 %. Zhang et al. (2010) simplified the surface roughness as semi-elliptical micro-notches and proposed a relationship between the surface roughness and fatigue life. Liao et al. (2015) simplified the surface topography as semi-elliptical micro-notches and established a 3D FE model of the flat surface topography to determine the influence of the micro-notch parameters on the SCF. Based on these theories, the functional relationship between surface topography and stress concentration can be used to guide subsequent research on surface topography, which is not concerned with the influence of surface topography on stress concentration factor and relative stress gradient.
To investigate the stress concentration on the surface topography of a complex problem, such as a gear root, a stress concentration analysis of the geometric profiles and surface topography was performed. The stress concentration at the bottom of the V notch was studied to simplify the analysis model. There is are few stress concentration studies that simultaneously consider the surface topography at the notch, and no applicable analytical solution for this compound problem exists. With improved computing efficiency, a numerical analysis method for solving such complex engineering problems has been proposed (Ås et al., 2005, 2008; Abroug et al., 2018). The FE model is based on the geometric shape of a real surface and is thus more accurate than a model described using geometric parameters. Therefore, the FE method is an effective method for analyzing the stress concentration problem of V-notched round-bar specimens.
Numerous studies have focused on the stress concentration factors at notches (Medina et al., 2015; Zhang et al., 2017). Studying the stress concentration at the notch and the surface topography simultaneously is more complex than studying the stress concentration alone, and no theoretical formula is available. Consequently, few studies have focused on the effect of the V-notch surface topography on the overall stress concentration at the notch. The main aim of this study was to investigate the SCF and RSG generated by notch topography using the FE method and to explore the influence of surface roughness on SCF and RSG. This paper is organized as follows. In Sect. 2, an FE analysis method is proposed for determining the surface SCF and RSG of machined surfaces. Actual measurements and FE simulations of the surface topography are described. In Sect. 3, the surface SCF and RSG of round-bar specimens are calculated using the perturbation and FE methods, respectively. The surface SCF and RSG of the V-notched round-bar specimens with different surface topographies are calculated using the proposed FE method. Finally, the conclusions are presented in Sect. 4.
2.1 Analysis model for the SCF of machined surfaces
The surface quality of structural parts, such as gears and shafts, has an important effect on their service life. During processing and use, notches may be produced on the surfaces of structural parts, and stress concentration problems may occur at the notches.
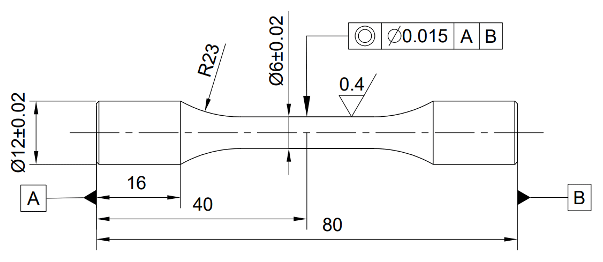
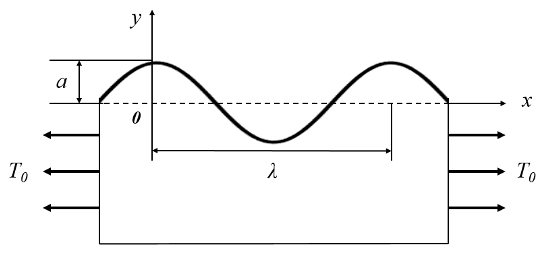
In practical engineering applications, stress concentration frequently occurs at the gear root and bottom of the thread. However, the structures of these components are relatively complex. Herein, a round-bar specimen with a V notch was used to simplify the analyses and calculations. The design is illustrated in Fig. 1.
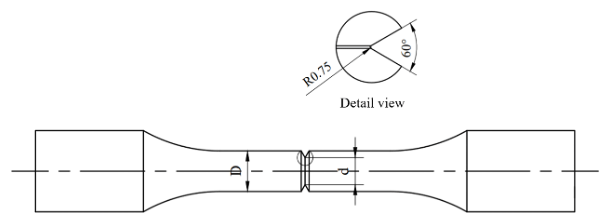
Based on the SCF (Kt) of a V notch under uniaxial tension, a V-notched specimen model was designed as follows (Zhang et al., 2017):
where R is the curvature radius of the notch and d and D are the diameters of the smallest and largest sections, respectively.
2.2 FE method for the surface SCF and RSG of the machined surfaces
Equation (1) applies to an ideal surface without roughness. As the surface of the actual processed specimen is not completely smooth, the machined notch surface also exhibits surface roughness. Therefore, the stress concentration due to the surface topography of the notch must be considered when analyzing the stress concentration of a notch. The surface SCF (Kst) and RSG (χs) generated by the surface topography are different from the SCF (Kt)and RSG (χ) due to the geometric profile only. Using the analytical solution method, analyzing the influence of the introduced surface topography on the stress concentration of the entire notch is difficult. Surface topography is introduced at the bottom of a notch using the FE method, and the stress concentration problem of the notch with surface topography can then be evaluated.
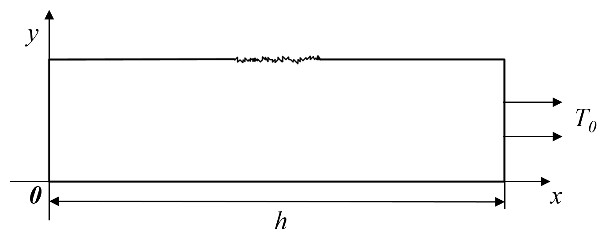
Considering the axial symmetry of the V-notched specimen and simplicity of the model analysis, a simplified stress analysis model of the V-notched specimen is developed, as shown in Fig. 2.
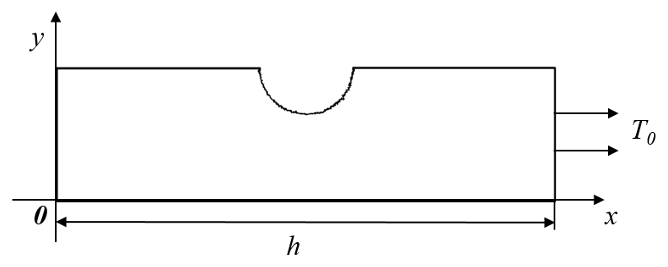
Based on the V-notched specimen model (Fig. 1), a local model was established in accordance with Saint-Venant's principle. The material used in the model was 18CrNiMo7-6 alloy steel. At room temperature, Poisson's ratio of the model was 0.3, and Young's modulus (E) was 206 GPa. The load boundary conditions of the model are as follows:
where T0 is the uniform load,and h is the axial length of the models. The element used in the FE model was PLANE182, and a linear elastic axisymmetric model was obtained from the ANSYS software library. The FE simulation results for the V-notched specimen produced the maximum stress value of the initial smooth V-notched profile at the bottom of the notch.
2.2.1 Surface SCF of the machined V-notched surfaces
The stress concentration problem can be analyzed with a small wave plane by the perturbation method, which can improve the efficiency of the calculation and give reliability results for the round-bar specimen. However, for notches and planes with large fluctuations, the results obtained using the perturbation method to analyze the stress concentration problem are not ideal. Generally, the surface SCF at the notch is calculated as follows:
where di is the notch diameter of the corresponding position of the maximum stress, and σmax and σn are the maximum principal stress and reference nominal stress of the notch from the FE analysis, respectively.
2.2.2 RSG of the machined V-notched surfaces
The temperature gradient was calculated using the thermal analysis solver in the ANSYS analysis software. The calculation principle for the temperature gradient can be expressed as follows:
where is the temperature and n is the unit vector in the normal direction. As the calculation principles of the stress and temperature gradients were the same, the RSG was calculated using the temperature gradient method in ANSYS. The stress gradient reflects the speed at which the stress changes along a certain direction and is expressed as follows:
where σij is the stress tensor and xk is the length in the k direction. Therefore, the surface RSG can be calculated as follows:
where T0 is the uniform tension applied to the model.
2.3 Measurement and simulation of the machined surface topography
2.3.1 Measurement of the surface topography
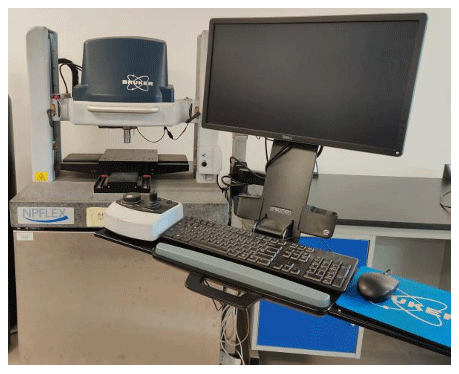
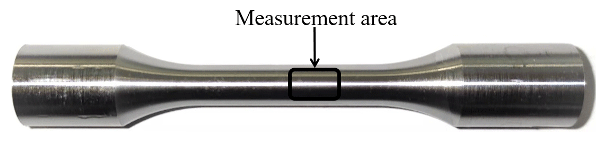
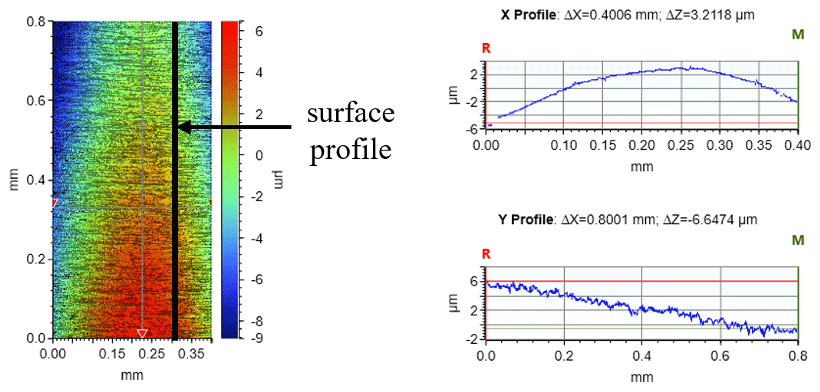
White-light interferometry is an extremely powerful method for 3D profilometry and surface characterization and has been well developed and widely used in microstructure surface profiling in recent years (Zhang et al., 2020). Herein, the original surface topographies of the machined specimens were measured using a white-light interferometer (NPFLEX, Madison, WI, USA) (Fig. 3). According to the standard of the surface topography measurement area and actual size of the round-bar specimens, the axial and radial sampling lengths were 0.8 and 0.4 mm, respectively. Using an example specimen (Fig. 4), the measurement results for the local surface topography are shown in Fig. 5.
2.3.2 Simulation of the surface topography
The stress concentration of the measured surface topography was analyzed using the perturbation method. In the FE simulation, to study the influence of the surface topography on the stress concentration problem, the topography information must be imported into the FE simulation model, that is, the simulated surface topography.
Surface topography, measured using 3D topography, usually refers to the height distribution on the xoy plane. The height distribution z(x,y) can be obtained as follows by a random process η(x,y) using a 2D filter (Chen et al., 2006):
where Δx and Δy are the changes in the x and y directions, respectively. The frequency-domain information is obtained after the Fourier transform of the following function:
where H(ωx,ωy) is the transfer function. The transfer function obtained from the relationship between the power spectral density function and the transfer function is given as follows (Hu and Tonder, 1992):
where C is a constant and Gz(ωx,ωy) is the power spectral density function. Gz(ωx,ωy) can be obtained by the Fourier transform of the autocorrelation function R(Δx,Δy). According to different autocorrelation functions, the topography information can be controlled. For random surfaces with a Gaussian distribution, the autocorrelation function in exponential form can be used as follows:
where Rq is the root-mean-square roughness of the surface, and βx and βy are the autocorrelation factors in the x and y directions, respectively.
According to the abovementioned method, a rough surface is simulated using the MATLAB software. White noise with a Gaussian distribution is generated as a random process η(x,y). The white noise and autocorrelation function R(Δx,Δy) are successively Fourier-transformed to obtain A(ωx,ωy) and power spectral density Gz(ωx,ωy), where the constant C=1. The transfer function and frequency-domain information of the surface topography Z(ωx,ωy) are calculated using Eqs. (9) and (8), respectively. The height information of the surface topography is obtained using the inverse Fourier transform of the frequency-domain information. Finally, the simulation of the rough surface is complete.
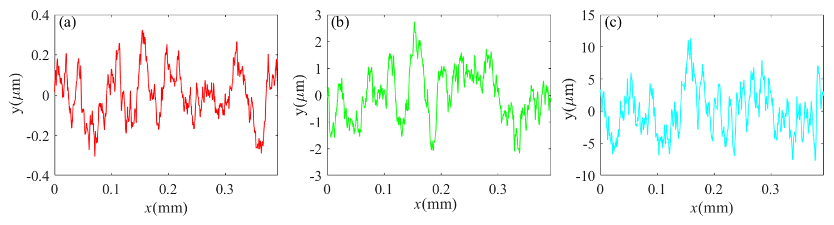
When the surface roughness of the simulated surface topography Ra was 3.2, 0.8, and 0.1, the corresponding root-mean-square roughness Rq values were 0.02, 0.005, and 0.00625, respectively. Because the arc length (L) of the notch in Fig. 1 is 0.393 mm, the surface-contour curve with length L is extracted, and the sampling interval is set to 0.52 µm to ensure that the measuring instrument has the same sampling interval. The profile curves of different surface roughness (Ra) values with a Gaussian distribution are shown in Fig. 6.
3.1 Verification of round-bar specimen
To verify the solution of the surface SCF and RSG for the FE method, the perturbation and FE methods were used to determine the surface SCF and RSG of a round-bar specimen with Kt=1.
3.1.1 Round-bar specimen model
Around-bar specimen model with Kt=1 was designed to verify the proposed FE method using the perturbation method (Fig. 7). After turning and grinding, the surface quality of the specimen satisfied the design requirements of the model.
For the convenience of measuring surface roughness, the round-bar specimen model was simplified (Fig. 8) according to the axial symmetry of the round-bar specimen.
3.1.2 Analysis of the surface SCF and RSG of the specimen by the FE method
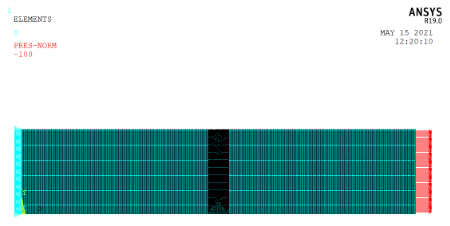
The FE analysis simulation conditions were consistent with those described in Sect. 2.2, and the simulated surface topography (Sect. 2.3.2) was imported into the FE model. The element type used in the FE model was PLANE182. The area with topography was meshed using triangular elements, and the rest of the model was meshed using quadrilaterally shaped elements. A uniform load of T0=100 MPa was applied in the x direction of the FE model to constrain the x displacement on the opposite face. The meshing and loading conditions for the round-bar specimen model with Kt=1 and Ra=3.2 µm are shown in Fig. 9.
3.1.3 Convergence analysis of the FE method
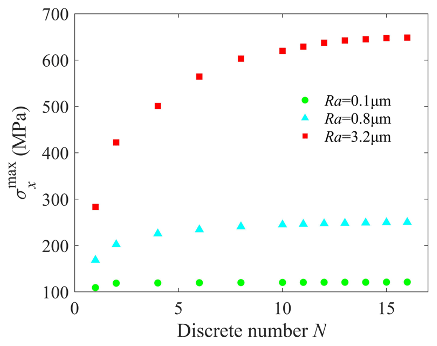
The simulation process demonstrated that the calculation results did not converge at the mesh spacing of 0.52 µm (sampling interval for surface topography measurement). The height information was interpolated N times using the B-SPLINE interpolation at a sampling interval of 0.52 µm, where N is the number of discrete units; µm was used as the mesh size for the surface topography to obtain the solution. The maximum stress of each solution was recorded and convergence was verified. The minimum mesh size is determined using the following Eq. (11):
where σN and σN−1 are the stress values obtained by the Nth and (N−1)th interpolations, respectively, and δ is a constant (5 %).
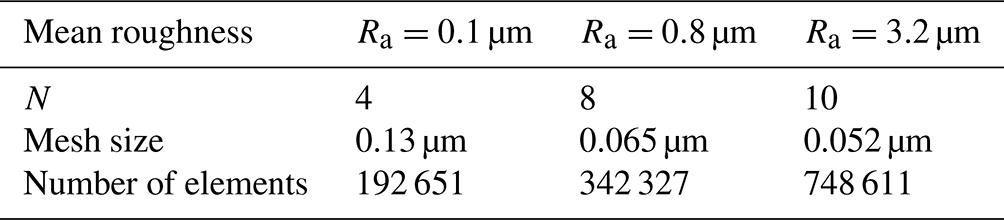
When Kt=1, the maximum stress in the x direction of the different surface topographies is extracted for convergence analysis, as shown in Fig. 10. The minimum grid size is calculated using Eq. (11). As shown in Table 1, the larger the machined surface roughness Ra, the smaller the minimum mesh size required for the simulated surface topography. In addition, the minimum mesh size can provide a reference for selecting the sampling interval for practical measurements of surface topography.
The Kst and χs parameters of the model were derived from the proposed FE analysis method. The Kst and χs values for the round-bar specimens when Kt=1 and Ra=0.1 µm in the FE analysis method are shown in Fig. 11a and b.
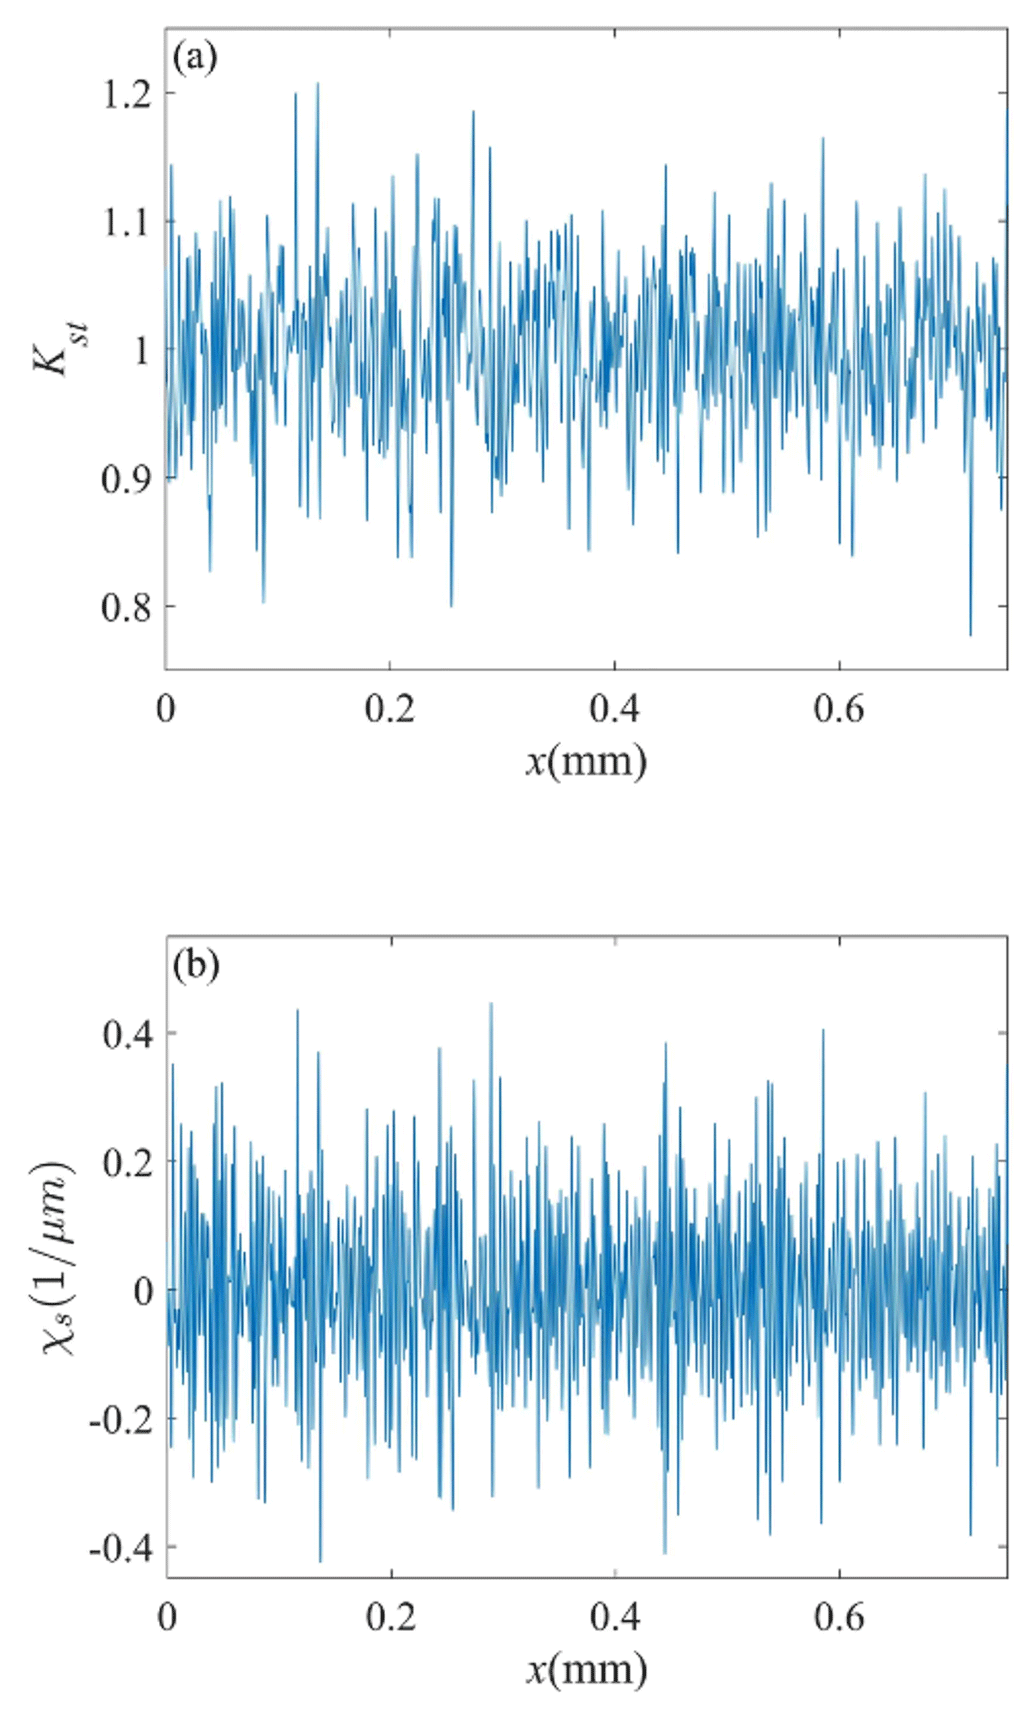
Figure 11Finite-element analysis results: (a) Kst and (b) χs for the round-bar specimens with Kt=1 and Ra=0.1 µm.
As shown in Fig. 11a and b, when the surface SCF changes rapidly, the corresponding surface RSG also increases. Therefore, the RSG reflects the rate of change in the surface SCF.
3.1.4 Comparison of the FE method and perturbation method for machined surface topography
To verify the solution of the FE method, the results of the FE method were compared with those of the perturbation method. Based on Gao's first-order perturbation method (Gao, 1991), Ma et al. (2018) generalized the perturbation method from a single surface profile to a 2D random surface profile. A simplified model of the random surface is shown in Fig. 12.
For the amplitude wavelength ratio of for the random surface, the surface SCF and RSG of the surface profile of the round-bar specimens (Ma et al., 2018) are given as follows:
Using the specimen with Kt=1 and Ra=0.1 µm as an example, the surface topography of the 0.3–0.4 mm segment of this specimen was extracted, and the results of the FE method were compared with those of the perturbation method for a small amplitude–wave-length ratio of , given in Fig. 13a and b. The results of the two methods were consistent.
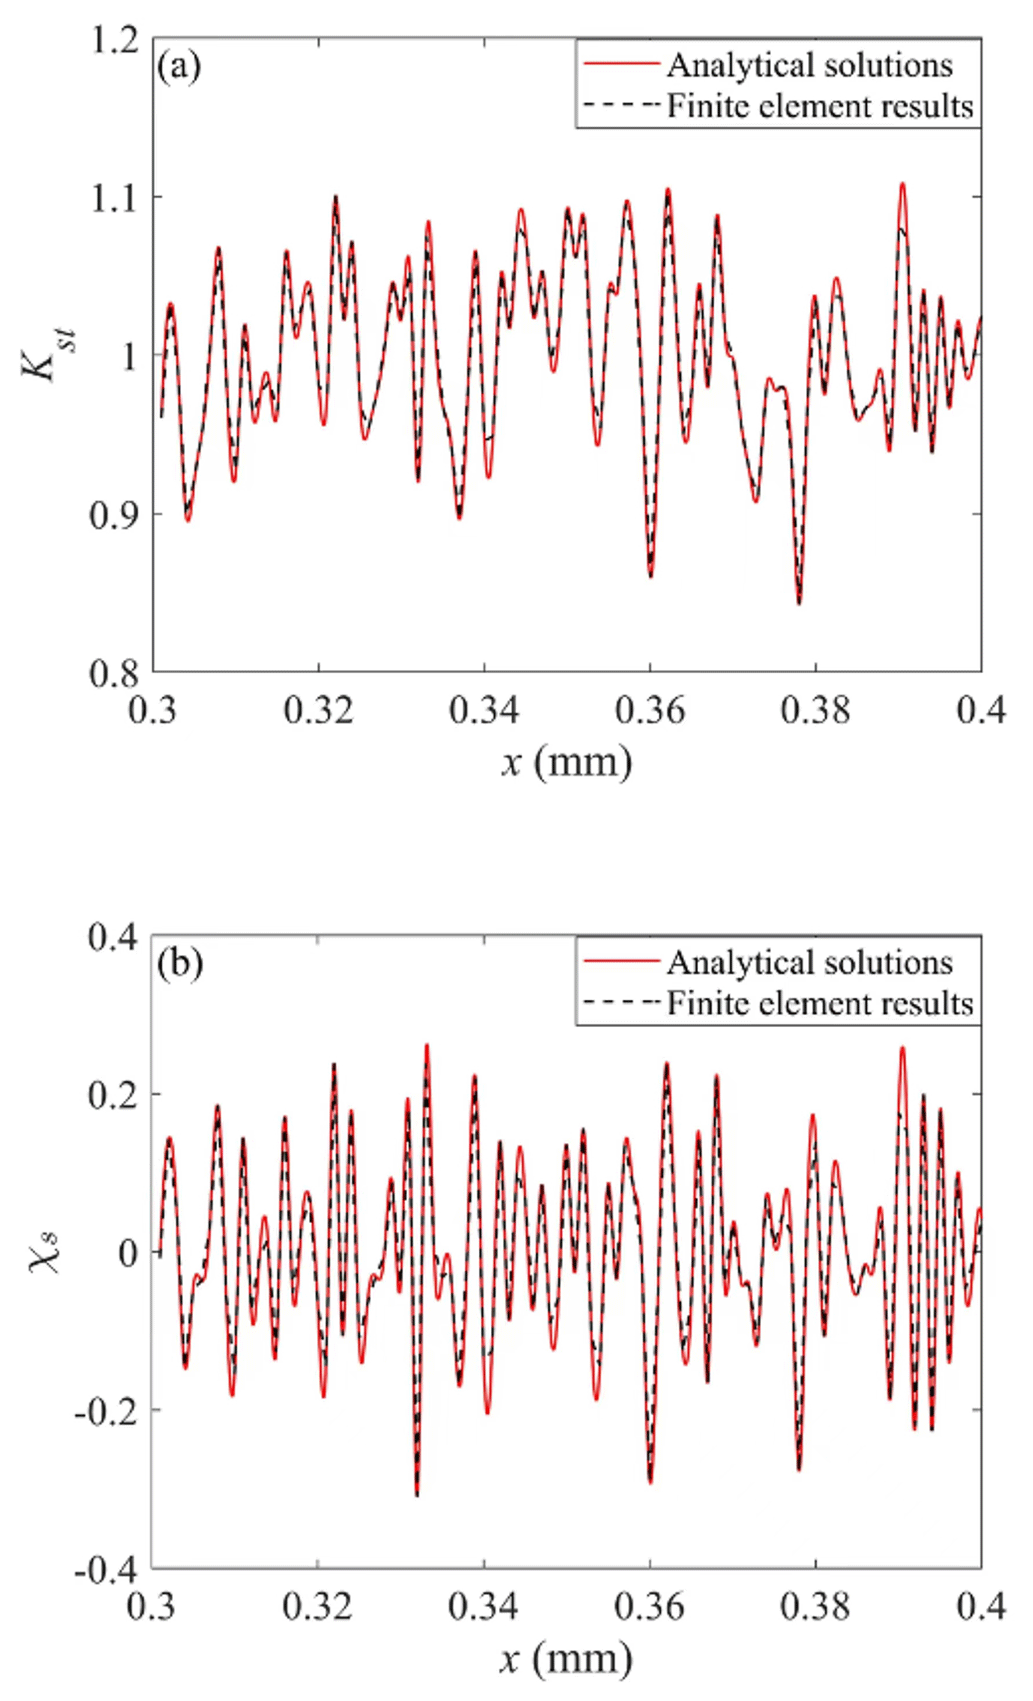
Figure 13Results of (a) Kst and (b) χs calculated using analytical solutions and the FE analysis for Kt=1.
The difference between the results of the perturbation and FE methods is within the allowable range. This difference could be attributed to the particularity of the round-bar specimen. The surface topography calculated using the perturbation method must be converted and reconstructed using a curved surface, and some data may be lost. Because the FE method is in an ideal state, this is not a problem.
3.2 Surface SCF and RSG analysis of the V-notched machined surfaces
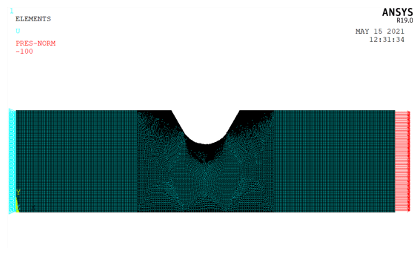
The simulation model and boundary conditions were consistent with those provided in Sect. 3.1.2. The meshing and loading conditions of the V-notched specimen model (Fig. 1) for Kt=2 and Ra=3.2 µm are shown in Fig. 14. The element type used in the FE model was PLANE182; the V-notched part was meshed using triangular elements with an aspect ratio of 1.15, and the rest of the model was meshed using quadrilaterally shaped elements with an aspect ratio of 2.2.
Similarly, the convergence strategy provided in Sect. 3.1.3 was used to analyze the convergence of V-notched round-bar specimens with Kt=2 and different surface topographies using the simulation of the surface topography (Sect. 2.3.2).
Using the FE method for surface topography stress analysis, the convergence results of surface topographies with different Ra values were analyzed. The surface SCF and RSG values of the specimens with Ra=0.1, 0.8, and 3.2 µm and Kt=2 were calculated (Figs. 15 and 16).
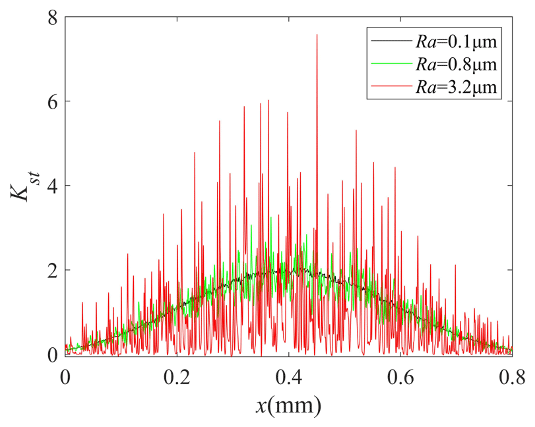
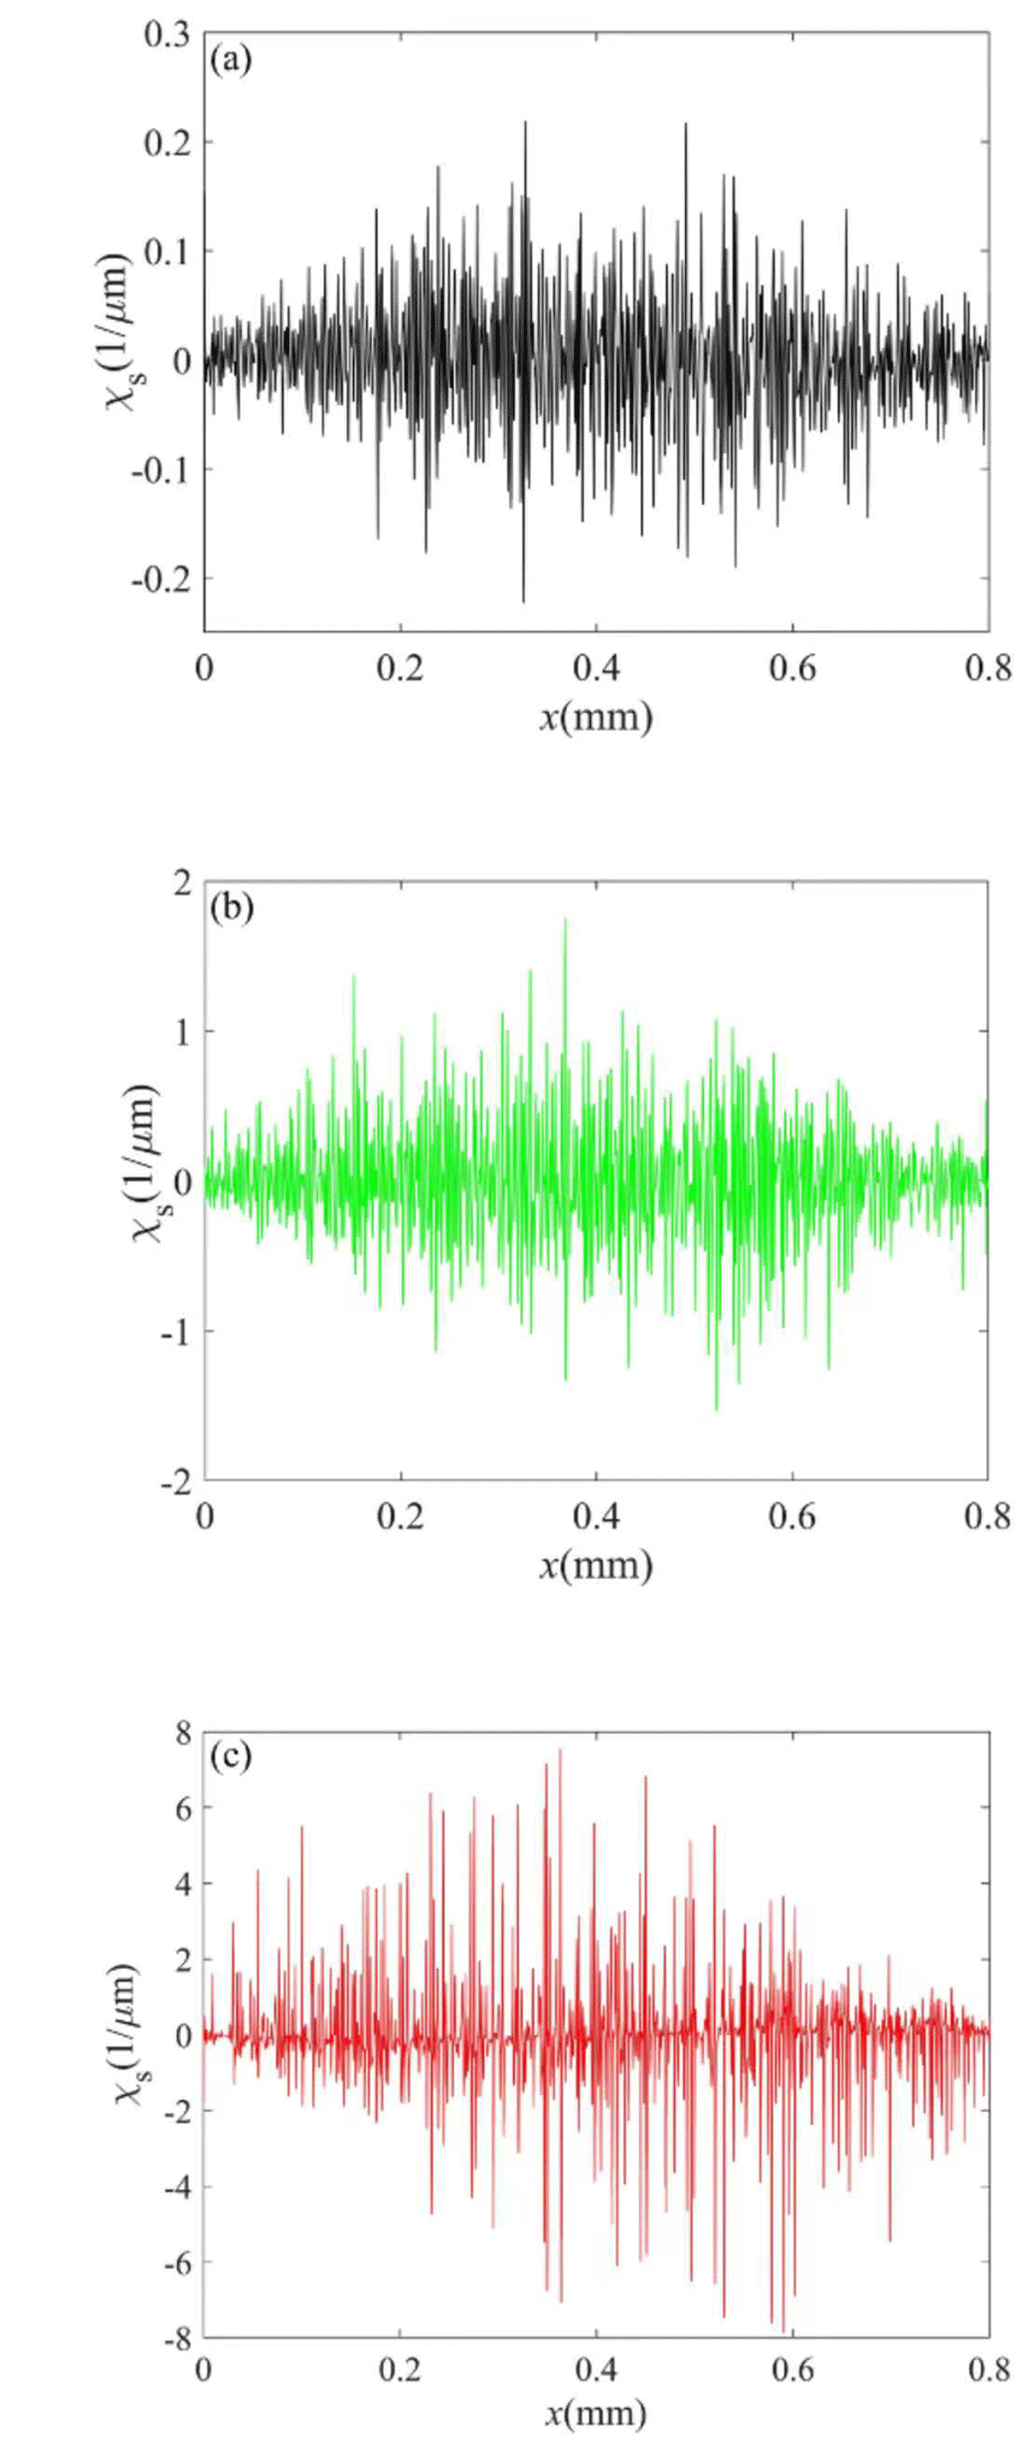
Figure 16RSG of the V-notched specimens with Kt=2 and Ra=0.1 µm (a), 0.8 µm (b), and 3.2 µm (c).
Figure 15 shows the surface SCF of the V-notched specimens with various roughness values at the bottom of the notch. If the influence of the geometric profile is ignored, the maximum value of the surface SCF and its variation increase with the surface roughness of the notch bottom in the same evaluation area. Overall, considering the simultaneous influences of the geometric profile and surface roughness, the surface SCF reaches its maximum at the deepest part of the notch.
The RSG reflects the trend in the stress change. The stress varies faster for a larger absolute value of RSG. As shown in Fig. 16a–c, the maximum absolute value of RSG increases with increasing roughness at the bottom of the notch. Furthermore, the RSG from both sides of the notch bottom gradually increases and reaches a maximum at the maximum depth. The RSG at the deepest notch reaches a maximum because of the simultaneous influence of the geometric profile and bottom topography of the notch.
The maximum surface SCF and the corresponding RSG results for Kt=2 are shown in Fig. 17. The surface SCF and RSG values increase with increasing surface roughness. The surface SCF and RSG have a linear relationship with surface roughness Ra.
where m1=1.80, m2=2.39, n1=1.88, and n2=0.15. The goodness of curve fit for Eq. (13a) is R2=0.998, and that for Eq. (13b) is R2=0.996.
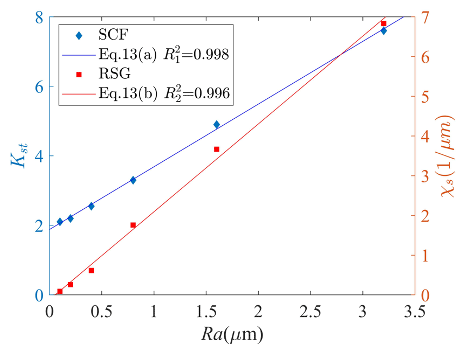
Figure 17Maximum surface SCF and RSG of V-notched specimens with different Ra values and Kt=2.
According to the linear relationship between the surface SCF and RSG and the surface roughness Ra obtained using Eqs. (13a) and (13b), the corresponding surface SCF and RSG values can be calculated for a known surface roughness. However, the microstructure and residual stress are affected by stress concentration, which can be considered using the crystal plasticity FE method or by introducing residual stress into the FE model.
In this study, the SCF and RSG generated by the surface roughness were analyzed. The main objective of this study was to determine the average surface roughness. For the surface topography analysis, the average surface roughness represents the entire surface topography. However, stress concentration usually occurs in areas where the surface topography changes significantly. Therefore, in subsequent studies, other surface roughness parameters can be considered for the investigation and analysis of SCF and RSG. The surface topography in this study was simulated using an interpolation method, which had high stability in the analysis. To analyze the SCF and RSG of the actual machined surface topography, the measured surface topography must be evaluated. The Kt=2 notch model established in this study was analyzed according to the design size, and the error in the notch model was found in the actual processing; therefore, the actual notch size should be calculated when analyzing the stress concentration of the actual notch sample.
An FE method was proposed to analyze the surface SCF and RSG of notches with surface topography. Using this method, the surface SCF and RSG of notched round-bar specimens with various surface topographies were studied. Considering the linear elastic model, in which the stress concentration phenomenon is only related to the geometry, various simulations were performed, and the following conclusions were drawn.
- 1.
The proposed FE method was used to calculate the surface SCF and RSG of round-bar specimens with Kt=1, and the correctness of the FE method was verified by the perturbation method.
- 2.
The surface SCF and RSG of the V-notched round-bar specimens were calculated using an FE simulation. The surface SCF increased with increasing surface roughness, and the local maximum values of the surface SCF and RSG were located at the bottom of the local surface topography.
- 3.
From the FE analysis results of the stress concentration analysis of the V-notched specimens with various surface roughness values, a linear function of the surface roughness with surface SCF and RSG was established. The linear function was used to obtain the SCF and RSG of the measured surface topography.
The code in this article is not publicly accessible because it involves some confidential content.
No data sets were used in this article.
GX is the lead author and checked and revised this paper. ZQ and SW wrote the draft. TL: data analysis and processing. MZ: conceptual and methodological guidance. GW: project administration.
The contact author has declared that none of the authors has any competing interests.
Publisher’s note: Copernicus Publications remains neutral with regard to jurisdictional claims made in the text, published maps, institutional affiliations, or any other geographical representation in this paper. While Copernicus Publications makes every effort to include appropriate place names, the final responsibility lies with the authors.
This work was supported by the National Natural Science Foundation of China (grant nos. U1804254, 11702252, and 51801187), Important Science & Technology Specific Projects of Henan Province (grant no. 201400211200), and the Key Teachers Program for the University of Henan Province (grant no. 2019GGJS005).
This research has been supported by the National Natural Science Foundation of China (grant nos. U1804254, U11702252, and U51801187).
This paper was edited by Jeong Hoon Ko and reviewed by two anonymous referees.
Abroug, F., Pessard, E., Germain, G., and Morel, F.: A probabilistic approach to study the effect of machined surface states on HCF behavior of a AA7050 alloy, Int. J. Fatigue, 116, 73–99, 2018.
Adib-Ramezani, H. and Jeong, J.: Advanced volumetric method for fatigue life prediction using stress gradient effects at notch roots, Comp. Mater. Sci., 39, 649–663, 2007.
Ardi, D. T., Li, Y. G., Chan, K. H. K., Blunt, L., and Bache, M. R.: Surface topography and the impact on fatigue performance, Surf Topogr: Metrol. Prop., 3, 015007, https://doi.org/10.1088/2051-672X/3/1/015007, 2015.
Arola, D. and Williams, C. L.: Estimating the fatigue stress concentration factor of machined surfaces, Int. J. Fatigue, 24, 923–930, 2002.
Ås, S. K., Skallerud, B., Tveiten, B. W., and Holme, B.: Fatigue life prediction of machined components using finite element analysis of surface topography, Int. J. Fatigue, 27, 1590–1596, 2005.
Ås, S. K., Skallerud, B., and Tveiten, B. W.: Surface roughness characterization for fatigue life predictions using finite element analysis, Int. J. Fatigue, 30, 2200–2209, 2008.
Chen, H., Hu, Y. Z., Wang, H., and Wang, W. Z.: Computer simulation of rough surfaces, Lubr. Eng., 10, 52–55+59, 2006.
Cheng, Z. K., Liao, R., Lu, W., and Wang, D.: Fatigue notch factors prediction of rough specimen by the theory of critical distance, Int. J. Fatigue, 104, 195–205, 2017.
Cheng, Z. K., Zhang, Y., Sun, X., Wang, T., Li, S.: Stress concentration of 3-D surfaces with small undulations: Analytical solution, Int. J. Solids Struct., 206, 340–353, 2020.
Cheng, Z. K., Zhu, X., Zhang, Y., Wang, T., and Berto, F.: Analytical prediction of the fatigue limit for axisymmetric round bars with rough surface morphology, Fatigue Fract. Eng. M., 45, 739–753, 2022.
Gao, H. J.: Stress concentration at slightly undulating surfaces, J. Mech. Phys. Solids, 39, 443–458, 1991.
Grekov, M. A. and Kostyrko, S. A.: Surface effects in an elastic solid with nanosized surface asperities, Int. J. Solids Struct., 96, 153–161, 2016.
Grekov, M. A. and Makarov, S. N.: Stress concentration near a slightly curved part of an elastic body surface, Mech. Solids+, 39, 40–46, 2004.
Hu, Y. Z. and Tonder, K.: Simulation of 3-D random rough surface by 2-D digital filter and fourier analysis, Int. J. Mach. Tool. Manu., 32, 83–90, 1992.
Inglis, C. E.: Stresses in a Plate Due to the Presence of Cracks and Sharp Corners, Transactions of the (Royal) Institution of Naval Architects, 55, 219–241, 1913.
Ma, L., Xu, G. T., Wang, G., and Zhao, M. H.: A new method for evaluating the influences of surface topography on fatigue propriety of the random machined surfaces, MATEC Web Conf., 165, 22028, https://doi.org/10.1051/matecconf/201816522028, 2018.
Liao, Z. Q., Wu, Y. X., and Yuan, H. Y.: Influences of surface roughness on three dimensional stress concentration factor and fatigue life, Chinese Mechanical Engineering, 26, 147–151, 2015.
Medina, H. and Hinderliter, B.: The stress concentration factor for slightly roughened random surfaces: analytical solution, Int. J. Solids Struct., 51, 2012–2018, 2014.
Medina, H.: A stress-concentration-formula generating equation for arbitrary shallow surfaces, Int. J. Solids. Struct., 69, 86–93, 2015.
Medina, H. E., Pidaparti, R., and Hinderliter, B.: Celebrating the 100th Anniversary of Inglis Result: From a Single Notch to Random Surface Stress Concentration Solutions, Appl. Mech. Rev., 67, 010802, https://doi.org/10.1115/1.4028069, 2015.
Muskhelishvili, N. I.: Some Basic Problems of the Mathematical Theory of Elasticity, Springer Dordrecht, 732 pp., https://doi.org/10.1007/978-94-017-3034-1, 1977.
Neuber, H.: Kerbspannungsleshre, Springer Berlin, Heidelberg, ISBN: 3540135588, 2001.
Peng, Z. L., Zhang, X. Y., Liu, L. B., Xu, G. T., Wang, G., and Zhao, M. H.: Effect of high-speed ultrasonic vibration cutting on the microstructure, surface integrity, and wear behavior of titanium alloy, J. Mater. Res. Tech., 24: 3870-3888, 2023a.
Peng, Z. L., Zhang, X. Y., Zhang, Y., Liu, L. B., Xu, G. T., Wang, G., and Zhao, M. H.: Wear resistance enhancement of Inconel 718 via high-speed ultrasonic vibration cutting and associated surface integrity evaluation under high-pressure coolant supply, Wear, 530–531, 205027, https://doi.org/10.1016/j.wear.2023.205027, 2023b.
Perez, I., Madariaga, A., Arrazola, P. J., Cuesta, M., and Soriano, D.: An analytical approach to calculate stress concentration factors of machined surfaces, Int. J. Mech. Sci., 190, 106040, https://doi.org/10.1016/j.ijmecsci.2020.106040, 2020.
Peterson, R. E. and Plunkett, R.: Stress Concentration Factors, J. Appl. Mech., 42, 248, https://doi.org/10.1115/1.3423544, 1975.
Pilkey, W. and Pilkey, D.: Forecasting the stress concentration coefficient around the mined panel using soft computing methodology, Eng. Comput., 35, 451–466, 2007.
Rice, J. R.: First-order variation in elastic fields due to variation in location of a planar crack front, J. Appl. Mech., 52, 571–579, 1985.
Sehitoglu, H.: Fatigue life prediction of notched members based on local strain and elastic-plastic fracture mechanics concepts, Eng. Fract. Mech., 18, 609–621, 1983.
Sun, J., Guo, Z., Zhao, X., Li, X., and Luo J.: Calculation Method of Stress Concentration Factor of Surface Micro Topography in Grinding, Mechanical Science and Technology for Aerospace Engineering, 39, 379–384, 2020.
Suraratchai, M., Limido, J., Mabru, C., and Chieragatti, R.: Modelling the influence of machined surface roughness on the fatigue life of aluminum alloy, Int. J. Fatigue, 30, 19–26, 2008.
Taylor, D. and Clancy, O. M.: The fatigue performance of machined surfaces. Fatigue Fract. Eng. M., 14, 329-336, 1991.
Wang, Y. R., Li, H. X. Yuan, S. H. Wei, D. S., and Shi, L.: Notch Fatigue Life Prediction Method Considering Stress Gradient, Journal of Aerospace Power, 28, 1208–1214, 2013.
Zhang, G., Liu, J., Liu, Y. S., and Yue, Z. F.: Effect of roughness on surface stress concentration factor and fatigue life, Jixie Qiangdu/Journal of Mechanical Strength, 32, 110–115, 2010.
Zhang, G., Yang, S., Fluegge, J., and Bosse, H.: Fiber optic white light interferometer for areal surface measurement, Meas. Sci. Technol., 31, 025005, https://doi.org/10.1088/1361-6501/ab4a48, 2020.
Zhang, H. L., Liu, M., and Qi, Y. H.: Stress concentration factor of specimen with v-notch under uniaxial tensile conditions, China. Meas. Test., 43, 14–18, 2017.