the Creative Commons Attribution 4.0 License.
the Creative Commons Attribution 4.0 License.
 | 17 Jul 2020
Research on the HMCVT gear shifting smoothness of the four-speed self-propelled cotton picker
Mingxi Bao
Xiangdong Ni
Xin Zhao
Shen Li
To improve the HMCVT gear shifting smoothness of the self-propelled cotton picker, the quadratic orthogonal rotation test was carried out through the HMCVT test bench and control system with engine speed, clutch oil pressure, flow control valve, load torque, displacement ratio as the influencing factors while jerk, dynamic load coefficient, speed drop, weighted acceleration RMS, frictional work as the response indexes. The mathematical model between the response indexes and the influencing factors was established through the data processing software Design Expert 10. After the single factor and multi-factor experimental analyses, the parameters were optimized based on the response surface methodology to obtain the optimal parameters. The test was carried out on the HMCVT test bench with the optimized parameter combination. The engine output speed was 900 rpm, the clutch oil pressure was 3.5 MPa, the flow control valve was 4.9 L min−1, the load torque was 130 Nm and the displacement ratio was −0.93. The result was as follows: the jerk was 5.04 m s−3, the weighted acceleration RMS was 0.467, the speed drop was 20.32 rpm and the dynamic load coefficient was 12.16. This study provides reference for the smooth shifting of the self-propelled cotton picker, which is of a certain significance to promote the operation of the self-propelled cotton picker under multiple working conditions.
- Article
(8285 KB) - Full-text XML
- BibTeX
- EndNote


The self-propelled cotton picker (high-power agricultural machinery) has frequent load fluctuations with a high transmission power, which requires the driver to frequently shift gears to adapt to load variations in accordance with the changing operating conditions. HMCVT (hydro-mechanical continuously variable transmission) realizes the coupling of hydraulic power flows and mechanical power flows through the differential planetary gear train (Ni et al., 2013; Zhu et al., 2017; Wang et al., 2019a; Zhang et al., 2014), enabling the HMCVT speed ratio to realize stepless speed changes in the stepped mechanical section. The range of speed variations of the equidistant type HMCVT complies with the adjustment of the self-propelled cotton picker in operating conditions. The stepless speed regulation of the HMCVT hydraulic system and the mechanical gear meshing makes the shifting process complex and dynamic.
In recent years, to improve the shifting quality and improve the comfort, there are many evaluation indexes for the gear shifting smoothness of the transmission (including the automatic transmission and the double clutch transmission). However, the sole standard has not yet been formed. The HMCVT is a new technology that combines hydraulic transmission with mechanical transmission. There is no specific standard for the evaluation indexes of its gear shifting smoothness. There are many factors affecting the gear shifting smoothness of the transmission. Xu et al. (2015) proposed the transmission output torque transfer-function coefficient and the transmission output torque evaluation index. He also studies the influence of multi-clutch engagement and disengagement timing on the shifting process. Liu et al. (2010) improved the gear shifting smoothness of the vehicle by changing the impact force of the clutch. Yu et al. (2012) improved the shifting quality by optimizing the shifting strategy. General Electric Machinery Company proposed a strategy for the adaptive control of clutch oil filling flows and the oil pressure (Bender and Struthers, 1990). Zhu et al. (2016) improved the gear shifting smoothness by optimizing the physical parameters and the clutch shifting timing control strategy. Song et al. (2015) used the analytic hierarchy process to propose control quality evaluation indexes such as the starting quality and the shifting quality, and obtained the control expectation range of the evaluation indexes. According to the mechanism of the cyclic section shifting generated by the HMCVT during synchronous shifting, Zhang et al. (2018) studies the stability of the shifting process by eliminating the control law of the cyclic shifting.
In summary, international research has different indexes for the transmission smoothness. In view of this, the evaluation index of the shifting smoothness of the self-developed HMCVT and the relationship between the factors affecting the evaluation indexes were studied in this paper to determine the optimal parameter combination to improve the smoothness of the HMCVT, providing reference for the section shifting smoothness of the self-propelled cotton picker under multiple working conditions.
2.1 HMCVT transmission scheme
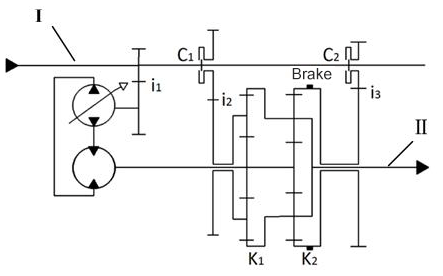
The HMCVT adopted a partial moment-speed arithmetic continuous transmission scheme combining “variable displacement pump + quantitative motor” and double row planetary gear pair combination, as shown in Fig. 1 (Bao et al., 2019). The HMCVT consisted of the R gear, the pure hydraulic section H gear, the low speed hydraulic machinery section HM1 gear, high speed hydraulic machinery section HM2 gear. The R gear was the reverse gear. The pure hydraulic section H gear, the hydraulic machinery section HM1 gear and the HM2 gear were forward gears (Xia et al., 2020). The HMCVT used the combination of the clutch and the brake to achieve the shifting and control. The displacement ratio range of the pure hydraulic section H gear was 0–1, the displacement ratio range of the hydraulic machinery section HM1 gear was 1 to −1, and the displacement ratio range of the hydraulic machinery section HM2 gear was −1–1. The pure hydraulic system was composed of a variable displacement pump, a quantitative motor and a fuel supply system; the mechanical power transmission system was composed of a planetary gear pair K1, a planetary gear pair K2, a fixed shaft gear pair i1, the clutches C1, C2 and a brake. The HMCVT can be adapted to a self-propelled cotton picker with a working speed of 0–25 km h−1.
The HMCVT shift control was controlled by the wet clutch C1, the wet clutch C2, the brake and the variable pump displacement ratio. Table 1 shows the joint site diagram of the wet clutches and the brake during the HMCVT shifting process.
Table 1Clutch and brake joint site diagram.
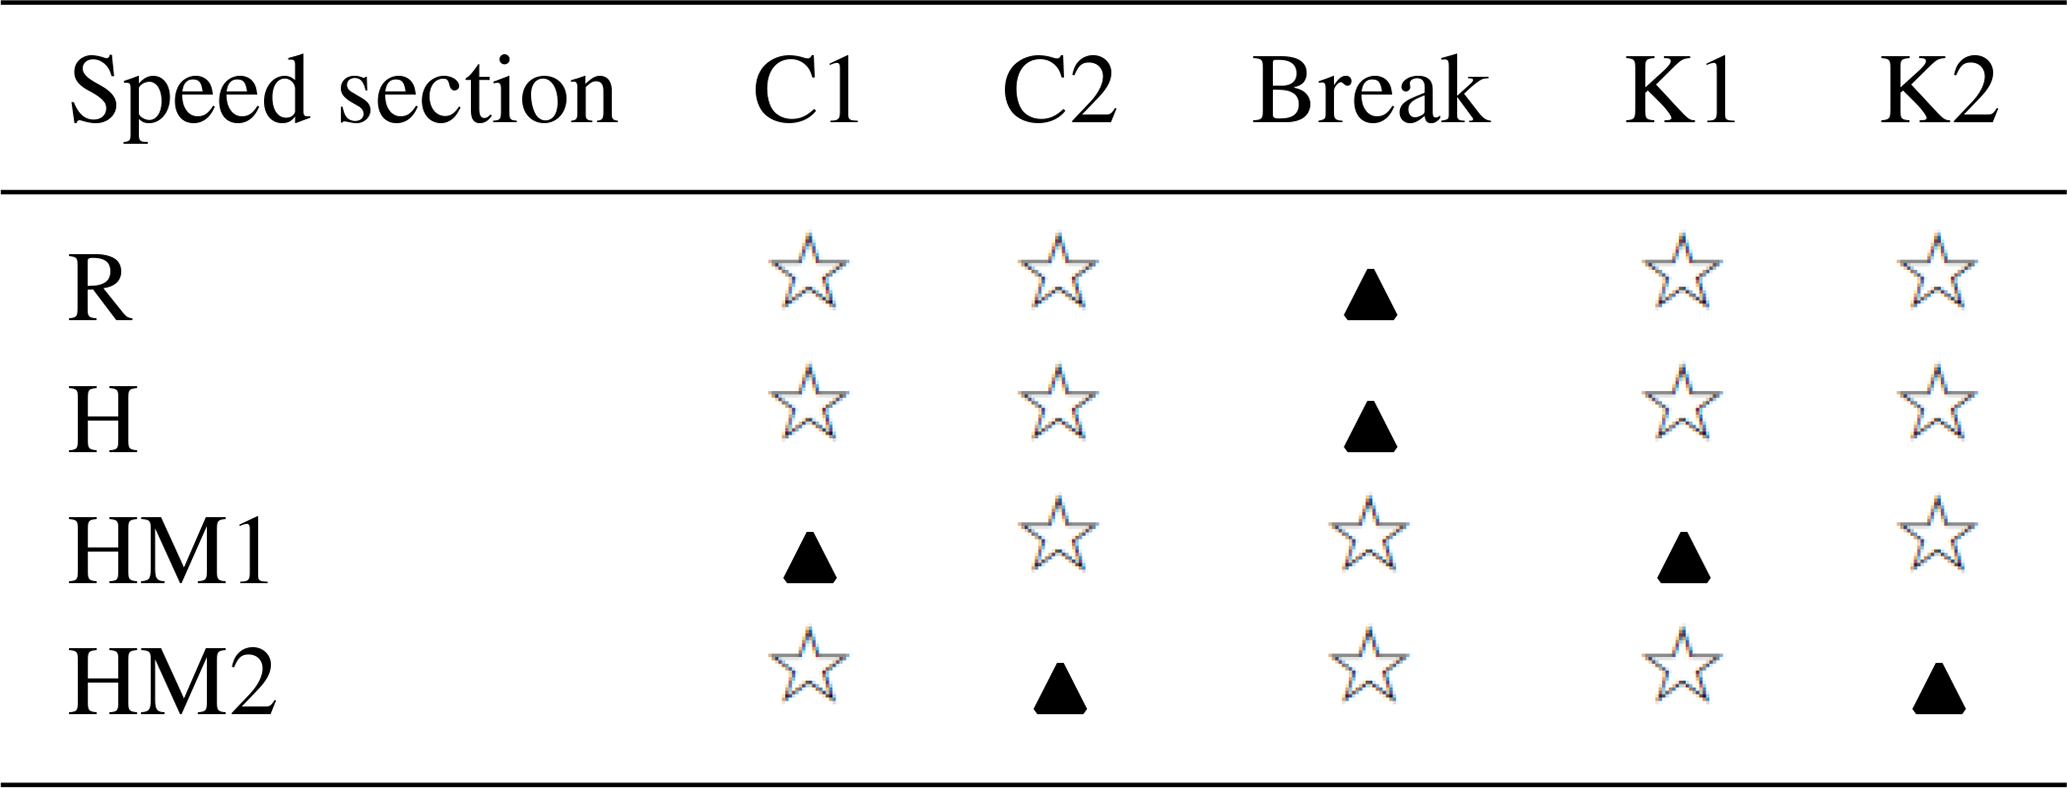
Note: “▴” indicates the clutch, brake and planetary array are in
operation. “![]() ” indicates the clutch, brake and planetary array are not
in operation.
” indicates the clutch, brake and planetary array are not
in operation.
2.2 HMCVT test bench
The HMCVT test bench was a special test equipment for the experimental performance tests of key components of agricultural machinery, mainly consisting of the transmission system (Engine 1, Flexible Coupling 3, Quantitative Motor 4, Variable Displacement Pump 5, HMCVT 6, Solenoid Directional Control Valve Assembly 7, Universal Joint Coupling 8, Auxiliary Pump 9), the detection system (Speed Torque Sensor 2, 10, Data Acquisition Instrument 12), the loading equipment (Magnetic Powder Brake 11). The specific structure is shown in Fig. 2.

Figure 2HMCVT test bench. 1: Engine, 2: Speed torque sensor, 3: Flexible coupling, 4: Quantitative motor, 5: Variable displacement pump, 6: HMCVT, 7: Solenoid directional control valve assembly, 8: Universal joint coupling, 9: Auxiliary pump, 10: Speed torque sensor, 11: Magnetic powder brake, 12: Data acquisition instrument.
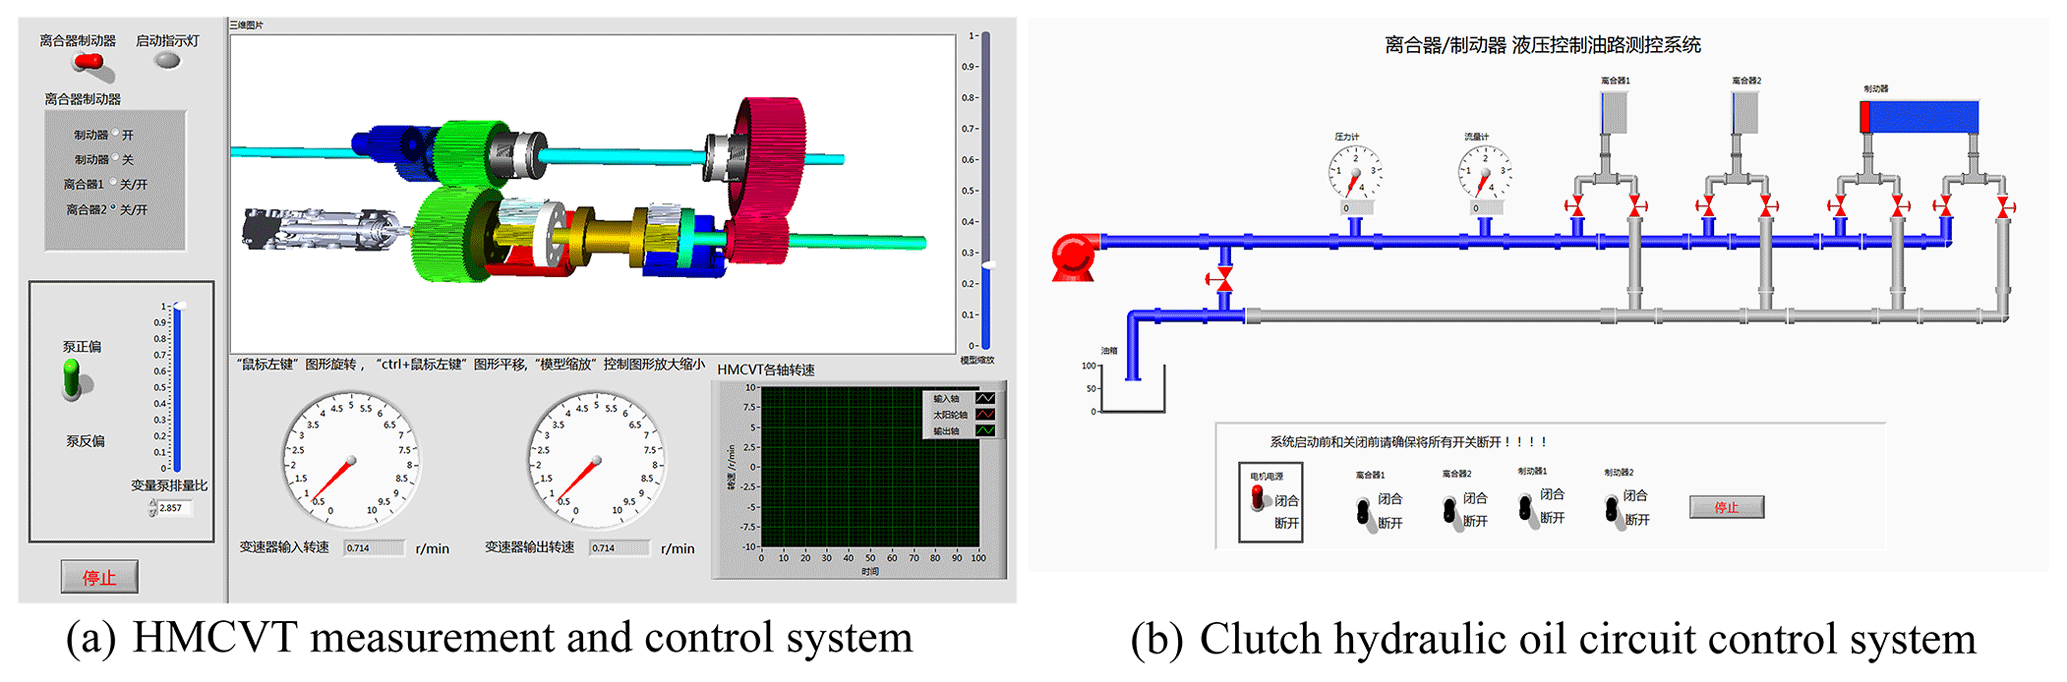
The HMCVT test bench measurement and control system is shown in Fig. 3a. The HMCVT measurement and control system included a variable pump displacement ratio control zone, the clutches C1, C2 and the brake switch control zones. The system also monitored the transmission input-output speed and the transmission I-axis and II-axis rotational speed. Figure 3b shows the clutch hydraulic oil circuit control system for the visual monitoring of the pressure and flows in the clutch oil circuit (Xiao et al., 2018; Cheng et al., 2006).
The control system adjusted the input voltage signal by the PWM duty ratio to control the variable displacement pump mechanism and change the displacement of the variable displacement pump so as to control the output speed of the quantitative motor. Magnetic powders were used by the magnetic powder brake as a medium to form a magnetic powder chain to transmit the torque when the test bench was energized. The oil pump provided oil to the clutch through a three-phase asynchronous motor. The system adopted the Hall sensor to test shaft speed and acceleration (Xiao et al., 2019; Yang et al., 2018; Cheng et al., 2019).
The forward low speed HM1 and the forward high speed HM2 gear shifting process were studied as the research objects (Ni et al., 2017; Qu et al., 2019; Wang et al., 2019b). The specific requirements for the gear shifting smoothness were: during the gear shifting process, the vehicle speed changed smoothly with no excessive instantaneous acceleration or instantaneous deceleration to reduce the occupant's discomfort and the dynamic load of each part in the transmission system. The indexes for the gear shifting smoothness included the jerk, dynamic load coefficient, speed drop, weighted acceleration RMS and frictional work.
3.1 Evaluation indexes of gear shifting smoothness
- (1)
Jerk
The jerk was the second-order rate of change of the vehicle speed, obtained from the second order derivation of the travel speed versus time. In the gear shifting process, the transmission component meshing would inevitably produce a shift shock. The jerk expression is:
where, J was the jerk, m s−3; v was the vehicle speed, m s−1; a was the vehicle acceleration, m s−2; rd was the wheel radius, m; Me was the engine torque, Nm; ia, ib was the transmission ratio of the speed transmission and the drive axle; I was the moment of inertia of the associated section of the output shaft.
- (2)
Dynamic load coefficient
The dynamic load coefficient was a reflection of the load torque fluctuation, the torque transmitted by the clutch during the gear shifting process of the HMCVT. The dynamic frictional torque was converted to the static frictional torque.
where, δ was the dynamic load coefficient; Tmax was the HMCVT output maximum torque value, Nm; Ts was the HMCVT output steady state torque value, Nm.
- (3)
Speed Drop
During the HMCVT gear shifting process, there was no overlap phenomenon in the clutch engagement. When the C1 clutch was disconnected and the C2 clutch was not engaged, the speed of the transmission was provided by the hydraulic drive. Under the load action, the shaft would have a certain speed drop, resulting in the short-term decline of the HMCVT output speed.
where, γ was the speed drop, rpm; nmin was the output minimum speed value, rpm; ns was the output steady state speed value, rpm.
- (4)
Weighted Acceleration RMS
The weighted acceleration root mean square value (ams) can characterize the acceleration characteristics during the gear shifting process. It is also an important parameter reflecting the comfort level of the human body. When ams<0.315, the subjective feeling was not uncomfortable; when , the subjective feeling of the human body was somewhat uncomfortable; when , the subjective feeling was uncomfortable when , the human subjective feeling was very uncomfortable.
where a was the instantaneous acceleration, m s−2; t1, t2 was the start time and end time of gear shifting, s; ts was the gear shifting time, s.
- (5)
Frictional Work
During the HMCVT gear shifting process, the wet clutch changing from the disengaged state to the engaged state made its main and driven parts undergo a frictional phase. The work consumed in the process is known as the frictional work, and its expression is:
where, Wf was the clutch frictional work, J; Pf was the clutch frictional work rate, kW; Tf was the clutch torque, Nm; t0, tt was the start time and end time of friction.
3.2 Influencing factors of gear shifting smoothness
- (1)
Engine speed and load torque
When the load torque changed, the engine speed, torque and output power would also change accordingly.
where, Tt was the engine output torque, Nm; Pe was the engine effective power, kW; n was the engine speed, rpm.
- (2)
Influence of clutch oil pressure on transmission torque
where, Tc was the torque transmitted by the clutch, Nm; μ was the dynamic friction factor; p0 was the oil pressure in the hydraulic cylinder, MPa; Av was the spool drive cavity area, m2; Zc was the clutch characteristic parameter.
It can be seen from Eq. (7) that when the clutch characteristic parameters were constant, the torque transmitted by the clutch was related to the clutch oil pressure. The greater the clutch oil pressure, the greater the torque transmitted; conversely, the smaller the torque transmitted by the clutch.
- (3)
Influence of flow control valve on clutch system
where, Q was the flow into the hydraulic cylinder, L min−1; Cd was the solenoid valve port flow coefficient; pvo was the solenoid valve outlet pressure, MPa; ρ was the oil density.
It can be seen from Eq. (8) that the clutch flow was related to the pressure and the flow coefficient. The flow control valve controlled the size of the valve port to affect the flow entering the clutch, thus affecting the coupling speed of the clutch.
- (4)
Influence of displacement ratio on gear shifting process
According to the structural design parameters of the HMCVT, the hydraulic mechanical HM1 gear and the hydraulic machine HM2 gear realized the gear shifting process when the displacement ratio was −1 point. The maximum transmission ratio values of the hydraulic machine HM1 section and the hydraulic machine HM2 section are shown in Table 2 below.
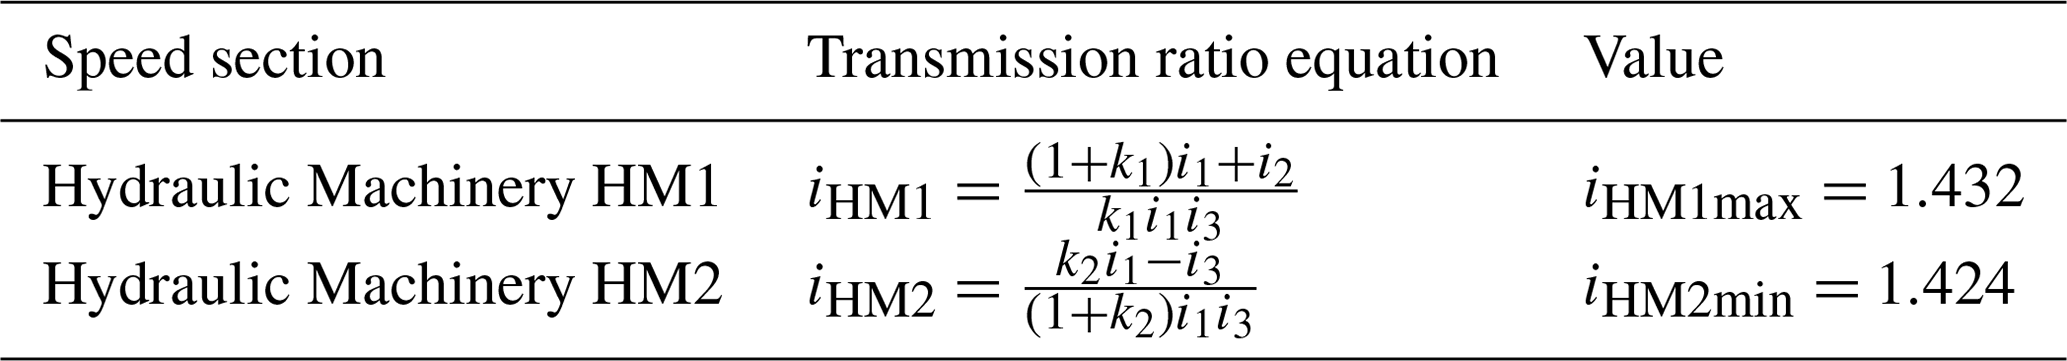
The HMCVT had different transmission ratios before and after the shift, resulting in the speed fluctuation during the gear shifting process. The change of the transmission ratio can be realized by the variable pump-quantitative motor displacement ratio.
The HMCV shifting time was the duration required from the front gear steady state to the rear gear steady state. The total shifting time was:
where, t3 was the clutch disengagement time, s; t4 was the clutch empty time, s; t5 was the clutch selection time, s; t6 was the clutch shifting time, s; t7 was the clutch engagement time, s.
The HMCVT shifting time was a complex and dynamic process, mainly depending on the clutch oil circuit pressure, the oil circuit flow and the oil-filled volume. When the clutch oil pressure and the oil circuit flow were large, the clutch engagement time was shorter, and vice versa. The clutch oil pressure and the flow control valve were important operating parameters of the HMCVT gear shifting process. The value of the shifting time indirectly affected the smoothness of the HMCVT gear shifting process.
where, V was the the oil-filled volume, m3; Kq was the oil-filled flow coefficient; μ was the oil density, Kg m−3; Δp was the pressure difference between the return spring and the oil-filled pressure, MPa.
The HMCVT shifting time had an important influence on the jerk, dynamic load coefficient, speed drop, frictional work and weighted acceleration RMS. However, the HMCVT gear shifting time cannot decouple the clutch oil pressure and the oil circuit flow, so the gear shifting time was not used as the influencing factor.
In summary, according to the HMCVT characteristics and operating parameters, five factors were selected in this test: engine speed, clutch oil pressure, flow control valve flow, load torque, displacement ratio.
4.1 Test instrument
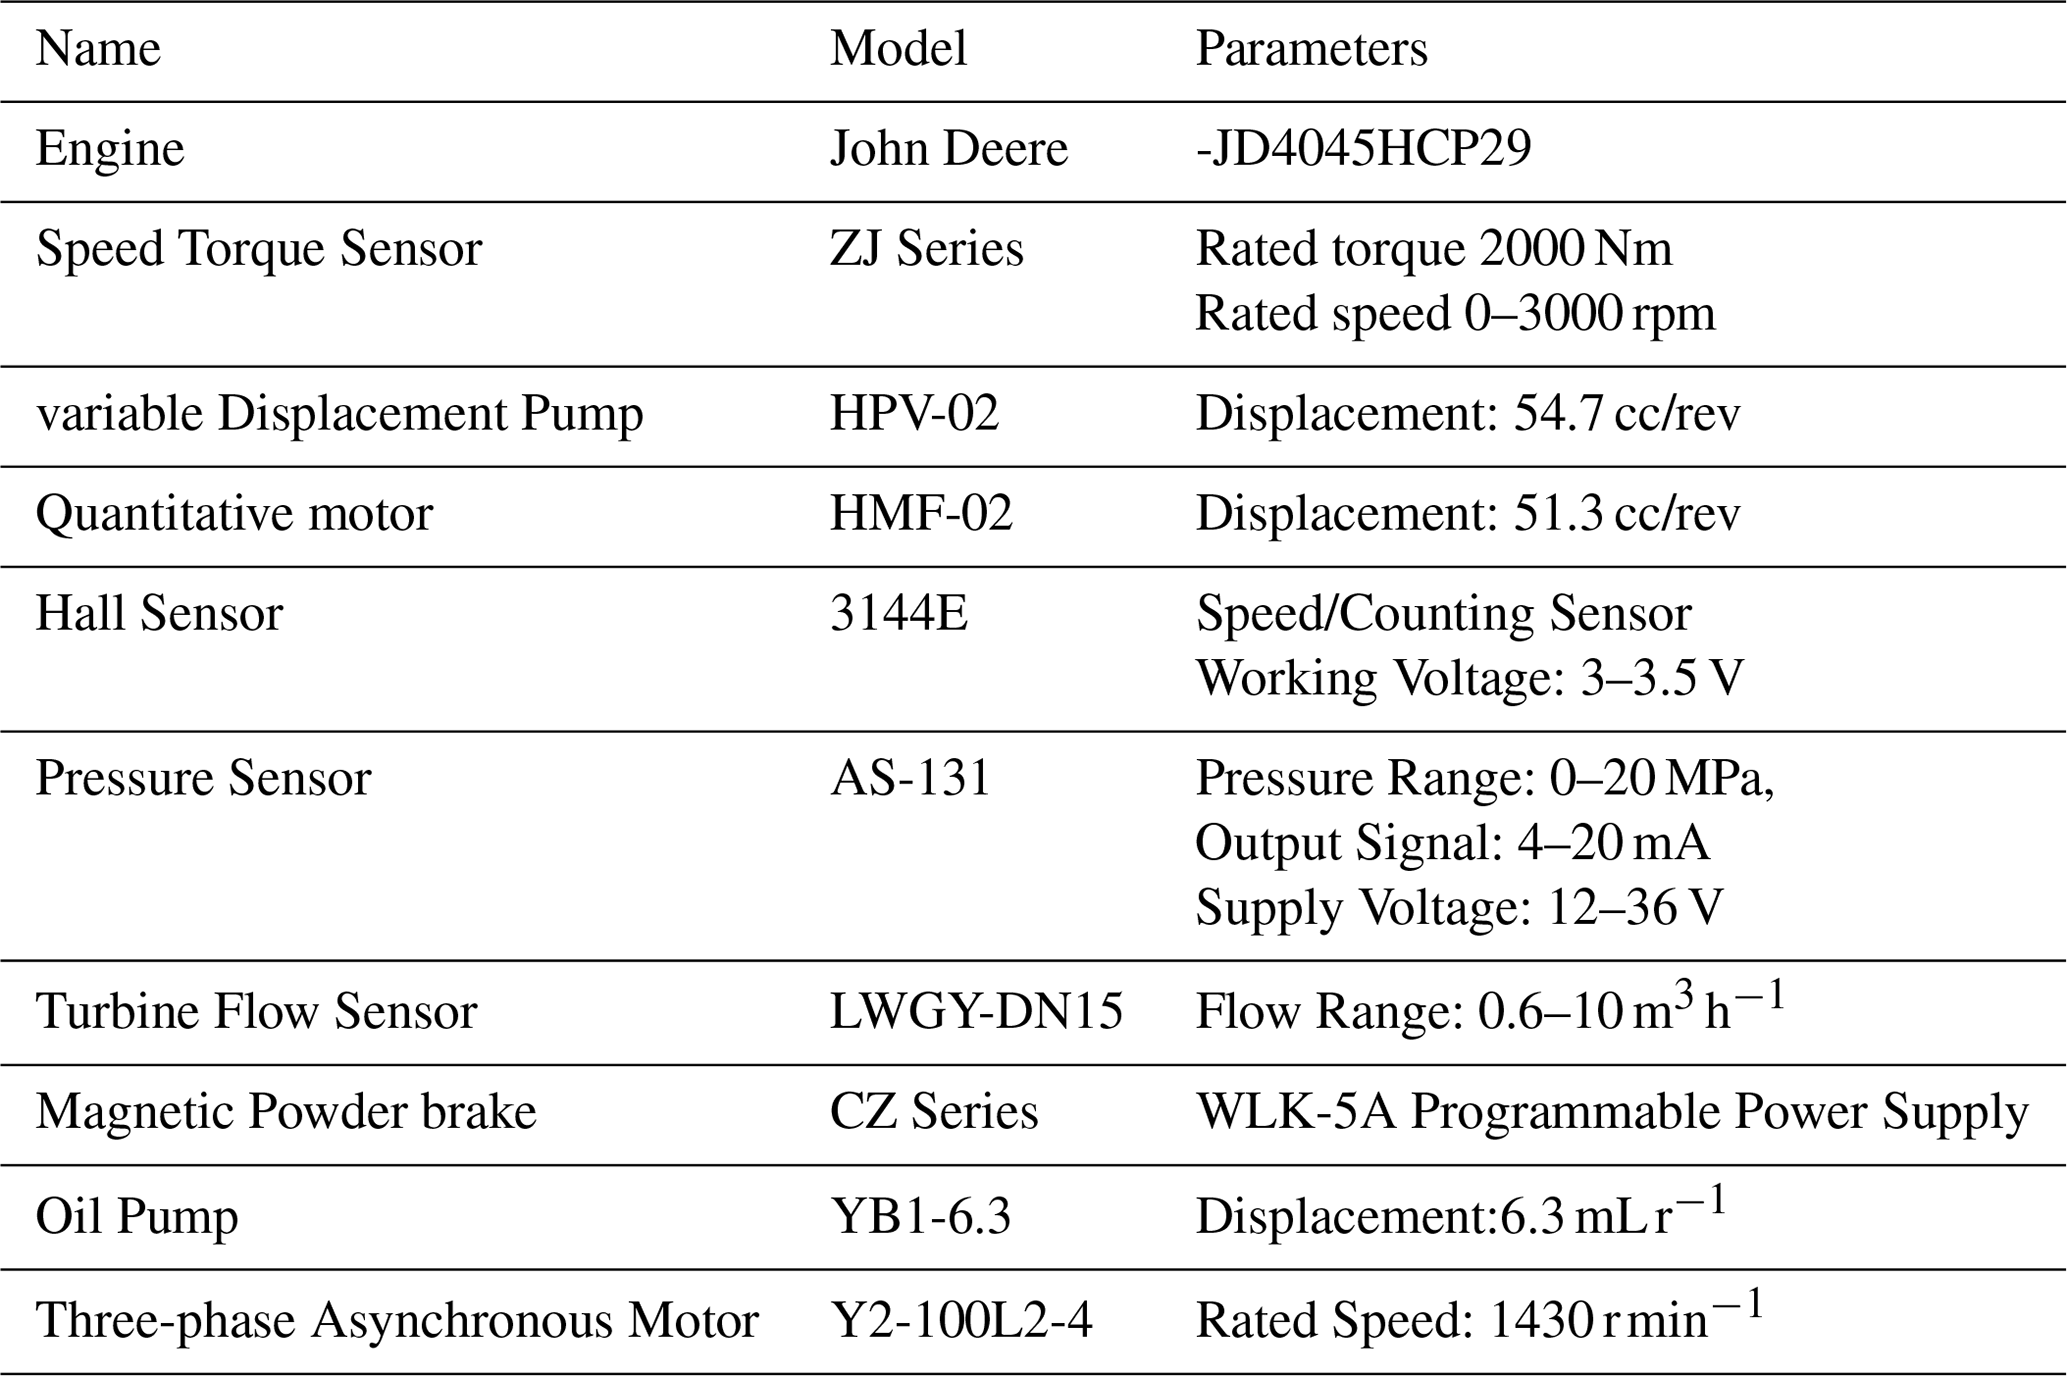
The test was carried out at the Hydraulic Transmission Laboratory of Shihezi University in China. The test process was mainly conducted on the HMCVT test bench made by the research team. The HMCVT test bench parameters are shown in Table 3.
4.2 Level range of test factors
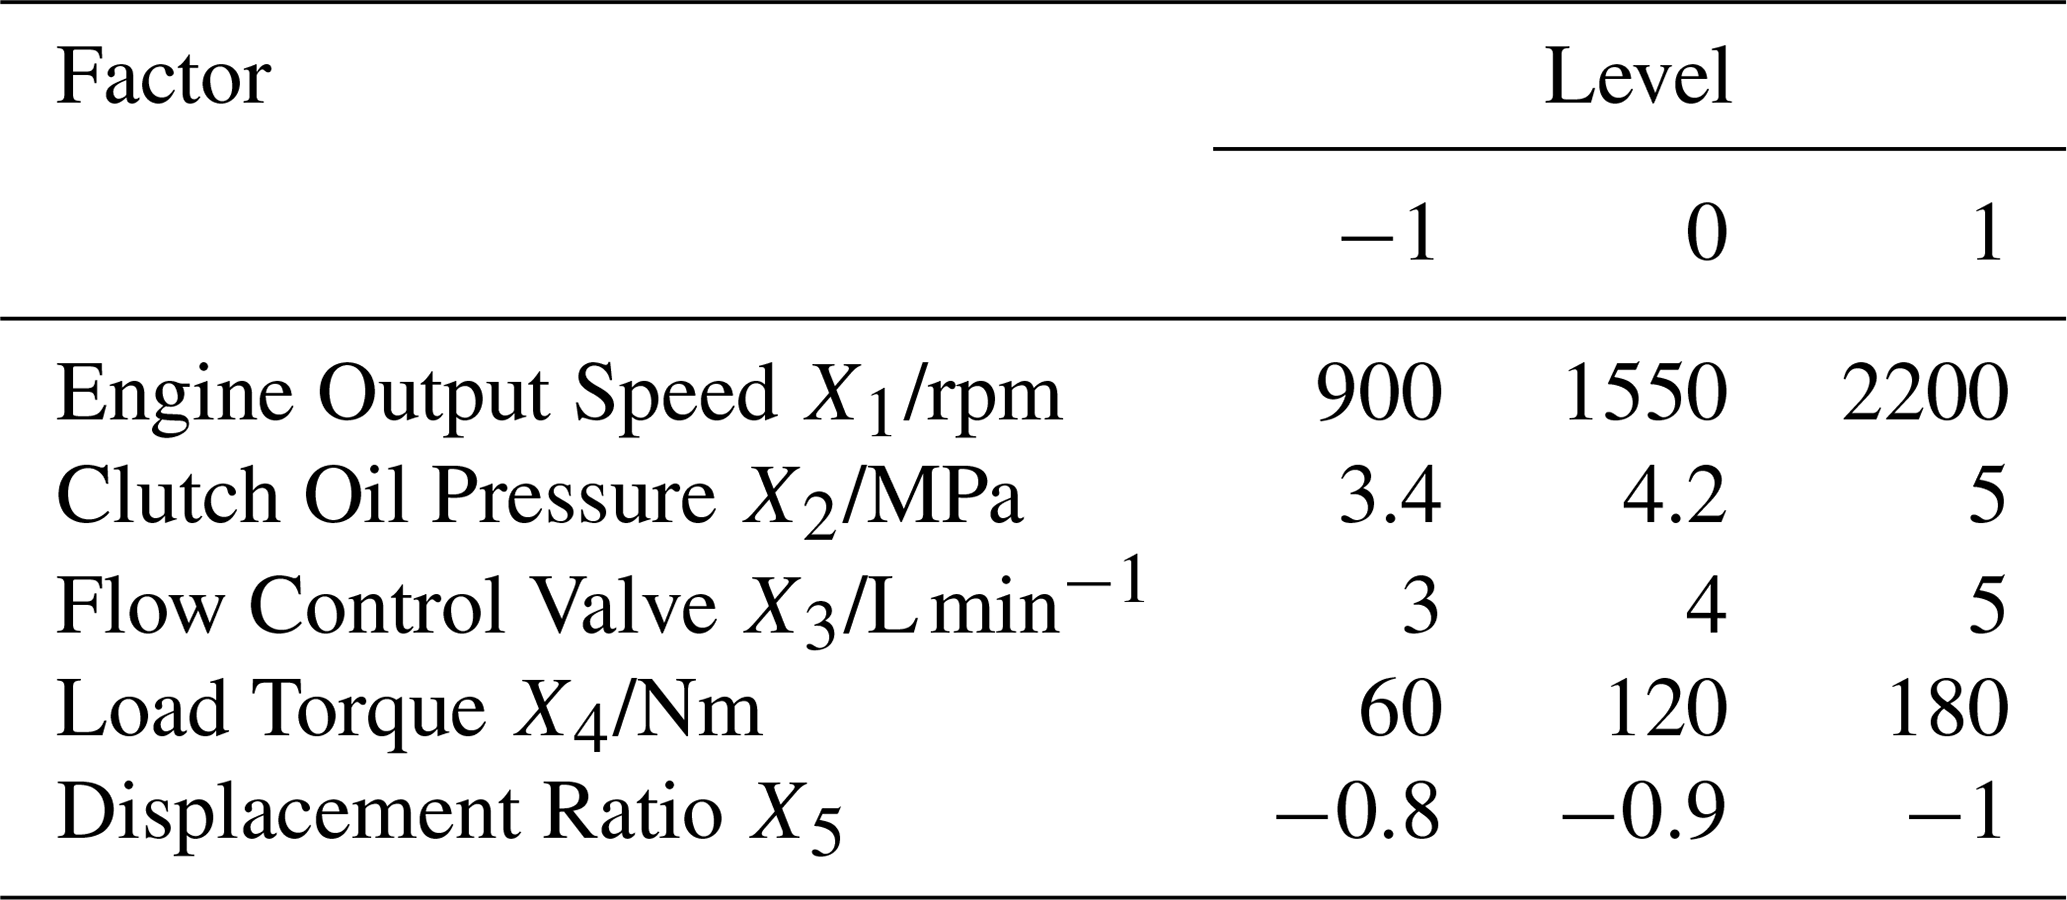
According to the theoretical analysis and pre-experiment of the HMCVT system, the influencing factors and the level ranges were determined as: engine output speed, 900–2200 rpm; clutch oil pressure, 3.4–5 MPa; flow control valve flow, 3–5 L min−1; load Torque, 60–180 Nm; displacement ratio, 0.8–1.
4.3 Test design
Considering the complexity of the HMCVT gear shifting process, the quadratic orthogonal rotation combination design scheme was used to study the influences of engine speed, clutch oil pressure, flow control valve, load torque, displacement ratio on the jerk, dynamic load, speed drop, and frictional work, as well as the weighted acceleration RMS. The multi-objective parameters were optimized. The experiment was arranged according to five factors and three levels. The factor level coding is shown in Table 4.
4.4 Analysis of test results
4.4.1 Test regression model
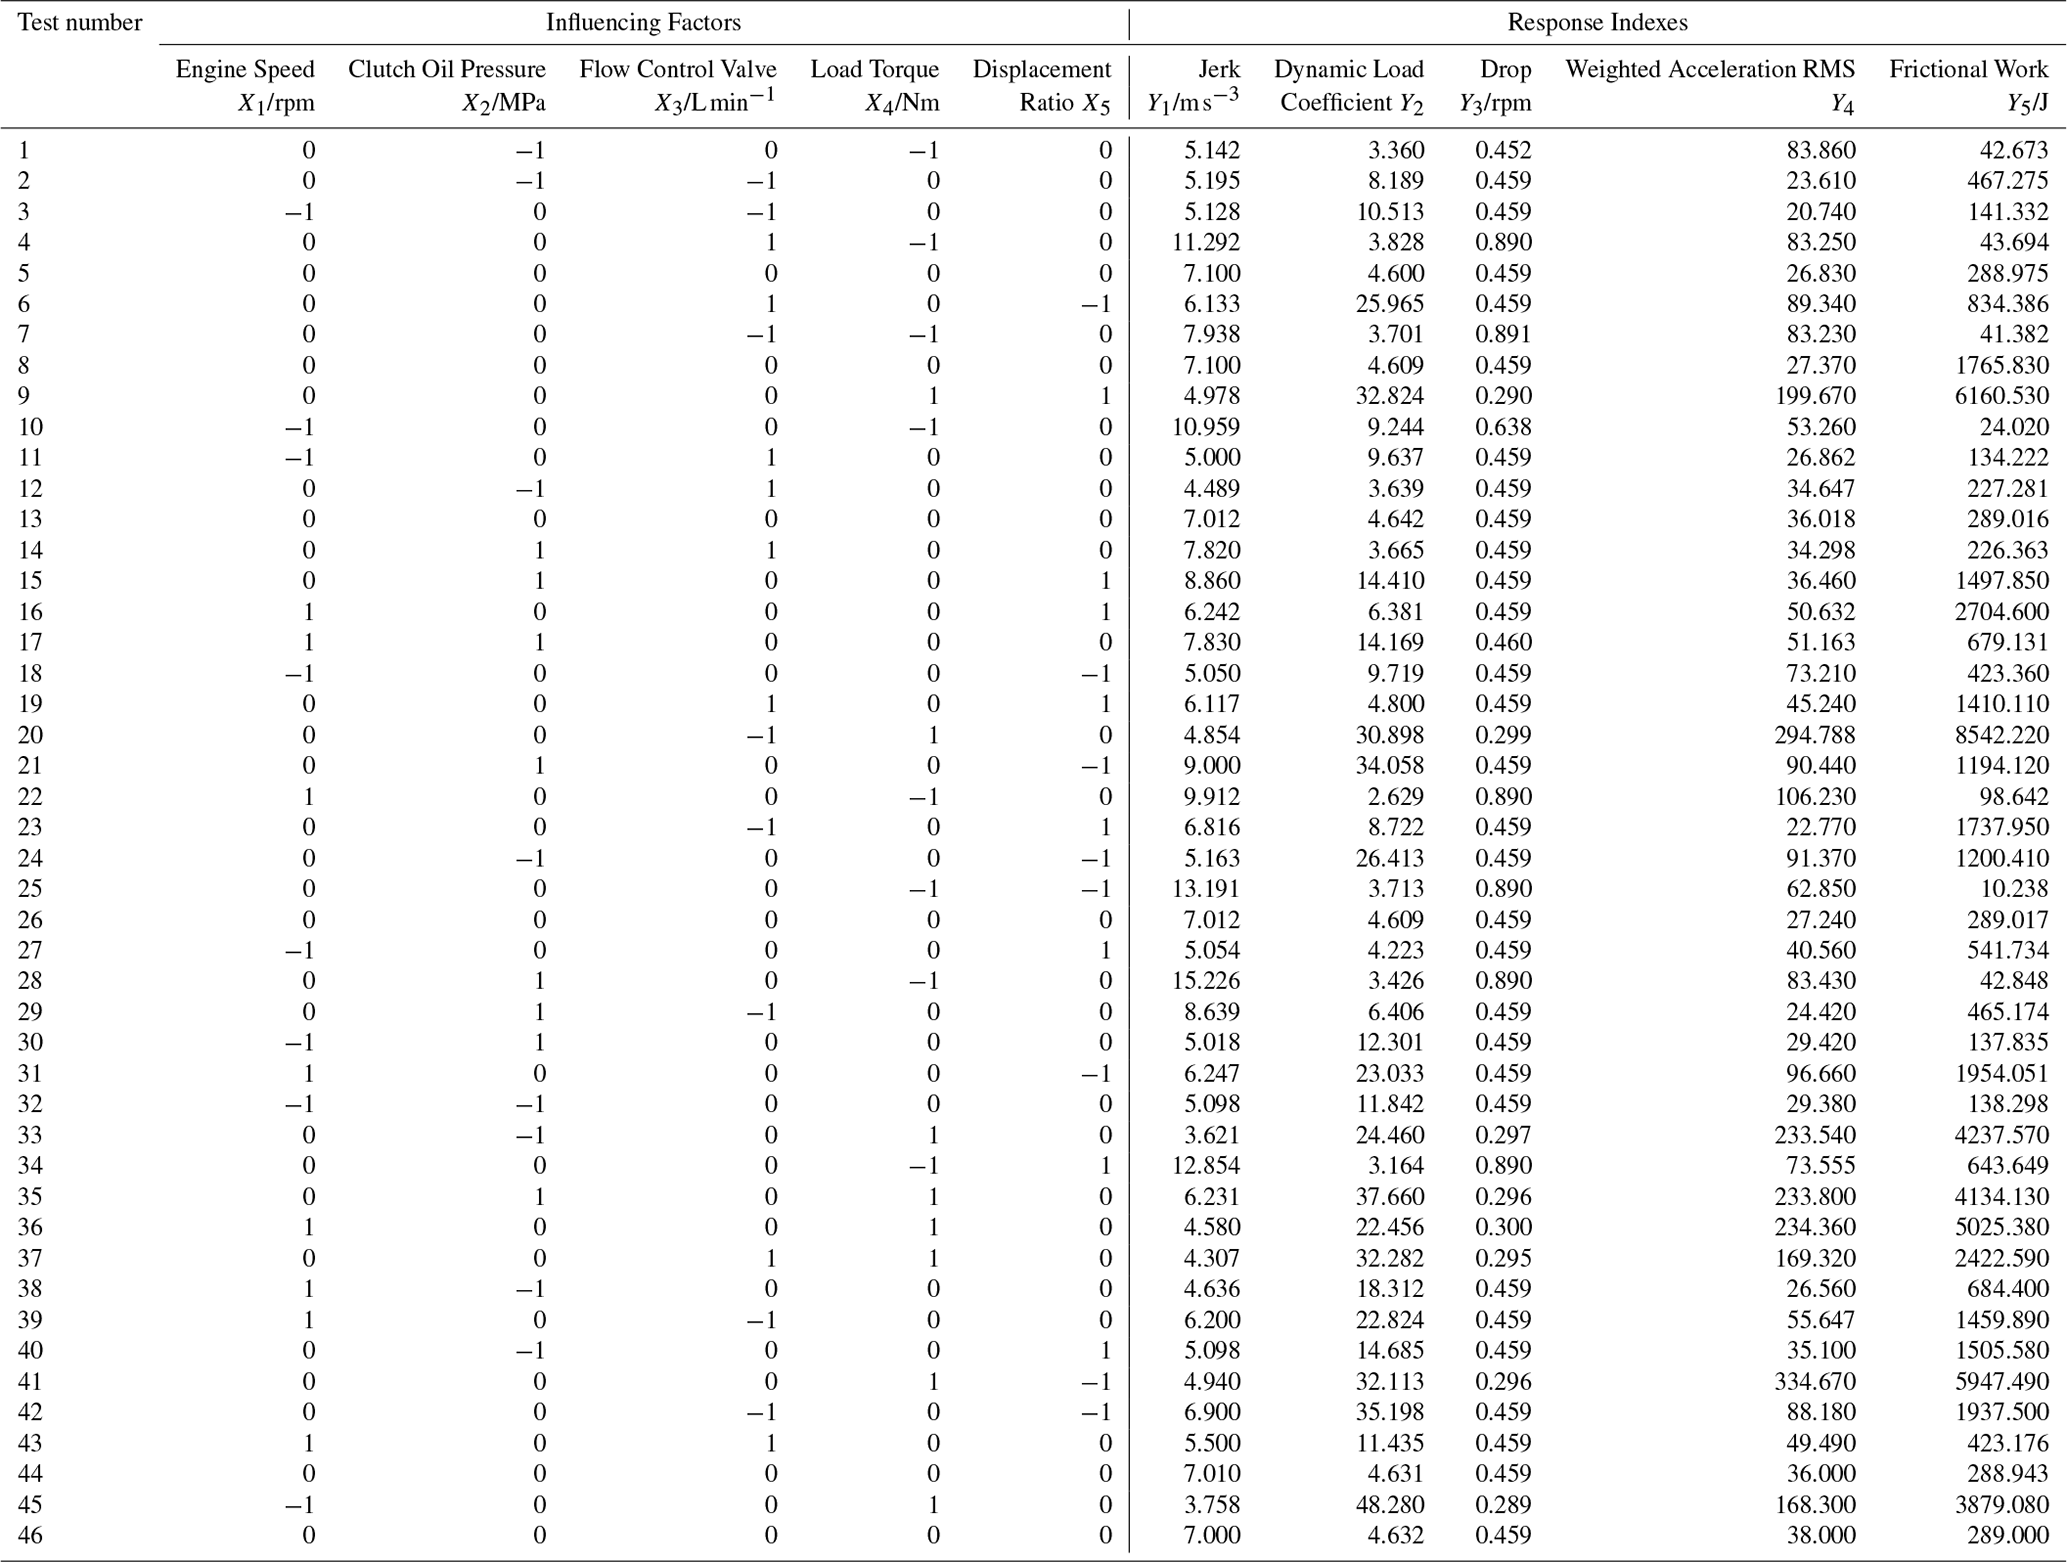
According to the test factor level coding table, the quadratic rotation orthogonal combination design scheme was adopted to carry out the HMCVT gear shifting smoothness. 46 sets of tests were arranged, each of which was repeated 3 times. The average value of the 3 test results was taken. The test results were calculated as three digits after the decimal point, but in the test analysis, the results were calculated in four digits after the decimal point. The design of the test and the analysis of the results were completed by Design-Expert 10 software, as shown in Table 5.
The quadratic polynomial regression models between engine speed, clutch oil pressure, flow control valve, load torque, displacement ratio on the jerk, dynamic load coefficient, speed drop, frictional work and weighted acceleration RMS were established. After the insignificant factors were removed, the regression equation obtained is as follows:
where, Y1, Y2, Y3, Y4, Y5 were the coded values of jerk, dynamic load coefficient, speed drop, weighted acceleration RMS and frictional work.
Table 5Quadratic orthogonal rotation combination test scheme and results.
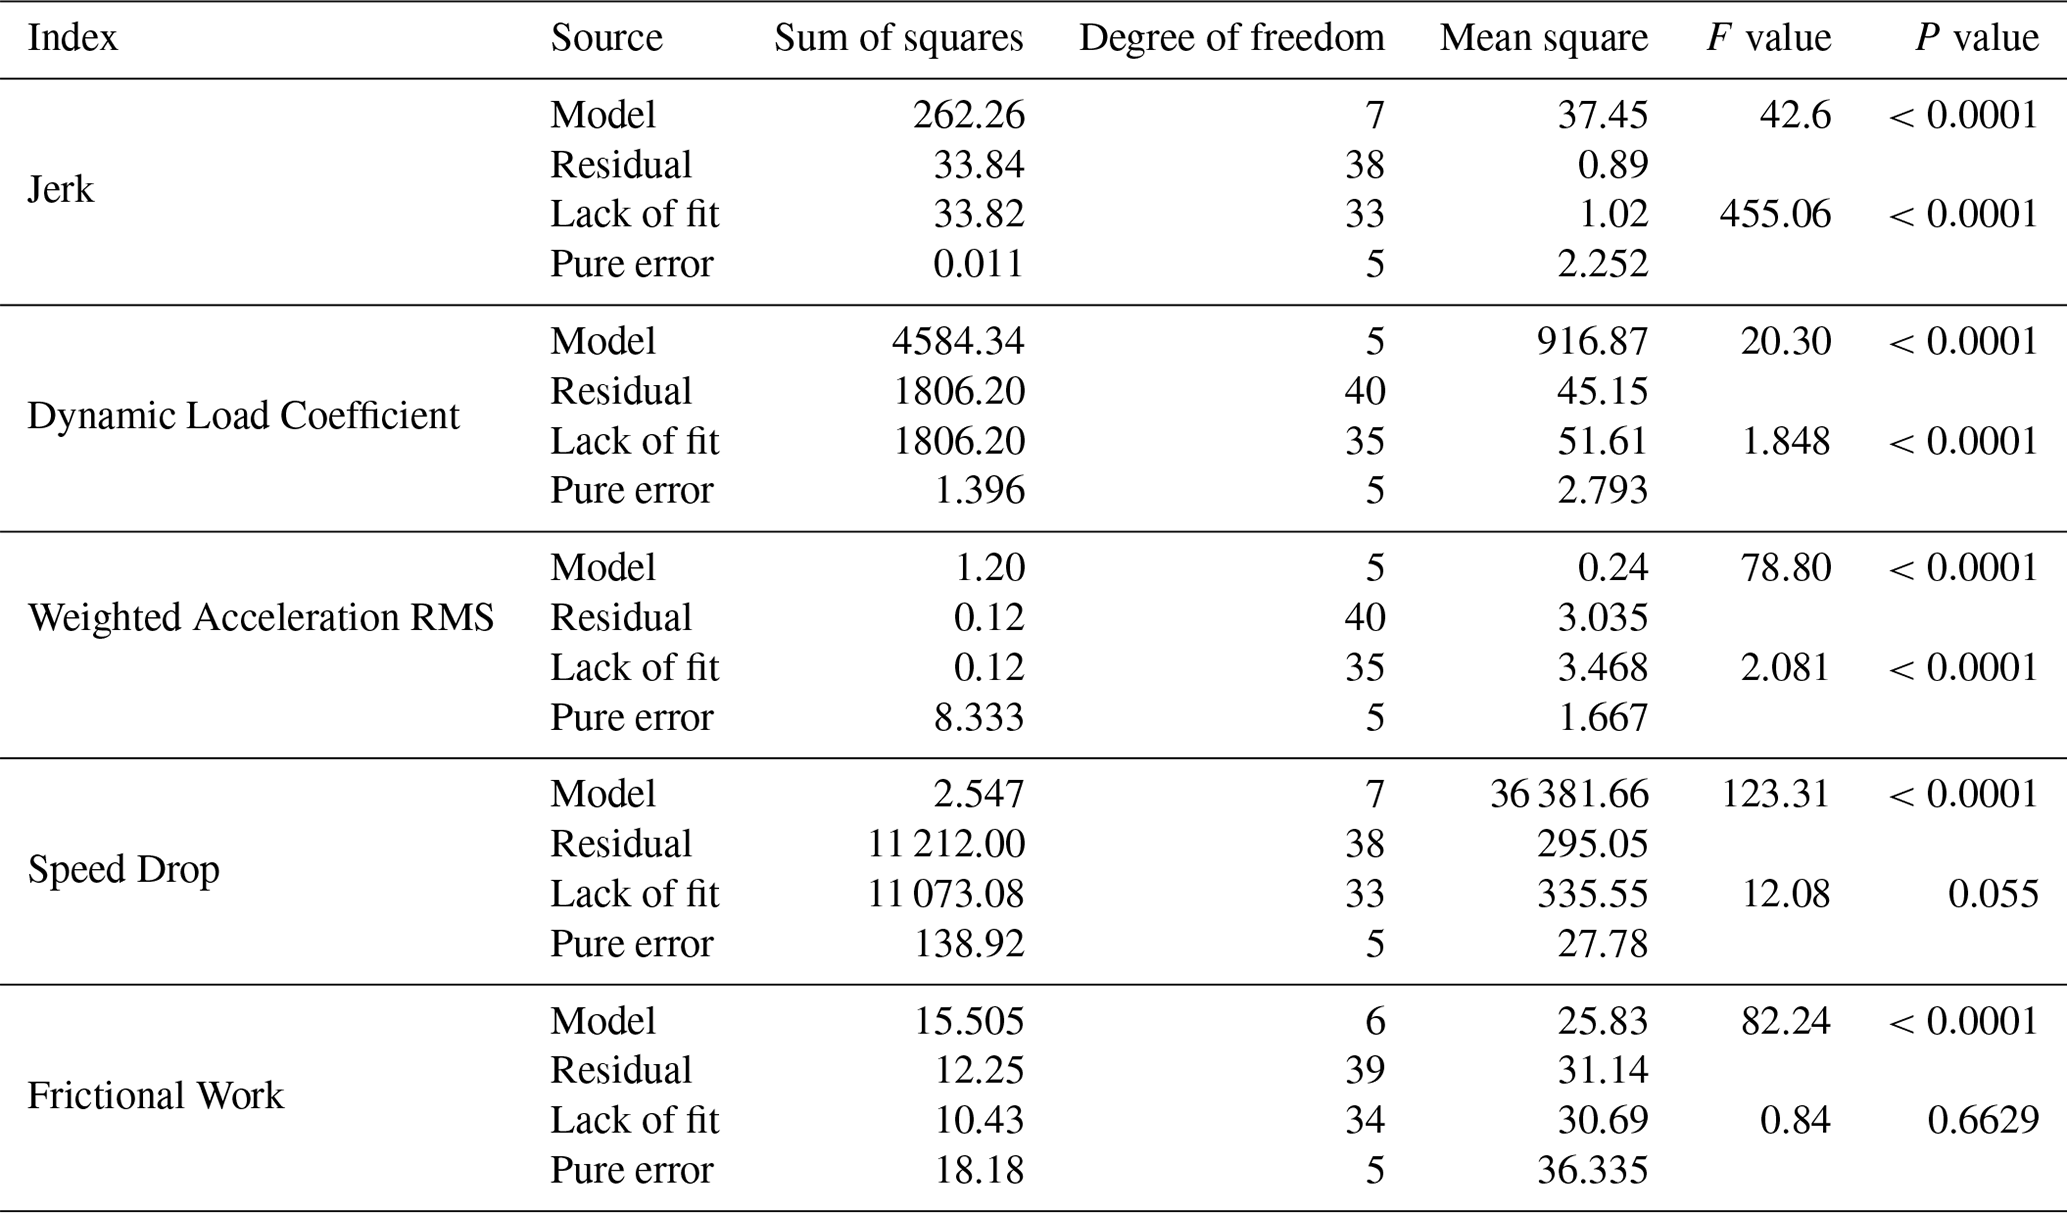
The variance analysis of the test results was carried out, as shown in Table 6. For the regression models of jerk, dynamic load coefficient, speed drop, weighted acceleration RMS and frictional work, P<0.0001, indicating that the regression equation simulation was significant and practical.
4.4.2 Single Factor Analysis
- (1)
Analysis of jerk by single influencing factor
As shown in Fig. 4a, the jerk rose linearly with the increasing clutch oil pressure under experimental decoupling conditions. As shown in Fig. 4b, the jerk declined with the increasing load torque under experimental decoupling conditions and the decline became slowly under the large load torque.

- (2)
Analysis of dynamic load coefficient by single influencing factor

As shown in Fig. 5a, the dynamic load coefficient rose with the increasing load torque under experimental decoupling conditions, showing a slow uptrend under the small load torque. As shown in Fig. 5b, the dynamic load coefficient declined sharply with the increasing displacement ratio and then rose slowly under experimental decoupling conditions.
- (3)
Analysis of speed drop by single influencing factor
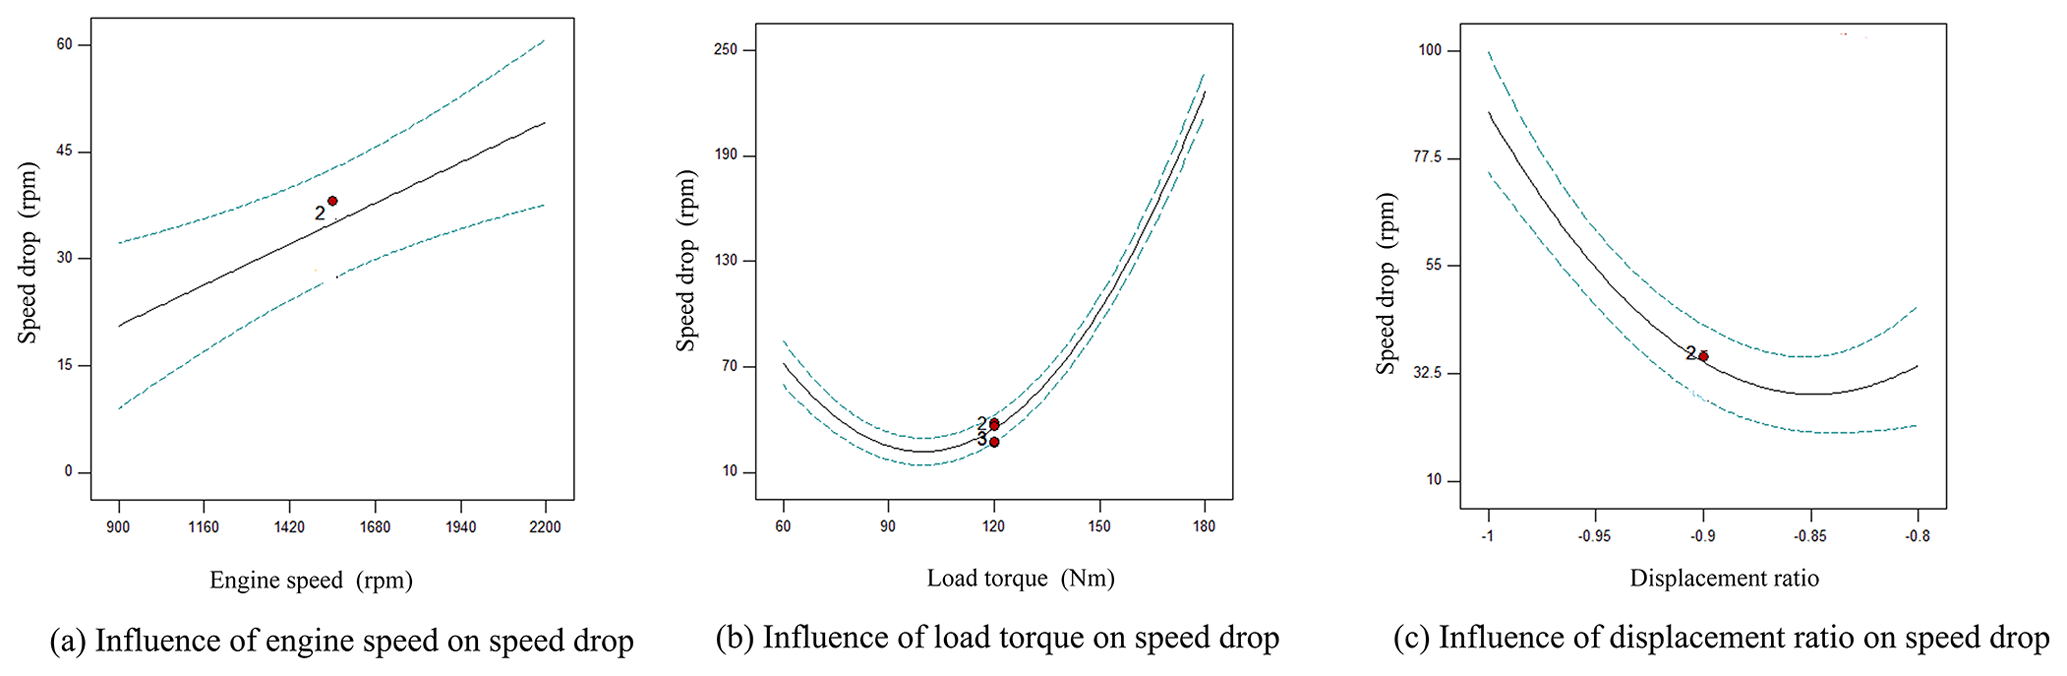
As shown in Fig. 6a, the speed drop rose linearly with the increasing engine speed under experimental decoupling conditions. As shown in Fig. 6b, the speed drop declined sharply with the increasing load torque under experimental decoupling conditions. As shown in Fig. 6c, the speed drop declined sharply first with the increasing displacement ratio and then rose slowly under experimental decoupling conditions.
- (4)
Analysis of weighted acceleration RMS by single influencing factor
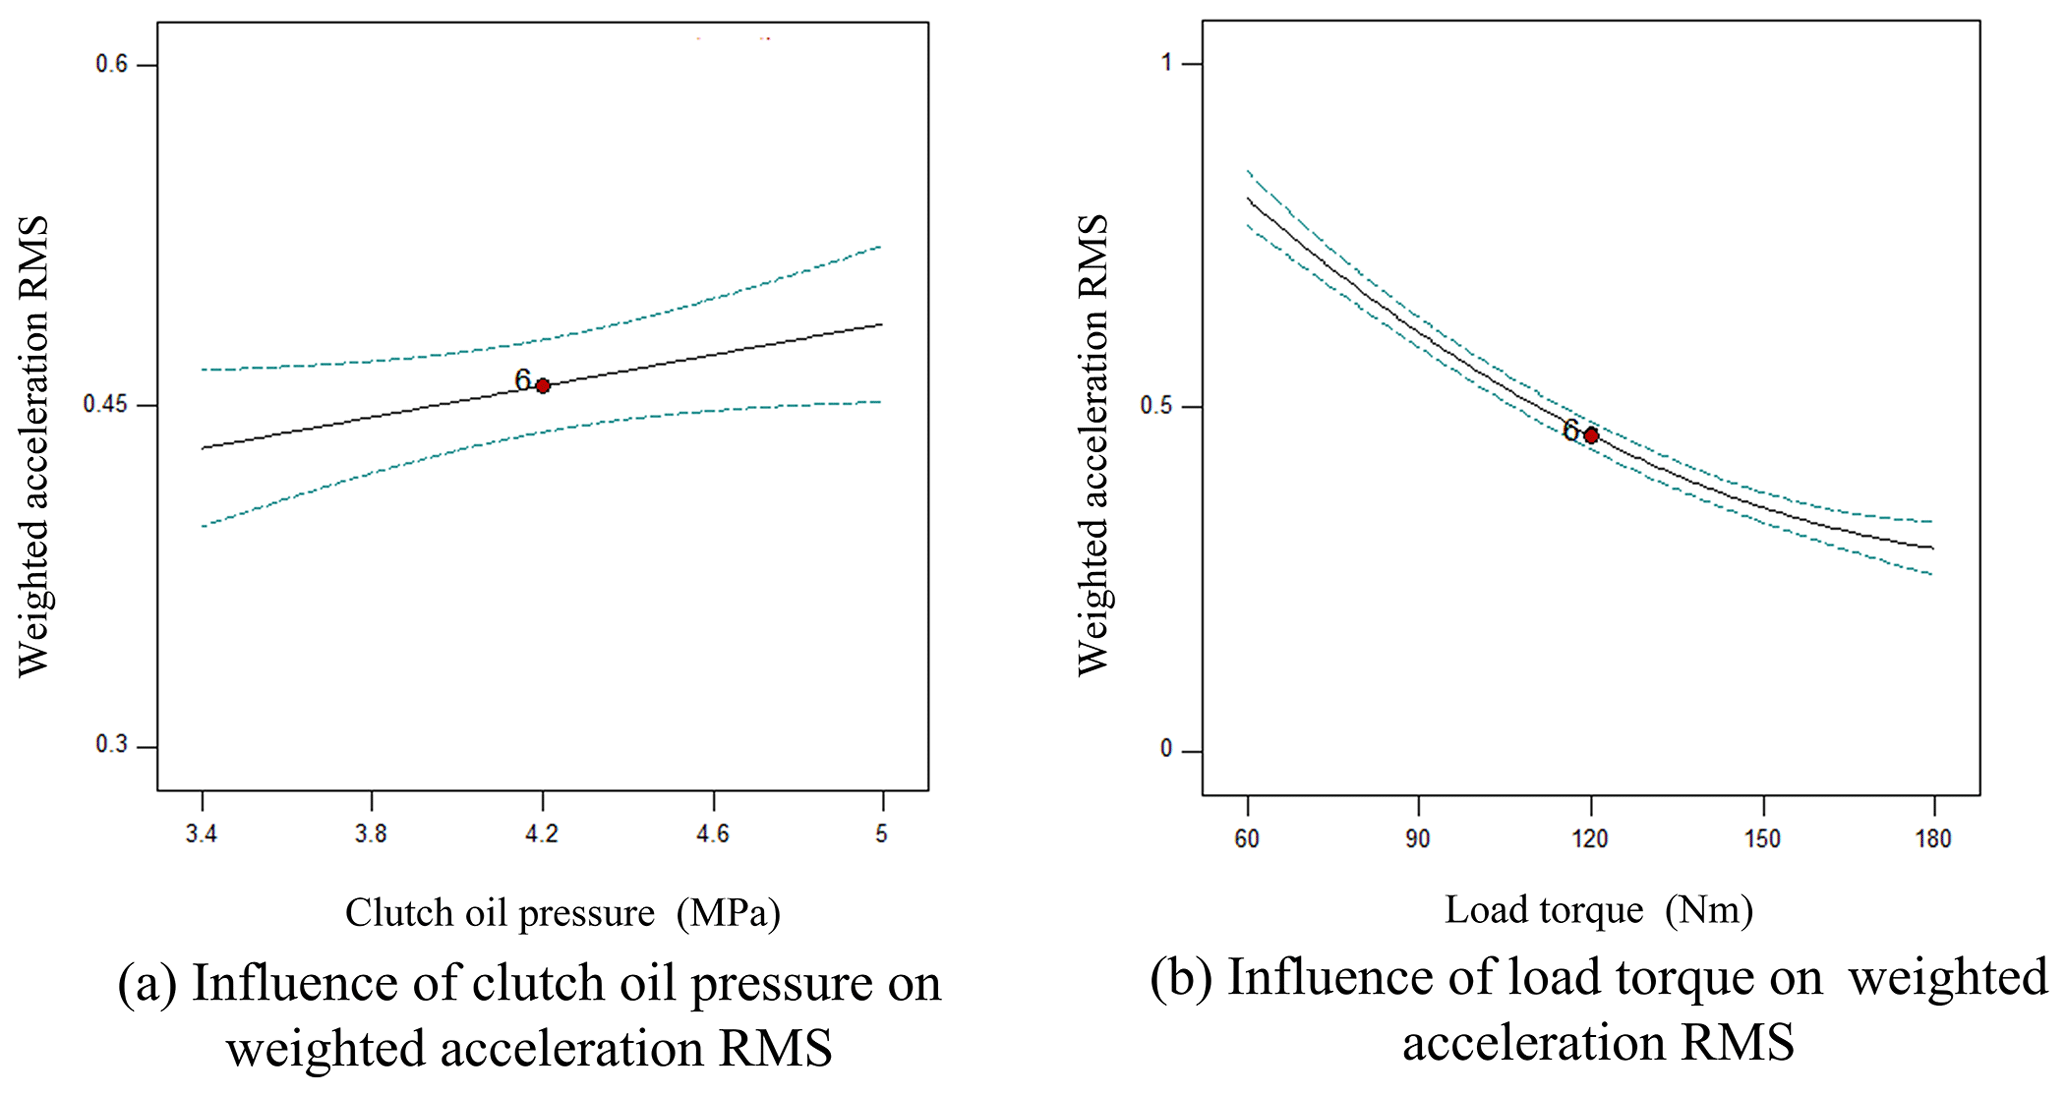
As shown in Fig. 7a, the weighted acceleration RMS rose with the increasing clutch oil pressure under experimental decoupling conditions. As shown in Fig. 7b, the weighted acceleration RMS declined slowly with the increasing load torque under experimental decoupling conditions.
- (5)
Analysis of frictional work by single influencing factor
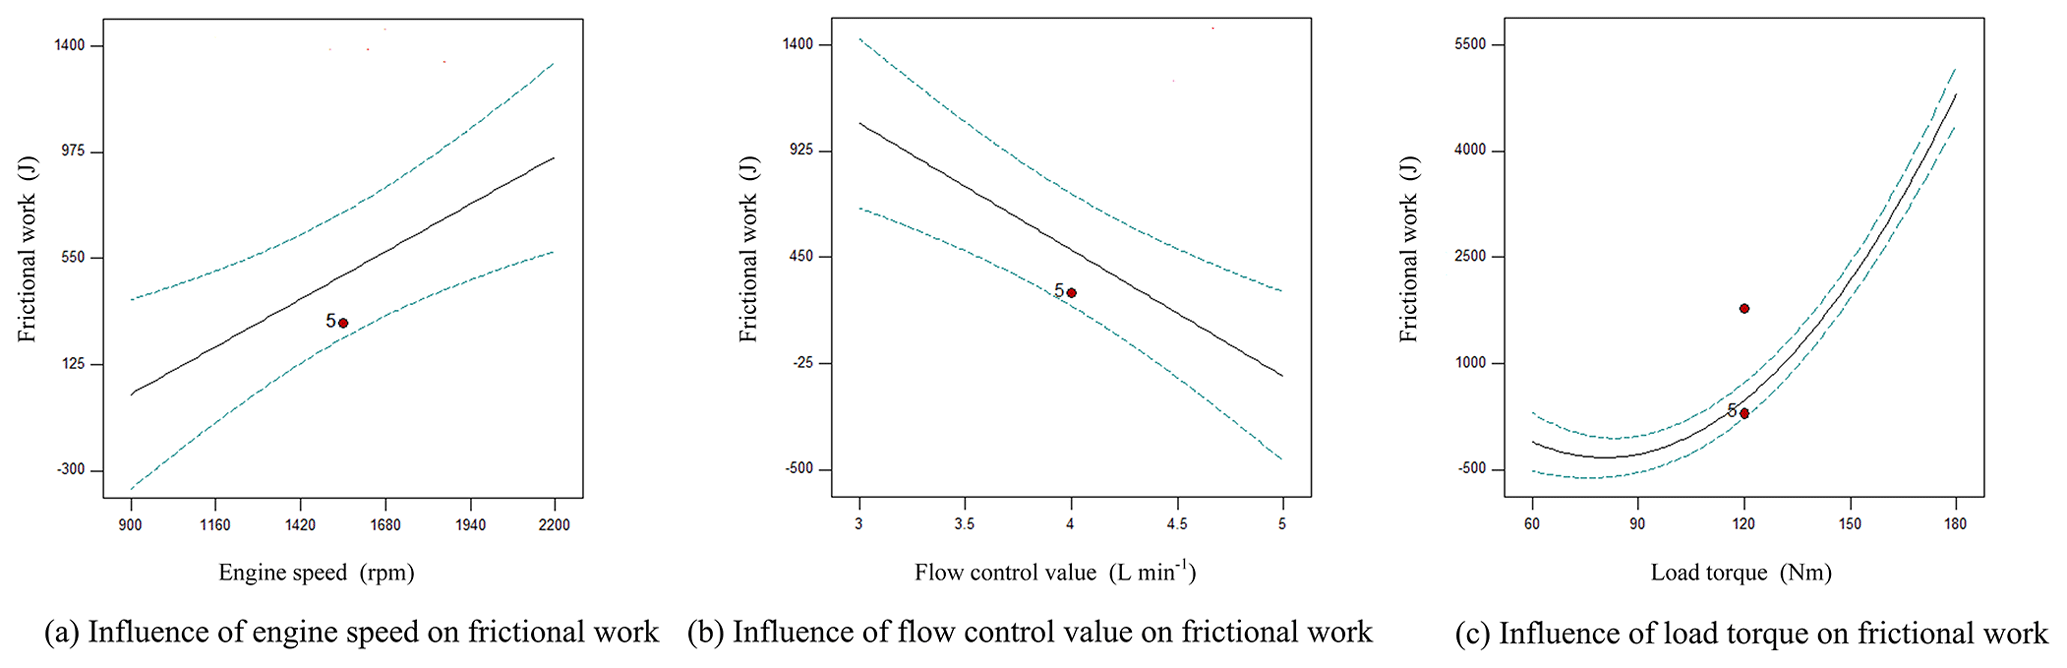
As shown in Fig. 8a, the frictional work rose linearly with the increasing engine speed under experimental decoupling conditions. As shown in Fig. 8b, the frictional work declined linearly with the increasing flow control valve under experimental decoupling conditions. As shown in Fig. 8c, the frictional work declined slowly with the increasing load torque and then rose sharply under experimental decoupling conditions.
4.4.3 Analysis of Interaction Factors
- (1)
Analysis of Jerk by interaction influencing factors
It can be seen from Fig. 9a that when the engine speed, flow control valve and displacement ratio were at the level of 0 (X1=1550 rpm, X3=4 L min−1, ), the jerk increased along with the increasing clutch oil pressure while decreased with the increasing load torque. The response surface indicated that the clutch oil pressure and the load torque had strong interaction effects on the jerk. The response surface changed rapidly along the direction of the load torque while relatively slowly along the direction of the clutch oil pressure. At the test level, the jerk can be reduced through a proper reduction of the clutch oil pressure.
It can be seen from Fig. 9b that when the engine speed, clutch oil pressure, and displacement ratio were at the level of 0 (X1=1550 rpm, X2=4.2 MPa, ), the jerk increased first with the increasing flow control valve flow and then decreased. The jerk decreased as the load increased. The response surface showed that the flow control valve and the load torque had strong interaction effects on the jerk. The response surface changed rapidly along the direction of the load torque while relatively slowly along the direction of the flow control valve. When the flow control valve was 5 L min−1 and the load torque was 180 Nm, the jerk had its minimum value.

- (2)
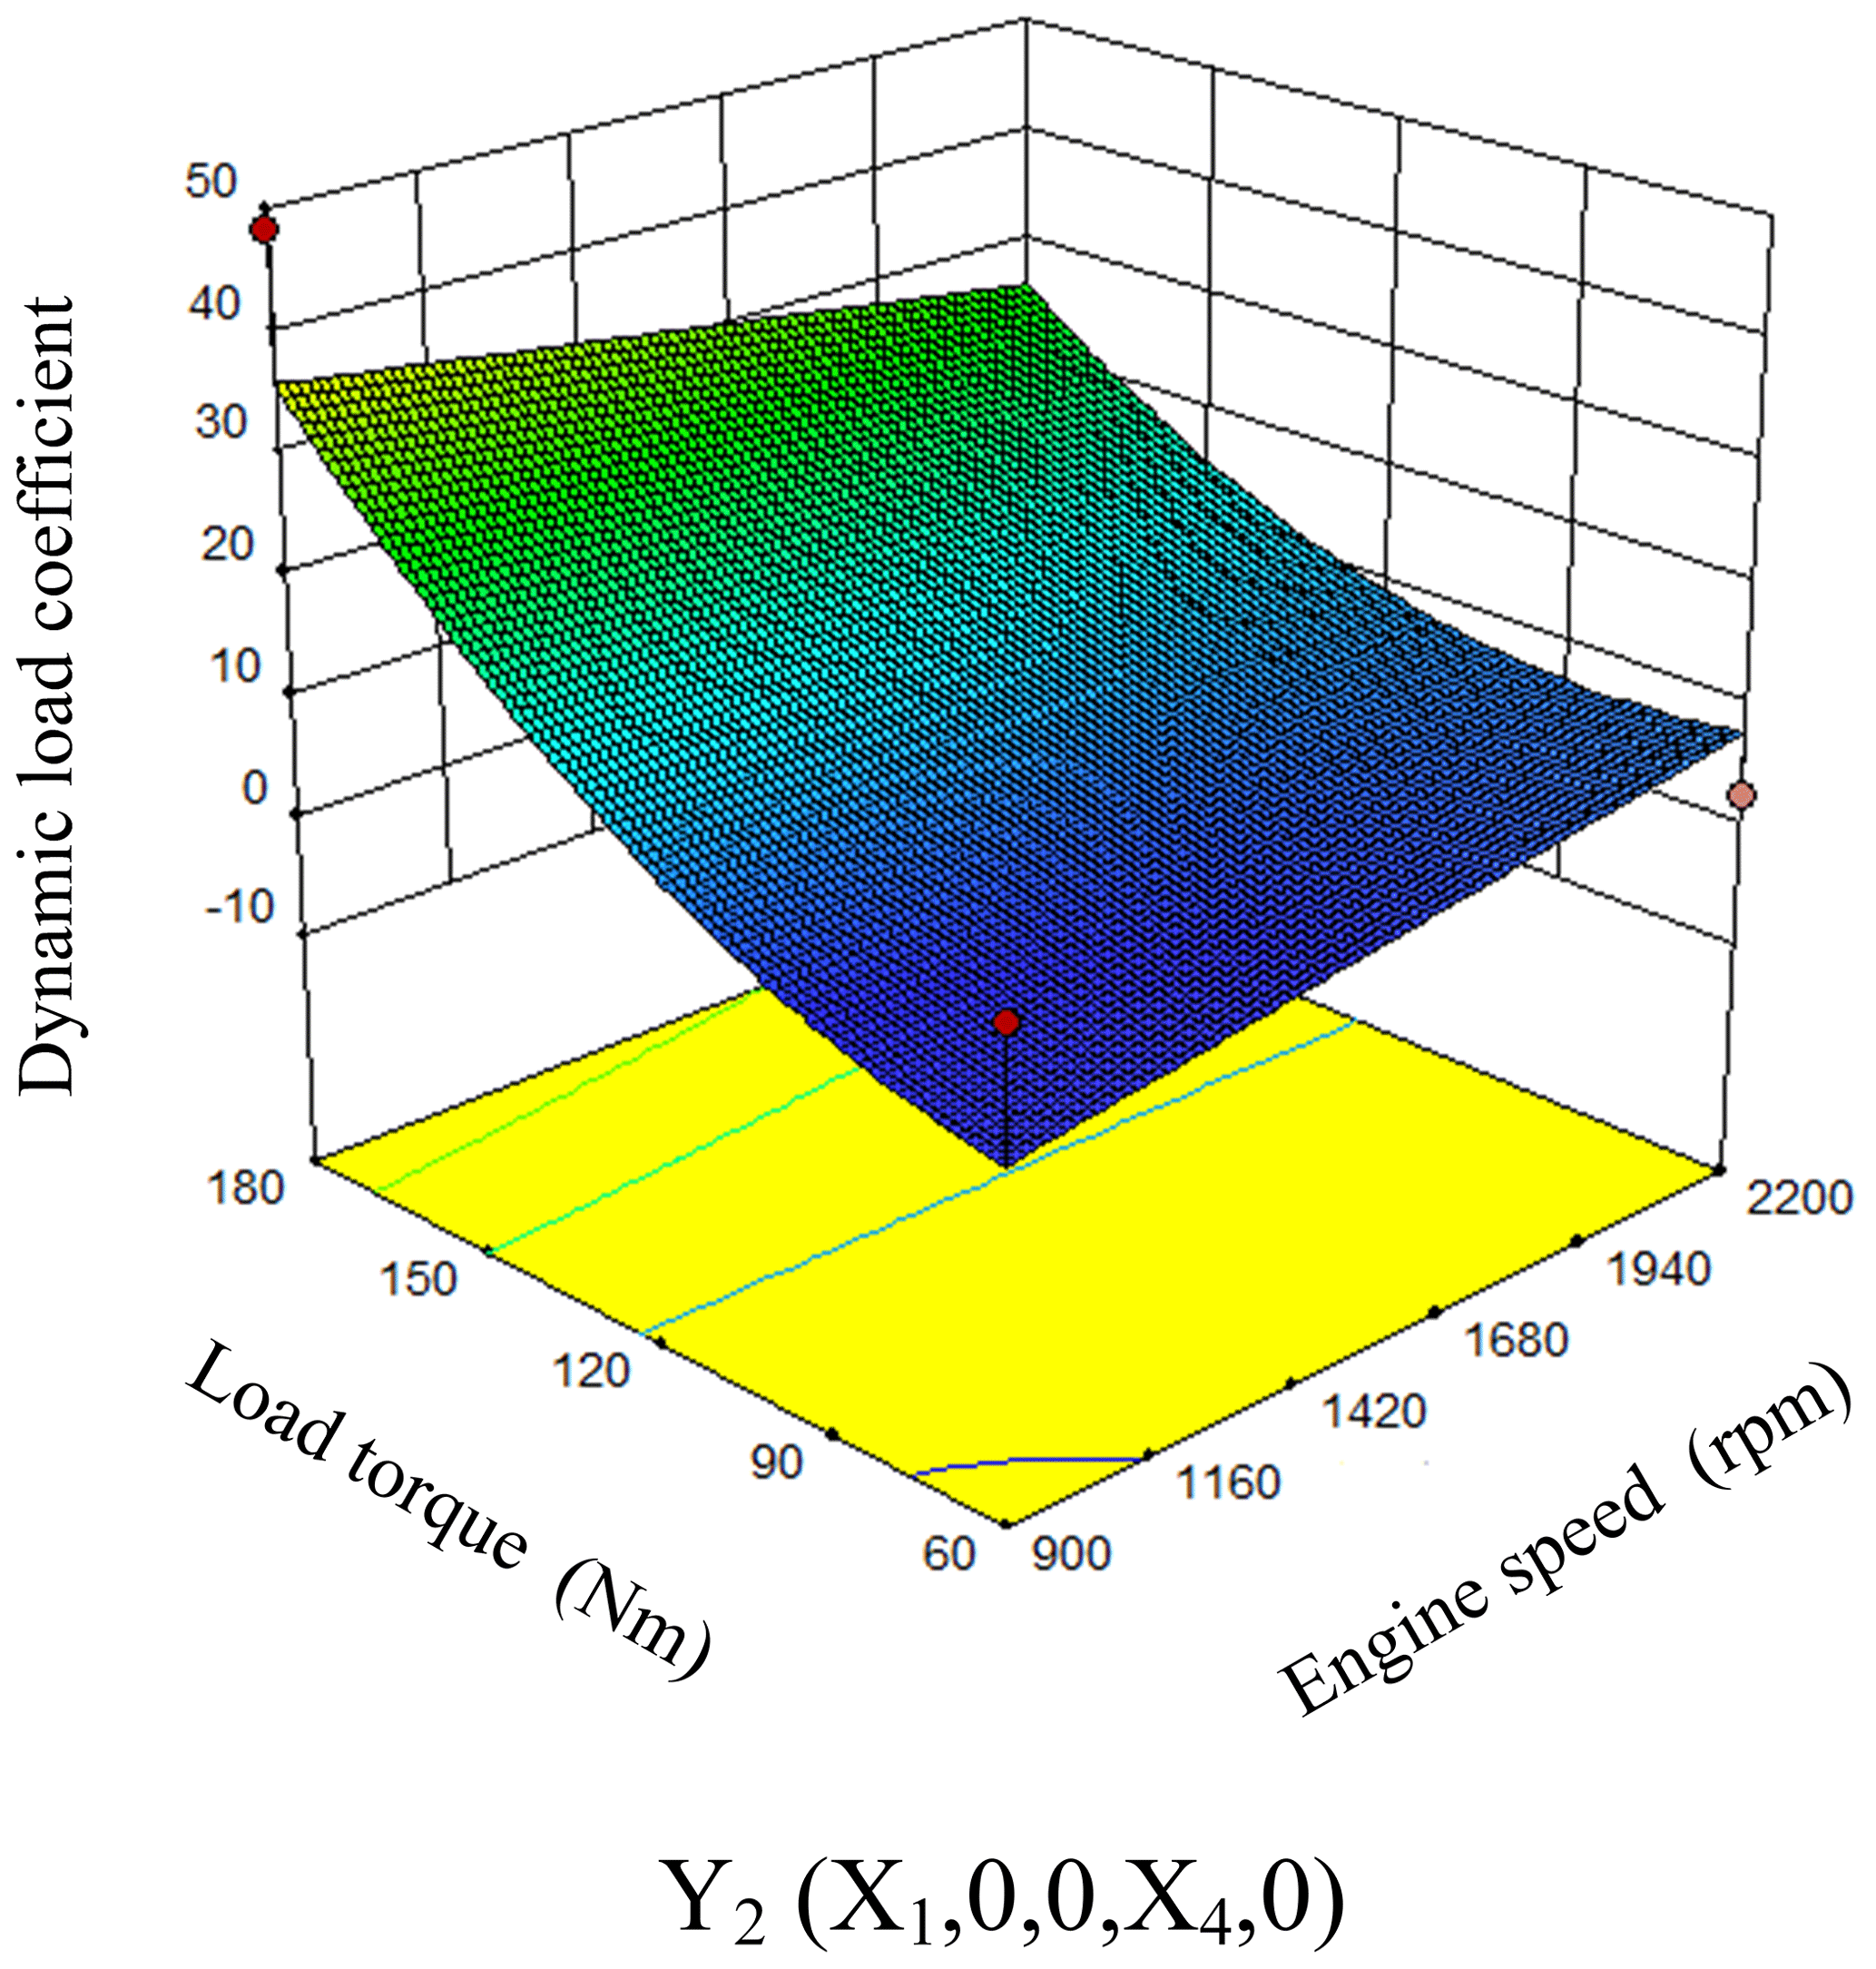
Analysis of dynamic load coefficient by interaction influencing factors
As can be seen from Fig. 10, when the clutch oil pressure, flow control valve and displacement ratio were at the level of 0 (X2=4.2 MPa, X3=4 L min−1, ), the dynamic load coefficient increased along with the increasing engine speed while decreased with the increasing load. The response surface changed rapidly along the direction of the load torque but relatively slowly along the direction of the engine speed. The influence of the load torque on the dynamic load coefficient was significantly greater than that of the engine speed.
- (3)
Analysis of speed drop by interaction influencing factors
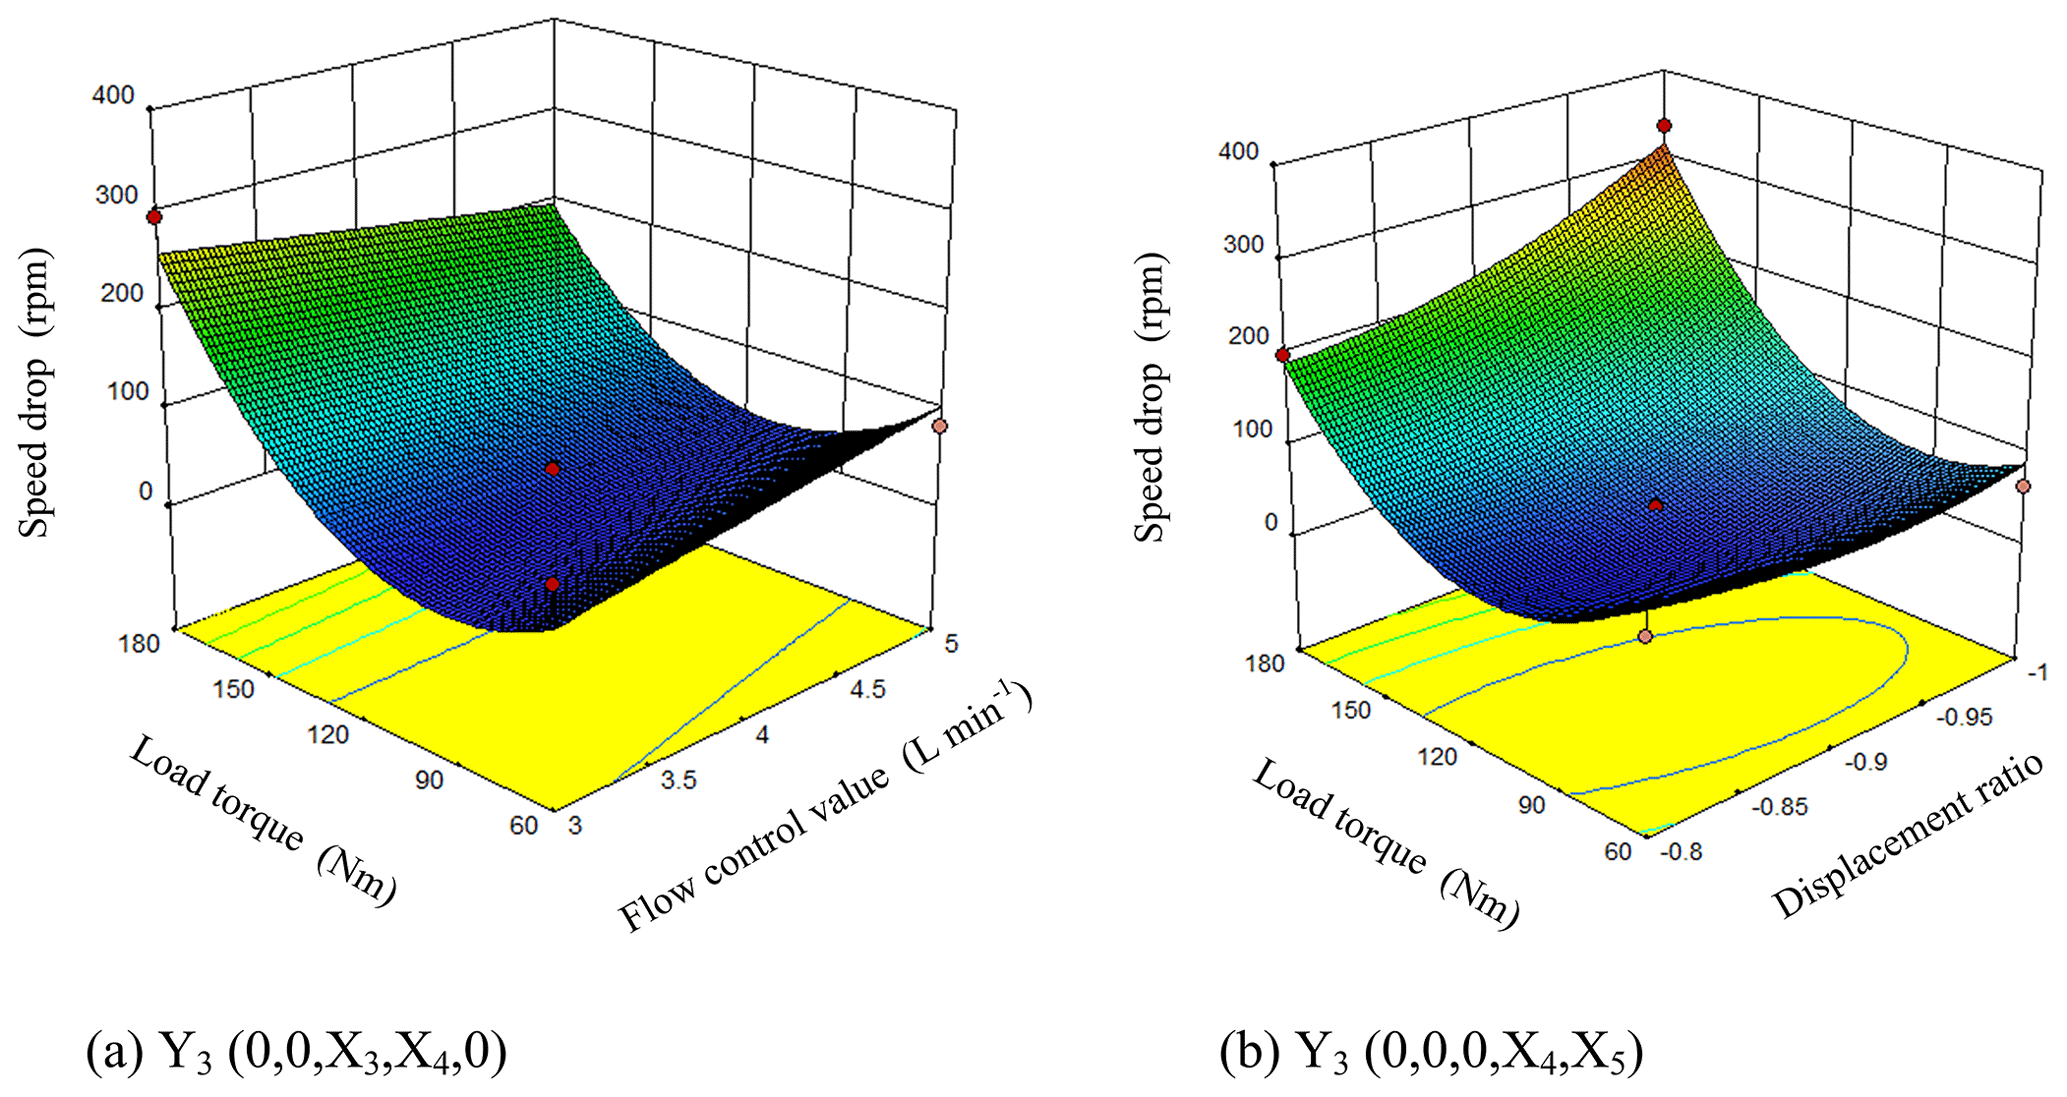
As can be seen from Fig. 11a, when the engine speed, clutch oil pressure and displacement ratio were at the level of 0 (X1=1550 rpm, X2=4.2 MPa, ), the speed drop slowly decreased with the increasing flow control valve. With the increasing load torque, the speed drop decreased first and then increased. It can be seen from the response surface that the flow control valve and the load torque had strong interaction effects on the speed drop. The response surface changed rapidly along the direction of the load torque while relatively slowly along the direction of the flow control valve. The influence of the load torque on the speed drop was significantly greater than that of the flow control valve. When the flow control valve was 3.246 L min−1 the load torque was 78.39 Nm, the speed drop had its minimum value of 20.1 rpm.
It can be seen from Fig. 11b that when the engine speed, clutch oil pressure and flow rate control valve were at the level of 0 (X1=1550 rpm, X2=4.2 MPa, X3=4 L min−1), the speed drop decreased first and then increased along with the increasing displacement ratio and the increasing load torque. It can be seen from the response surface that the load torque and the displacement ratio had strong interaction effects on the speed drop. The response surface changed rapidly along the direction of the load torque while relatively slowly along the direction of the displacement ratio. The influence of the load torque on the speed drop was greater than that of the displacement ratio. The impact is significant. When the load torque was 100.37 Nm and the displacement ratio was −0.89, the speed drop had its minimum value of 20.56 rpm.
- (4)
Analysis of weighted acceleration RMS by interaction influencing Factors
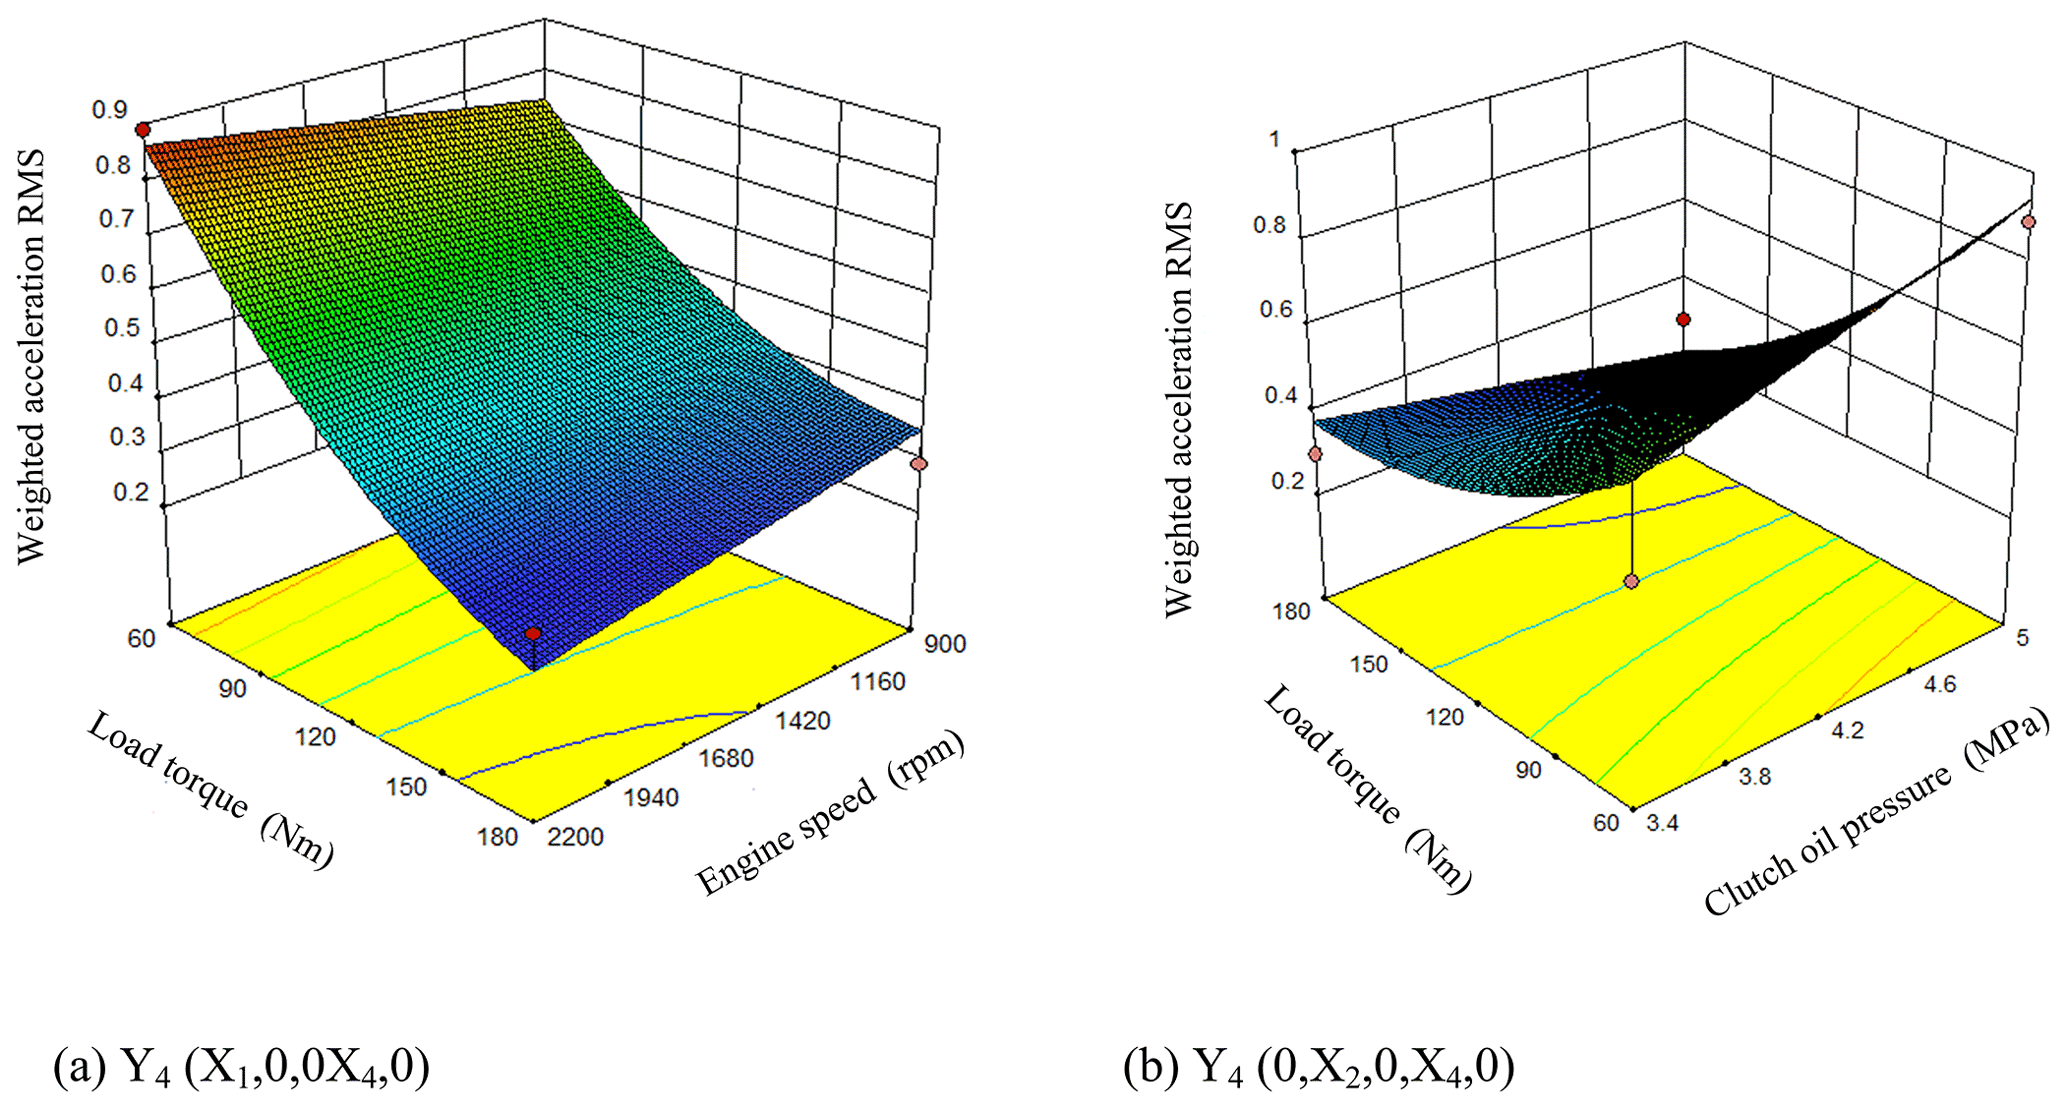
It can be seen from Fig. 12a that when the clutch oil pressure, flow control valve and displacement ratio were at the level of 0 (X2=4.2 MPa, X3=4 L min−1, ), the weighted acceleration RMS decreased slowly along with the increasing engine speed and the increasing load. It can be seen from the response surface that the engine speed and the load torque had strong interaction effects on the weighted acceleration RMS. The response surface changed rapidly along the direction of the load torque while relatively slowly along the direction of the engine speed. The influence of the load torque on the weighted acceleration RMS was greater than that of the engine speed. When the engine speed and load torque were maximum, the weighted acceleration RMS had its minimum value.
It can be seen from Fig. 12b that when the engine speed, flow control valve and displacement ratio were at the level of 0 (X1=1550 rpm, X3=4 L min−1, ), the weighted acceleration RMS decreased slowly along with the increasing clutch oil pressure and the increasing load torque. It can be seen from the response surface that the clutch oil pressure and the load torque had strong interaction effects on the jerk. The response surface changed rapidly along the direction of the load torque while relatively slowly along the direction of the clutch oil pressure. When the clutch oil pressure was 4.2 MPa and the load torque was maximum value, the weighted acceleration RMS had its minimum value.
- (5)
Analysis of frictional work by interaction influencing factors
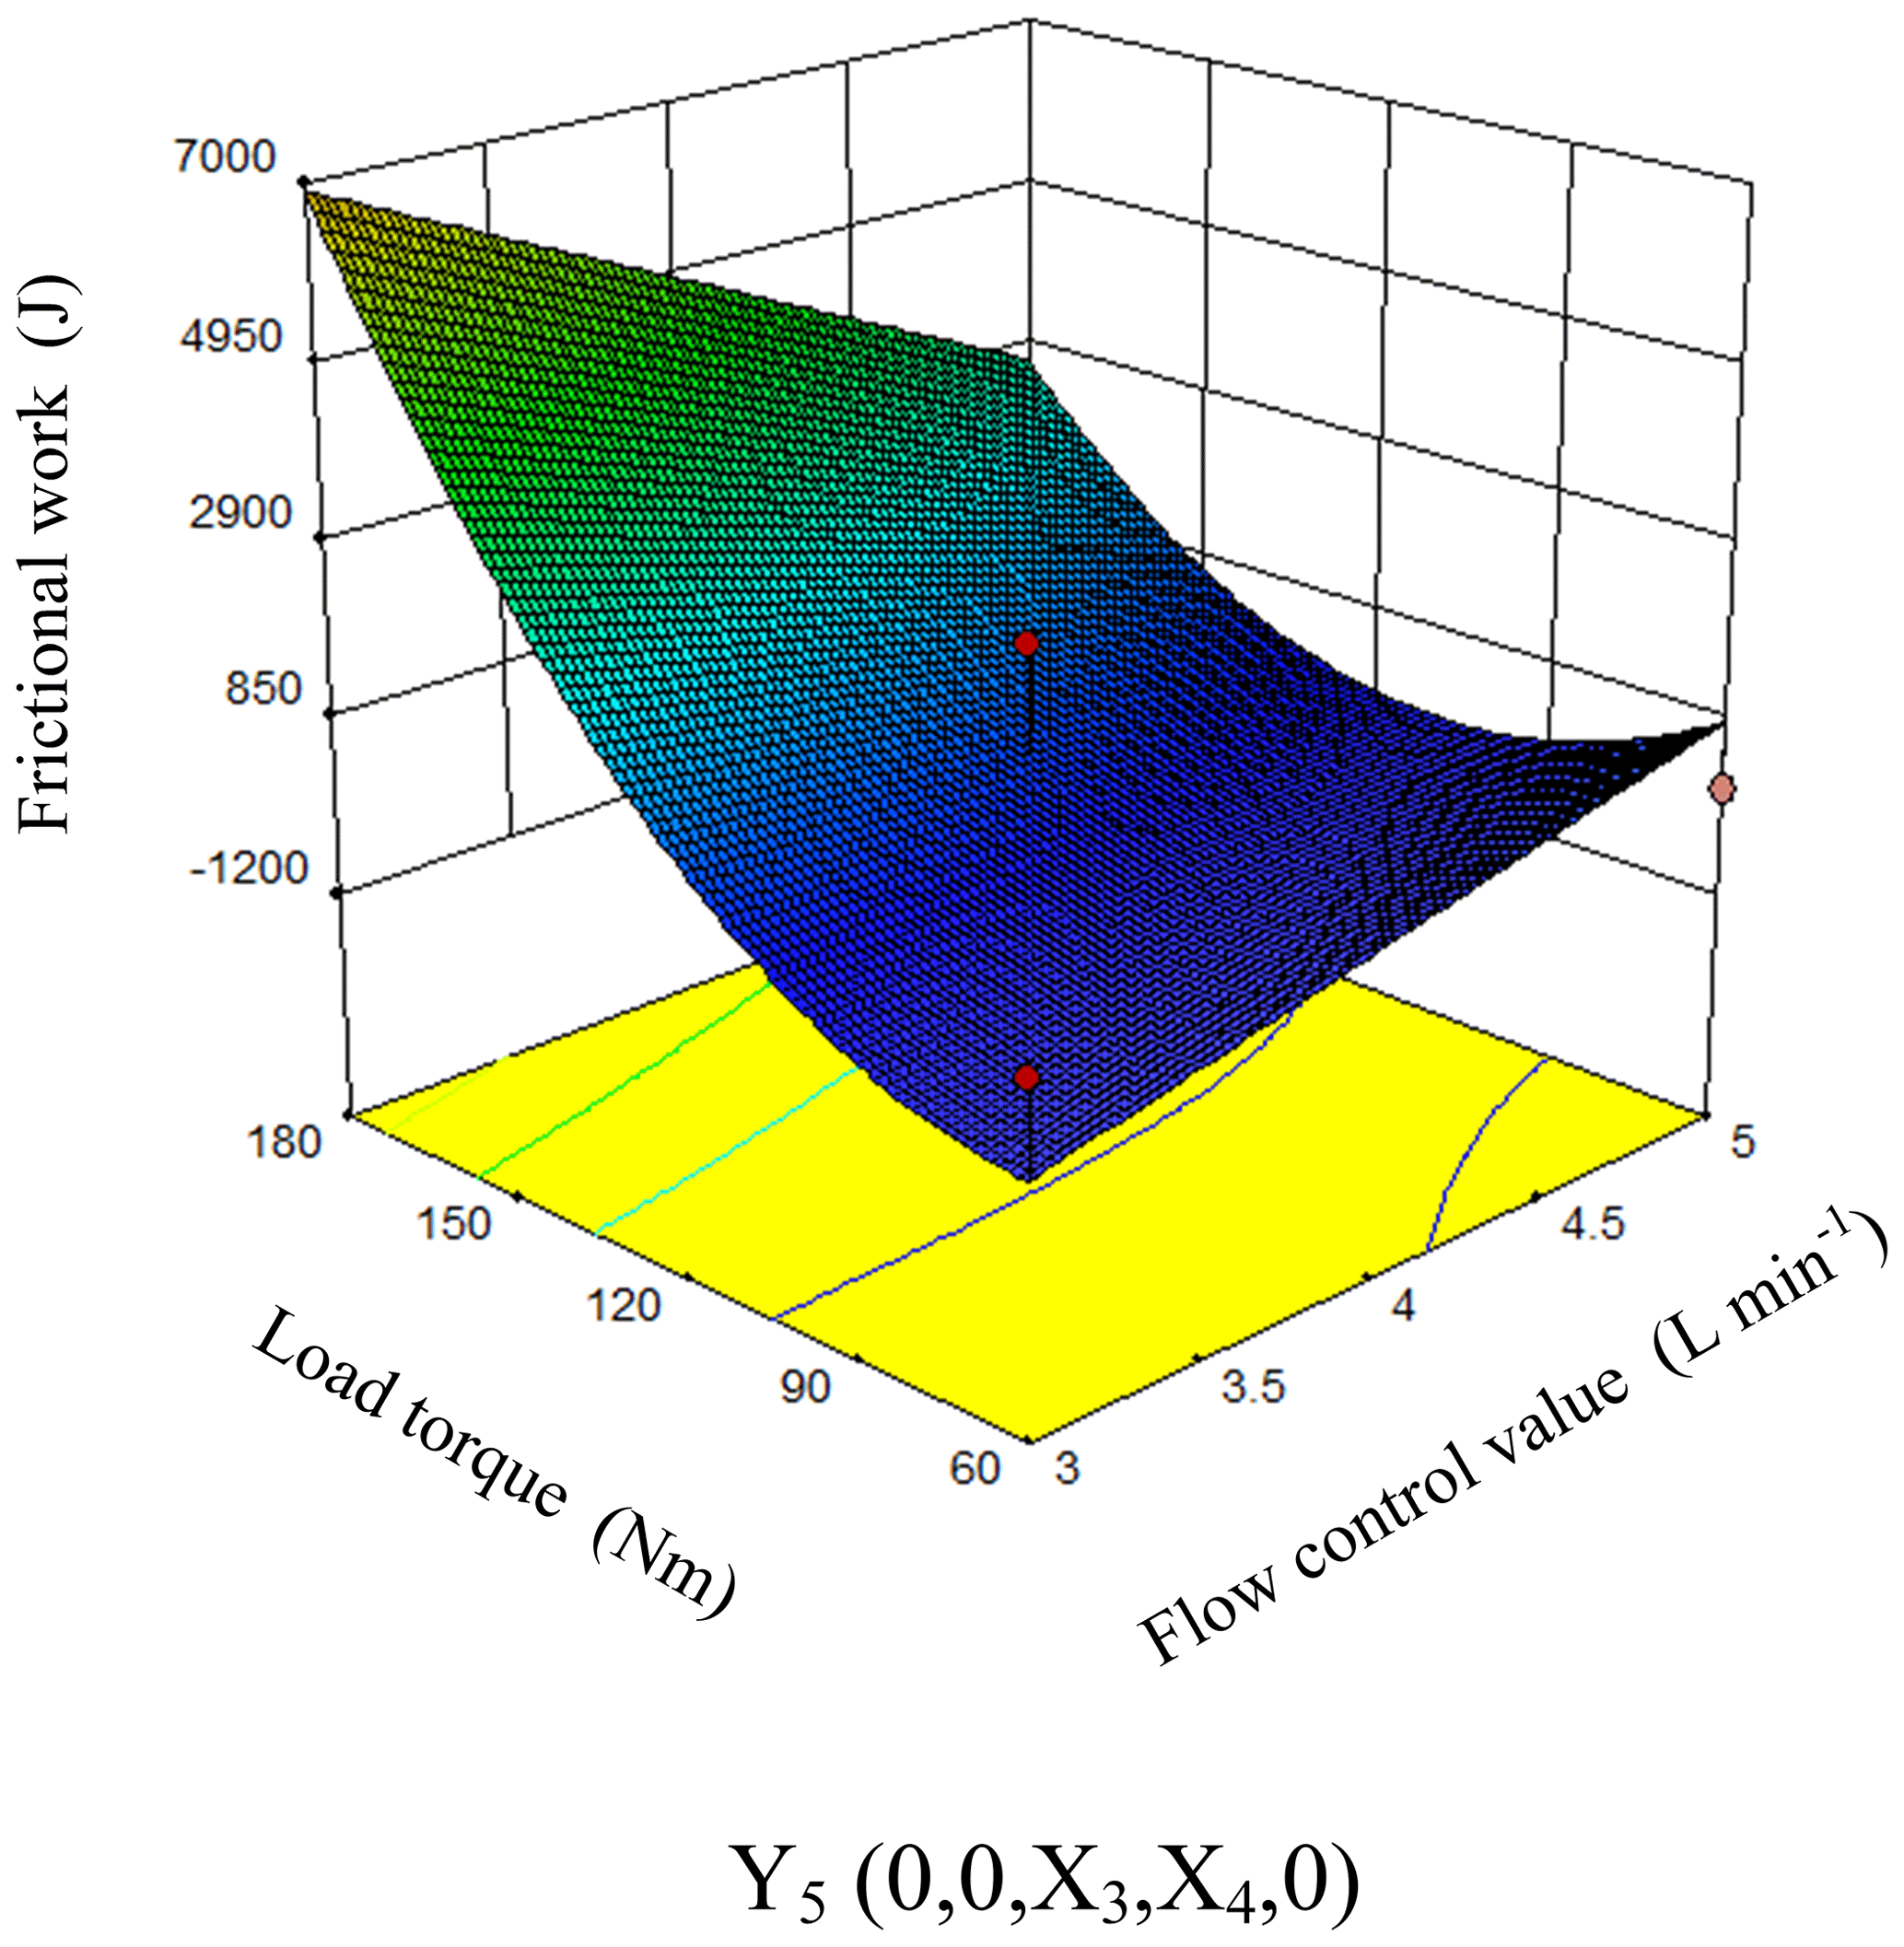
As can be seen from Fig. 13, when the engine speed, clutch oil pressure and displacement ratio were at the level of 0 (X1=1550 rpm, X2=4.2 MPa, ), the frictional work increased along with the increasing flow control valve and the increasing load. It can be seen from the response surface that the flow control valve and the load torque had strong interaction effects on the speed drop. The response surface changed rapidly along the direction of the load torque while relatively slowly along the direction of the flow control valve. The influence of the load torque on the speed drop was greater than that of the flow control valve. When the flow regulating valve and the load torque were minimum value, the frictional work had its minimum value.
4.5 Optimization of Parameters
To ensure the good shift smoothness of the HMCVT, the shifting parameters were optimized based on the objectives of low jerk, low dynamic load coefficient, low speed drop and low weighted acceleration RMS. The optimization was carried out through the Optimization-Numerical module in the data processing software of Design-Expert 10. The objective function and constraints were:
The optimal combination zone of influencing factors was obtained after the optimization. Selected by Design-Expert 10, the optimal combination of parameters was as follows: the engine speed was 901.35 rpm, the clutch oil pressure was 3.52 MPa, the flow control valve was 4.9 L min−1, the load was 130.48 Nm, the displacement ratio was −0.93. In this case, the jerk was 4.84, the dynamic load coefficient was 15.35, the weighted acceleration RMS was 0.45, the speed drop was 21.291 rpm and the frictional work was 1001.01 J.
It can be seen from the optimized combination area that under the optimal parameters, the impact of the gear shifting process was within the acceptable range of the human body. The engine speed of the minimum optimization target was close to the lowest level of experimental factors, the clutch oil pressure was also close to the lowest level while the flow control valve was close to the highest level of experimental factors. Therefore, the values of the engine speed and the clutch oil pressure should be low and the value of the flow control valve should be high during the gear shifting process so that the gear shifting process can be smoother. The displacement ratio should be shifted in advance to minimize all evaluation indexes during the gear shifting process.
4.6 Test verification
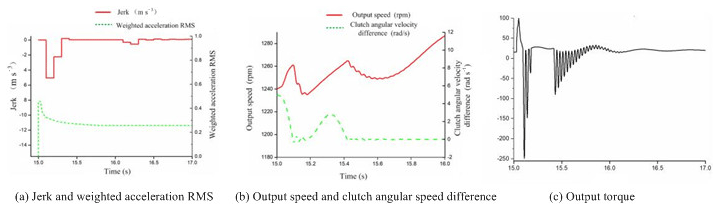
According to the test results above, the test was verified under the low jerk, low dynamic load coefficient, low speed drop, low weighted acceleration RMS and low frictional work. Test conditions: the engine output speed was 900 rpm, the clutch oil pressure was 3.5 MPa, the flow speed control valve was 4.9 L min−1, the load torque was 130 Nm, and the displacement ratio was −0.93. At 15 s, the hydraulic machinery HM1 was shifted to the hydraulic machinery HM2. As shown in Fig. 14a, the test jerk was 5.04 m s−3; the test weighted acceleration RMS was 0.467. As shown in Fig. 14b, the test speed drop was 20.32 rpm; the test clutch main and driven shaft angular speed difference was 3.62 rad s−1. As shown in Fig. 14c, the test dynamic load coefficient was 12.16. Tests showed that in the initial stage of shifting, the jerk, the weighted acceleration RMS, the HMCVT output speed, and the HMCVT output torque all fluctuated sharply. After the gear shifting process was completed, the cutch main and driven shaft angular speed difference was 0. The jerk and the weighted acceleration RMS decreased while the HMCVT output speed and the torque were relatively stable.
The test of the gear shifting smoothness was completed was completed on the HMCVT test bench, which was
-
self-developed by the research group. The test results showed that the jerk increased first and then decreased with the increasing flow control valve flow, it decreased with the increasing load but increased with the increasing clutch oil pressure. The dynamic load coefficient increased with the increasing engine speed and the increasing load. The speed drop decreased slowly with the increasing flow control valve. As the displacement ratio increased, the speed drop decreased first and then increased. As the load torque increased, the speed drop decreased first and then increased. The weighted acceleration RMS decreased slowly with the increasing engine speed and the increasing load. But the weighted acceleration RMS decreased slowly as the clutch oil pressure increased. The frictional work increased with the increasing flow control valve and the increasing load.
-
With the minimum values of jerk, dynamic load coefficient, speed drop, weighted acceleration RMS as the target, the test data was processed and optimized by the Design-Expert 10 software to obtain the optimal parameter combination of the HMCVT gear shifting smoothness: the engine speed was 901.35 rpm, the clutch oil pressure was 3.52 MPa, the flow control valve was 4.9 L min−1, the load was 130.48 Nm, and the displacement ratio was −0.93.
-
Based on the optimized parameter combination that the engine output speed was 900 rpm, the clutch oil pressure was 3.5 MPa, the flow speed control valve was 4.9 L min−1, the load torque was 130 Nm, the displacement ratio was −0.93, the test was performed on the HMCVT test bench. The results were as follows: the jerk was 5.04 m s−3, the weighted acceleration RMS was 0.467, the speed drop was 20.32 rpm, and the dynamic load coefficient was 12.16, which were basically consistent with the optimization results.
| HMCVT | hydro-mechanical continuously variable transmission |
| J | Jerk, m s−3 |
| v | vehicle speed, m s−1 |
| a | vehicle acceleration, m s−2 |
| rd | wheel radius, m |
| Me | engine torque, Nm |
| ia | transmission ratio of the speed transmission |
| ib | transmission ratio of the drive axle |
| I | moment of inertia of the associated section of the output shaft |
| δ | dynamic load coefficient |
| Tmax | HMCVT output maximum torque value, Nm |
| Ts | HMCVT output steady state torque value, Nm |
| γ | speed drop, rpm |
| nmin | output minimum speed value, rpm |
| ns | output steady state speed value, rpm |
| a | instantaneous acceleration, m s−2 |
| t1 | start time of gear shifting, s |
| t2 | end time of gear shifting, s |
| ts | gear shifting time, s |
| Wf | clutch frictional work, J |
| Pf | clutch frictional work rate, kW |
| Tf | clutch torque, Nm |
| t0 | start time of friction, s |
| tt | end time of friction, s |
| Tt | engine output torque, Nm |
| Pe | engine effective power, Nm |
| n | engine speed, rpm |
| Tc | torque transmitted by the clutch, Nm |
| μ | dynamic friction factor, |
| p0 | oil pressure in the hydraulic cylinder, MPa |
| Av | spool drive cavity area, m2 |
| Zc | clutch characteristic parameter |
| Q | flow into the hydraulic cylinder, L min−1 |
| Cd | solenoid valve port flow coefficient |
| pvo | solenoid valve outlet pressure, MPa |
| t3 | clutch disengagement time, s |
| t4 | clutch empty time, s |
| t5 | clutch selection time, s |
| t6 | clutch shifting time, s |
| t7 | clutch engagement time, s |
| V | oil-filled volume, m3 |
| Kq | oil-filled flow coefficient |
| μ | oil density, Kg m−3 |
| Δp | pressure difference between the return spring and the oil-filled pressure, MPa |
All data included in this study are available upon request by contact with the corresponding author.
MB made substantial contributions to the conception and design, the acquisition, the analysis, and the interpretation of data for the work. He also drafted the work or revised it critically for important intellectual content. XN supervised and structured the process of the paper. XZ checked the writing language. SL helped in the writing language.
The authors declare that they have no conflict of interest.
The authors wish to thank the support of the National Natural Science Foundation of China (Grant No. 51665051) and the Autonomous Region Graduate Innovation Project of China (Grant No. XJ2019G112).
This research has been supported by the National Natural Science Foundation of China (grant no. 51665051) and the Autonomous region graduate student innovation project (grant no. XJ2019G112).
This paper was edited by Kheng Lim Goh and reviewed by two anonymous referees.
Bao, M., Ni, X., Wang, Q., Kang, S., Peng, X., Xu, G., and Zhao X.: Research of Shift Law of Tractor HMCVT based on Fuel Economy, J. Mech. Transm., 43, 20–25, https://doi.org/10.16578/j.issn.1004.2539.2019.02.004, 2019 (in Chinese).
Bender, J. and Struthers, K.: Advanced controls for heavy duty transmission applications, Transportation Electronics, 15, 343–353, https://doi.org/10.4271/901157, 1990.
Cheng, G., Zhou, Z., Men, Q., and Deng, C.: The Study on the Measurement & Testing Technology of the HMCVT Hydraulic Pressure Based on the Data Fusion Technology, J. Phys. Conf. Ser., 41, 1289–1294, https://doi.org/10.1088/1742-6596/48/1/240, 2006.
Cheng, Z., Lu, Z., and Dai, F.: Research on HMCVT Efficiency Model Based on the Improved SA Algorithm [J], Math. Probl. Eng., 1289–1294, https://doi.org/10.1155/2019/2856908, 2019.
Liu, Z., Dong, X., Qin, D., and Liu, Y.: Analysis and control on shift quality of dual-clutch transmission, Journal of Chongqing University, 33, 29–34, https://doi.org/10.11835/j.issn.1000-582X.2010.05.005, 2010 (in Chinese with English abstract).
Ni, J., Hu, J., and Xiang, C.: Relaxed static stability based on tyre cornering stiffness estimation for all-wheel-drive electric vehicle, Control. Eng. Pract., 64, 102–110, https://doi.org/10.1016/j.conengprac.2017.04.011, 2017.
Ni, X., Zhu, S., Ou, D., Chang, Y., Wang, G., and Van, N.: Design and Experiment of Hydro- mechanical CVT Speed Ratio for Tractor, Transactions of the Chinese Society for Agricultural Machinery, 44, 15–20, https://doi.org/10.6041/j.issn.1000-1298.2013.04.003, 2013 (in Chinese).
Qu, D., Luo, W., Liu, Y., Fu, B., Zhou, Y., and Zhang, F.: Simulation and experimental study on the pump efficiency improvement of continuously variable transmission, Mech. Mach. Theor., 131, 137–151, https://doi.org/10.1016/j.mechmachtheory.2018.09.014, 2019.
Song, S., Zhang, Y., Liu, K., Fu, Y., Zhang, J., and Zeng, H.: An Analysis on the Evaluation Metrics of Control Quality for Vehicles with dual Clutch Transmission, Automot. Eng., 37, 925–930, https://doi.org/10.19562/j.chinasae.qcgc.2015.08.011, 2015 (in Chinese).
Wang, G., Zhang, H., Li, X., Wang, J., Zhang, X., and Fan, G.: Computer-aided synthesis of spherical and planar 4R linkages for four specified orientations, Mech. Sci., 10, 309–320, https://doi.org/10.5194/ms-10-309-2019, 2019a.
Wang, G., Zhang, X., Li, X., Fan, G., Zhang, H., and Sun, R.: Analysis of shift quality of power split continuuously variable transmission for tractor equipped with steel belt, Transactions of the Chinese Society of Agricultural Engineering, 35, 62–72, https://doi.org/10.11975/j.issn.1002-6819.2019.05.008, 2019b.
Xia, Y., Sun, D., Qin, D., and Zhou, X.: Optimisation of the power-cycle hydro-mechanical parameters in a continuously variable transmission designed for agricultural tractors, Biosyst. Eng., 193, 12–24, https://doi.org/10.1016/j.biosystemseng.2019.11.009, 2020.
Xiao, M., Wang, Y., Tian, Y., Li, X., Zhang, H., and Kang, J.: Meshing force research of planetary gear for hydro-mechanical continuously variable transmission(Article), International Agricultural Engineering Journal, 27, 136–147, 2018.
Xiao, M., Zhao, J., Wang, Y., Yang, F., Kang, J., and Zhang, H.: Research on system identification based on hydraulic pump-motor of HMCVT, Engineering in Agriculture, Environment and Food, 12, 420–426, https://doi.org/10.1016/j.eaef.2019.06.004, 2019.
Xu, L., Liu, H., Zhou, Z., and Wang, X.: Evaluation index of shifting quality for dual clutch transmission for tractor, Transactions of the Chinese Society of Agricultural Engineering, 31, 48–53, https://doi.org/10.3969/j.issn.1002-6819.2015.08.008, 2015 (in Chinese with English abstract).
Yang, S., Bao, Y., and Fan, C.: Study on characteristics of hydro-mechanical transmission in full power shift, Adv. Mech. Eng., 10, 1–13, https://doi.org/10.1177/1687814018790668, 2018.
Yu, C., Tseng, C., and Chang, C.: Study on Power Train of Two Axles Four Wheel Drive Electric Vehicle, Energy Proced., 14, 1528–1535, https://doi.org/10.1016/j.egypro.2011.12.1128, 2012.
Zhang, M., Guo, R., and Chen, C.: Characteristics of the Hydro-Mechanical Continuously Variable Transmission in the Wheeled Tractor, Appl. Mech. Mater., 494–495, 167–170, https://doi.org/10.4028/www.scientific.net/AMM.494-495.167, 2014.
Zhang, M., Yin, Y., Hao, X., Wang, T., and Cui, M.: Dynamic Three Parameter Range Shifting Law of the Multi-range Hydro-Mechanical CVT, Recent Developments in Mechatronics and Intelligent Robotics, 691, 51–56, https://doi.org/10.1007/978-3-319-70990-1, 2018.
Zhu, Z., Gao, X., Cao, L., Cai, Y., and Pan, D.: Research on the shift strategy of HMCVT based on the physical parameters and shift time, Appl. Math. Model., 40, 6889–6907, https://doi.org/10.1016/j.apm.2016.02.017, 2016.
Zhu, Z., Chen, L., and Zeng, F.: Reverse design and characteristic study of multi-range HMCVT, IOP Conf. Ser.-Mat. Sci., 231, 1–7, https://doi.org/10.1088/1757-899X/231/1/012178, 2017.
- Abstract
- Introduction
- HMCVT transmission scheme and test bench
- Evaluation indexes and influencing factors of section shifting smoothness
- Test design and analysis
- Conclusions
- Appendix A: Nomenclature
- Data availability
- Author contributions
- Competing interests
- Acknowledgements
- Financial support
- Review statement
- References