the Creative Commons Attribution 4.0 License.
the Creative Commons Attribution 4.0 License.
 | 19 Jun 2019
Effect of Quenching Media and Tempering Temperature on Fatigue Property and Fatigue Life Estimation Based on RBF Neural Network of 0.44 % Carbon Steel
Song Guo
Changyou Li
Jingang Shi
Fangjun Luan
Xiaoyu Song
In this work, the effect of the quenching media (brine, water, and two types of naphthenic mineral oils) and the tempering temperature (200, 400, 600 ∘C) on the static mechanical properties and the fatigue life has been investigated using 300 fatigue and 36 static tension tests. S–N curves and standard deviations of fatigue life under each heat treatment condition were calculated and shown. The fracture surfaces of the selected 11 specimens were observed by the scanning electron microscope and the reasons of affecting the fatigue life were discussed. To estimate the mean fatigue life under the conditions of any given tempering temperature and cycle stress amplitude based on 300 fatigue tests, the mean fatigue life estimation method based on RBF neural network was presented and verified by 12 other fatigue tests. The test results have shown that (1) the mean fatigue life decreases with the increase of tempering temperature for the same quenching media, (2) the mean fatigue life using brine is more than water which is more than naphthenic mineral oils for the same tempering temperature, and (3) the proposed method based on RBF neural network could accurately estimate the mean fatigue life when the tempering temperature and cyclic stress amplitude are given for each quenching medium.
- Article
(15185 KB) - Full-text XML
- BibTeX
- EndNote


In general, the fatigue life of the carbon steel could be improved by the quenched and tempered process. For example, it has been reported by Mei and Morris (1990) that the fatigue crack growth rate of the austenitic stainless steels 304L was 10 times slower than that of 304LN due to martensite coating the growing crack of 304L. Moreover, Fatigue life of structures is mainly determined by the surface roughness, residual stress and microstructure (Suraratchai et al., 2008). It has been observed that the microstructure and the residual stress relief of the quenched and tempered dual phase steels were affected by the tempering temperature (Anazadeh Sayed and Kheirandish, 2012; Kuang et al., 2014). For the tool steel, retained austenite percentage, hardness, and microstructure are affected by the different quenching media (Amini et al., 2013). It has been experimentally verified by Kumar et al. (2014) that during the tempering temperature range of 200–400 ∘C, there is sudden increase in impact strength, ductility and toughness of the ductile cast iron, as the temperature and time increase. The hardness and ultimate tensile strength gradually decrease, and the percent elongation of the spring steel increases by increasing tempering time and temperature (Htun et al., 2008). Therefore, it is important to analyze the fatigue property of the quenched and tempered 0.44 % carbon steel with the different quenching media and tempering temperature to ensure the high safety and reliability of the part of the type of material in service.
The effect of the quenching media on the fatigue property of AISI 4340 has been reported by Hamza et al. (2016) where the material was austenized at the different temperature and subsequently tempered at 350 ∘C for 1 h. The test results showed that fatigue resistance with the quenching media of air was superior to that with the quenching media of water which was superior to the oil when the austenized temperature was 850 or 800 ∘C. This was different from the case with the austenized temperature of 900 or 950 ∘C. It has been observed by Harichandra et al. (2016) that the specimens of EN31 steel quenched in gingili oil have 10 times more fatigue life than the specimens quenched in the water and 100 times more than unquenched specimens in high-cycle rotating bending fatigue tests.
Tempering temperature is another important factor affecting the fatigue characteristics of the quenched and tempered carbon steel. It has been reported by London et al. (1989) that growth rates of the small surface crack was gradually slowing down at the same cyclic stress intensity when the tempering temperature was increased from 200 to 700 ∘C for cantilevered bending fatigue samples. Moreover, the threshold of stress intensity factor of small cracks growth was greater than that of their corresponding long crack when the tempering temperatures was 200 ∘C or 400 ∘C, and this was exactly the opposite of the case when the quenching temperature is 500 and 700 ∘C. It was observed by Amirat and Chaoui (2003) that the fatigue crack growth rates of the mining chain steel tempered at 500 ∘C was slightly lower than the one tempered at 200 ∘C in the near the threshold of the stress intensity factor. Similarly, the work of Tsay et al. (1997) also showed that the fatigue crack growth rates would increase when the tempering temperature was decreased from 600 to 400 ∘C for both D6AC steel plates and laser welds. However, the conclusions were obtained by Sultan (2013) that the fatigue resistance of the carburized steel was decreased with the decrease of the tempering temperature. Here, the carburized specimens were austenized at 760 ∘C, and quenched in water, and then tempered at temperatures 200, 300 and 400 ∘C for 1 h. The fatigue limit was also affected by the tempering temperature. For example, it was reported by Yu et al. (1988) that the fatigue limit decreased as the tempering temperature increased from 315, 482 to 649 ∘C for the centre-notched specimens, and the notch sensitivity and absolute notch fatigue strength were not significantly affected by the tempering temperature. It was found by Oguma and Nakamura (2009) that in the 105–108 cycle range, the fatigue strength of the high strength steel tempered at 433 K was lower than that of the material tempered at 573 K where the uniaxial tension-compression fatigue tests were carried out. It was observed by Williams et al. (2006) that the tempering temperature increase of the 4300 sintered steel from 205 to 315 ∘C resulted in an increase of the fatigue strength of 2 %. The tempering temperatures of the optimal fatigue resistance have been obtained for some types of steel. For example, the fatigue limit, ductility and toughness of the high strength spring steel were highest when the tempering temperature was 450 ∘C. Here, the specimens were austenized at 900 ∘C for 40 min and quenched into oil, and then tempered for 30 min at the temperatures of 300, 350, 400, 450 and 500 ∘C (Lee et al., 1997). The high strength steel tempered at 250 ∘C exhibited superior fatigue properties in the short life regions. The steel was heated up to 950 ∘C for 5 min and quenched using water. Tempering treatments at the temperatures of 100, 250 and 340 ∘C were performed for 30 min and followed by air cooling (Kwon et al., 2014). For 0.45 % carbon steel, it was observed by Siddiqui et al. (2006) that the fatigue life increased with the increase of the tempering temperature from 100 to 200 ∘C, and the resistance to fatigue failure reduced when the tempering temperature was further increased. It was also seen by Anctil and Kula (1970) that the crack-growth rates of 4340 steel decreased as the tempering temperature increased to 600 F, and then increased again with higher tempering temperatures.
In this work, the effect of quenching media and tempering temperature on the fatigue life of the quenched and tempered 0.44 % carbon steel were analyzed and discussed, and the mean fatigue life estimation method based on RBF neural network was presented. The specimens were austenized at 850 ∘C for 20 min and quenched into water, brine, and two types of naphthenic mineral oils respectively. And they were subsequently tempered at different temperature. The remainder of this paper is organized as follows: In Sect. 2, the original material, the geometry of specimens, static tensile and fatigue tests were described, and the static tensile experiment results were shown and analyzed by the statistical method. In Sect. 3, the scatter plots of the fatigue life were given for all fatigue tests, S–N curves were formulated and their curve-fitting parameters were listed, and the standard deviations of fatigue life under each heat treatment condition were shown in one figure. The fracture surfaces of the selected specimens were observed by the scanning electron microscope and the laws of fatigue life were discussed. In Sect. 4, the mean fatigue life estimation method based on RBF neural network was presented and verified by 12 other fatigue tests. Finally, the conclusions were drawn in Sect. 5.

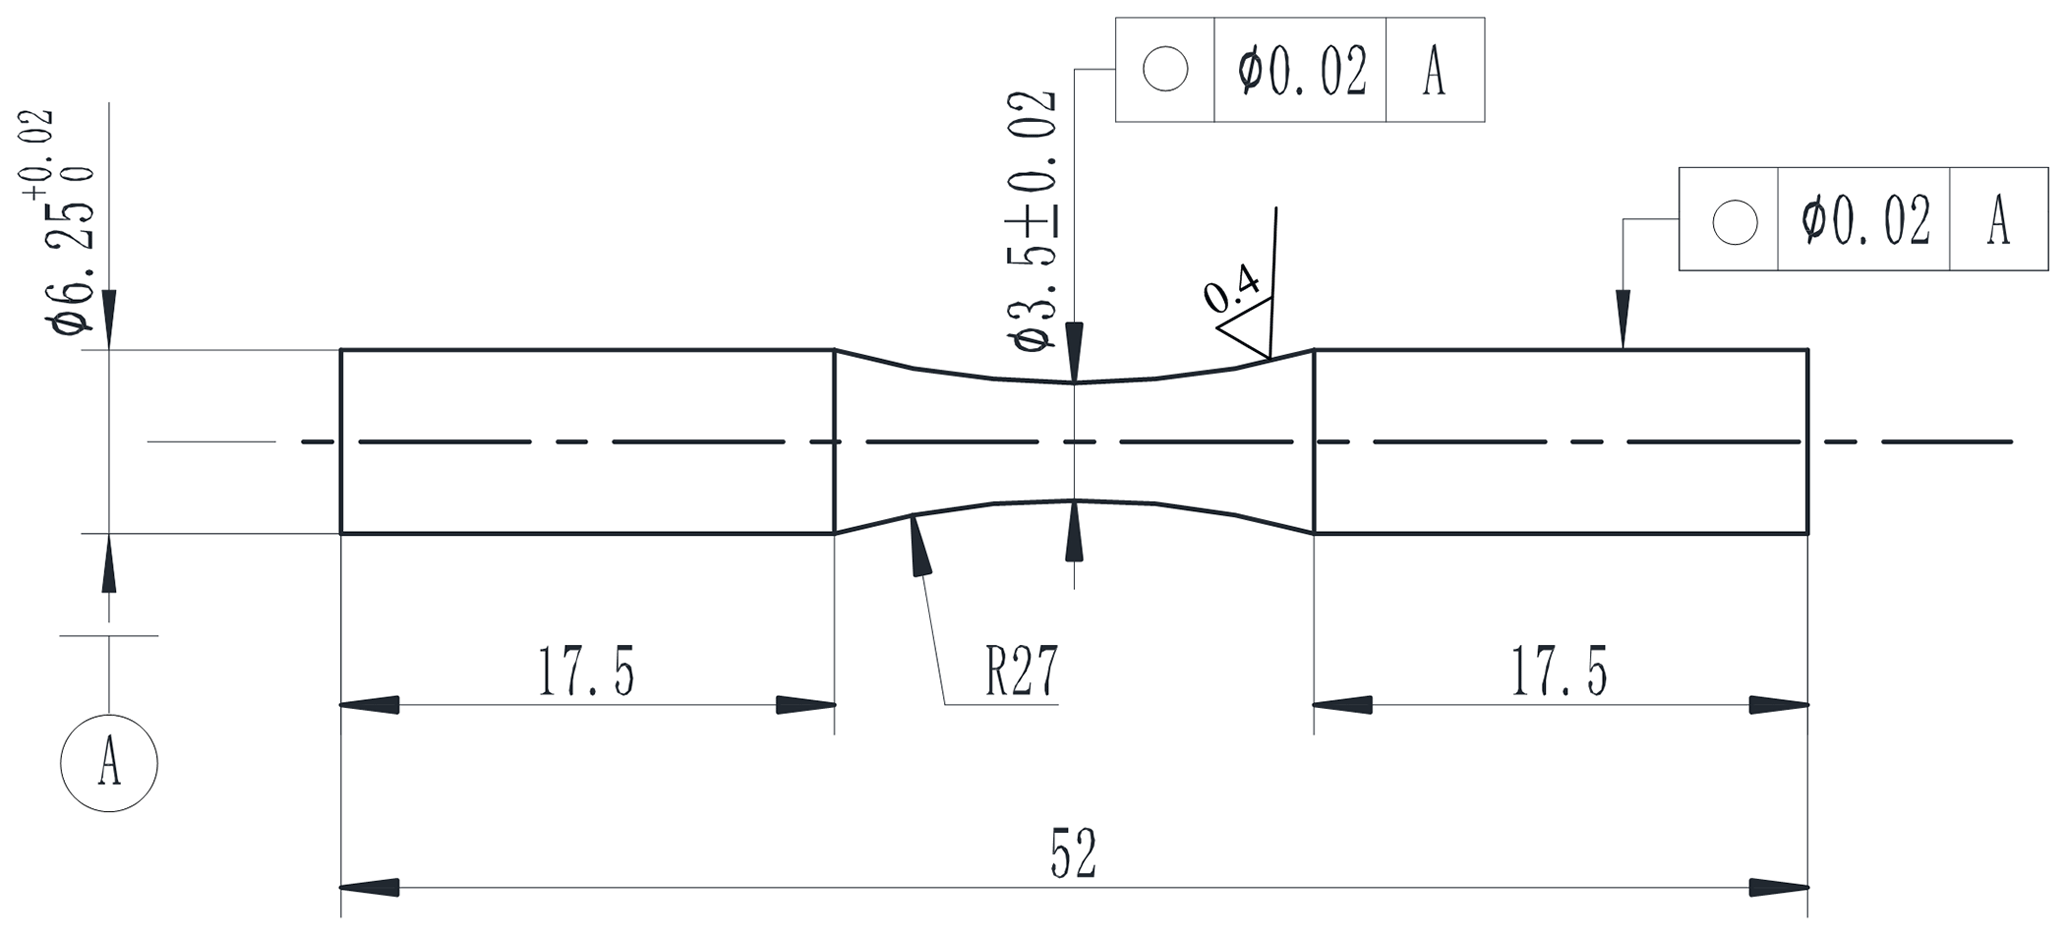
The material investigated in this work is the 0.44 % carbon steel and its composition is presented in Table 1. The raw material is a hot rolled steel bar of which the diameter is 14 mm. It is difficult that the hardening depth obtained by quenching is up to 7 mm for the steel bar. So, the hot rolled steel bars were firstly rough machined to the shape being similar to the final specimen. The diameters of the clamping part and the dangerous section are 8.5 and 6.0 mm respectively. Then, they were austenized at 850 ∘C for 20 min and quenched into water, brine, oil 1 or oil 2. In the brine, the mass ratio of the food grade salt to the tap water is 20 %. Oil 1 and Oil 2 are the naphthenic mineral oil with several types of additives for accelerating cooling, preventing oxidation, preventing rust and so on. The flash points and the kinematic viscosities of Oil 1 and Oil 2 are 205 and 208 ∘C, 29.8 and 31.06 mm2 s−1 respectively. Subsequently, the specimens were tempered at 200, 400, and 600 ∘C for 60 min respectively. Next, they were machined into the funnel specimen. The geometry of the specimen is shown in Fig. 1. The central part of the specimen was polished to the average surface roughness (Ra) 0.4 µm.
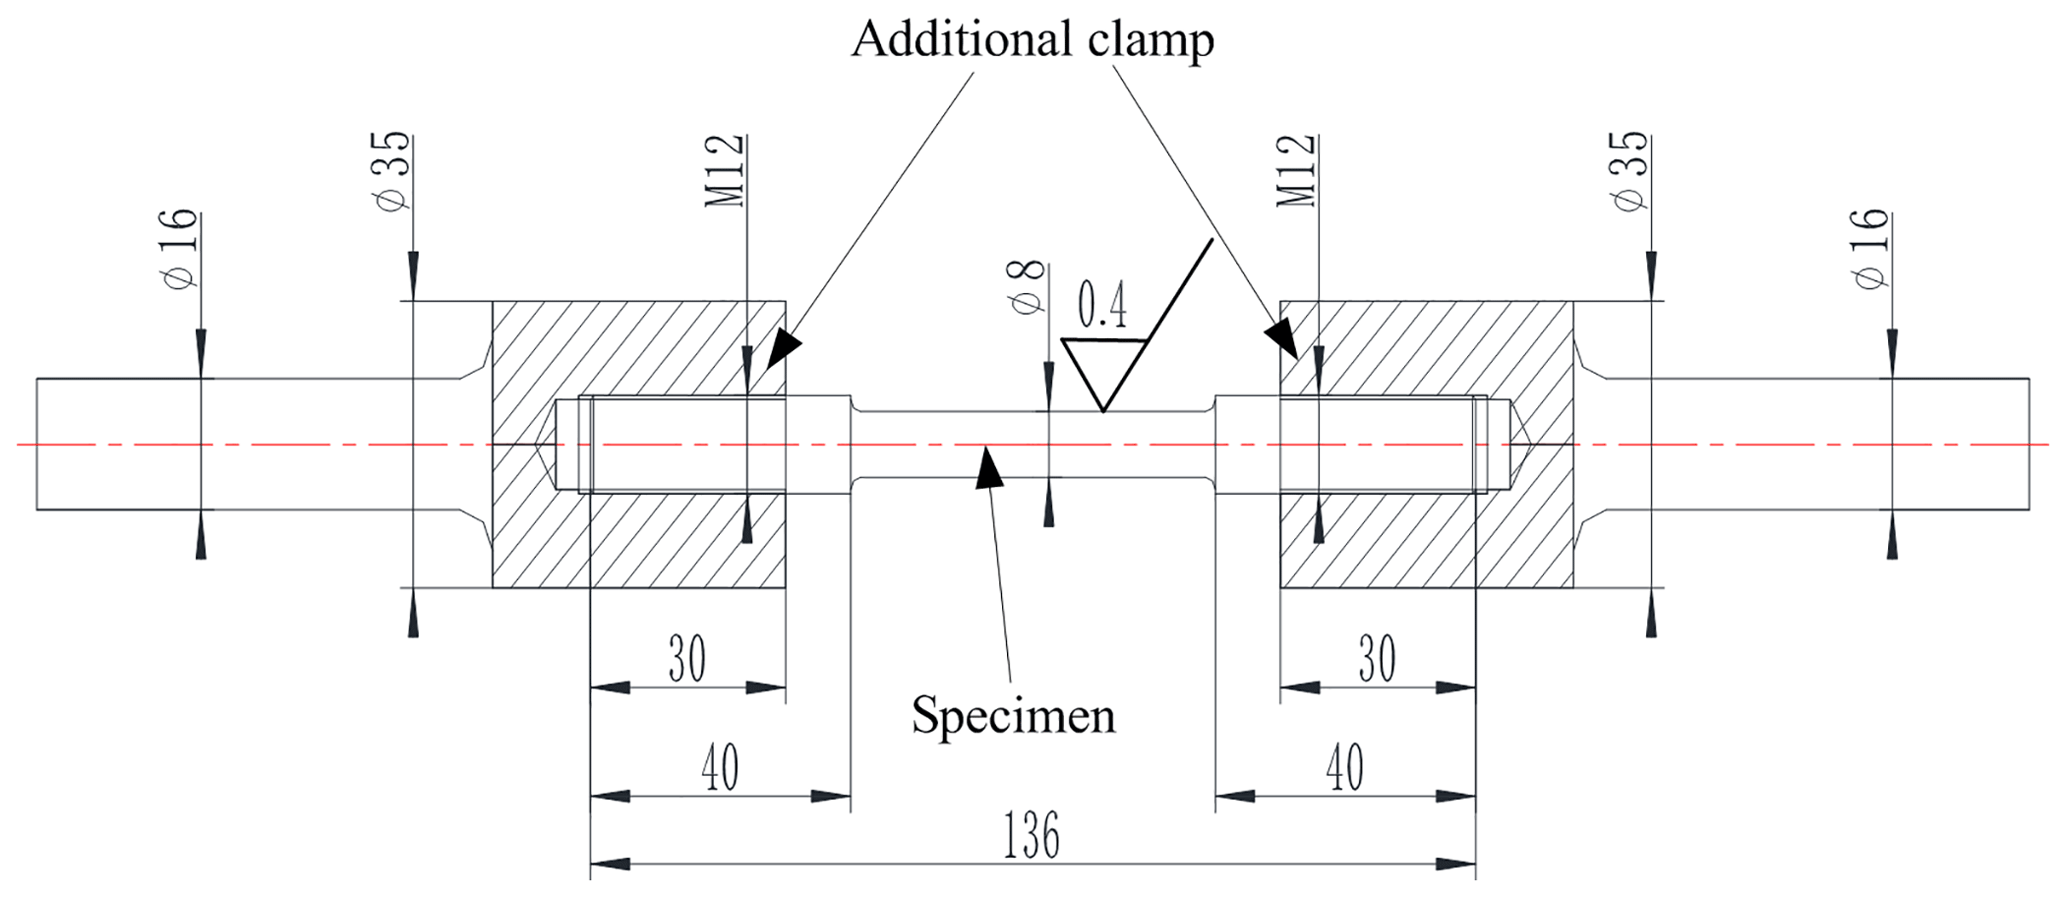
The static tensile tests for the specimens with the different quenching media, tempering temperature were firstly carried out. They were completed by the hydraulic servo tension and compression testing machine. In order not to destroy the clamping blocks of the test machine, due to the high hardness of the specimens after the quenching and tempering treatment, the additional clamp was designed and shown in Fig. 2. The material of additional clamp has the high tensile strength and the low hardness. The specimen was connected to the additional clamp by the thread which could be seen in Fig. 2. The means of the tensile strength σb, yield strength σs, and elongation at break δ5 were listed in Table 2. There were 3 samples for each static tensile test. According to Table 2, it was observed that (1) almost all of means of tensile strength decreased and the elongation at break increased with the increase of tempering temperature from 200 to 600 ∘C for each kind of quenching media, (2) the order of the quenching medium are brine, water, oil 1 and oil 2 in accordance with the rule of the tensile strength from large to small, (3) the brine has the maximal decline rate of tensile strength and oil 2 has the smallest one with the increase of tempering temperature from 200 to 600 ∘C, (4) oil 2 has the lowest sensitivity of σb, σs, and δ5 with respect to the tempering temperature, and then oil 1, water, and finally brine. This is the reason that martensite has high strength and low toughness, the order of the quenching media are brine, water, oil 1 and oil 2 by the rule of the cooling capacity from high to low, and the hardening depth obtained by quenching increased with the increase of the cooling capacity of a quenching media (Thelning, 1984; Ye et al., 2011).
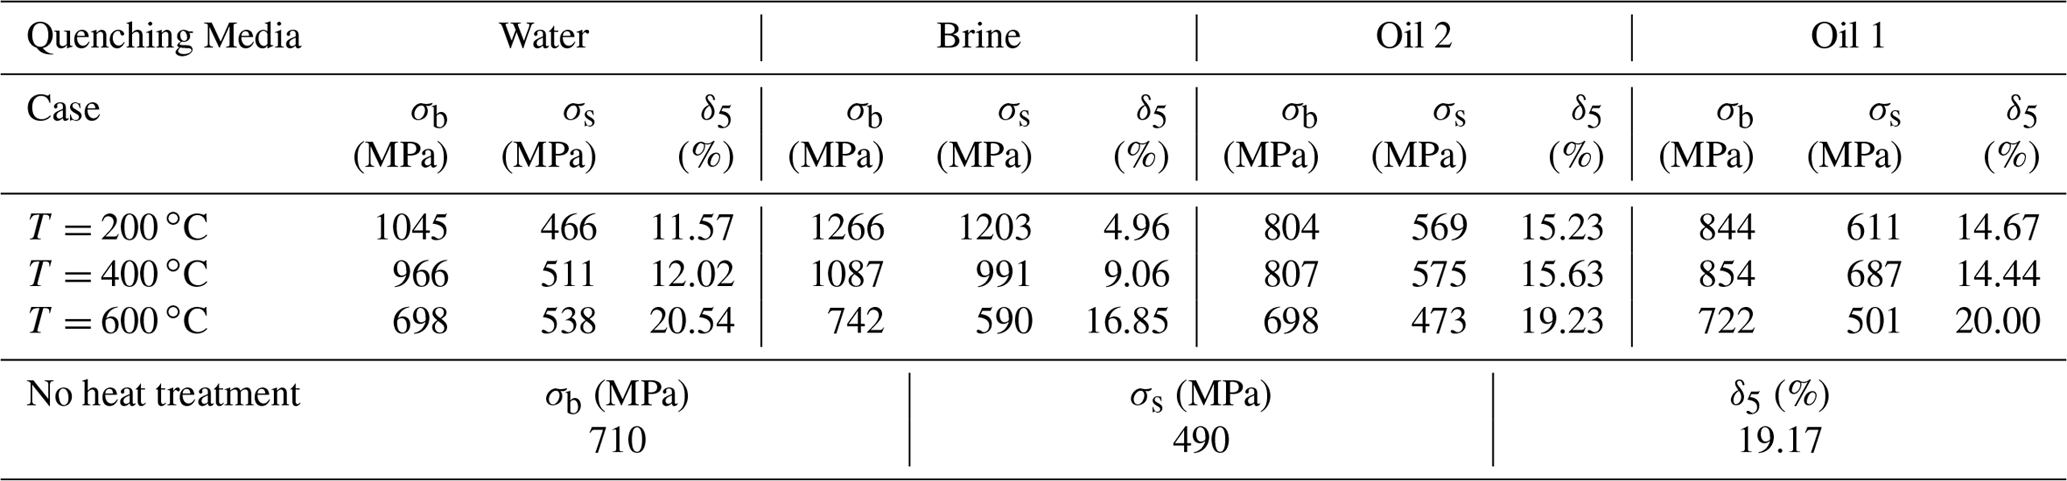

Figure 3Scatter plot of the fatigue tests with tempering temperature (a) 200 ∘C, (b) 400 ∘C and (c) 600 ∘C.
The effect of the quenching media and tempering temperature on the fatigue life of 0.44 % carbon steel were discussed by high and low cycle rotating bending fatigue tests. And they could be compared as much as possible under the same cyclic stress amplitudes. Therefore, at the tempering temperature 200 ∘C, the cycle stress amplitudes included 750, 650, 550, 500, and 450 MPa for Oil 1 and Oil 2, included 750, 700, 680, 660, and 650 MPa for water, and 1000, 950, 900, 850, and 800 MPa for brine. At the tempering temperature 400 ∘C, the cycle stress amplitudes for water, oil 1 and oil 2 were composed of 700, 650, 550, 500, and 450 MPa, and for brine, 850, 750, 650, 550, and 500 MPa. At the tempering temperature 600 ∘C, the cycle stress amplitudes for brine, oil 1 and oil 2 were 600, 550, 500, 450, and 400 MPa, and for water, 550, 500, 450, 430, and 400 MPa. The cycle frequency was 50 Hz. Five tests were carried out at each cycle stress amplitude. When the crack of the specimen grows to the length which resulted in the test machine to not rotate properly due to excessive bending deformation or the specimen failed due to fracture, the corresponding cycle number is defined as the fatigue life of the specimen in this work. If the cycle number exceeds than 106 and does not reach the corresponding fatigue life, the fatigue test will be stopped.
3.1 Fatigue Test Results and Statistic Analysis
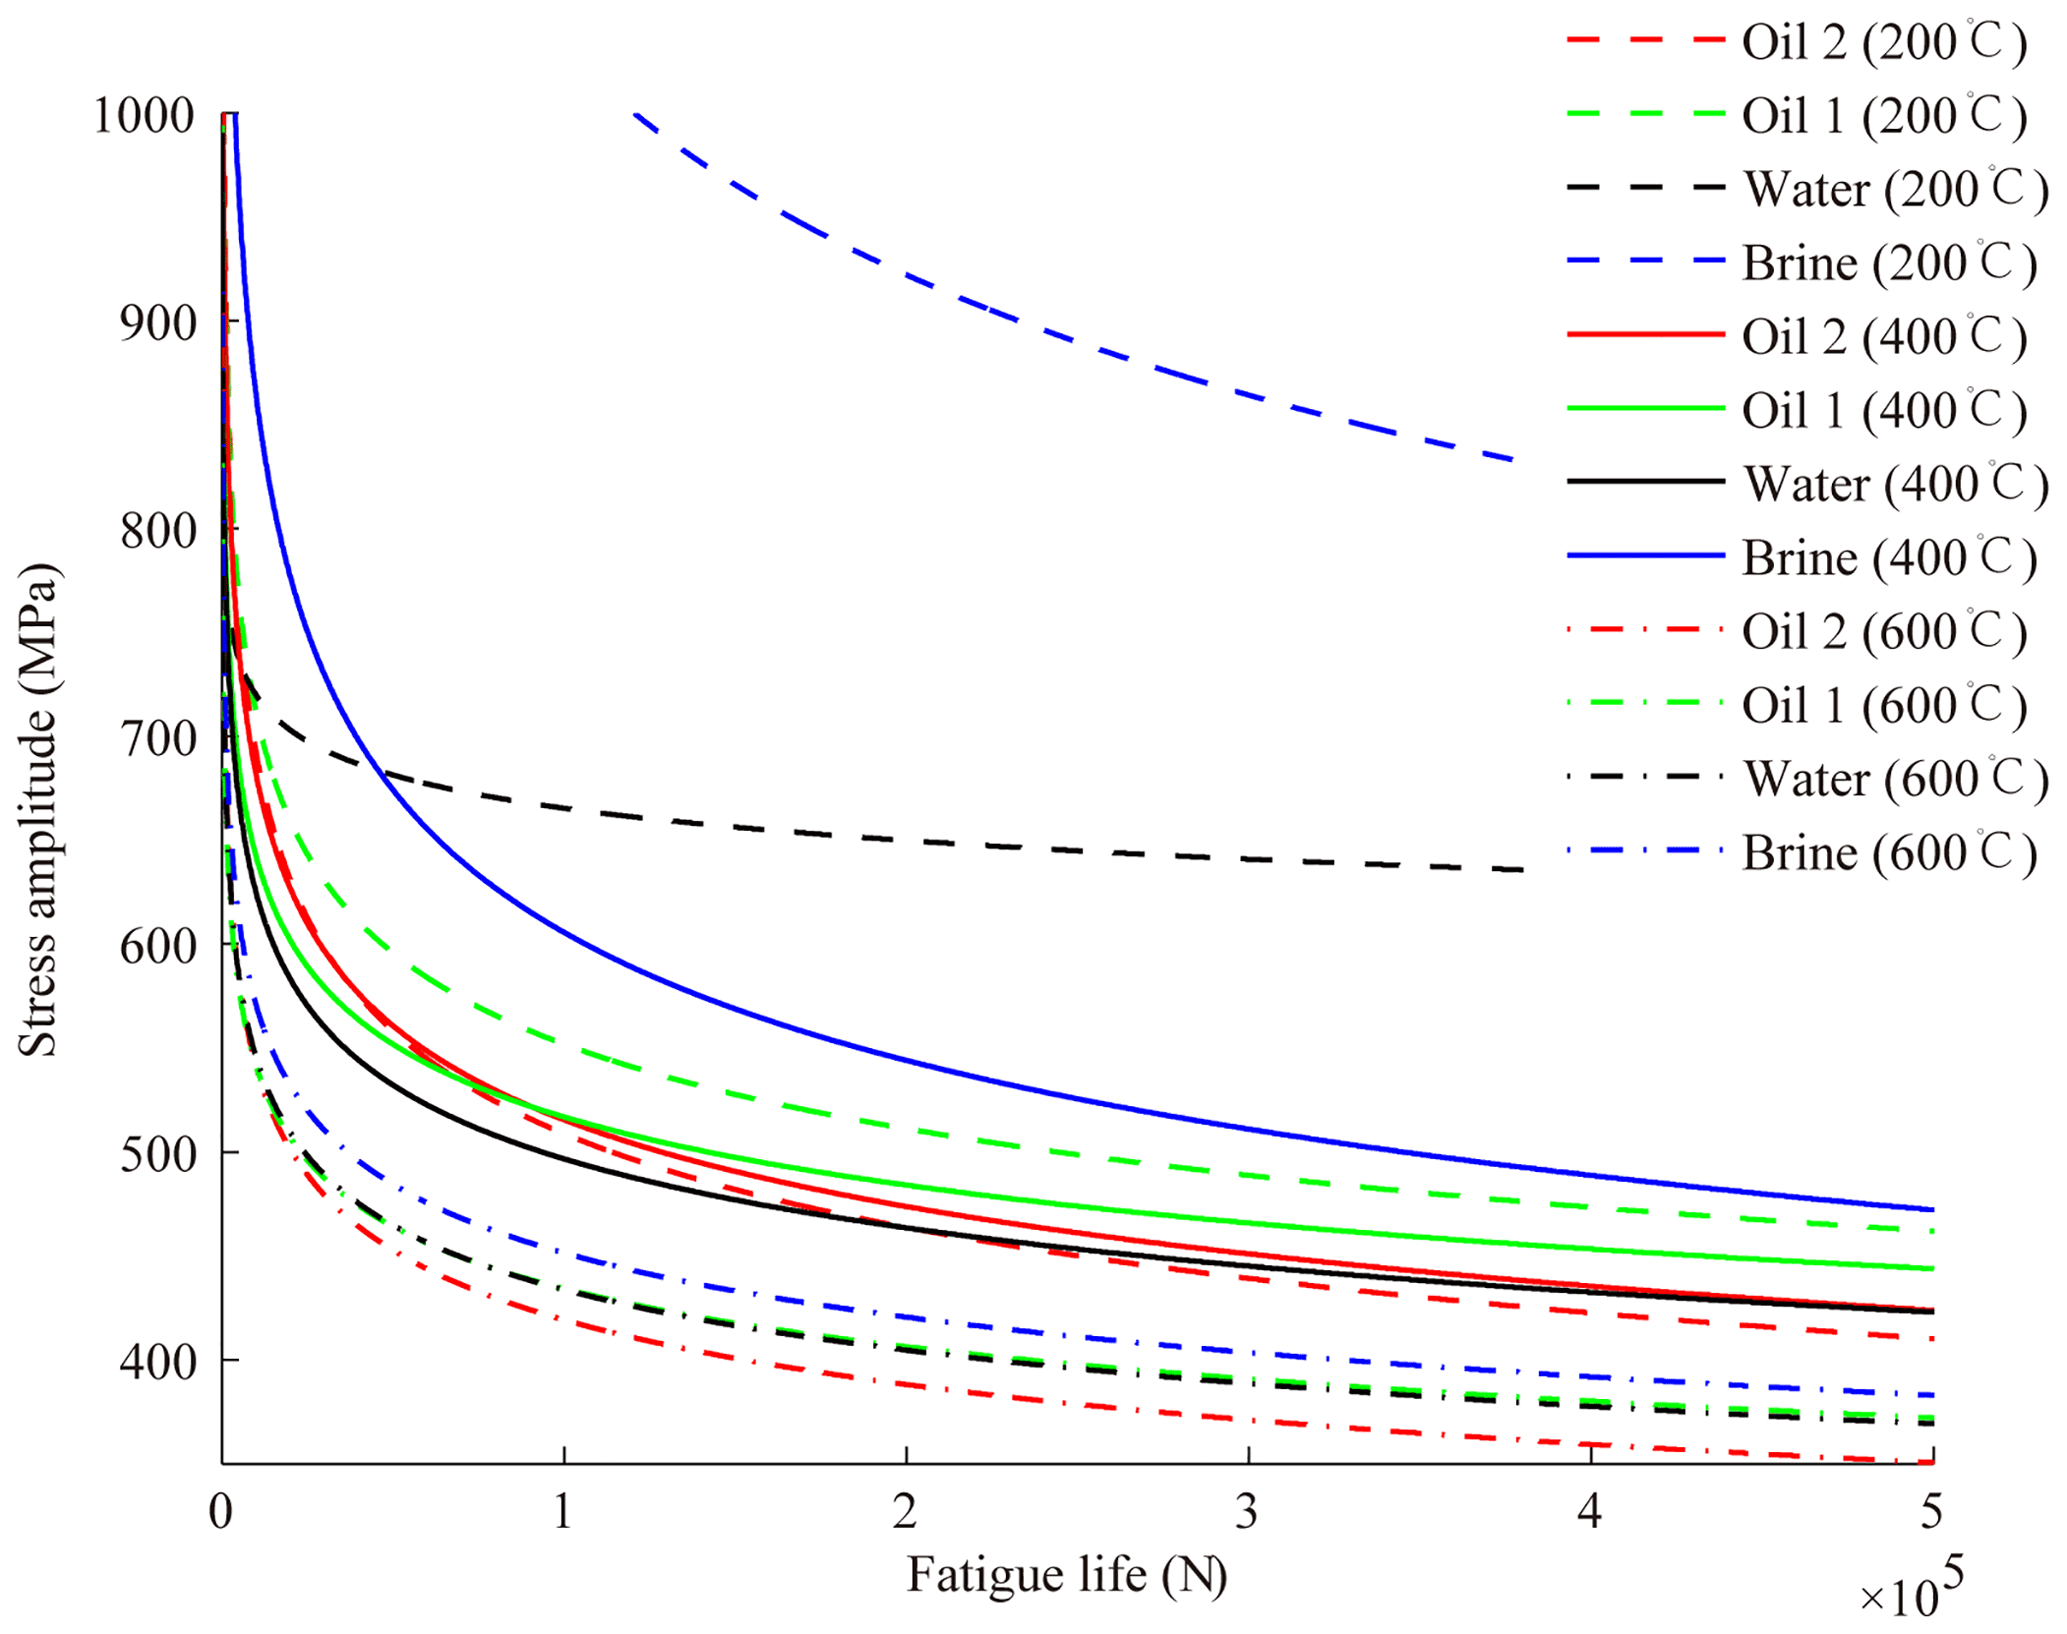
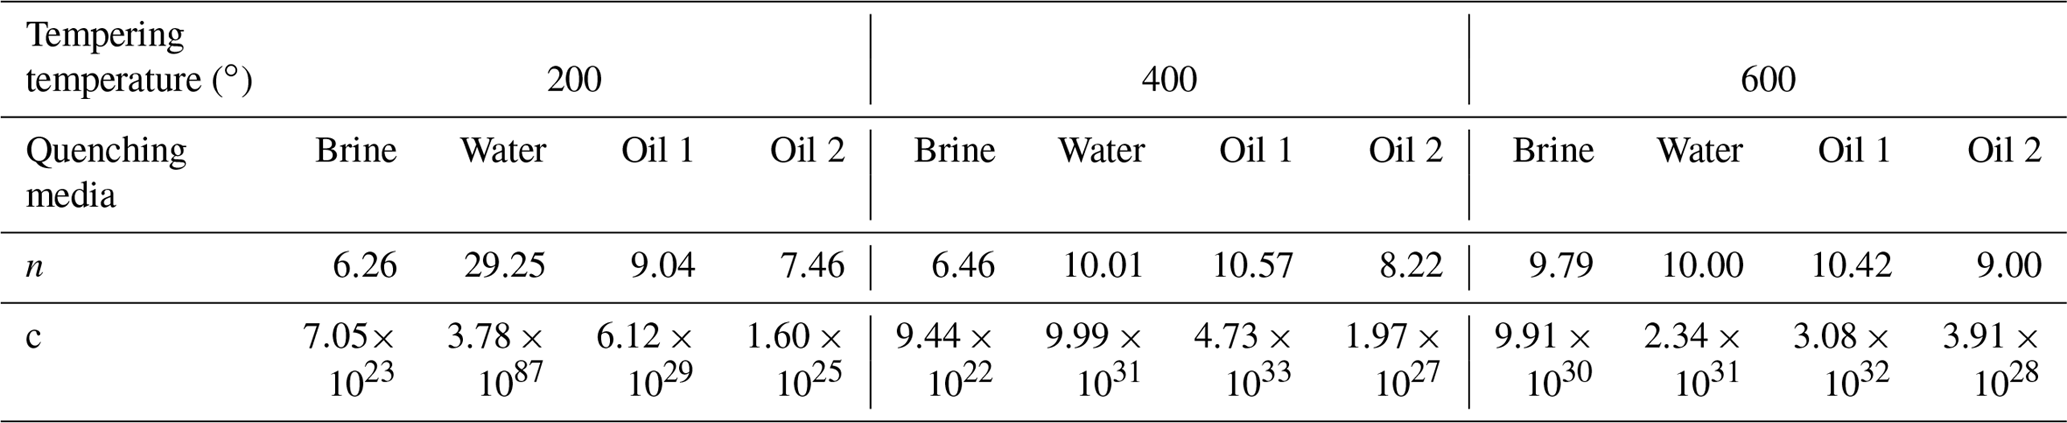
The scatter plots of the fatigue test results with the tempering temperature 200, 400 and 600 ∘C are shown in Fig. 3. Here, the data point with the arrow is not the fatigue life, but is the cycle number at which the corresponding fatigue test was stopped. The S–N curves are shown in Fig. 4. The S–N curve was processed as fellows: (1) cycle stress amplitudes and means of the fatigue life were taken the logarithm with respect to base 10, (2) the linear regression model was employed to obtain the formulation between the base 10 logarithm of means of the fatigue life and cycle stress amplitudes,
N, c, n and S are fatigue life, two material constants and cycle stress amplitude respectively, and N and S can be described by
and then S–N curve can be plotted. The material constants c and n are listed in Table 3. Standard deviation of fatigue life is shown in Fig. 5. In processing S–N curve and calculating the standard deviation of fatigue life, the data points with the arrow in Fig. 3 were uniformly set to 106.
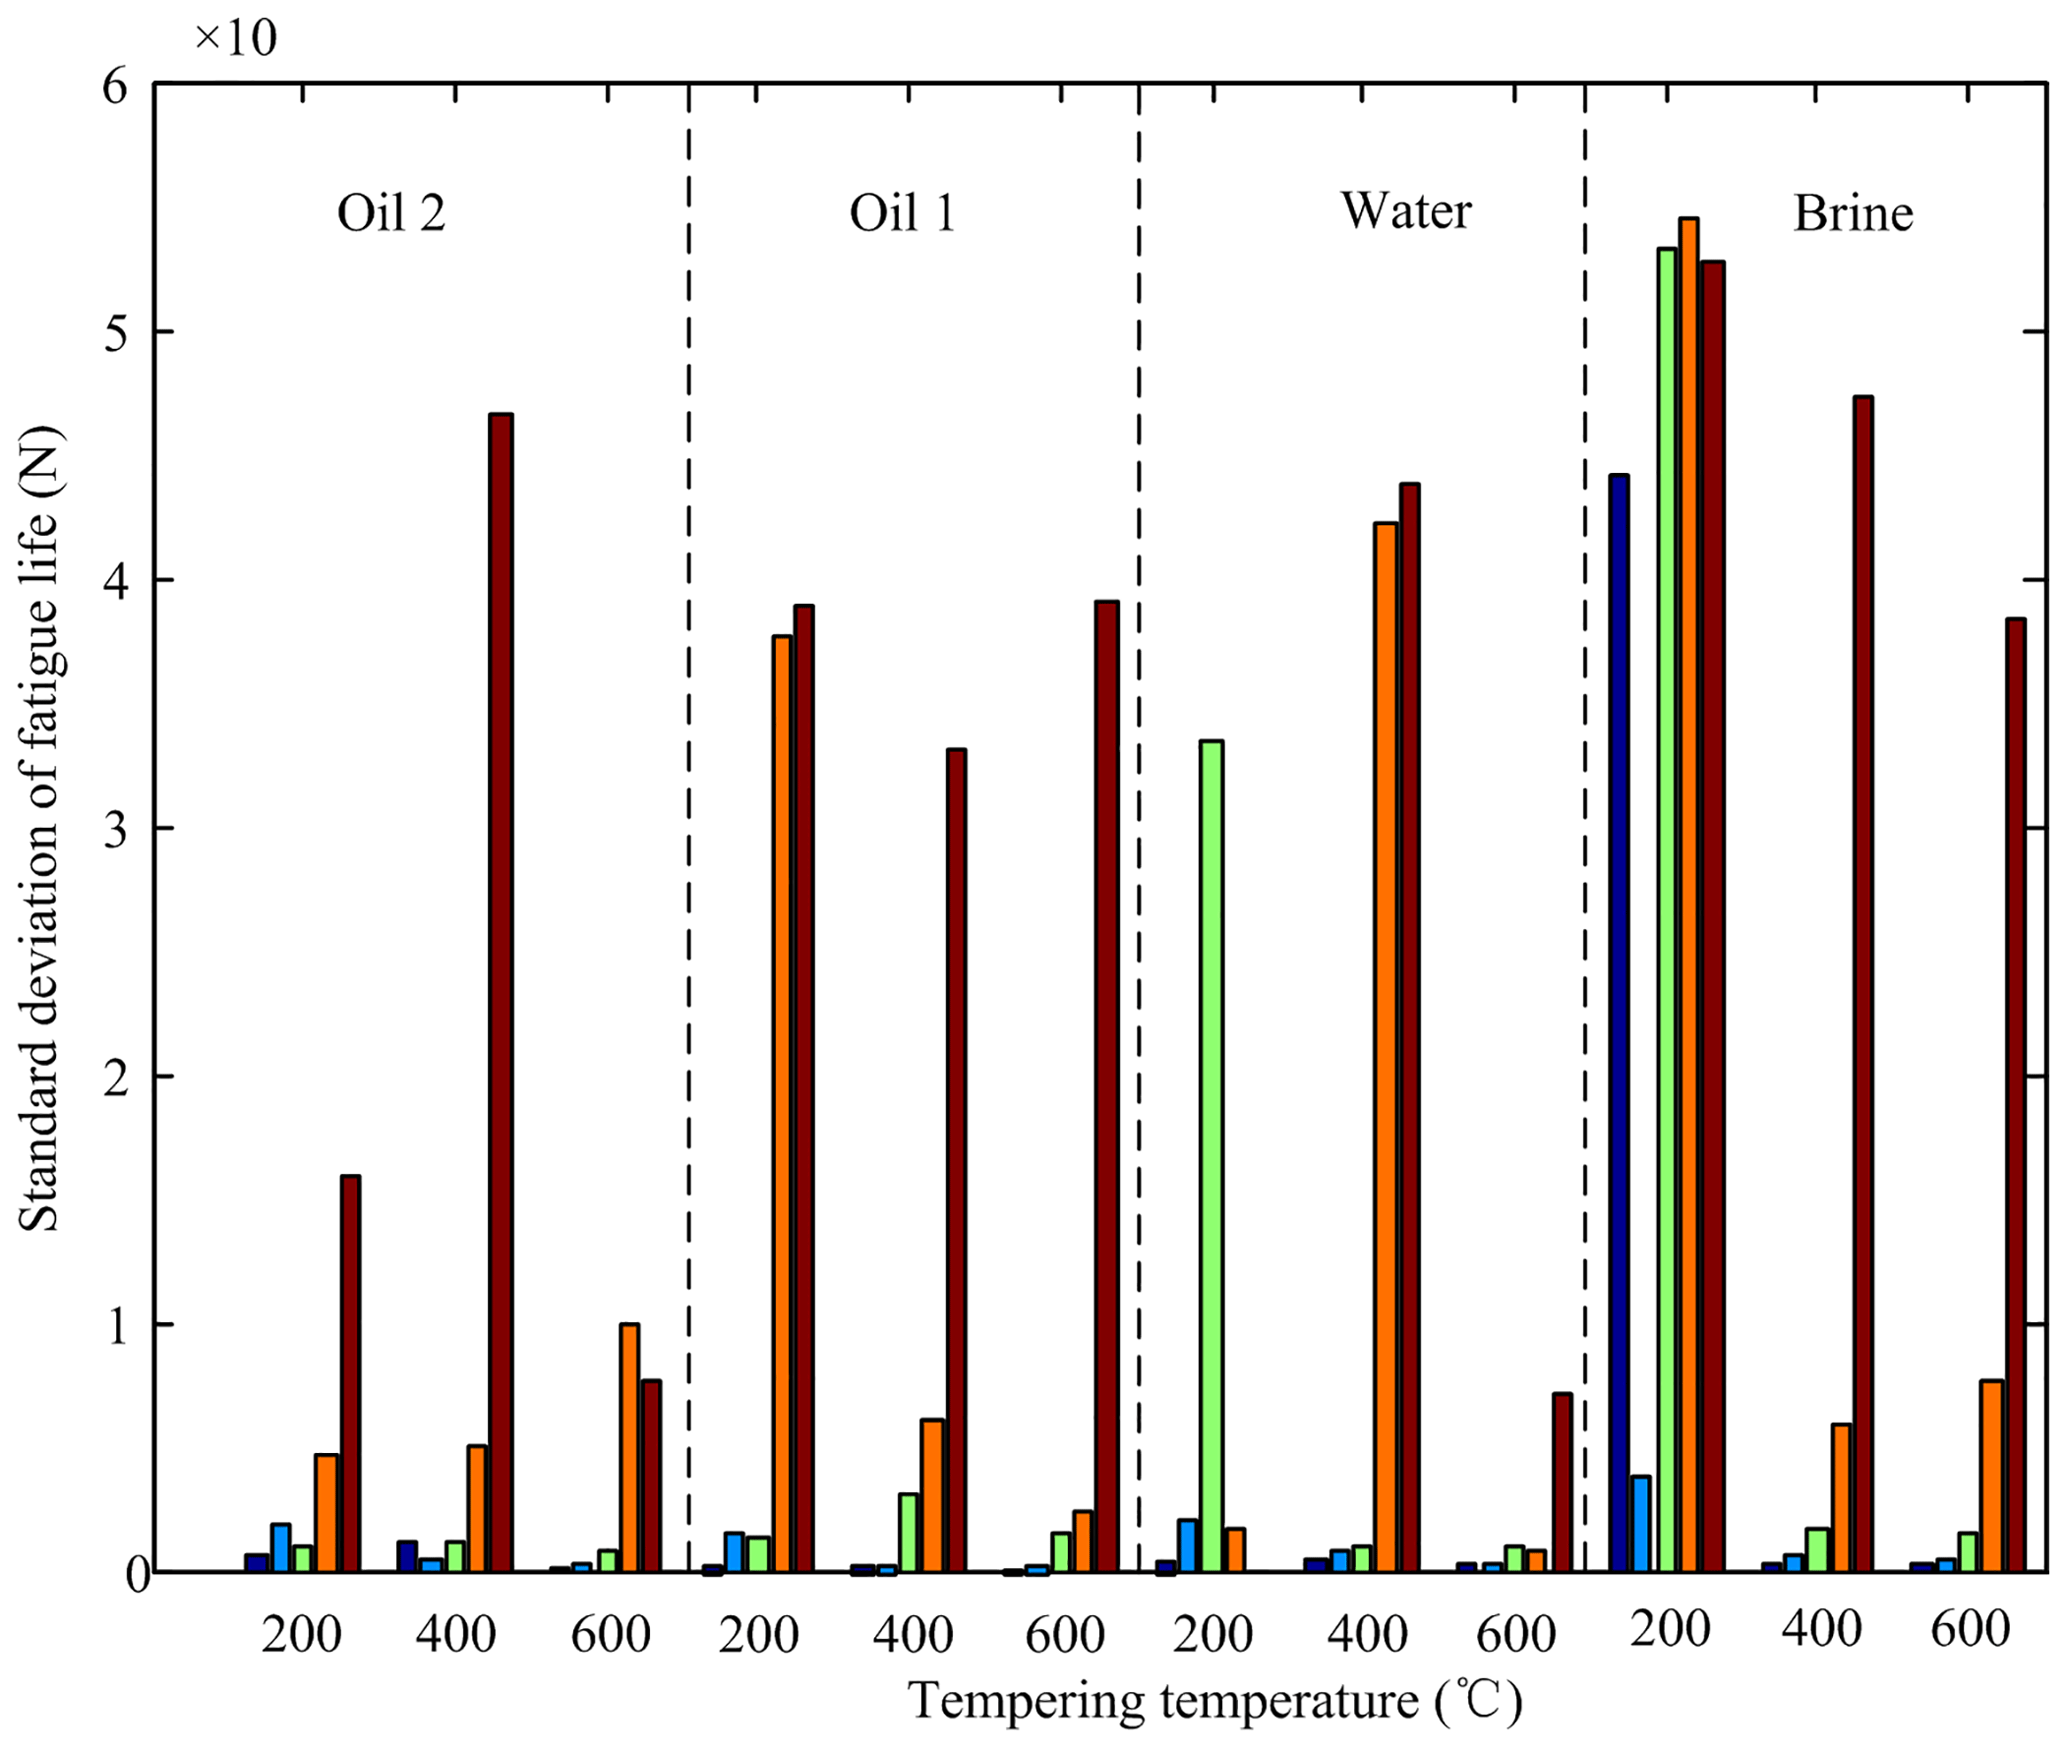
Set NBM, NWM, NO1M and NO2M for the mean fatigue life of the specimens with the quenching media being brine, water, oil 1 and oil 2 repectively. According to Figs. 3, 4 and 5, it can be observed that (1) at the tempering temperature 200 ∘C, NBM is far more than NWM, NWM is more than NO1M, and NO1M is more than NO2M, (2) at 400 ∘C, NBM is also more than NWM, NO1M and NO2M and there is no significant difference among NWM, NO1M and NO2M, (3) at 600 ∘C, NBM is still more than NWM which is almost equal to NO1M and NWM, and NO1M are slightly larger than NO2M, (4) with the tempering temperature increase from 200 to 600 ∘C, the difference of the mean fatigue life between one quenching media and other is less and less, (5) the mean fatigue life with oil 2 is the least affected by the tempering temperature, followed by that with oil 1, then that with water, and finally that with brine, (6) the dispersion of the fatigue life almost increase with a decrease of the applied cycle stress amplitude for the same tempering temperature and quenching media (Li et al., 2017a, b), but it cannot be followed by the fatigue life data of the specimens with tempering temperature 200 ∘C and the quenching media of brine, and (7) there are some data points with the arrow only when the cycle stress amplitude is low for oil 1, oil 2 and water, while no matter when the cyclic stress is high or low under the condition of the quenching media of brine and the tempering temperature 200 ∘C.
3.2 Fractography and Discussions
The fractures of some samples in the fatigue tests were observed by scanning electron microscope. The test parameters and fatigue life of those samples were listed and the corresponding mean, standard deviation and coefficient of variation were given in Table 4. Figure 6 showed the scanning electron micrograph (SEM) of the whole fracture surface (WFS) and local fracture surface (LFS) of those specimens listed in Table 4. The SEMs of LFS of the specimen 9, 11 and 12 were not shown in Fig. 6 because they were similar with that of these specimens except specimen 1, 2 and 5. The black spots were oxides, because the fractures were not protected well. It was observed that the fracture surfaces of the specimens 1, 2 and 5 were very flat and did not have the obvious fatigue source area and fatigue striation. According to the local high power micrographs of their fracture surfaces, many facets and steps could be observed. The features implied that the brittle fracture and transgranular fracture have occurred and there was no obvious crack growth process in the sample 1, 2 and 5. However, for the other specimens, the fracture surfaces had more than one obvious fatigue source areas and a lot of the fatigue striations and the fracture dimples. The nucleation and propagation process of cracks were very obvious, and the final unstable extension fracture surface has the obvious fracture dimple.
Table 4Test parameters and fatigue life of the samples of which the fracture were observed.

For an existing defect with the length of 2a in the brittle solid, the theoretical tensile strength is (Cheng and Ohr, 1981)
γ and E are the surface energy of unit defect area and Young's modulus respectively. The local cleavage fracture stress is (Curry and Knott, 1978; Chen and Cao, 2015)
γp, ν and f are the effective surface energy of the ferrite matrix, Poisson ratio and the half-length of the just initiated crack nucleus in a second-phase particle or in a grain with critical size respectively. When the applied normal stress is more than the local cleavage fracture stress σf, the grain-sized crack propagates into the contiguous ferrite grains and it results in the cleavage fracture of the specimen finally (Chen and Cao, 2015). It could be seen that the local cleavage fracture stress is proportion to the theoretical tensile strength according to Eqs. (3) and (4). Therefore, it could be implied that the maximal normal stress which is applied to the specimen with the larger tensile strength σb is larger than that of the specimen with the lower tensile strength σb, when the specimen was fractured by cleavage.
According to the dislocation model for fatigue crack initiation (Tanaka and Mura, 1981), when the applied cycle shear stress amplitude is Δτ and the cycle number is n, the tensile stress is
where l, k and h are the half length of the grain size, the frictional stress and the distance between two adjacent slip plane. When the tension and pressure cycle stress is applied to the specimen, the slip plane is inclined at 45∘ to the applied stress. If σxx is increased to the local cleavage fracture stress σf, the crack will be nucleated and the corresponding cycle number is defined as the crack initiation life of the specimen. Therefore, the crack initiation life of the specimen with the larger tensile strength σb is larger than that of the specimen with the lower tensile strength σb.
According to Fig. 6, especially panels (a), (c) and (e), the fracture will soon occur, once a crack was nucleated. This implies that the crack initiation life accounts for most of the total fatigue life (includes crack initiation life and crack propagation life). So, due to the larger tensile strength σb of the specimens with the quenching media being brine and water and the tempering temperature 200∘, the fatigue life is far more than that of other specimens sometimes. However, Δτ is not only determined by the applied tension and pressure cycle stress, but also is be affected by the stress concentration due to the internal defects and the surface roughness of the specimens. Generally, the geometric parameters of the internal defects and the surface roughness have the strong randomness. It might leads to the very large Δτ in some specimen, and σxx is quickly increased to the local cleavage fracture stress σf when the applied cycle stress amplitude is identical. In this case, due to almost no crack growth process, there is very low fatigue life for the specimens with the quenching media being brine and water and the tempering temperature 200∘. While, the fatigue life of the specimens with the obvious nucleation and propagation process of cracks, such as the specimen 3, 4, 6, 7, 8, 9, 11 and 12 listed in Table 4, was less affected because the crack propagation life is not affected. This could also explain that there was larger coefficient of variation of the fatigue life under the heat treatment condition of the specimen 1, 2, and 5 listed in Table 5.
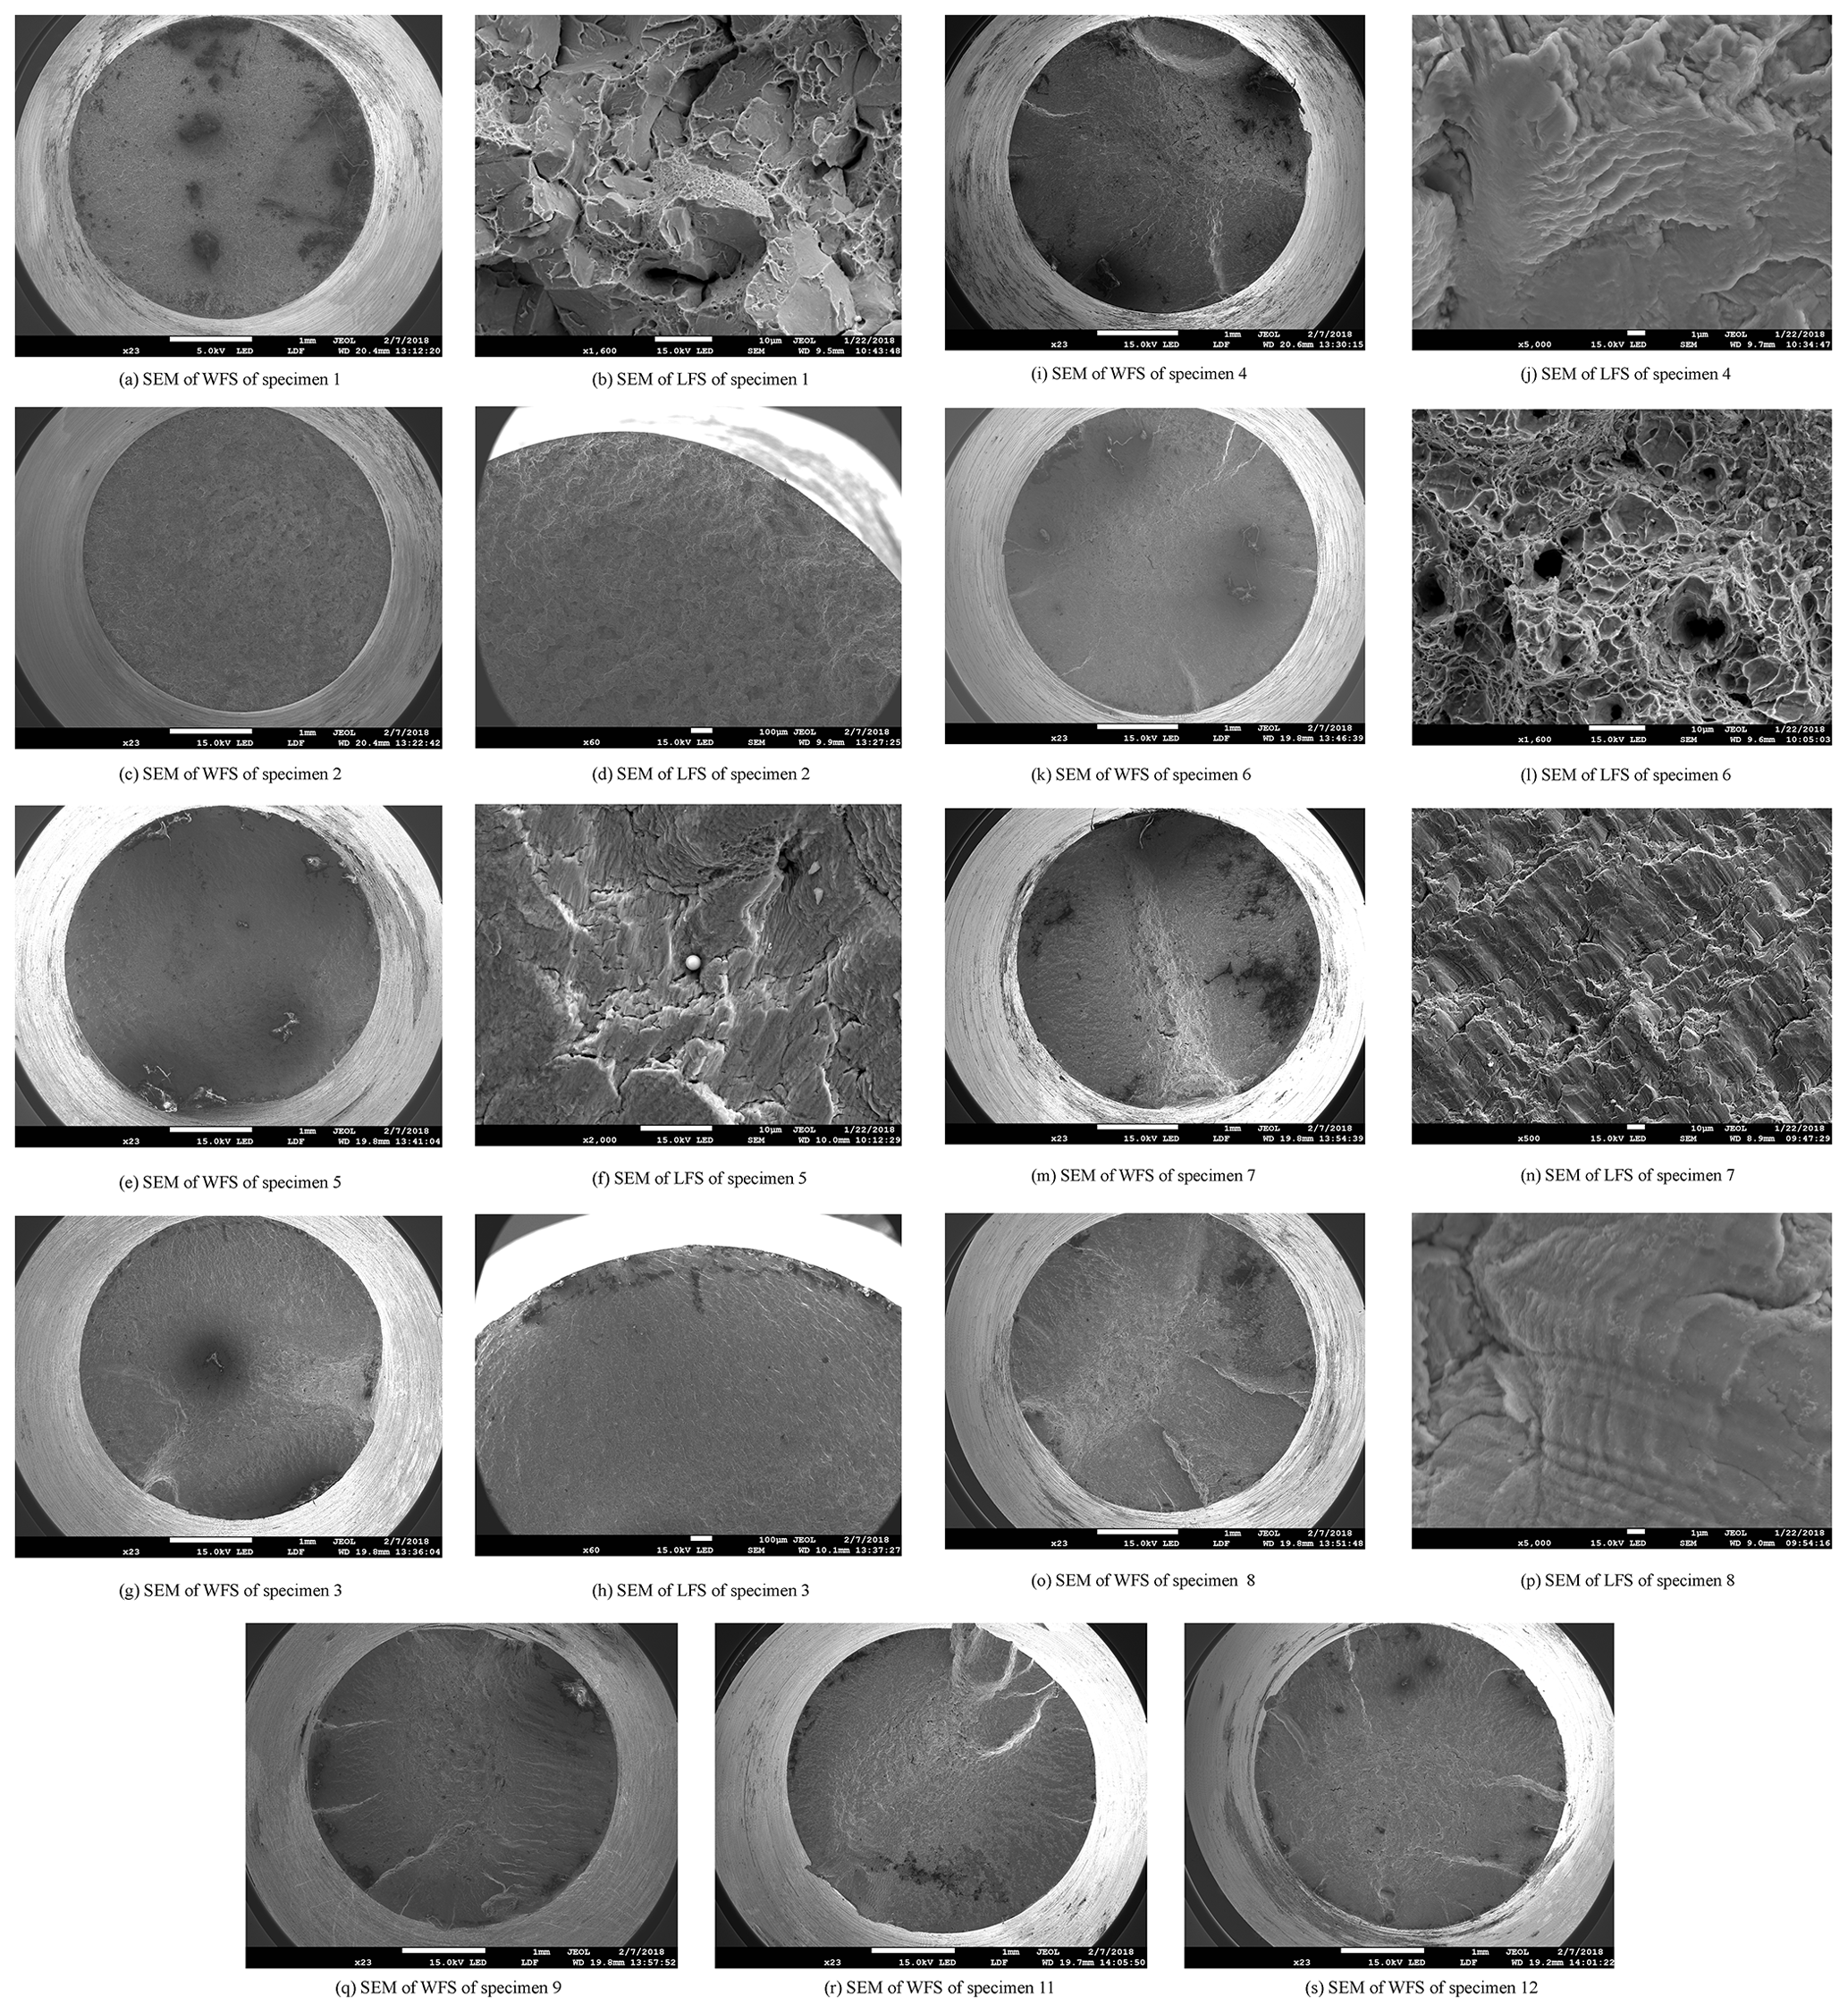
Figure 6Scanning electron micrographs of the whole and local fracture surface of those specimens listed in Table 4. (a) SEM of WFS of specimen 1, (b) SEM of LFS of specimen 1, (c) SEM of WFS of specimen 2, (d) SEM of LFS of specimen 2, (e) SEM of WFS of specimen 5, (f) SEM of LFS of specimen 5, (g) SEM of WFS of specimen 3, (h) SEM of LFS of specimen 3, (i) SEM of WFS of specimen 4, (j) SEM of LFS of specimen 4, (k) SEM of WFS of specimen 6, (l) SEM of LFS of specimen 6, (m) SEM of WFS of specimen 7, (n) SEM of LFS of specimen 7, (o) SEM of WFS of specimen 8, (p) SEM of LFS of specimen 8, (q) SEM of WFS of specimen 9, (r) SEM of WFS of specimen 11, (s) SEM of WFS of specimen 12.
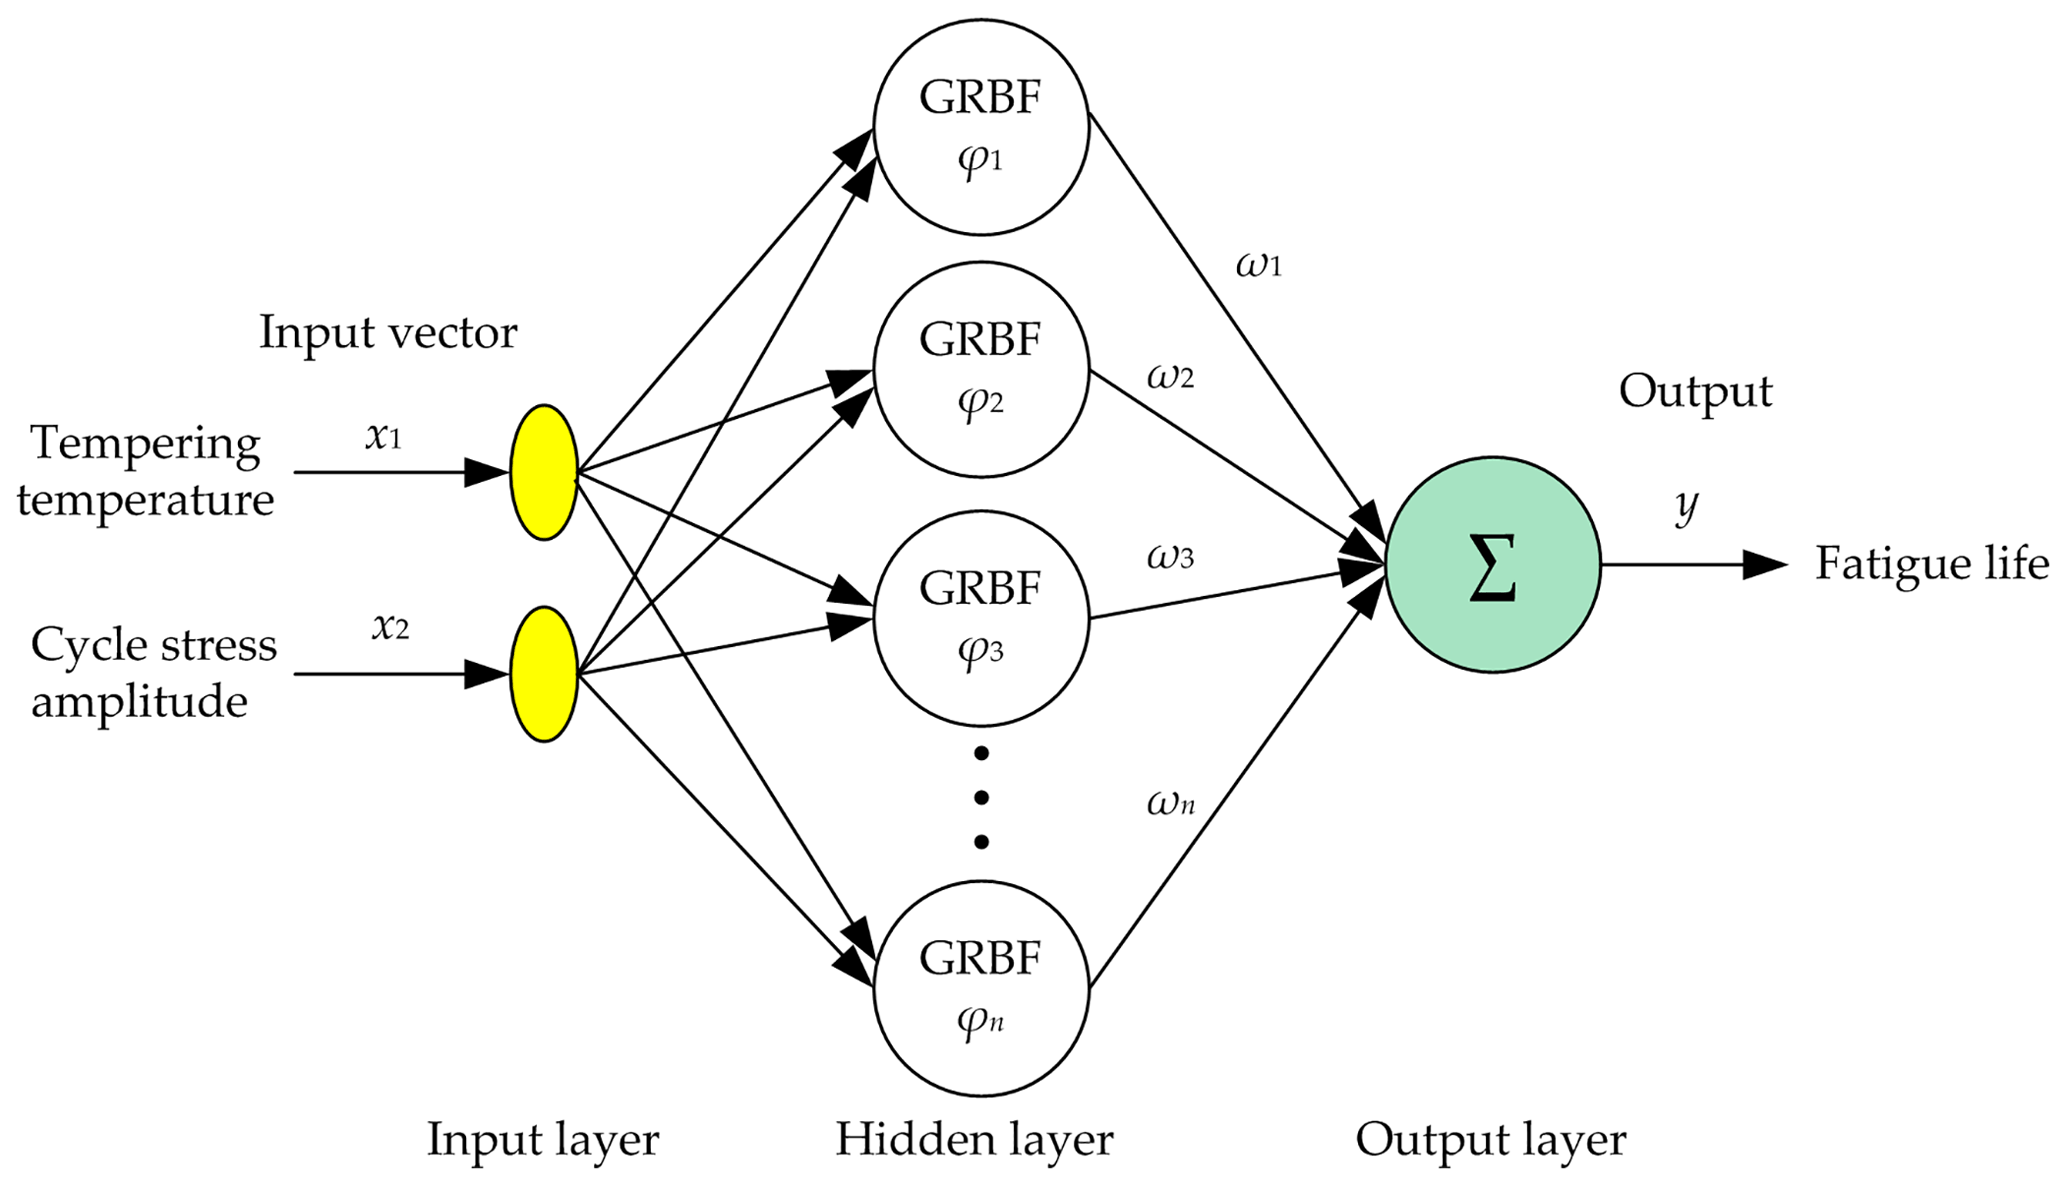
Figure 7Structure of the presented fatigue life estimation method based on RBF neural network.
For the quenched and tempered 0.44 % carbon steel, their mean fatigue life under the condition of any given cycle stress amplitude can be estimated by S–N curves which have been obtained in Sect. 3, when the tempering temperature is 200, 400 or 600 ∘C and the quenching media is oil 1, oil 2, water or brine. However, the mean fatigue life can not been estimated by S–N curves in Sect. 3 if the tempering temperature is not 200, 400 or 600 ∘C, for example 300 ∘C. If the mean fatigue life with the tempering temperature 300 ∘C must be estimated using S–N curves, a lot of additional fatigue tests must be carried out again. Therefore, the fatigue life estimation method will be presented and is based on RBF neural network. The RBF neural networks have shown to perform well in many problems of practical interests (Khan et al., 2018). It can approximate any continuous function with an arbitrary precision. Moreover, RBF neural network has only one hidden layer and the number of neurons in the hidden layer is automatically increased until the mean square error reaches the given accuracy or the number of neurons is up to the given value. Therefore, RBF neural network can avoid the arbitrariness in the number of hidden layers and the number of neurons per hidden layer (Mahanty and Gupta, 2004).
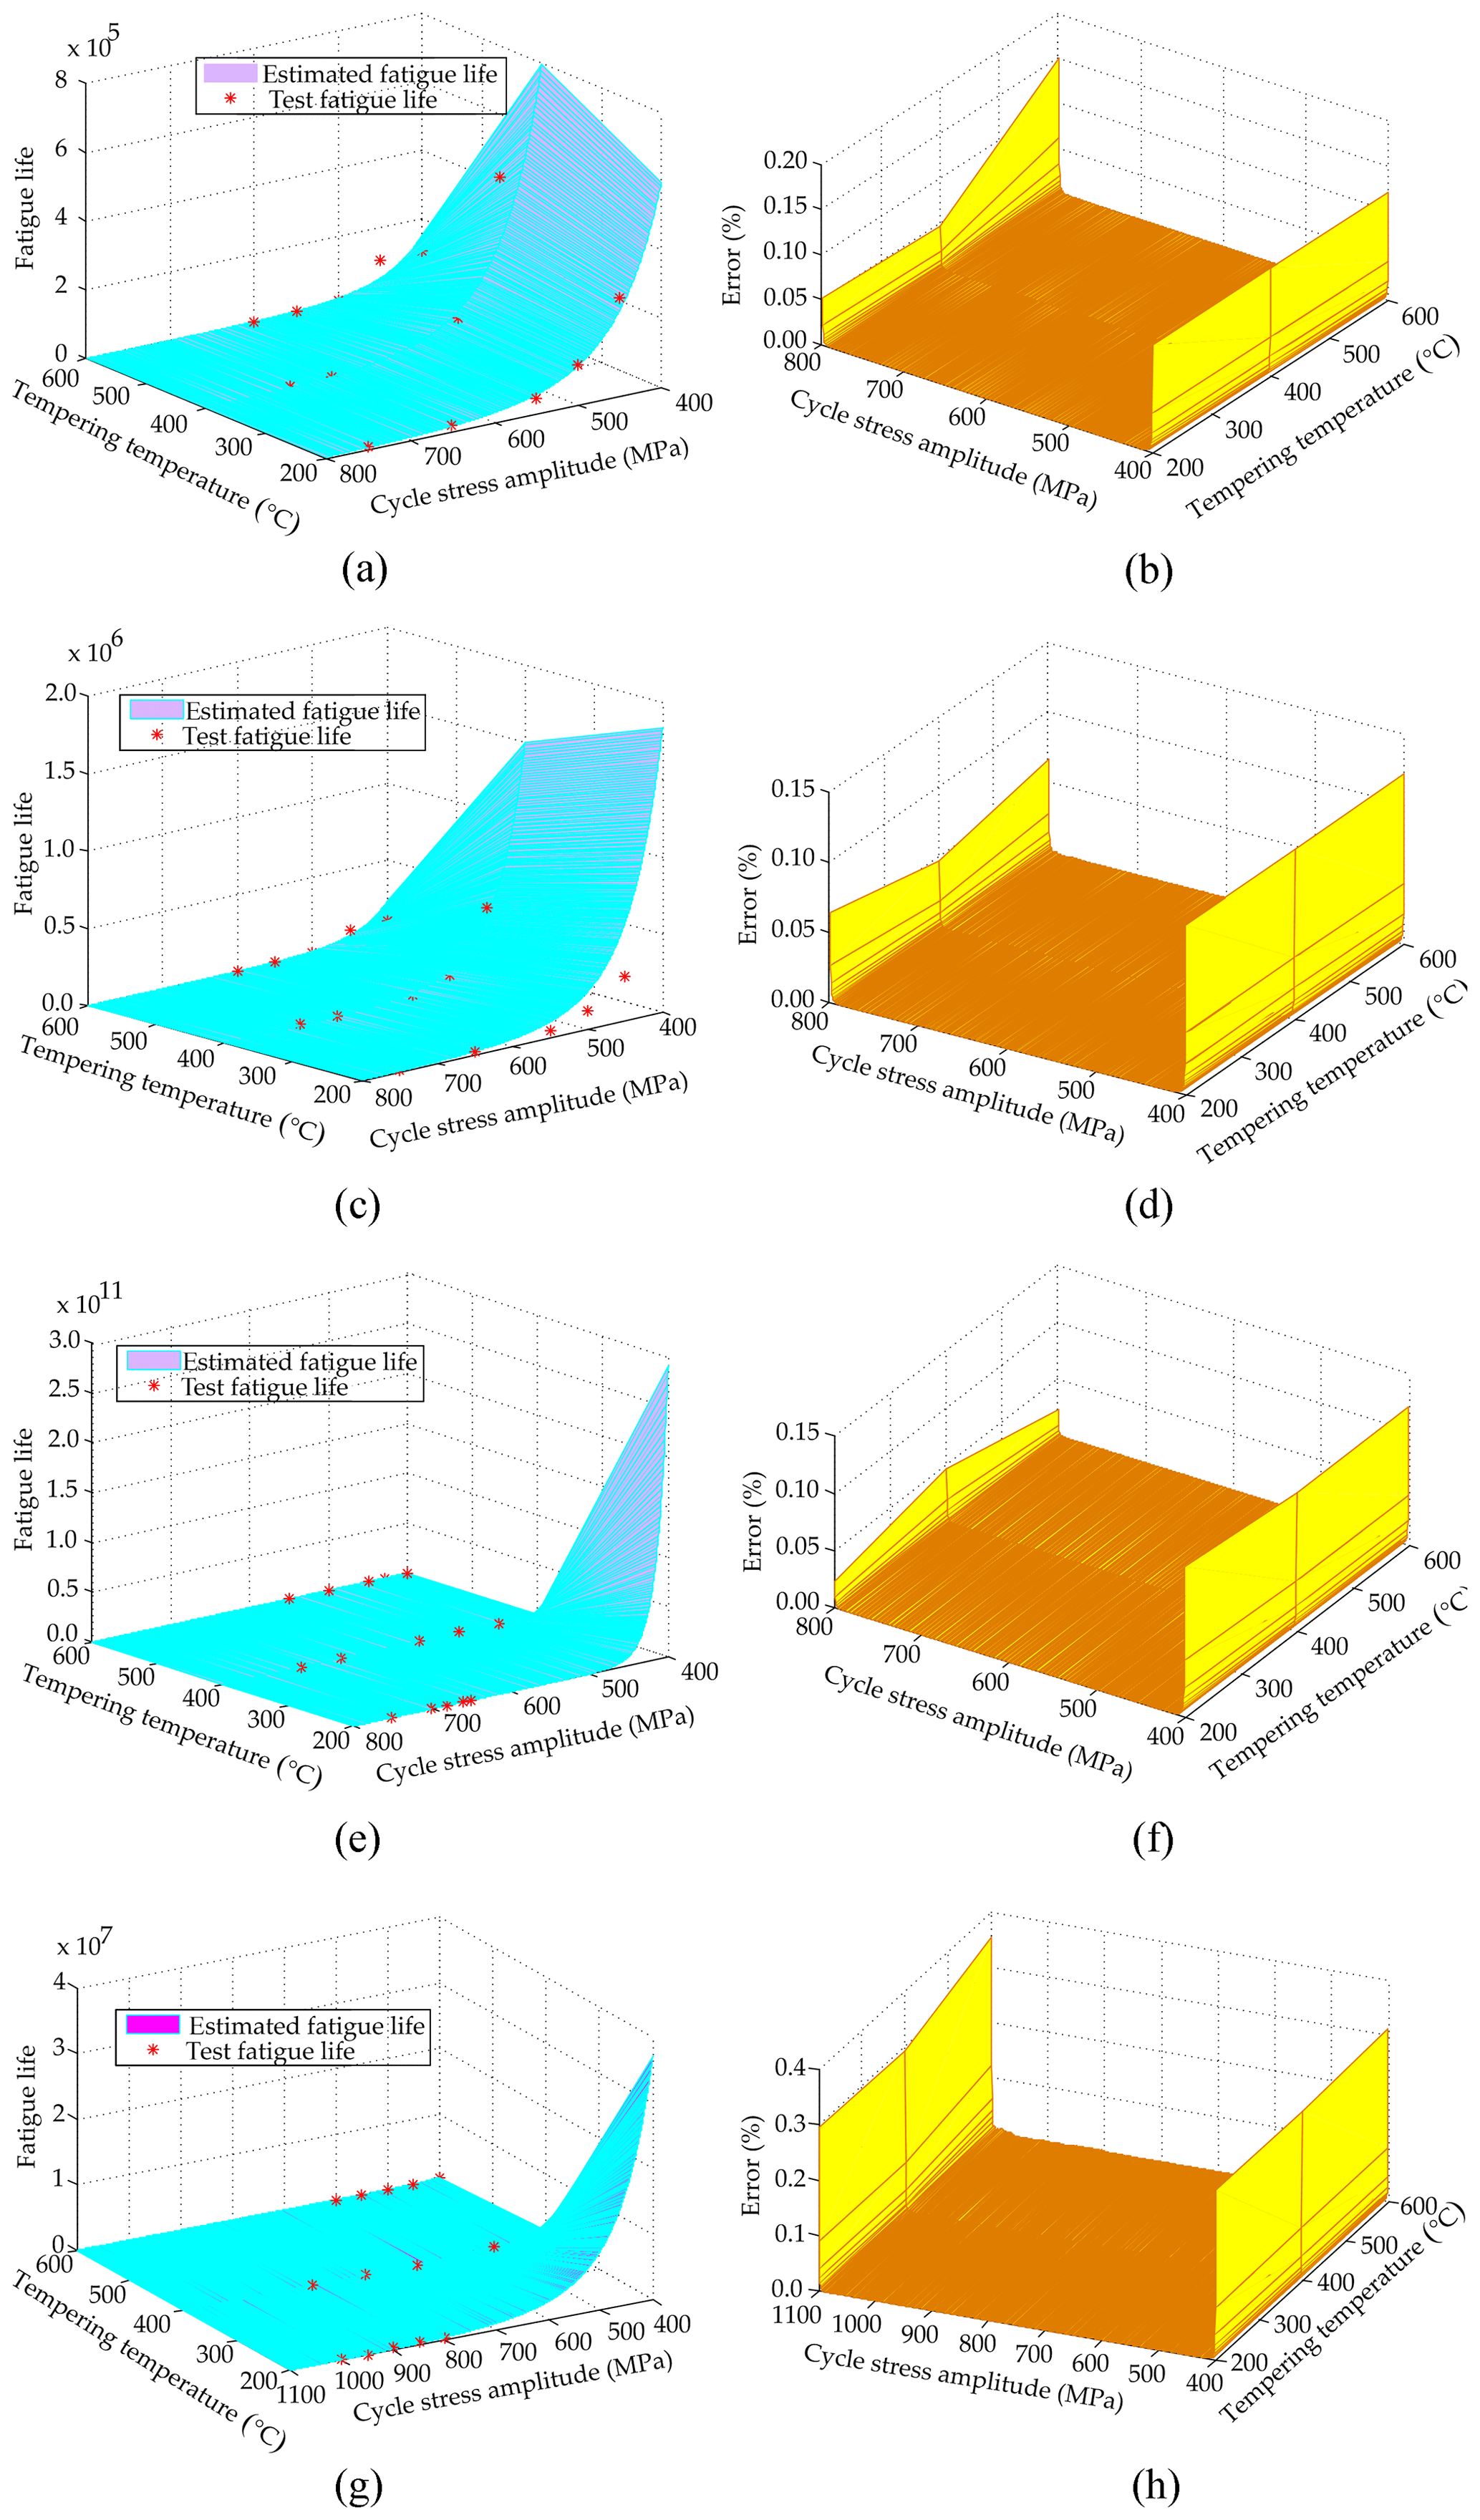
Figure 8Fatigue life estimated by the presented method based on RBF neural network and the error surface for the test set, (a) fatigue life and error surface, (b) for oil 2, (c) fatigue life and error surface, (d) for oil 1, (e) fatigue life and error surface, (f) for water, (g) fatigue life and error surface, (h) for brine.
Table 5Validation of the estimation method based on RBF neural network for mean fatigue life.

For the given quenching media, the structure of the presented fatigue life estimation method based on RBF neural network is shown in Fig. 7. It includes three layer, input layer, hidden layer and output layer. The input vector is composed of two elements, tempering temperature and cycle stress amplitude. In the hidden layer, there are n neurons. n is determined by the given accuracy or the set number of neurons and is calculated automatically by the algorithm of RBF neural network. The RBF of each neuron is the Gaussian function and can be expressed as
σi is the spread of GRBF (Gaussian RBF) ∅i, xj is the input parameter including the tempering temperature and cycle stress amplitude, ci is the centre for the ith hidden neuron, and denotes the Euclidian norm. ωi () is the weight connecting the hidden layer to the output (mean fatigue life) y. Then, the output y can be expressed as (Mahanty and Gupta, 2004; Yang et al., 2016)
For the quenching media is oil 1, oil 2 or water, the sample size of the training set is 2403. The tempering temperatures are 200, 400 and 600 ∘C and there are 801 cycle stress amplitudes from 400 to 800 MPa with the increment of 0.5 for each tempering temperature. For brine, the sample size is 4203 and cycle stress amplitudes are from 400 to 1100 MPa. Each element of the output vector (mean fatigue life) in the training sets is calculated by the estimated S–N curves in Sect. 3. The testing set is similar with the corresponding training set except that cycle stress amplitudes are from 400.25 to 799.75 MPa for oil 1, oil 2 and water, and from 400.25 to 1099.75 MPa for brine. The mean squared error goal is 10−6. For oil 2, oil 1, water and brine, the test and estimated mean fatigue life by the trained RBF neural network are shown in panels (a), (c), (e) and (g) in Fig. 8 respectively. The estimation error surfaces of the mean fatigue life for the testing set are shown in panels (b), (d), (f) and (h) in Fig. 8 respectively. The mean fatigue life estimation error Ei given the quenching medium, tempering temperature and cyclic stress amplitude is calculated by
yi and Ni are estimated mean fatigue life by the presented method and the calculated mean fatigue life by S–N curve in Sect. 3. According to Fig. 8, it can be observed that (1) the estimated mean fatigue life by the presented method is in good agreement with the mean fatigue life of the test, and (2) there is the large estimation error of the mean fatigue life for the test set when the cyclic stress amplitude is close to the upper or lower bound of the training set, but the maximum estimation error is less than 0.4 % for four kinds of quenching media.
To validate the presented method, 12 fatigue tests were carried out again. The cycle frequency was still 50 Hz. Three fatigue tests were carried out at each cycle stress amplitude. The cycle stress amplitudes and the tempering temperature were different from those of the previous fatigue tests. The fatigue test conditions and results are shown in Table 5. It can be seen that the maximum estimation error of the presented method is 18.19 %. It implies that the proposed method can estimate the mean fatigue life in the case of the given tempering temperature and cyclic stress amplitude with high precision, and can avoid the disadvantages of using S–N curve to estimate the mean fatigue life.
The fatigue life and the static mechanical parameters data of 0.44 % carbon steel specimens were analyzed and the mean fatigue life estimation method based on RBF neural network was presented in this work. The experiment results showed that (1) for these four kinds of quenching medium, there is a downward trend in the mean of σb and N and the standard deviation of N, and there is a upward trend in the mean of δ5 with the increase of tempering temperature from 200 to 600 ∘C, (2) the mean of σb and N is least influenced by the tempering temperature for the specimens with oil 2, then oil 1, next water, finally brine, (3) for the same tempering temperature, according to the rule that the mean and the standard deviation of N is from large to small, the order of quenching medium is brine, water, oil 1 and oil 2. The brittle, transgranular and cleavage fracture occurred in fatigue test specimens. For the designed testing set, the maximum estimation error of the mean fatigue life estimation method based on RBF neural network is less than 0.4 % for four kinds of quenching media. Verified fatigue test results show the maximum estimation error of the presented method is 18.19 %. Therefore, the proposed method can accurately estimate the mean fatigue life when the tempering temperature and cyclic stress amplitude are given for each quenching medium.
All the data used in this paper can be obtained upon request from the corresponding author.
SG, CL and JS conducted experiments, analyzed data and wrote the manuscript. FL and XS were contributed to ideas for this research work and fatigue life estimation model.
The authors declare that they have no conflict of interest.
This research has been supported by the National Natural Science Foundation of China (grant no. 51575095, 51675089), the science and technology plan of ministry of housing and urban-rural development of China (grant no. zjbwt2016002), and the science and technology foundation of Liaoning province of China (grant no. 20170540767).
This paper was edited by Zbigniew Gronostajski and reviewed by two anonymous referees.
Amini, K., Akhbarizadeh, A., and Javadpou, S.: Investigating the effect of the quench environment on the final microstructure and wear behavior of 1.2080 tool steel after deep cryogenic heat treatment, Mater. Design, 45, 316–322, 2013
Amirat, A. and Chaoui, K.: Effect of tempering temperature and frequency on fatigue crack propagation in 0.2 % carbon alloy steel, J. Mater. Sci., 38, 5–580, 2003.
Anazadeh Sayed, A. and Kheirandish, Sh.: Affect of the tempering temperature on the microstructure and mechanical properties of dual phase steels, Mater. Sci. Eng. A, 532, 21–25, 2012
Anctil, A. A. and Kula, E. B.: Effect of tempering temperature on fatigue-crack propagation in 4340 Steel, Effects of environment and complex load history on fatigue life, ASTM STP 462, American Society for Testing and Materials, 297–317, 1970
Chen, J. H. and Cao, R.: Micromechanism of cleavage fracture of metals-a comprehensive microphysical model for cleavage cracking in metals, Elsevier Inc., Amsterdam, the Netherlands, 7–9, 206–234, 2015
Cheng, S. T. and Ohr, S. M.: Dislocation free zone model of fracture, J. Appl. Phys., 52, 7174–7181, 1981
Curry, D. A. and Knott J. F.: Effects of microstructure on cleavage fracture stress in steel, Metal Sci., 12, 511–514, 1978.
Harichandra, B. P., Prashanth, M., and Prakash, S. V.: Evaluation of fatigue properties of EN31 steel heat treated using biodegradable gingili oil, Mater. Sci. Eng., 149, 012155, https://doi.org/10.1088/1757-899X/149/1/012155, 2016
Htun, M. S., Kyaw, S. T., and Lwin, K. T.: Effect of heat treatment on microstructures and mechanical properties of spring steel, J. Metals, Materials Minerals, 18, 191–197, 2008.
Khan, S., Naseem, I., Malik, M. A., Togneri, R., and Bennamoun, M.: A Fractional Gradient Descent-Based RBF Neural Network, Circuits, Systems, and Signal Processing, 37, 5311–5332, https://doi.org/10.1007/s00034-018-0835-3, 2018.
Kuang, C. F., Li, J., Zhang, S. G., Wang, J., Liu, H. F., and Volinsky, A. A.: Effects of quenching and tempering on the microstructure and bake hardening behavior of ferrite and dual phase steels, Mater. Sci. Eng. B-Adv., 613, 178–183, 2014.
Kumar, R., Behera, R. K., and Sen, S.: Effect of tempering temperature and time on strength and hardness of ductile cast iron, 4th National Conference on Processing and Characterization of Materials, Materials Science and Engineering, NIT Rourkela, Rourkela, Odisha, India, 5–6 December, 2014, 12–15, 2014.
Kwon, H., Barlat, F., Lee, M., Chung, Y., and Uhm, S.: Influence of Tempering Temperature on Low Cycle Fatigue of High Strength Steel, ISIJ International, 54, 979–984, 2014
Lee, K. A., Nam, W. J., Yoo, S. J., Kim, N. J., and Lee, C. S.: The effect of tempering temperature on the high cycle fatigue properties of high strength spring steels, 9th International Conference on Fracture (ICF-9), Sydney, Australia, 1–5 April 1997, 1587–1594, 1997.
Li, C., Dai, W., Duan, F., Zhang, Y., and He, D.: Fatigue life estimation of medium-carbon steel with different surface roughness, Appl. Sci., 7, 338, https://doi.org/10.3390/app7040338, 2017a.
Li, C., Li, S., Duan, F., Wang, Y., Zhang, Y., He, D., Li, Z., and Wang, W.: Statistical Analysis and Fatigue Life Estimations for Quenched and Tempered Steel at Different Tempering Temperatures, Metals, 7, 312, https://doi.org/10.3390/met7080312, 2017b.
London, B., Nelson, D. V., and Shyne, C.: The Influence of Tempering Temperature on Small Fatigue Crack Behavior Monitored with Surface Acoustic Waves in Quenched and Tempered 4140 Steel, Metall. Mater. Trans. A, 20, 1257–1265, 1989.
Mahanty, R. N. and Gupta, D. P. B.: Application of RBF neural network to fault classification and location in transmission lines, IEE P.-Gener. Transm. D, 151, 201–212, 2004.
Mei, Z. and Morris, J. W.: Influence of Deformation-Induced Martensite on Fatigue Crack Propagation in 304-Type Steels, Metall. Mater. Trans. A, 21, 3137–3152, 1990.
Oguma, H. and Nakamura, T.: Effect of tempering temperature on very high cycle fatigue properties of high strength steel, 12th International Conference on Fracture (ICF-12), Ottawa, Ontario, Canada, 12–17 July 2009, 1–8, 2009.
Siddiqui, R. A., Qamar, S. Z., Pervez, T., and Abdul-Wahab S. A.: Effect of heat treatment and surface finish on fatigue fracture characteristics in 0.45 % carbon steel, 10th International Research/Expert Conference “Trends in the Development of machinery and Associated Technology” TMT 2006, Barcelona-Lloret de Mar, Spain, 11–15 September 2006, 153–156, 2006.
Sultan, J. N.: Effect of Austenizing and Tempering Heat Treatment Temperatures on the Fatigue Resistance of Carburized 16MnCr5 (ASTM 5117) Steel, Tikrit, J. Eng. Sci., 20, 1–10, 2013.
Suraratchai, M., Limido, J., Mabru, C., and Chieragatti, R.: Modelling the influence of machined surface roughness on the fatigue life of aluminum alloy, Int. J. Fatigue, 30, 2119–2126, 2008.
Tanaka, K. and Mura, T.: A dislocation model for fatigue crack initiation. J. Appl. Mech., 48, 97–103, 1981.
Thelning, K. E.: Steel and its Heat Treatment, 2nd edn., Elsevier Ltd. Amsterdam, the Netherlands, 205–217, 1984.
Tsay, L. W., Chung, C. S., and Chen, C.: Fatigue crack propagation of D6AC laser welds, Int. J. Fatigue, 19, 25–31, 1997.
Williams, J. J., Deng, X., Chawla, N., Lindsley, B., King, P., and Narasimhan, K. S.: Effects of Residual Surface Stress and Tempering on the Fatigue Behavior of Ancorsteel 4300, 2006 International Conference on Powder Metallurgy and Particulate Materials, PowderMet, San Diego, CA, United States, 18–21 June 2006, 101–109, 2006.
Yang, R., Er, P. V., Wang, Z., and Tan, K. K.: An RBF neural network approach towards precision motion system with selective sensor fusion, Neurocomputing, 199, 31–39, 2016.
Ye, H., Xu, H. D., and Zhang, X. B.: Principle and process of metal heat treatment, Chemical Industry Press, Beijing, China, 134–162, 2011.
Yu, M. T., DuQuesnay, D. L., and Topper, T. H.: Notch fatigue behaviour of SAE1045 steel, Int. J. Fatigue, 10, 109–116, 1988.
Zahraa, A. H., Haider, M. M., and Murtadha, A. J.: Effect of quenching and tempering treatments on impact strength and fatigue life of AISI 4340, available at: https://www.researchgate.net/publication/309867523_Effect_of_Quenching_and_Tempering_Treatments_on_Impact_Strength_and_Fatigue_Life_of_AISI_4340 (last access: 13 June 2019), 2016.