the Creative Commons Attribution 4.0 License.
the Creative Commons Attribution 4.0 License.
 | 10 Mar 2026
Dynamic stress monitoring and analysis of cranes based on digital-twin modeling
Guoping Yan
Xiaowei Yang
Jiansheng Zhang
Qi Tao
Yang Li
Cranes used in factories and ports are frequently exposed to potential risks arising from complex operating conditions. To comprehensively assess operational reliability, digital technologies are being increasingly employed for dynamic monitoring and optimization during crane operations. This study focuses on the dynamic stress variations in the main truss of cranes during operations. First, a digital mapping model between a scaled physical crane and its virtual counterpart was developed using a parametric design approach based on a real-world engineering crane. Using this model, a digital-twin representation of the crane's dynamic stress field was constructed. Nodal stresses of the twin crane were obtained using radial basis function (RBF) interpolation in conjunction with finite-element stress field calculations. Subsequently, the K-nearest-neighbor algorithm was used to select relevant nodes for training an interpolation-based surrogate model, enabling end-to-end stress prediction at the crane's nodes. Finally, dynamic stress rendering using the HSV (hue, saturation, value)-color-model-enabled synchronized visualization of the stress field within the digital twin, supporting real-time monitoring, simulation-based optimization, and dynamic life cycle management of the crane. Experimental comparisons of three different lifting conditions show that the average error between finite-element analysis and stress-rendering results is 8.29 %, while the average error between measured data and stress-rendering results is 9.98 %, verifying the predictive reliability of the interpolation model. These findings guide the application of dynamic digital twins of stress fields in industries such as construction, manufacturing, and energy.
- Article
(5988 KB) - Full-text XML
- BibTeX
- EndNote


The safe operation of cranes is critical to ensuring the smooth and efficient execution of construction projects. However, with the expansion of construction scales and increasing operational complexity, safety risks associated with crane operations have grown substantially. Consequently, accident prevention during crane operations has become a critical issue demanding urgent solutions. Studies indicate that real-time monitoring of crane operations can mitigate accidents to some extent, prompting extensive research in this area.
To address collision detection among hoisted objects, obstacles, and cranes during lifting operations, Zhu et al. (2024) proposed a method integrating octree and bounding-box techniques (Oct-Box) that effectively reduces the search space while enabling continuous, accurate collision detection. Xue (2023) developed a real-time distance measurement method between the hook and jib using the BiseNetV2 image segmentation algorithm, integrated with a distance-based collision avoidance strategy to enhance construction personnel safety. Regarding dynamic loads during lifting, Huang (2022) derived formulas for calculating dynamic load coefficients by establishing a single-crane force model and proposed measures to control dynamic loads. Hong et al. (2016) modeled the crane jib as a finite-element system, applying the fourth-order Runge–Kutta method to solve motion equations and analyze system behavior, dynamic loads, and jib deformation. Regarding structural strength during lifting, Xia (2023) used MSC Patran/Nastran finite-element analysis software to evaluate the structural stability of superstructures throughout the lifting process, accounting for various uncertainties. Su (2023) utilized finite-element simulation, multi-island genetic algorithms, and adaptive simulated annealing to optimize the structural strength of living quarters during FPSO (floating production storage and offloading) lifting operations, achieving weight reduction while maintaining safety and reliability. For damage detection, Li (2015) applied the curvature modal difference method to improve the accuracy of theoretical and experimental predictions for damage forecasting. Chen (2021) used faster R-CNN and SSD algorithms to detect cracks and other defects in large construction cranes, enabling intelligent, automated crack detection. In stress monitoring, Lalik et al. (2017) integrated a theodolite and a self-excited acoustic system (SAS) into a redundant measurement system to monitor tower crane tilt and structural stress. Zhang (2019) developed a fiber Bragg grating-based stress-monitoring system for shipbuilding gantry cranes, enabling real-time, high-precision structural stress monitoring with long-term stability.
Research has demonstrated that monitoring and feedback via virtual simulation, along with algorithmic optimization, can reduce accidents and enhance safety in lifting operations. However, there is still a need for a rapid, accurate, comprehensive, and reliable approach to real-time monitoring, analysis, and prediction during crane operations. Digital-twin technology offers a promising solution (Tao and Qi, 2019) for dynamic stress monitoring of cranes to ensure structural safety, making it among the most promising applications of digital twins. The concept of digital twins, first introduced around 2002 (Barbie and Hasselbring, 2024), has since been the subject of extensive research on its principles, implementation, and applications. Initially employed by NASA and the US Air Force for design simulation and performance evaluation of aircraft and aerospace engines, digital twins have now been widely adopted across various types of industrial equipment, such as mobile cranes, wind turbines, and computerized numerical control (CNC) machines, evolving from a descriptive concept into an operational technology (Lai et al., 2022). Liu et al. (2021) developed a safety risk prediction framework for prefabricated building lifting using digital-twin technology. They proposed a digital-twin support vector machine (DT-SVM) algorithm for data analysis and risk prediction. Lai et al. (2021) proposed the shape-performance-integrated digital twin (SPI-DT) technology, which integrates numerical, analytical, and artificial intelligence models to achieve high-precision, real-time stress visualization for lattice boom cranes. He et al. (2022) applied the multi-level fusion modeling (M-LFM) method to construct surrogate models for predicting stress in telescopic boom forklift arms, demonstrating efficient and accurate modeling suitable for digital twins. Gao et al. (2023) developed a digital-twin-based prediction system for gantry cranes, integrating finite-element analysis for stress calculation and visualization to display structural stress distribution. Moi et al. (2022) performed real-time crane simulation using nonlinear finite-element programs, employing an inverse method based on physical strain gauge measurements to estimate load weight and force vector directions, thereby obtaining strain histories for structural monitoring and fatigue damage assessment.
This paper presents the development of a scaled crane model and its corresponding digital twin. Through the application of digital-twin methodology, virtual–physical synchronization between the model and the physical crane was achieved. Predictive stress analysis of the crane's main girder was conducted using radial basis function (RBF) interpolation, with stress contours rendered via the HSV (hue, saturation, value) color model, enabling both prediction and visualization of the stress distribution in the main girder.
In constructing the scaled crane test platform, the main truss structure was designed to be consistent with that of an engineering crane, as shown in Fig. 1.
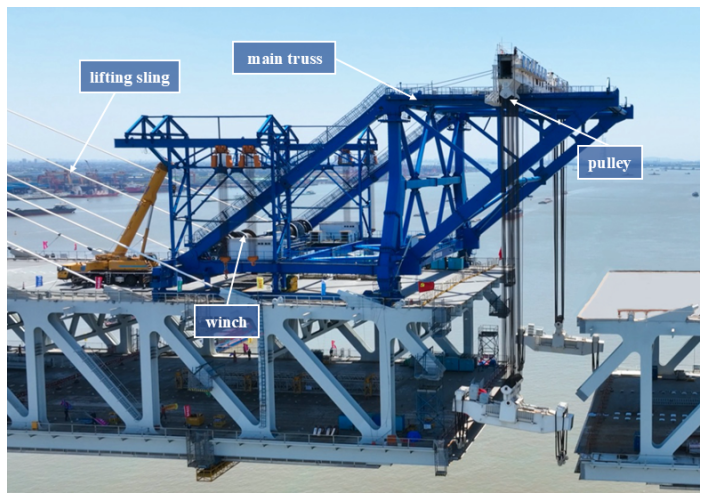
Figure 1On-site image of crane equipment (source: Yangtze Evening Post, official photograph).
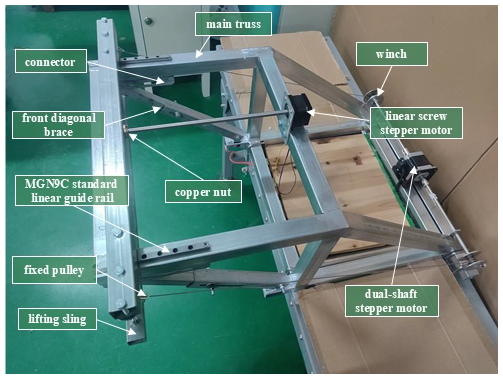
While preserving the main truss structure of the original crane, other components were simplified, as shown in Fig. 2. The test platform has overall dimensions of 700 mm (length) × 550 mm (width) × 440 mm (height). Except for the front diagonal brace, the main truss was fabricated from galvanized square steel tubes with a wall thickness of 1.3 mm and cross-sectional dimensions of 30 × 30 mm, primarily joined by welding. To investigate the effects of variations in front diagonal brace angle on the stress in key truss structures during lifting operations, the front diagonal brace was designed as a telescopic, rotatable sleeve assembly. The outer square tube has a maximum cross-section of 25 mm × 25 mm, while the inner square tube has a cross-section of 20 mm × 20 mm. The length of the diagonal brace can be adjusted by tightening butterfly nuts between the sleeves. The upper end of the front diagonal brace was fastened to an elongated slot beneath the main truss using a butterfly nut. The base of the diagonal brace was connected to the other end by a pin joint. The steel winch is positioned on both sides of the platform, with the cable routed through a fixed pulley beneath the crossbeam to change the pulling direction before connecting to the simple lifting mechanism. The winches are symmetrically arranged along the central axis and are driven by a 57-series dual-output-shaft stepper motor, enabling forward and reverse rotation to lift and lower the load. The motor is connected to the winches via a drive shaft and a rigid coupling. The crossbeam and main truss are connected using a standard MGN9C linear guide rail and carriage from Hiwin Corporation. The 150 mm rail is aligned with the central axis of the front beams on both the left and right sides of the truss. The carriage is mounted on a fixed plate, which is then bolted to the crossbeam. A 42-series linear lead-screw stepper motor is installed along the central axis of the platform on the top horizontal rod. The 300 mm lead screw is fixed at one end to the motor, while the other end engages with a copper nut secured to the center of the crossbeam with screws. This linear lead-screw stepper motor drives the forward and backward movement of the crossbeam along the guide rail.
In terms of geometric similarity, the model faithfully replicates the core structural layout and load transfer logic of the actual bridge deck crane. It preserves all key features that determine the overall mechanical configuration, including the main frame of the main truss, the adjustable front diagonal braces, and the precise mechanism for crossbeam movement via slide rails and sliders. A stepper motor drive system replaces the hydraulic winch of the original crane, simplifying the non-load-bearing components that do not affect the mechanical behavior of the main truss.
Regarding mechanical similarity, firstly, the main structures of the model are fabricated from Q235B steel, which is identical to that of the actual crane. This ensures full consistency in key parameters governing material deformation and failure behavior, such as elastic modulus and yield strength, thereby providing the physical foundation for the similarity of stress distribution patterns. Secondly, loads are applied at specific positions along the slide rails using precise mass-simulation blocks that represent the concentrated forces transmitted to the main truss via the sliders in actual hoisting operations. Finally, rigid fixation is achieved at the end using U-shaped clamps, accurately simulating the articulated support between the actual crane and the bridge structure, thereby ensuring that the load transfer path from the support points to the fixed end is consistent with that of the actual structure.
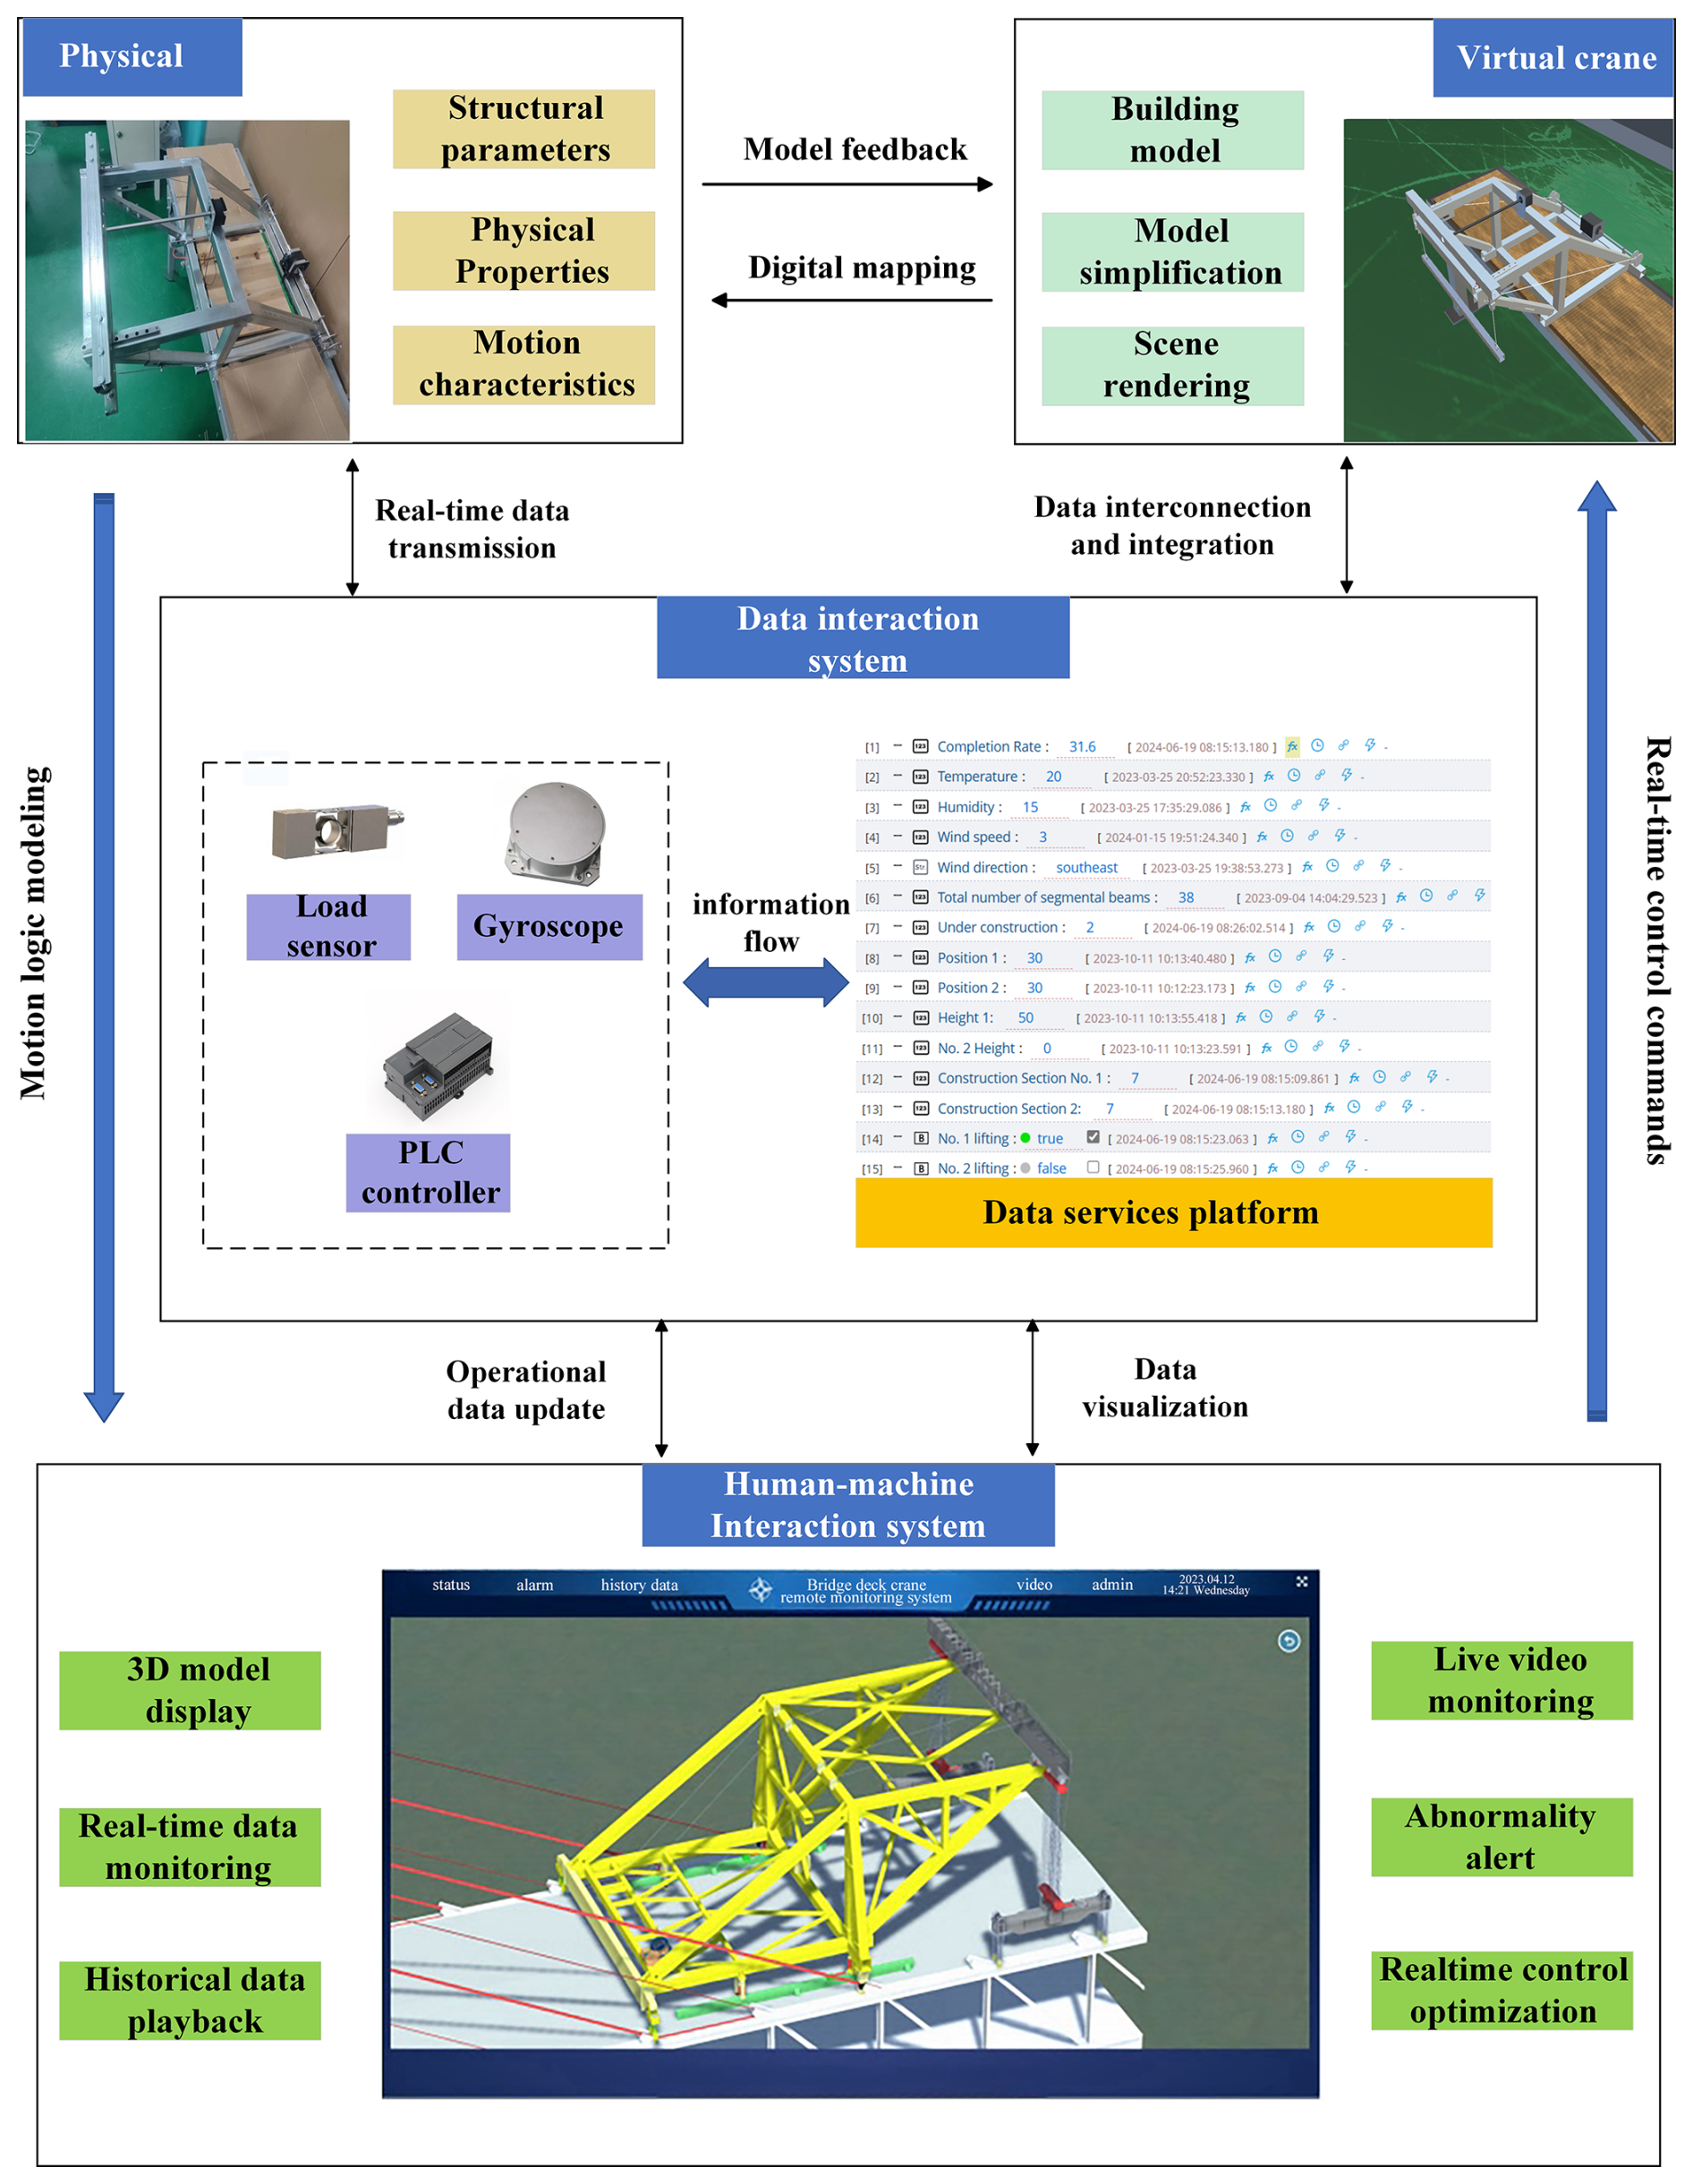
A load sensor and a gyroscope mounted on the experimental platform collect load weight and hoist attitude data in real time. The operating status of the stepper motor is converted into crossbeam displacement and hoisting-height data by the programmable logic controller (PLC). After aggregation, time synchronization, format unification, and preliminary data validation of these multi-source heterogeneous data in the PLC, the data are published to the data service platform via the laboratory's local area network using the Message Queuing Telemetry Transport (MQTT) protocol. Subsequently, the digital-twin monitoring system, which uses WebSocket communication, subscribes to the data stream and receives it in real time.
3.1 Construction of crane 3D digital-twin model
Following the assembly of the scaled-down crane model in physical space, it is essential to construct a corresponding digital-twin model in virtual space. A high-fidelity digital-twin model is characterized by high precision, multidimensionality, and real-time responsiveness. These attributes collectively enable the creation of a virtual object in the digital environment that accurately reflects and describes the dynamic behavior of its physical counterpart (Tao et al., 2019). In this study, SolidWorks software was first used to create a three-dimensional model of the scaled-down crane. Since relative displacement occurs only between the carriages and the rails during load lifting and horizontal movement, the carriages, beams, rails, and main truss were merged in Blender. This process simplified the model by removing minor structures and reducing the polygon count, ensuring the model remained lightweight while preserving its overall shape. Finally, the Unity 3D engine was used for scene rendering and for programming the driver for the crane's digital twin, completing its construction.
3.2 Construction of the crane dynamic monitoring platform and data acquisition
The crane dynamic monitoring platform was developed using a Browser/Server (B/S) architecture and is built on a MongoDB database, enabling cross-platform deployment on Windows and Linux systems. The B/S architecture offers simplified deployment and maintenance as only the server-side application requires updates, with all client-side applications in web browsers automatically reflecting these changes. For the scaled crane's attitude data during operation, sensors were installed at corresponding positions to collect the data. A dynamic connection was established between the operational data and the digital-twin model through the monitoring platform. As sensors continuously collect operational data, the model is updated in real time.
In the data acquisition phase, the design of the data collection scheme is critical as it directly influences the completeness of the monitoring platform's functionality. In this study, sensors were positioned at key locations to capture attitude data during the operation of the scaled-down crane. Protocol parsing was used to extract information from the PLC regarding the equipment's control system.
3.3 Data fusion and information transmission
All data acquired through various channels are processed and aggregated on the monitoring platform into a unified standard format, facilitating the subsequent information transmission. The crane operation dynamic monitoring platform prioritizes real-time performance, accuracy, and high interactivity, making the choice of communication protocols particularly crucial. The data must be synchronized in real time to ensure consistency and timeliness between the physical entity and its digital representation (Bao and Hu, 2019). Based on the characteristics of data transmission between the crane and the three-dimensional digital-twin model, WebSocket and MQTT protocols were selected as the primary communication protocols.
WebSocket is a protocol that provides full-duplex communication over a single transmission control protocol (TCP) connection. Unlike HTTP, the WebSocket protocol does not require a handshake for each transmission after establishing the connection. This reduction in overhead lowers data transmission costs and conserves server resources (Ogundeyi and Yinka-Banjo, 2019). Its built-in Ping-Pong frame interaction mechanism enables rapid detection of connection anomalies, reduces interruptions caused by connection timeouts, and delivers superior anti-interference performance. MQTT is a lightweight messaging protocol designed for small devices operating in low-bandwidth, unreliable, or high-delay network environments. It operates on a publish–subscribe model, enabling efficient and streamlined message transmission between devices and servers. Its lightweight transmission characteristics further cater to the anti-interference requirements of weak network environments.
In summary, Fig. 3 illustrates the implementation of the crane operation dynamic monitoring digital-twin framework. Additional functionalities, such as historical data playback, live video monitoring, and anomaly alerting, have been integrated into the human–machine interface to meet the requirements of practical engineering applications. This comprehensive framework effectively demonstrates the virtual–physical mapping and state synchronization between the physical crane and its digital twin.
Factors such as data acquisition, transmission speed, data processing capability, and system architecture influence the real-time performance of the digital-twin model during its interaction with the physical model. Real-time performance and displacement accuracy are critical metrics for evaluating the effectiveness of virtual–physical synchronization (Lin, 2019). According to project specifications, the system must achieve a delay of less than 500 ms and a displacement error of no more than 2 mm.
In this study, the PLC controls the crane's motion by connecting to a driver, which subsequently regulates the servo motor. Timestamps related to the entire process, from sending a request to receiving a response from the digital-twin model, were obtained from client log records.
To verify the real-time performance of the digital-twin model, we organized the network request and response log records into a table, as shown in Table 1. In the table; Q (queueing) represents the queue waiting time; S (stalled) indicates the stalled time; W (waiting for server) denotes the time spent waiting for the server response; and T (total delay) is the sum of Q, S, and W, representing the total delay.
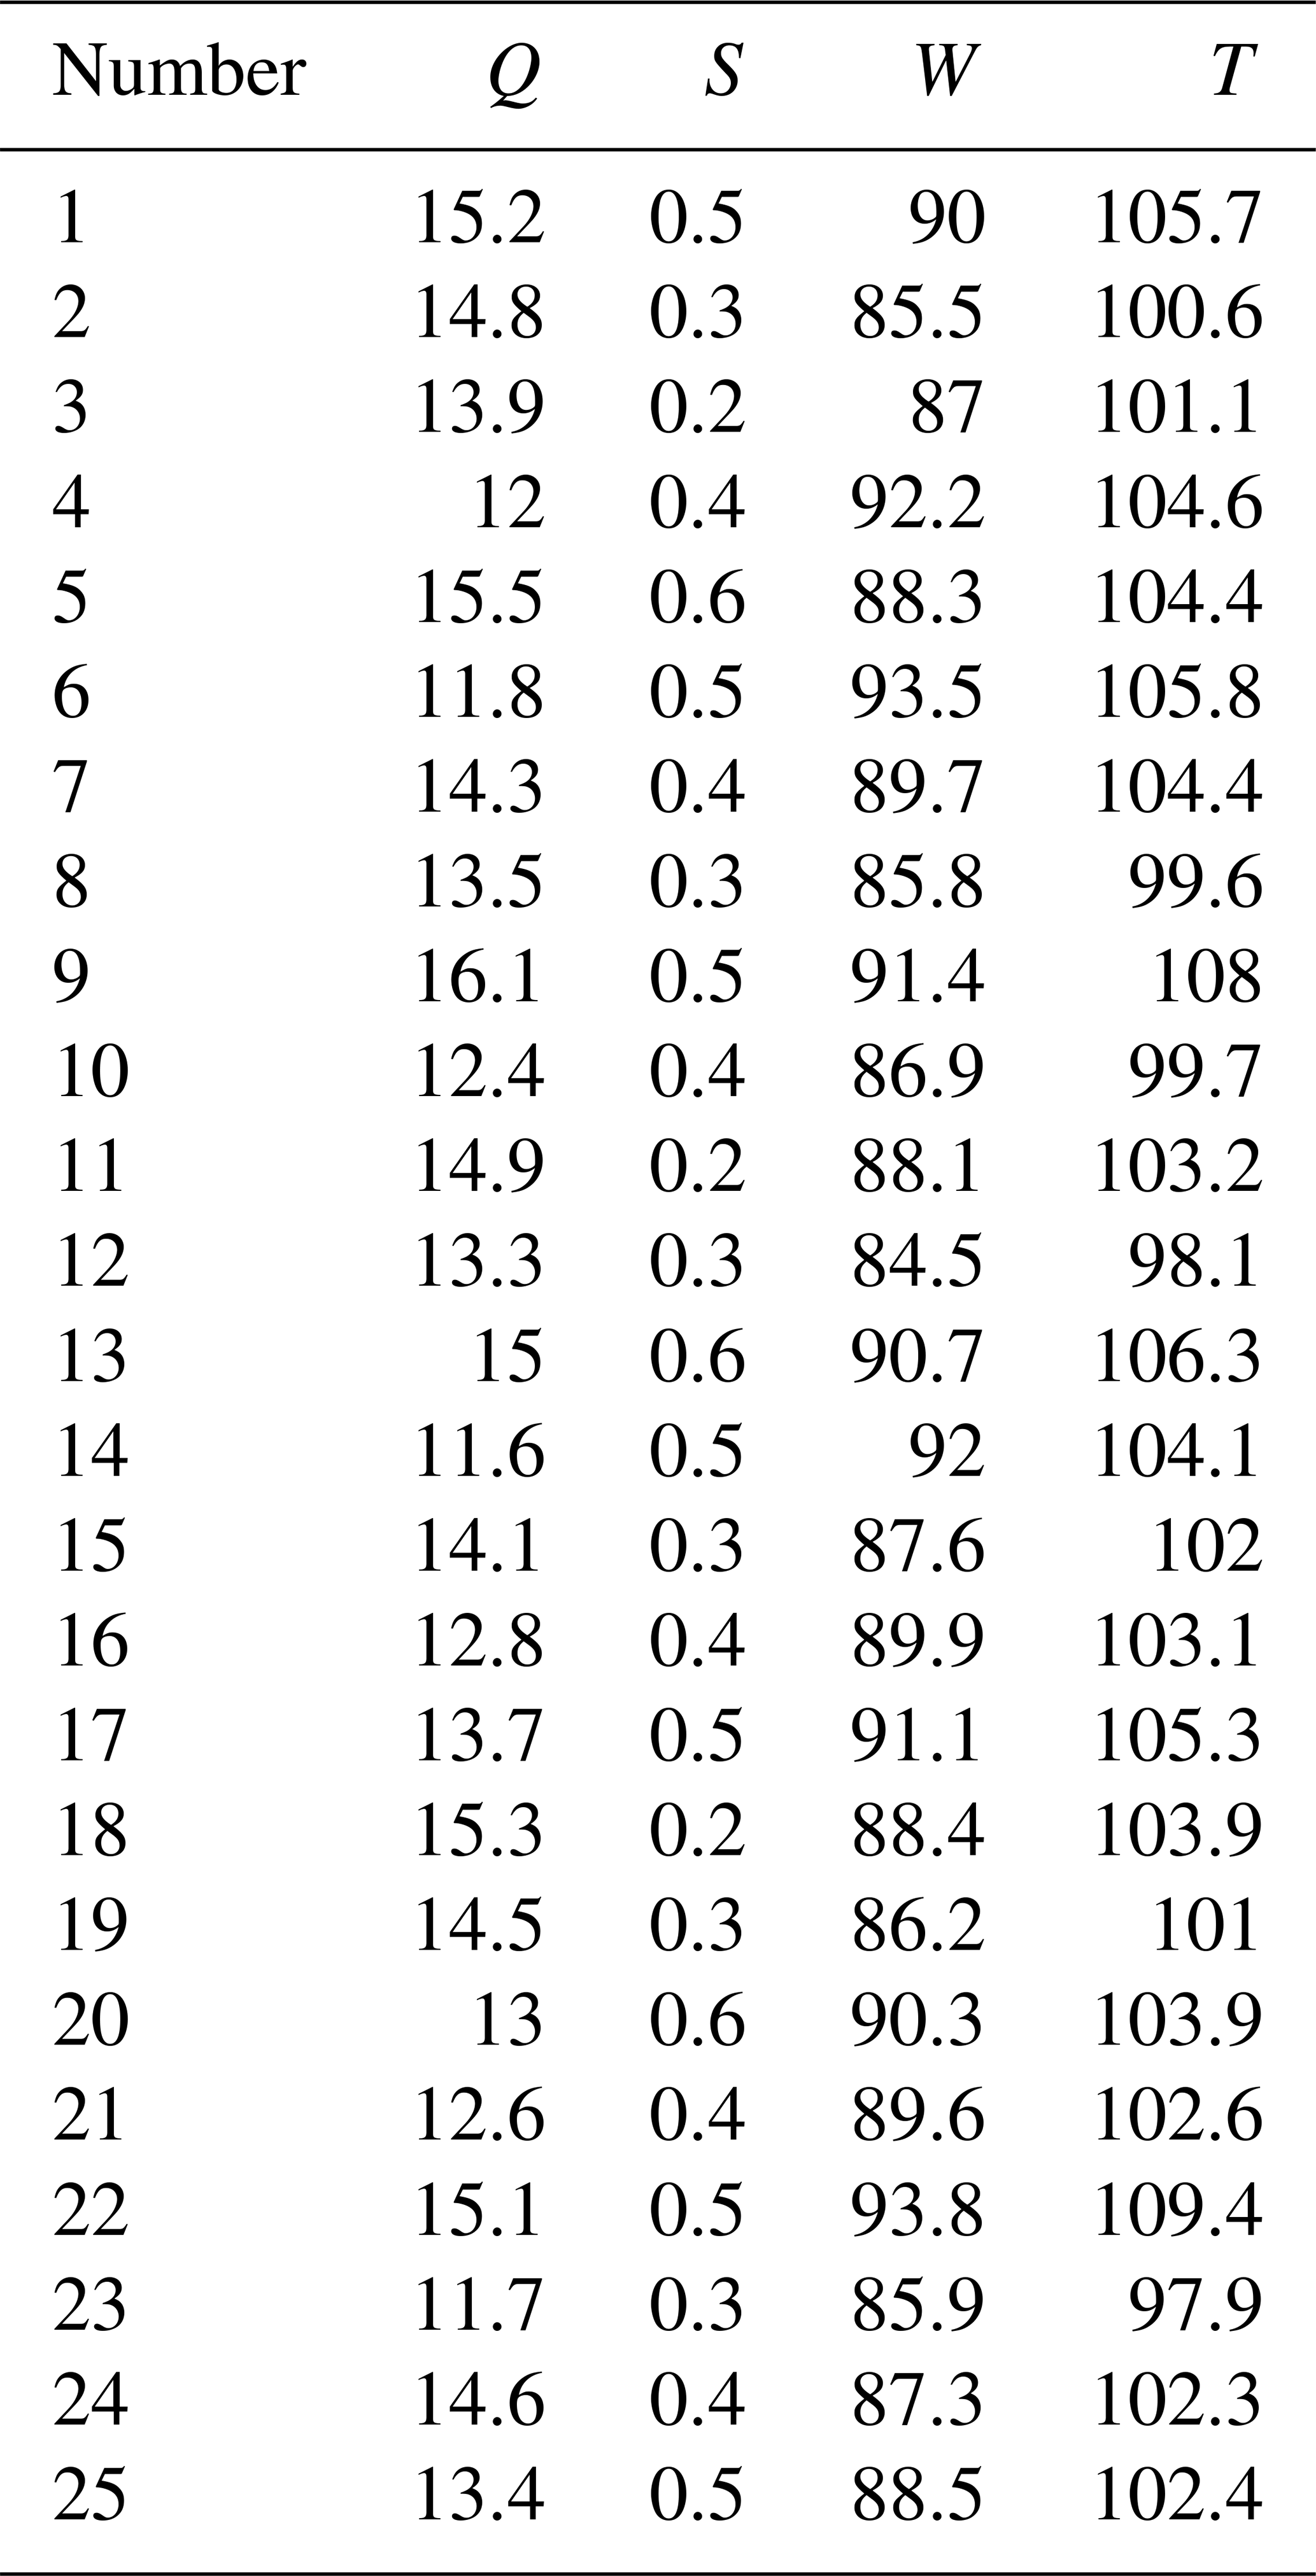
In the sample data presented in Table 1, the maximum delay observed on the platform was 106.3 ms, the minimum delay was 97.9 ms, and the average delay was 103.176 ms. The results indicate that the monitoring platform satisfies the requirement of maintaining a delay below 500 ms, successfully achieving virtual–physical synchronization. This delay test was conducted in a laboratory local area network environment, aiming to verify the feasibility and basic performance of the communication architecture.
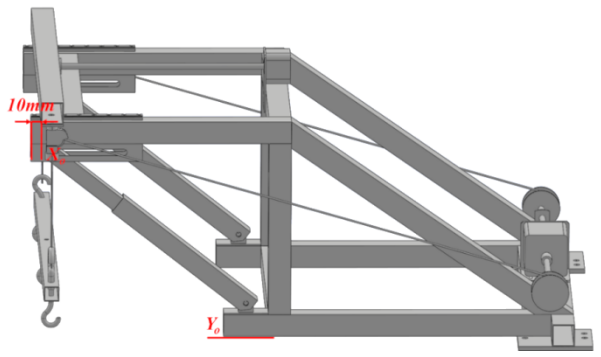
To validate the displacement accuracy of the digital-twin model, the lifting process was paused at random intervals, and the actual displacement values of the beam and hoisting mechanism were measured. These values were then compared with the displacement values displayed by the digital-twin crane model at the corresponding moments to calculate the error. As shown in Fig. 4, the position 10 mm from the front edge of the main truss was designated as the initial position of the beam in the digital-twin model, labeled as X0, with rightward movement defined as positive. The crane's base was used as the reference position for the lifting height, denoted as Y0, with upward movement also defined as positive.
The hoisting heights of the lifting device and the beam displacements, measured from both the physical crane and its twin model, were compiled and compared. The results of the comparison are shown in Fig. 5a and b.
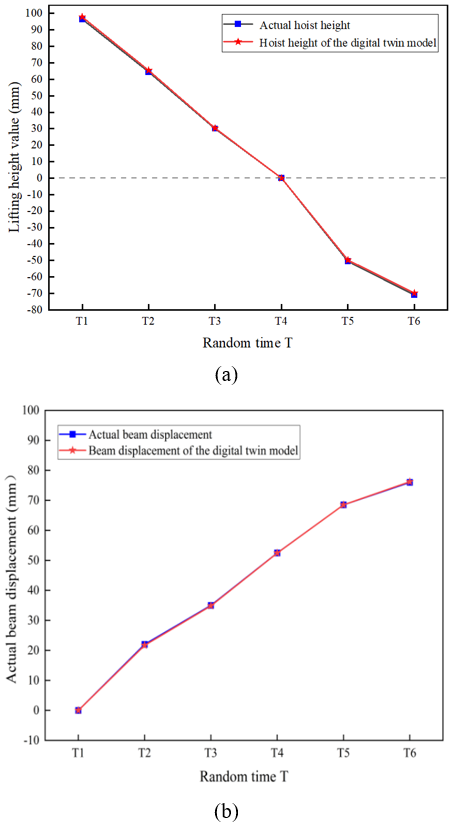
In Fig. 5a and b, the random time refers to a scenario in which the crane operates for a certain period and then pauses. In this particular instance, the measured value is compared with the model value. It is not a uniformly sampled time value. In Fig. 5a, T4 denotes the beginning of the lifting operation, where the heights of both the physical and virtual crane lifting devices are zero. As the lifting operation progresses, a deviation in lifting height becomes apparent, with the maximum deviation of 1.39 mm occurring at time point T1. However, the relative error rate is only 1.5 %, which is acceptable. As a result, the difference is almost invisible on the real-time monitoring display interface. This discrepancy is primarily due to minor variations in the steel cable winding on the winch and calculation errors in the virtual crane when determining the lifting height based on motor speed. The error can be effectively minimized by installing sensors on the lifting device and the beam to capture the spatial positions of these components precisely. In Fig. 5b, the displacement measurements of the beam for both the physical crane and the digital-twin model are nearly identical, with a maximum error of only 0.3 mm, fully meeting the displacement accuracy requirements for virtual-physical synchronization.
In conclusion, although a slight error in the hoisting mechanism's lifting height was observed, the errors were primarily due to data acquisition methods. Nonetheless, they remain within the acceptable error range and meet the design's precision requirements.
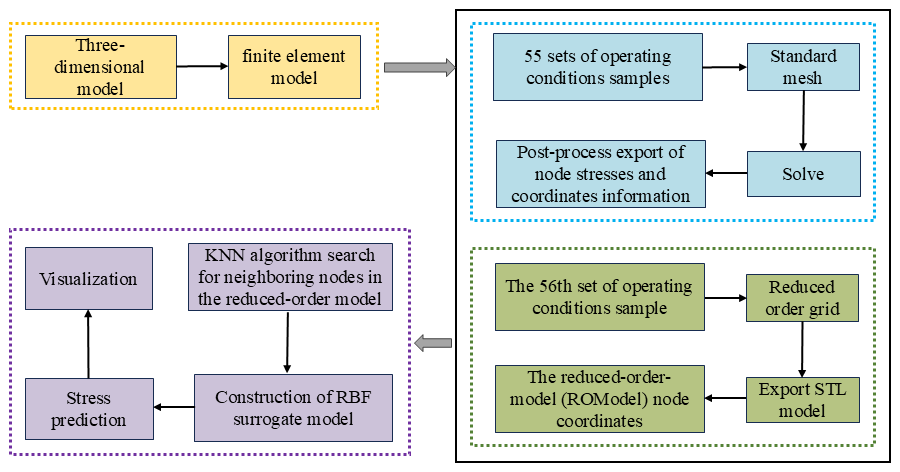
The previous section successfully achieved virtual–physical synchronization of the crane's operational states, demonstrating effective synchronization. Building on this foundation, the focus now shifts to predicting and visualizing the global stress distribution in the crane's main truss during operation. To achieve this, a method combining finite-element simulation with a radial basis function (RBF) interpolation surrogate model was employed to predict stress at various nodes of the main truss. A Python-based server was developed to interface with Unity3D software, enabling real-time rendering of nodal stresses in the crane's digital-twin model. This approach enables intuitive visualization of the global stress distribution across the equipment. The workflow for constructing the stress contour map of the crane's main truss is shown in Fig. 6.
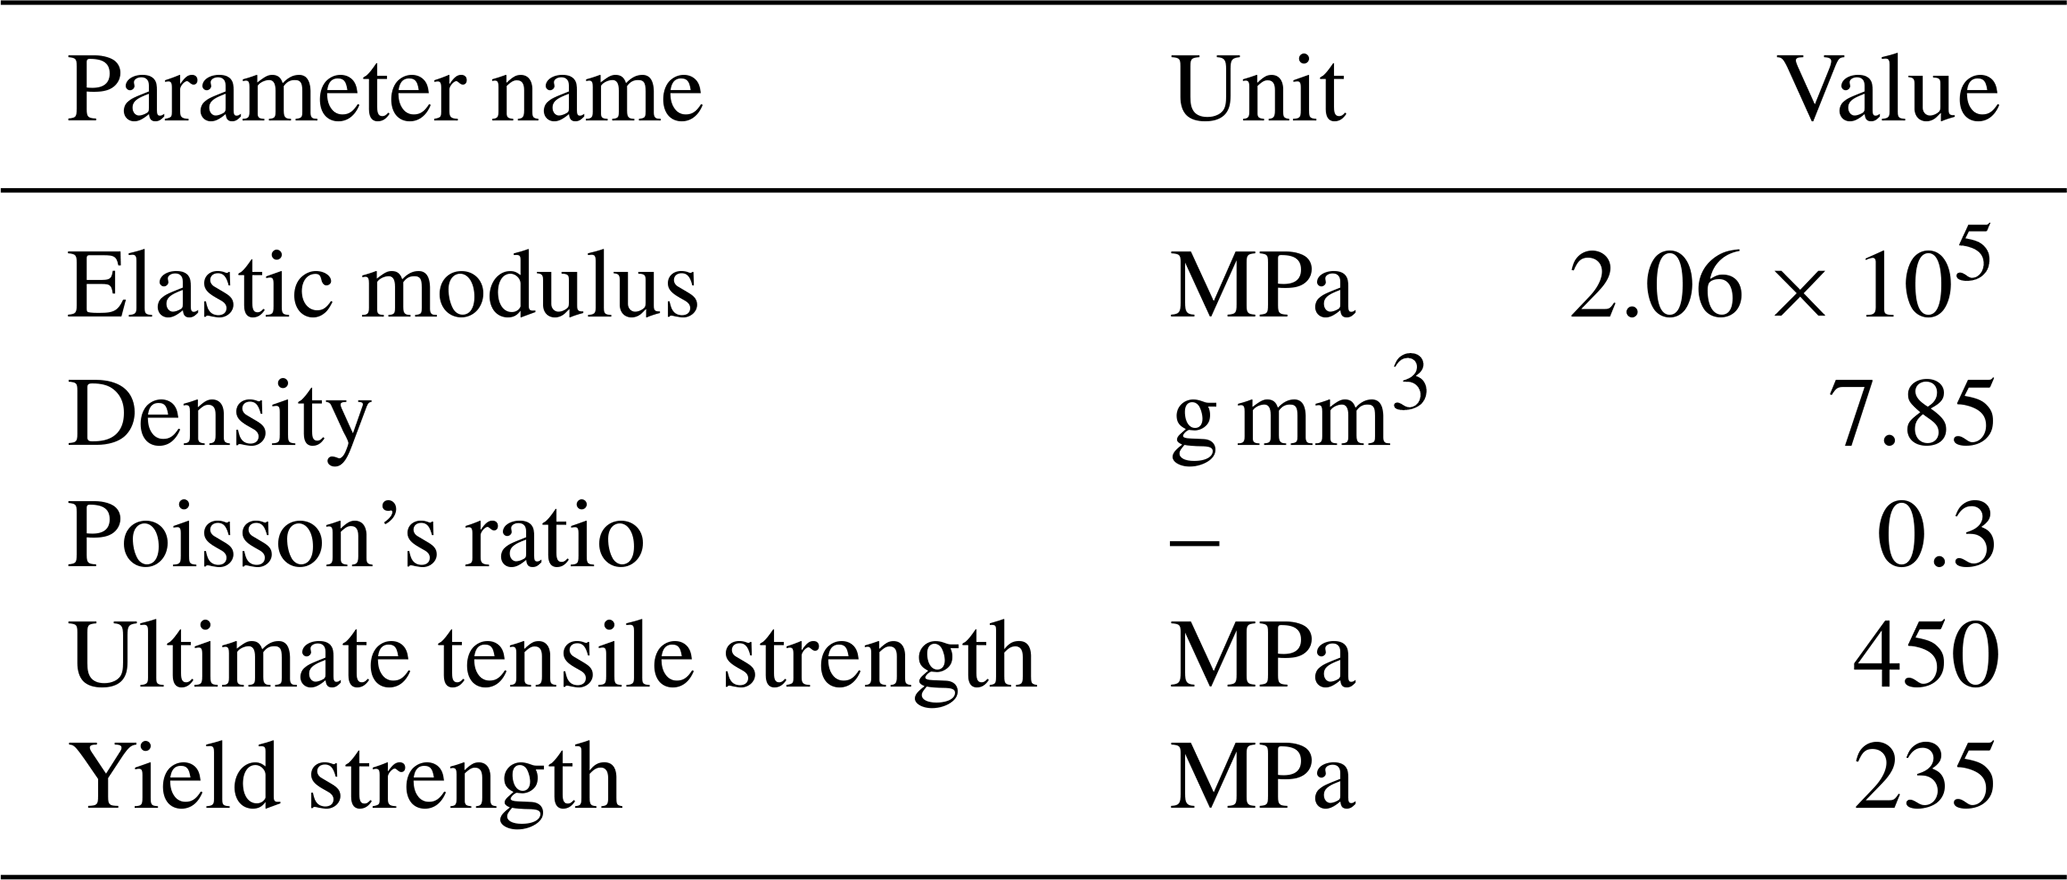
The finite-element model was established to extract nodal stresses under various working conditions, which provides a dataset for training the RBF surrogate model. A more comprehensive and detailed simulation solution was achieved by combining the strengths of Abaqus software and Workbench software. Therefore, in this study, Abaqus software was used for shell element modeling and mesh generation of the scaled crane's main truss. At the same time, Workbench was employed to set up loads and boundary conditions and to solve the finite-element model (Baiges et al., 2019). The material properties are listed in Table 2.
Finite-element simulations were conducted by combining different loading positions and weights, resulting in 11 sample datasets. Table 3 presents a selection of these sample data.
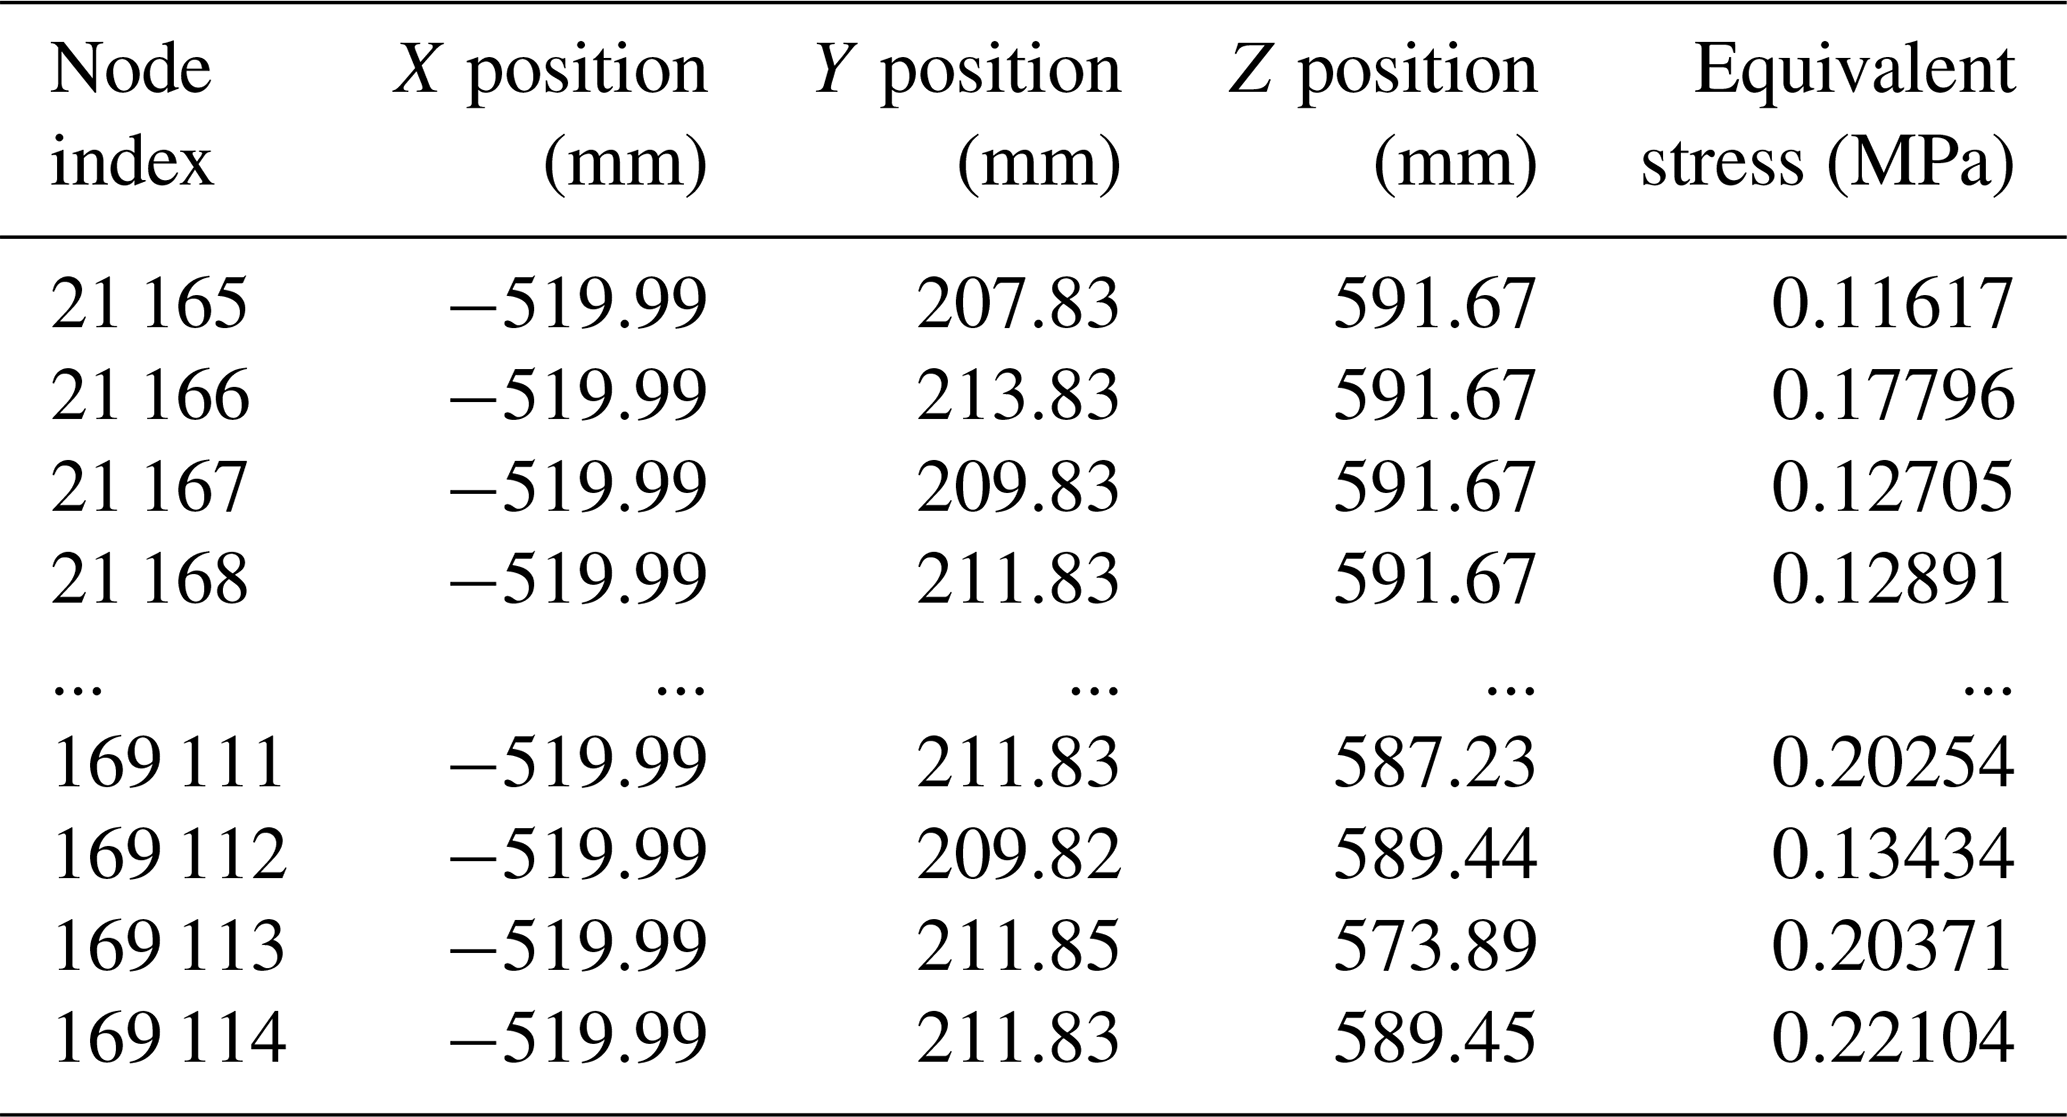
Real-time rendering of dynamic stress contour maps in Unity3D software is essentially a 3D mesh-rendering technique based on three-dimensional mesh reconstruction technology, placing significant demands on CPU performance. Unity3D software supports up to 65 000 nodes per model. In this study, the finite-element model of the main truss contained 91 968 nodes, exceeding the Unity3D software's maximum node limit for a single model. When rendering nodal colors, the large volume of mesh node data can lead to lag or even rendering failure. Therefore, it was necessary to reduce the order of the finite-element mesh. Moreover, order reduction of the finite-element mesh allows for a balance between simulation efficiency and accuracy. By appropriately selecting and optimizing mesh density, it becomes possible to more accurately assess the numerical stability of the results and the convergence of the numerical solution. The reduced-order model is referred to as the ROModel (reduction of order model) in this study.
The element size was increased in Workbench, and the finite-element mesh was remeshed. The coarse-element mesh model was exported directly in ASCII format as an .stl file, in which the node information for each triangular facet is listed sequentially. This conversion transformed the original finite-element mesh model into a triangular mesh model compatible with Unity3D software. Additionally, the coordinates of the triangular facet nodes, along with their ordering, were obtained. This reduced-order model, referred to as ROModel, contains 15 204 nodes.
The K-nearest-neighbor (KNN) algorithm was employed to identify the 15 closest points around the prediction point. The Euclidean distance formula was used to calculate the distance between the prediction point and its neighboring points in three-dimensional space as follows:
Here, dxy represents the distance between points x and y. The stress values at these 15 points were used to calculate the nodal stress of the ROModel through the radial basis function (RBF) interpolation method (Cui et al., 2022). In this study, the interpolation for the ROModel was performed using the local neighboring node data. Gaussian functions are smooth and continuous, with their values decaying more rapidly as the distance from the center increases (Levesley, 2022). This characteristic enables them to accurately reflect and capture the influence of sample data in the local neighborhood near the prediction point while avoiding unnecessary interference or global oscillations caused by distant nodes. This property corresponds precisely to the localization strategy adopted in this study, which uses the KNN algorithm to select the nearest 15 sample points for interpolation. Meanwhile, the shape parameter in Gaussian functions provides flexibility in controlling the influence range, helping balance interpolation accuracy and smoothness. Furthermore, as positive definite functions (Yao et al., 2015), Gaussian functions ensure excellent numerical stability of the interpolation system matrix, and their computational form facilitates efficient implementation. Therefore, the Gaussian function was selected as the basis function. The radial basis function is expressed as follows:
Here, f(x) is the interpolation function, N is the total number of radial basis functions used in the interpolation problem, ϕ () represents the general form of the RBF, is the Euclidean distance between two position vectors (x and xi are three-dimensional coordinates, i.e., x, xi∈R3), xi is the position of the support point for the i-th RBF, and ωi is the weight coefficient corresponding to the i-th RBF.
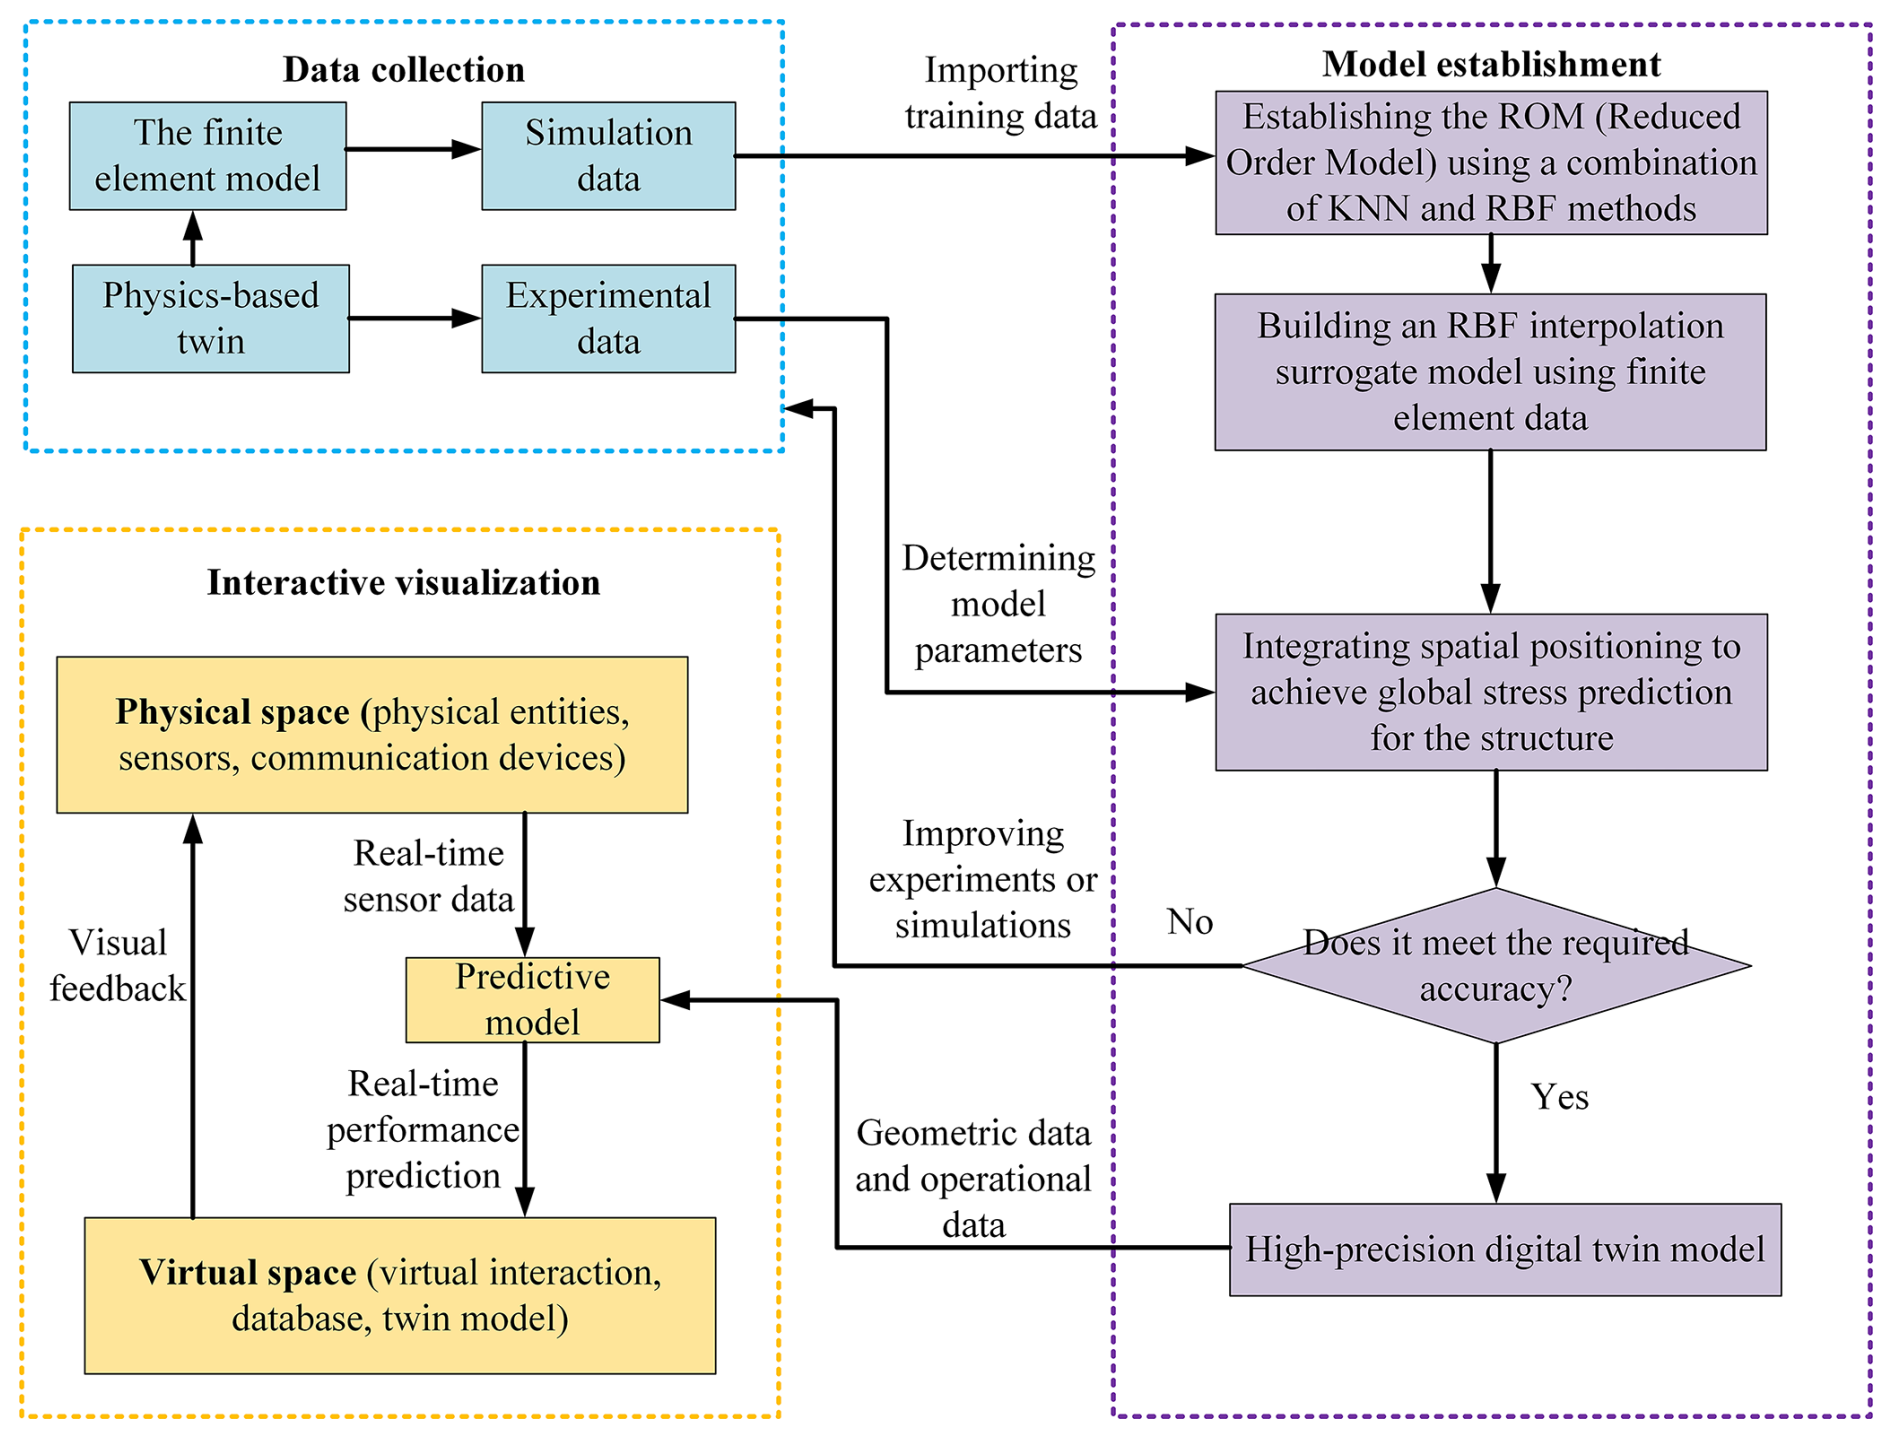
To address the computational expense of traditional analysis models, surrogate models have become a widely applied method. Compared to polynomial response surfaces and Kriging models, the RBF interpolation surrogate model offers both superior computational efficiency and approximation accuracy, presenting broad potential for various applications (Qi et al., 2021). The process for constructing the RBF surrogate model is illustrated in Fig. 7.
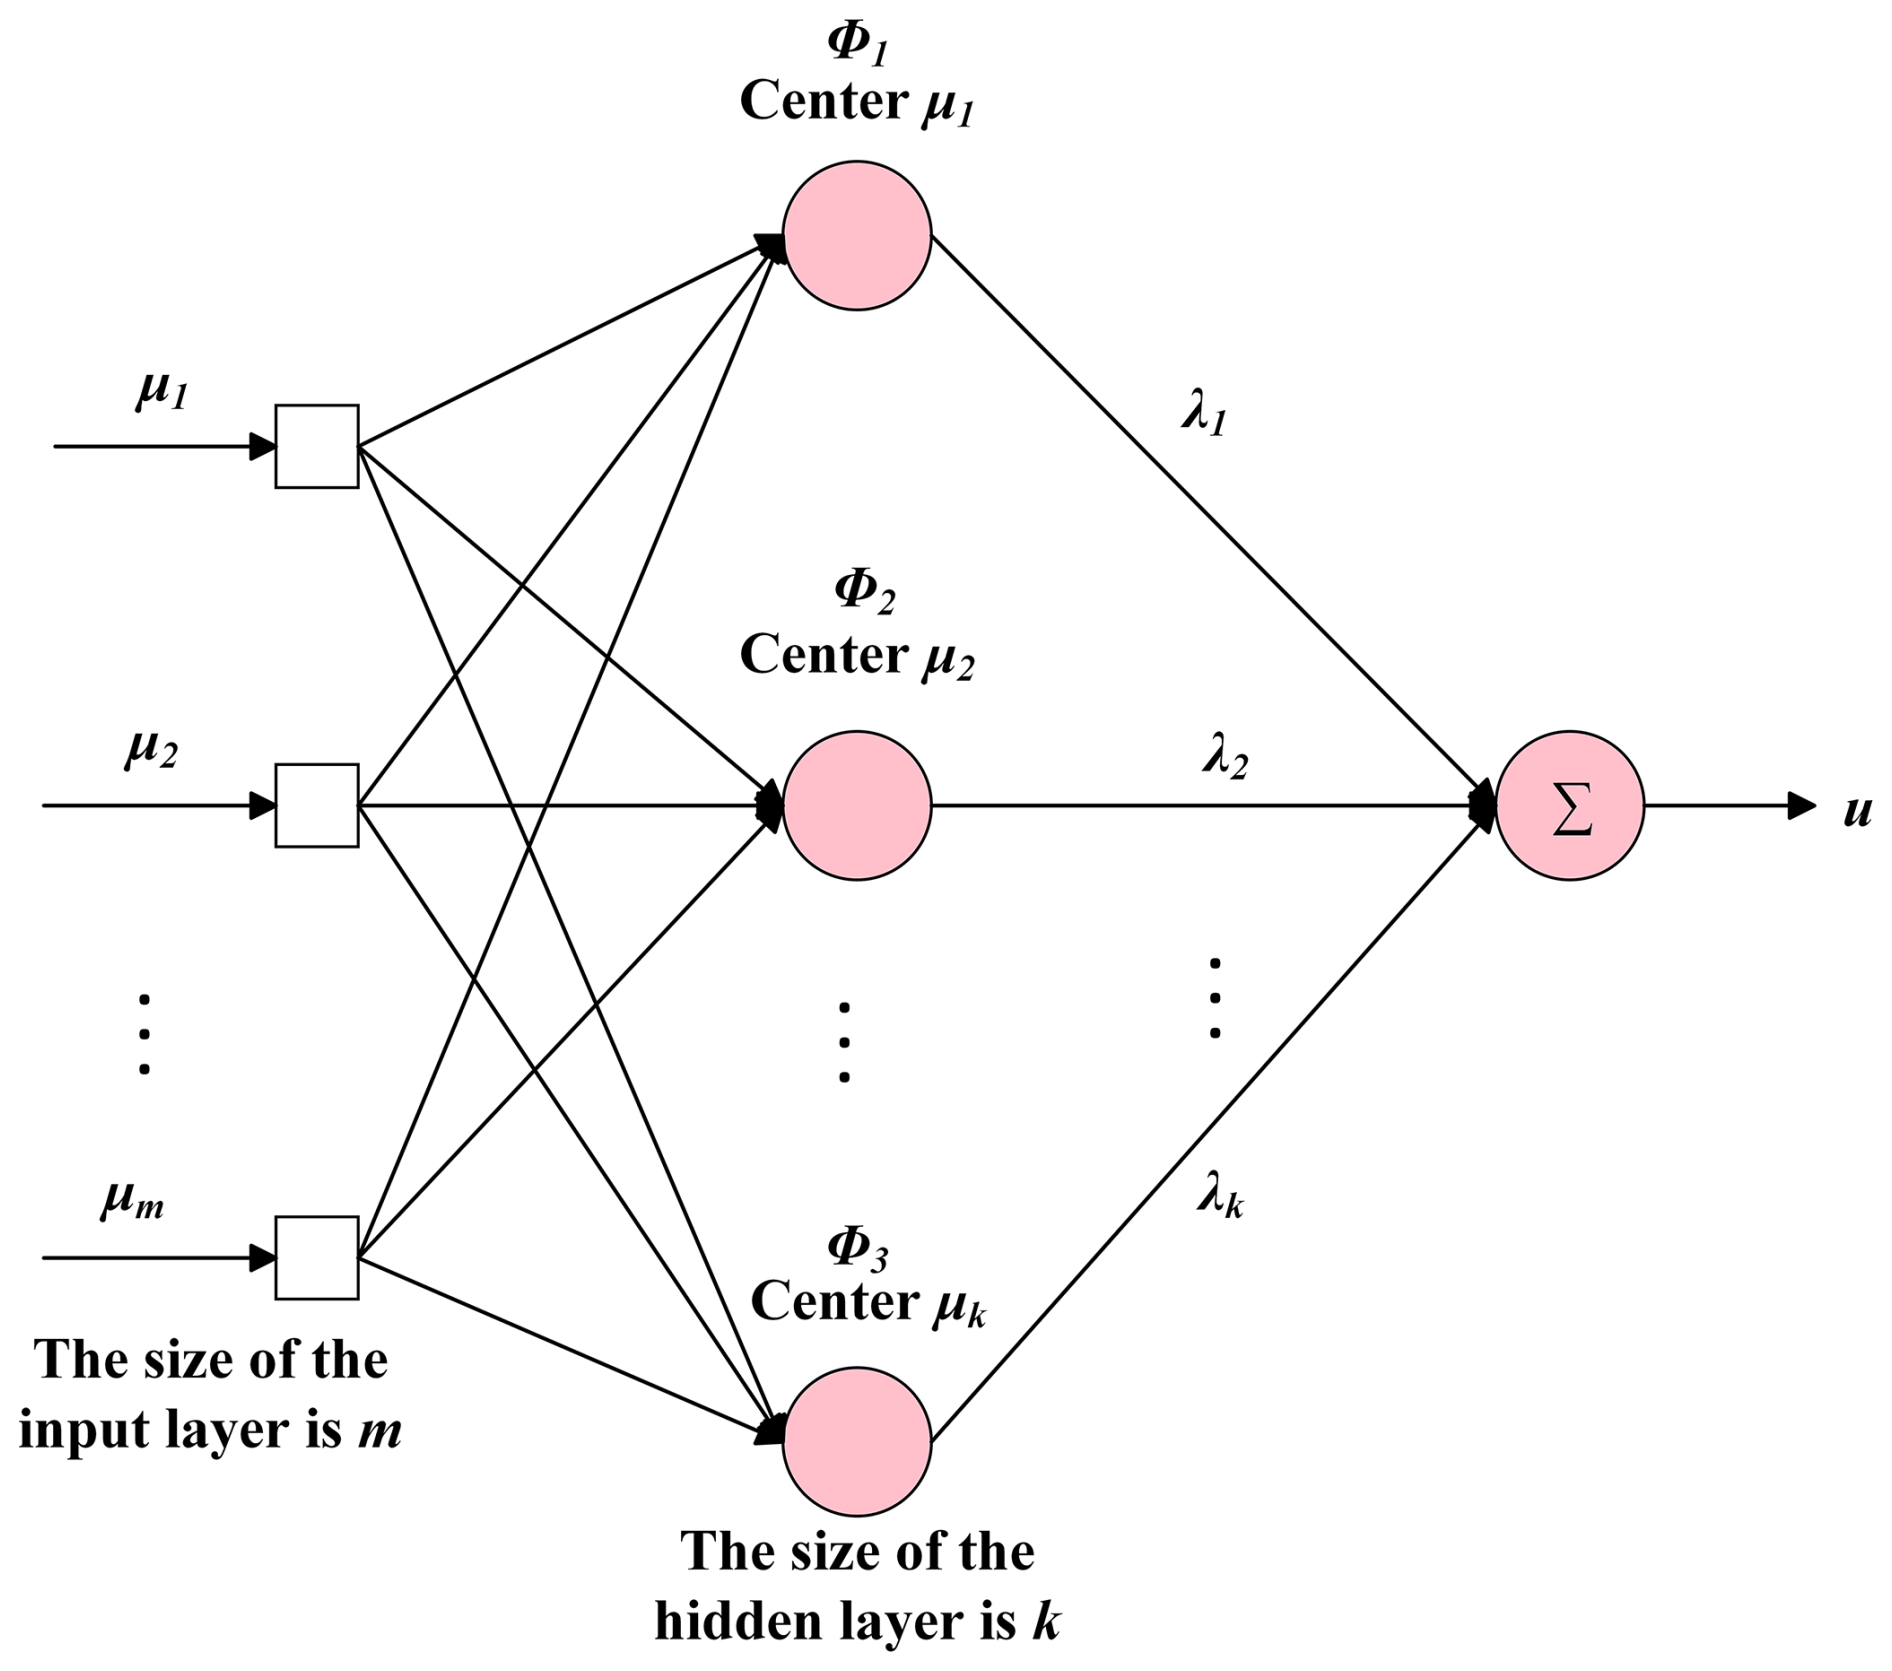
The basic principles of RBF include three main components: the input layer, the hidden layer, and the output layer. Its network structure is illustrated in Fig. 8.
-
Input layer. The input is the operating-condition parameter vector μ, which consists of two feature parameters, the loading position and the load magnitude. A total of 55 sets of sample data under different operating conditions were used.
-
Hidden layer. The hidden layer is the core component of the RBF network. It contains 55 center points (corresponding to the 55 sets of training-condition samples), each associated with a Gaussian kernel function. The Gaussian function was employed as the activation function. The general form of the activation function is as follows:
In the formula, is the Euclidean distance between the input data μ and the basis function center c, and σ is the width parameter that influences the shape of the function.
-
Output layer. The output is the nodal equivalent stress value u. The ROModel contains 15 204 nodes. A separate RBF interpolation model was trained for each node, resulting in a total of 15 204 RBF interpolation models. Each model corresponds to one row of data in the stress matrix Y (i.e., the stress values of a single node across all operating conditions), and all were saved as .pkl files. Each RBF model interpolates and predicts the stress output of its corresponding node for a given input operating-condition parameter μ based on which it estimates the stress at other μ values. The output function is as follows:
where λi is the weight coefficient, and ϕi(μ) is the output of the i-th RBF basis function.
-
Model training. Firstly, the nodal stress data derived from reduced-order mesh processing were read and assigned to the stress matrix Y. The minimum and maximum values of Y were then printed to verify the validity of its data range. Secondly, the rbf_training function was invoked to iterate over each row of Y (the number of iterations equals the number of ROModel nodes), where an RBF model is trained in each iteration using the parameter samples μ (55 operating-condition parameters) and the stress values of the current row. Thirdly, all trained models were stored in a list, serialized, and saved as the RBF surrogate model .pkl file to complete the model training.
When applying the model to digital-twin visualization, multiple validations are required to assess the model's accuracy. If the prediction accuracy does not meet the requirements, the interpolation model's construction method needs to be improved until the stress prediction error falls within an acceptable range.
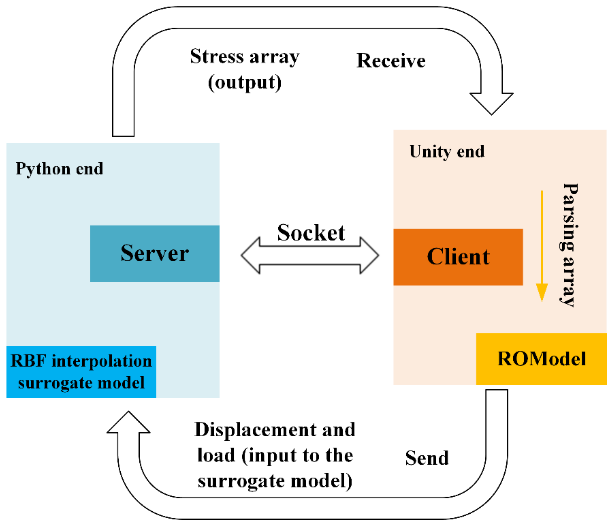
As shown in Fig. 9, a socket server was created on the Python side, bound to the IP address “127.0.0.1” and port “8000”, and it began listening for connection requests. When a connection request was received, a new thread was created to handle the connection, allowing the server to manage multiple client connections simultaneously. The function RBF_pre was used to obtain displacement values x_pre and load values p_pre, followed by deserialization of the surrogate model to predict stresses at all nodes. The prediction results were sent back to the client via the fea function. Both RBF_pre and fea were custom functions created to achieve specific tasks.
A Socket client was similarly created on the Unity side, with the IP and port number matching those of the server. A script named fea was created that used the send and receive methods of the Socket class to exchange data with the server. The information sent included the beam position and load weight variables for deserialization. In contrast, the received information consisted of the node data of the ROModel used to construct the stress contour map.
Under conditions of arbitrary loads and load application positions, the stress at random nodes of the main truss is predicted. The stresses at all nodes, obtained through the ROModel trained by the surrogate model, are rendered and visualized in Unity3D software using the HSV color model, resulting in a real-time stress cloud diagram, as shown in Fig. 10. It illustrates a comparison between the stress cloud diagram rendered in Unity3D and the stress cloud diagram of the truss computed by Workbench finite-element analysis.
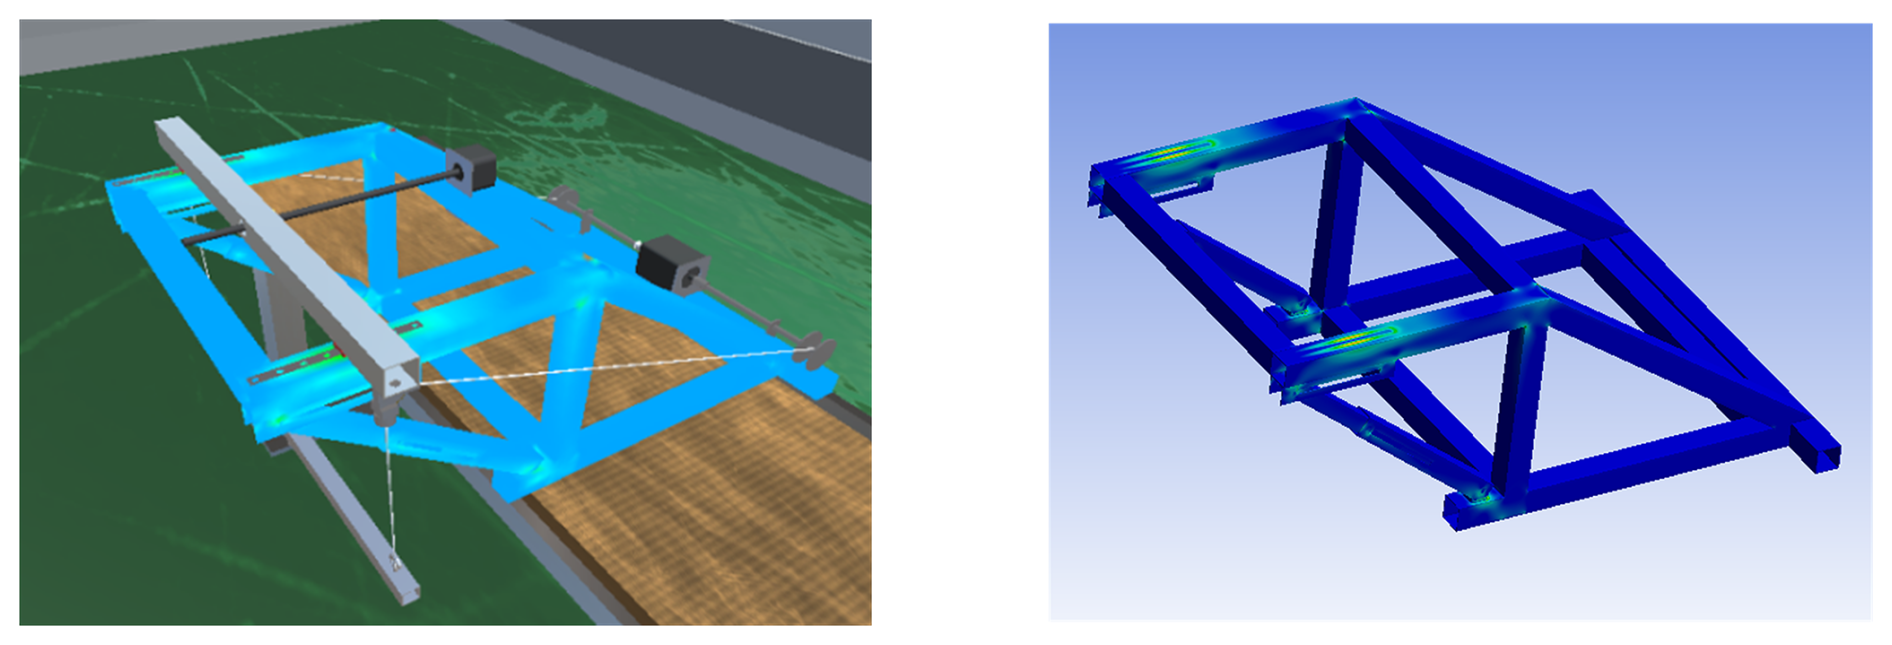
Figure 10Comparison of stress cloud maps in Unity3D rendering and workbench finite-element stress cloud maps.
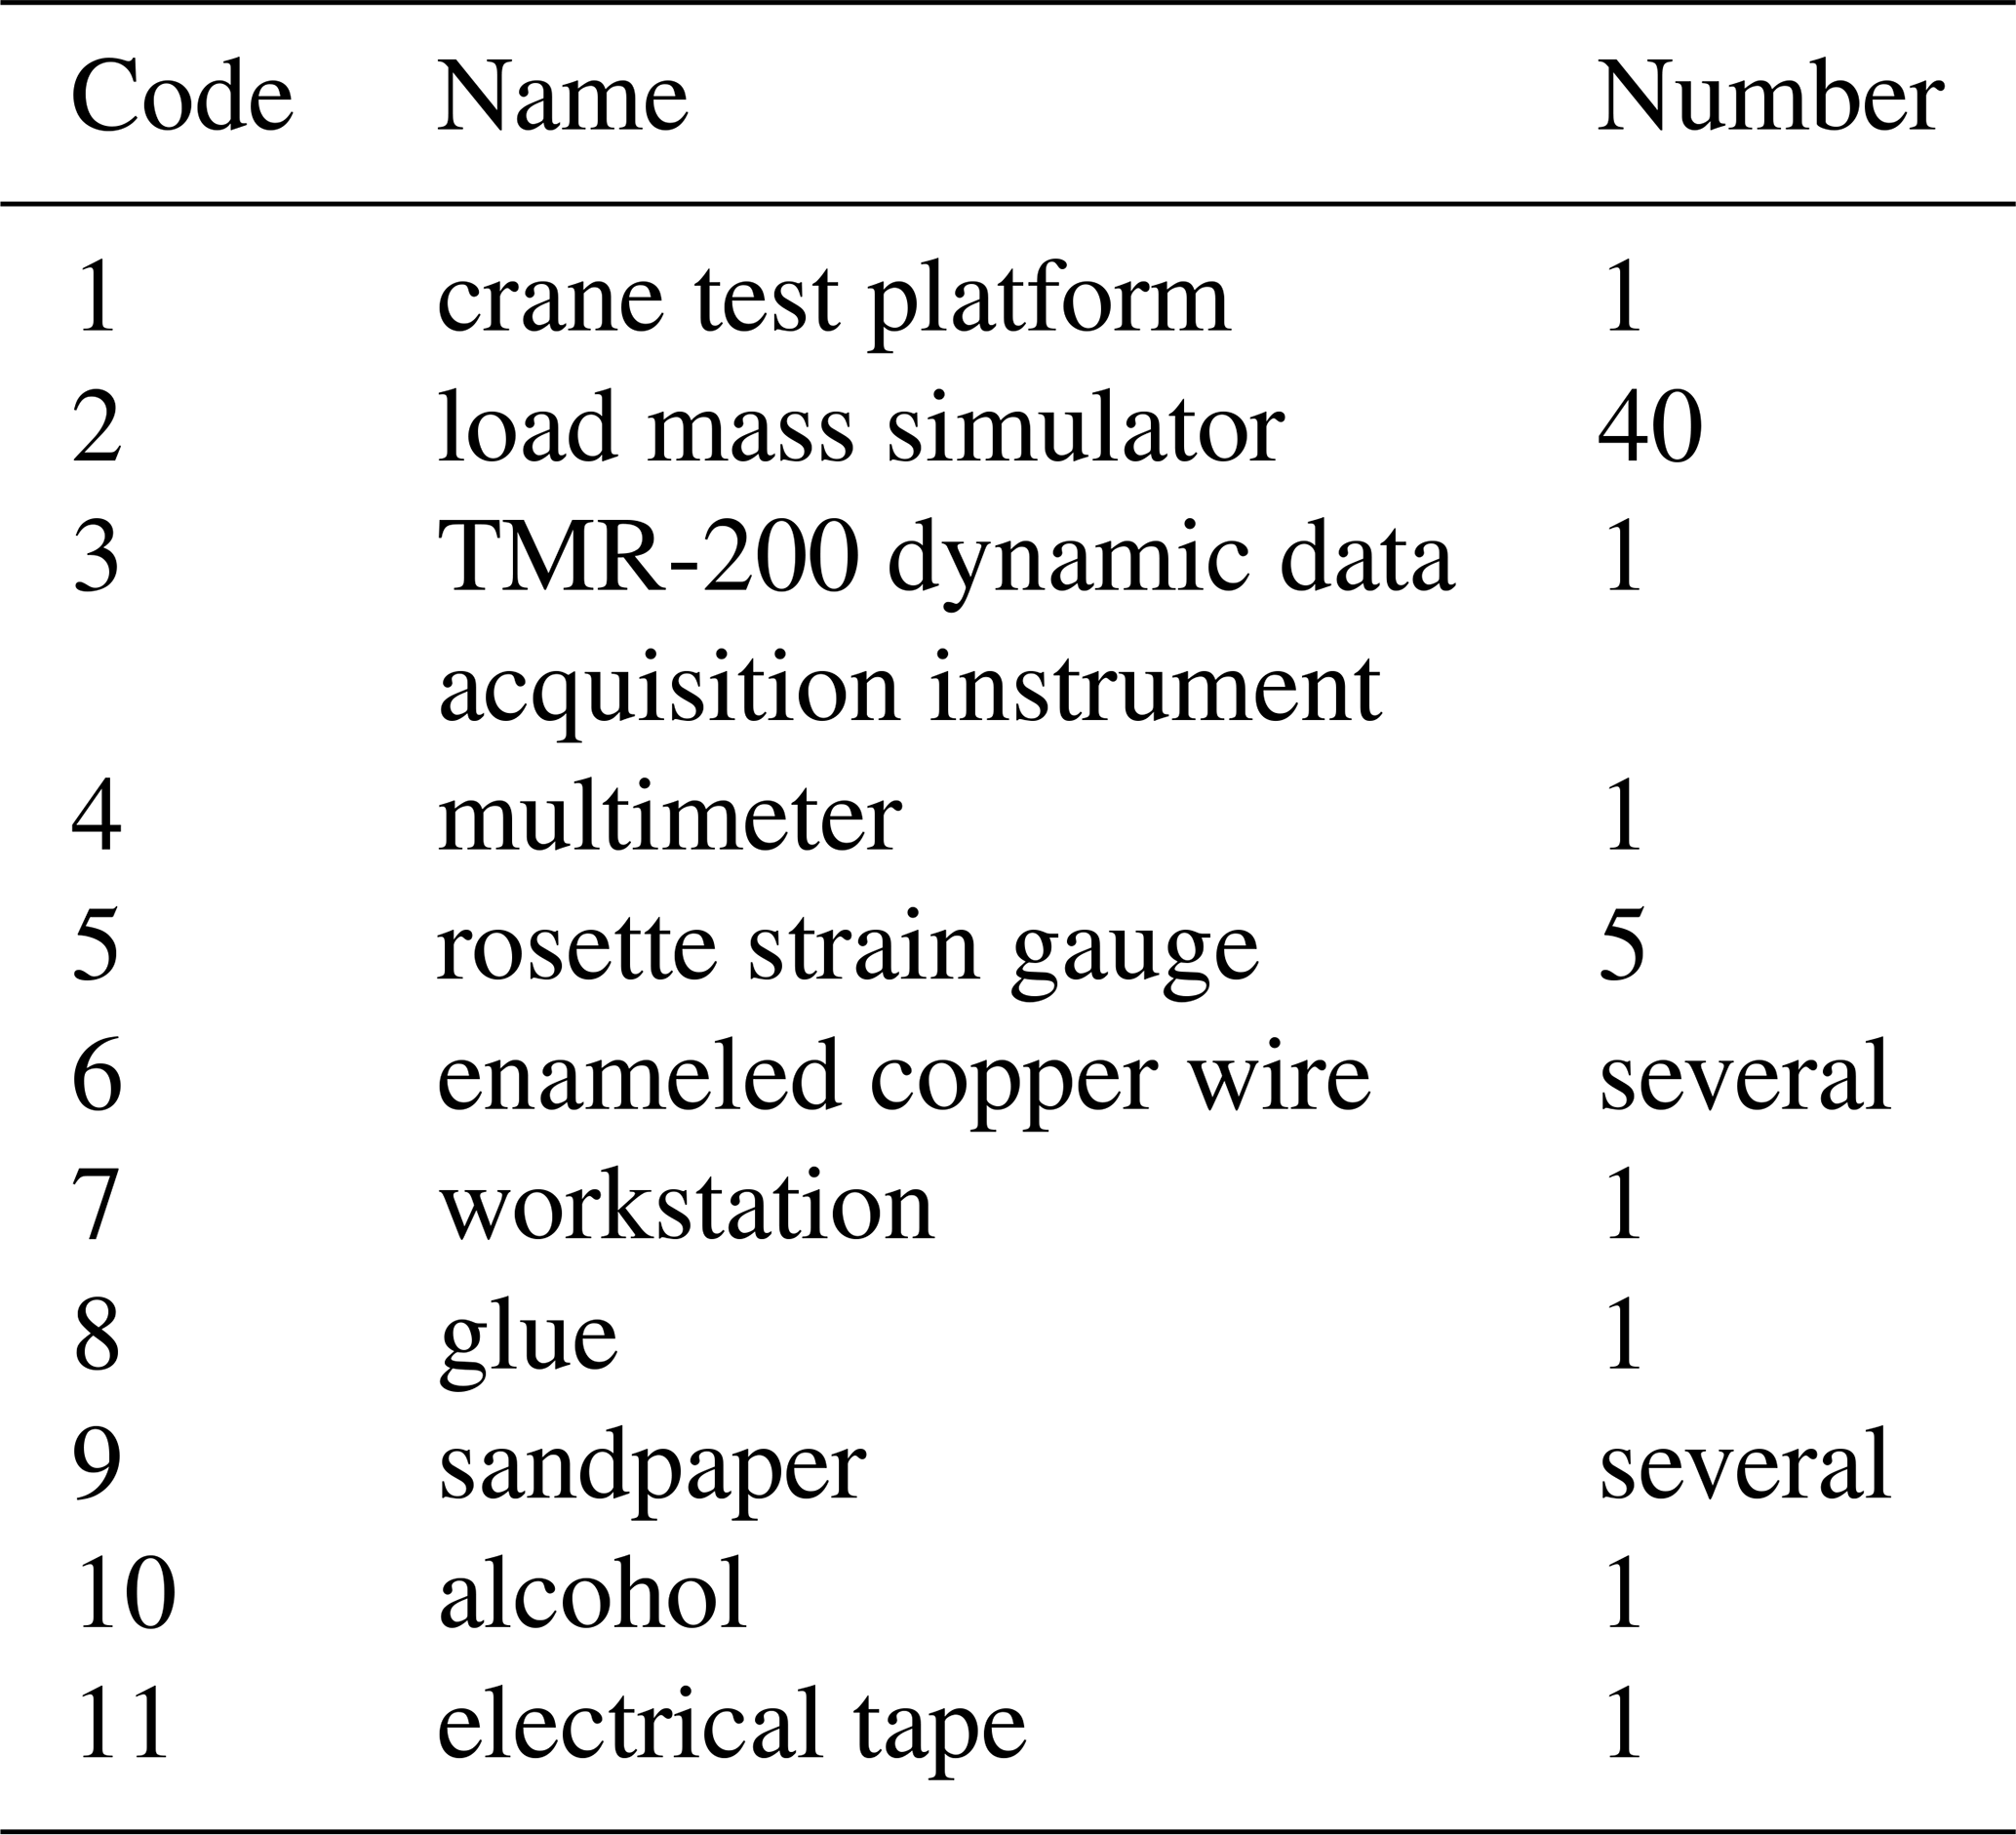
To validate the accuracy of the interpolated surrogate model's stress contour maps, comparisons were made among stress results predicted by the surrogate model, those calculated by finite-element software, and strain gauge measurements (Bose et al., 2020; Montero et al., 2011). The experimental equipment required for this study is listed in Table 4.
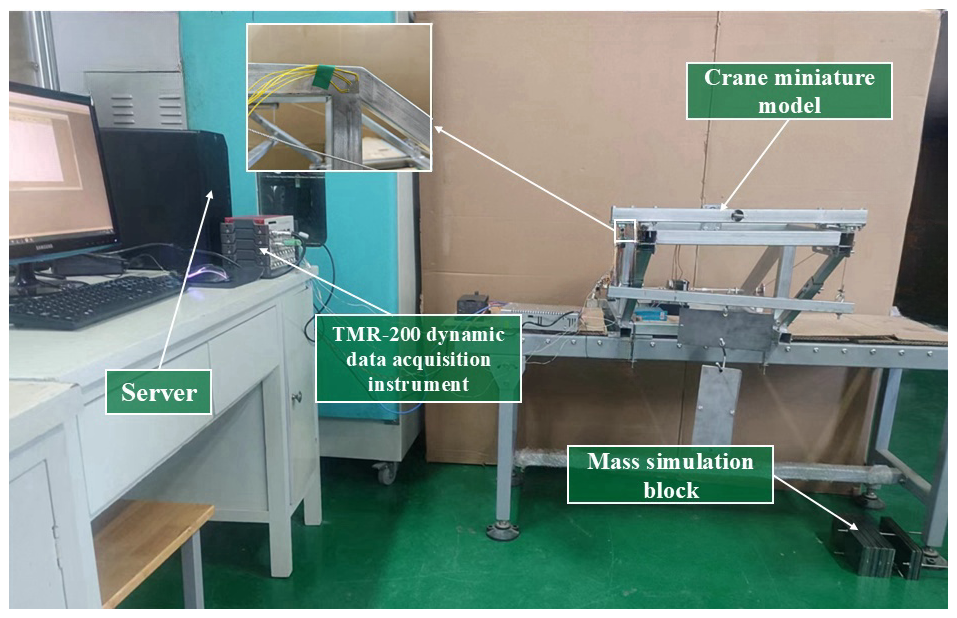
Based on the finite-element analysis results, the positions for strain gauge placement on the main truss structure of the scaled crane were selected. Subsequently, the chosen locations were prepared by polishing and cleaning with alcohol. After applying adhesive to the strain gauge, it was attached to the surface, and the wires were secured. The condition of the strain gauge is illustrated in the enlarged view shown in Fig. 11.
As shown in Fig. 11, the strain data were collected using the TMR-200 dynamic data acquisition system, which the laboratory procured. The strain gauge's wires were connected to the measurement channels of the strain gauge instrument. Data were collected under load conditions of 5, 10, and 15 kg. To ensure accuracy, the data collection was repeated three times for each load and position combination, thereby ensuring the reliability of the experimental results.
The selection of 5, 10, and 15 kg as the three loading conditions for experimentation was based on the following considerations. First, excessively high loads were avoided to prevent plastic deformation at the welded joints, which could cause irreversible damage to the experimental model and compromise test repeatability. Second, the chosen loads of 5, 10, and 15 kg provided a sufficient safety margin and correspond to low, medium, and high load levels, respectively. This uniform incremental step loading helped prevent abrupt stress variations that may arise from excessively large load increments. Third, these load levels were sufficient to induce clearly detectable, accurately measurable strain signals on the main truss of the scaled model, thereby effectively validating the model's response capability and predictive stability under varying load conditions. Finally, loads of 5, 10, and 15 kg facilitated operation and experimental replication, thereby ensuring the reliability of the acquired data.
A resistive strain gauge was used to measure surface strain on the structure. For materials such as steel, which exhibit linear elasticity, Hooke's law can be applied to describe the relationship between strain and stress:
where σ is the stress, ε is the strain, and E is the modulus of elasticity.
This study used a 45° rosette strain gauge to collect data, and the principal stresses were calculated from the triaxial strain measurements (Liu, 2023).
The equivalent stress was then calculated using the fourth strength theory.
In the equation, δs represents the equivalent stress; εa, εb, and εc are the strain measurements; μ is Poisson's ratio; and σ1, σ2, and σ3 are the first, second, and third principal stresses, respectively. Based on the plane stress assumption (Sulwinski and Johnston, 2023), σ3=0.
After substituting the measured strain data into the formula, the resulting stress values were compared with the finite-element analysis results and the surrogate model's interpolated results. Figures 12, 13, and 14 show the comparison results for different operating conditions.
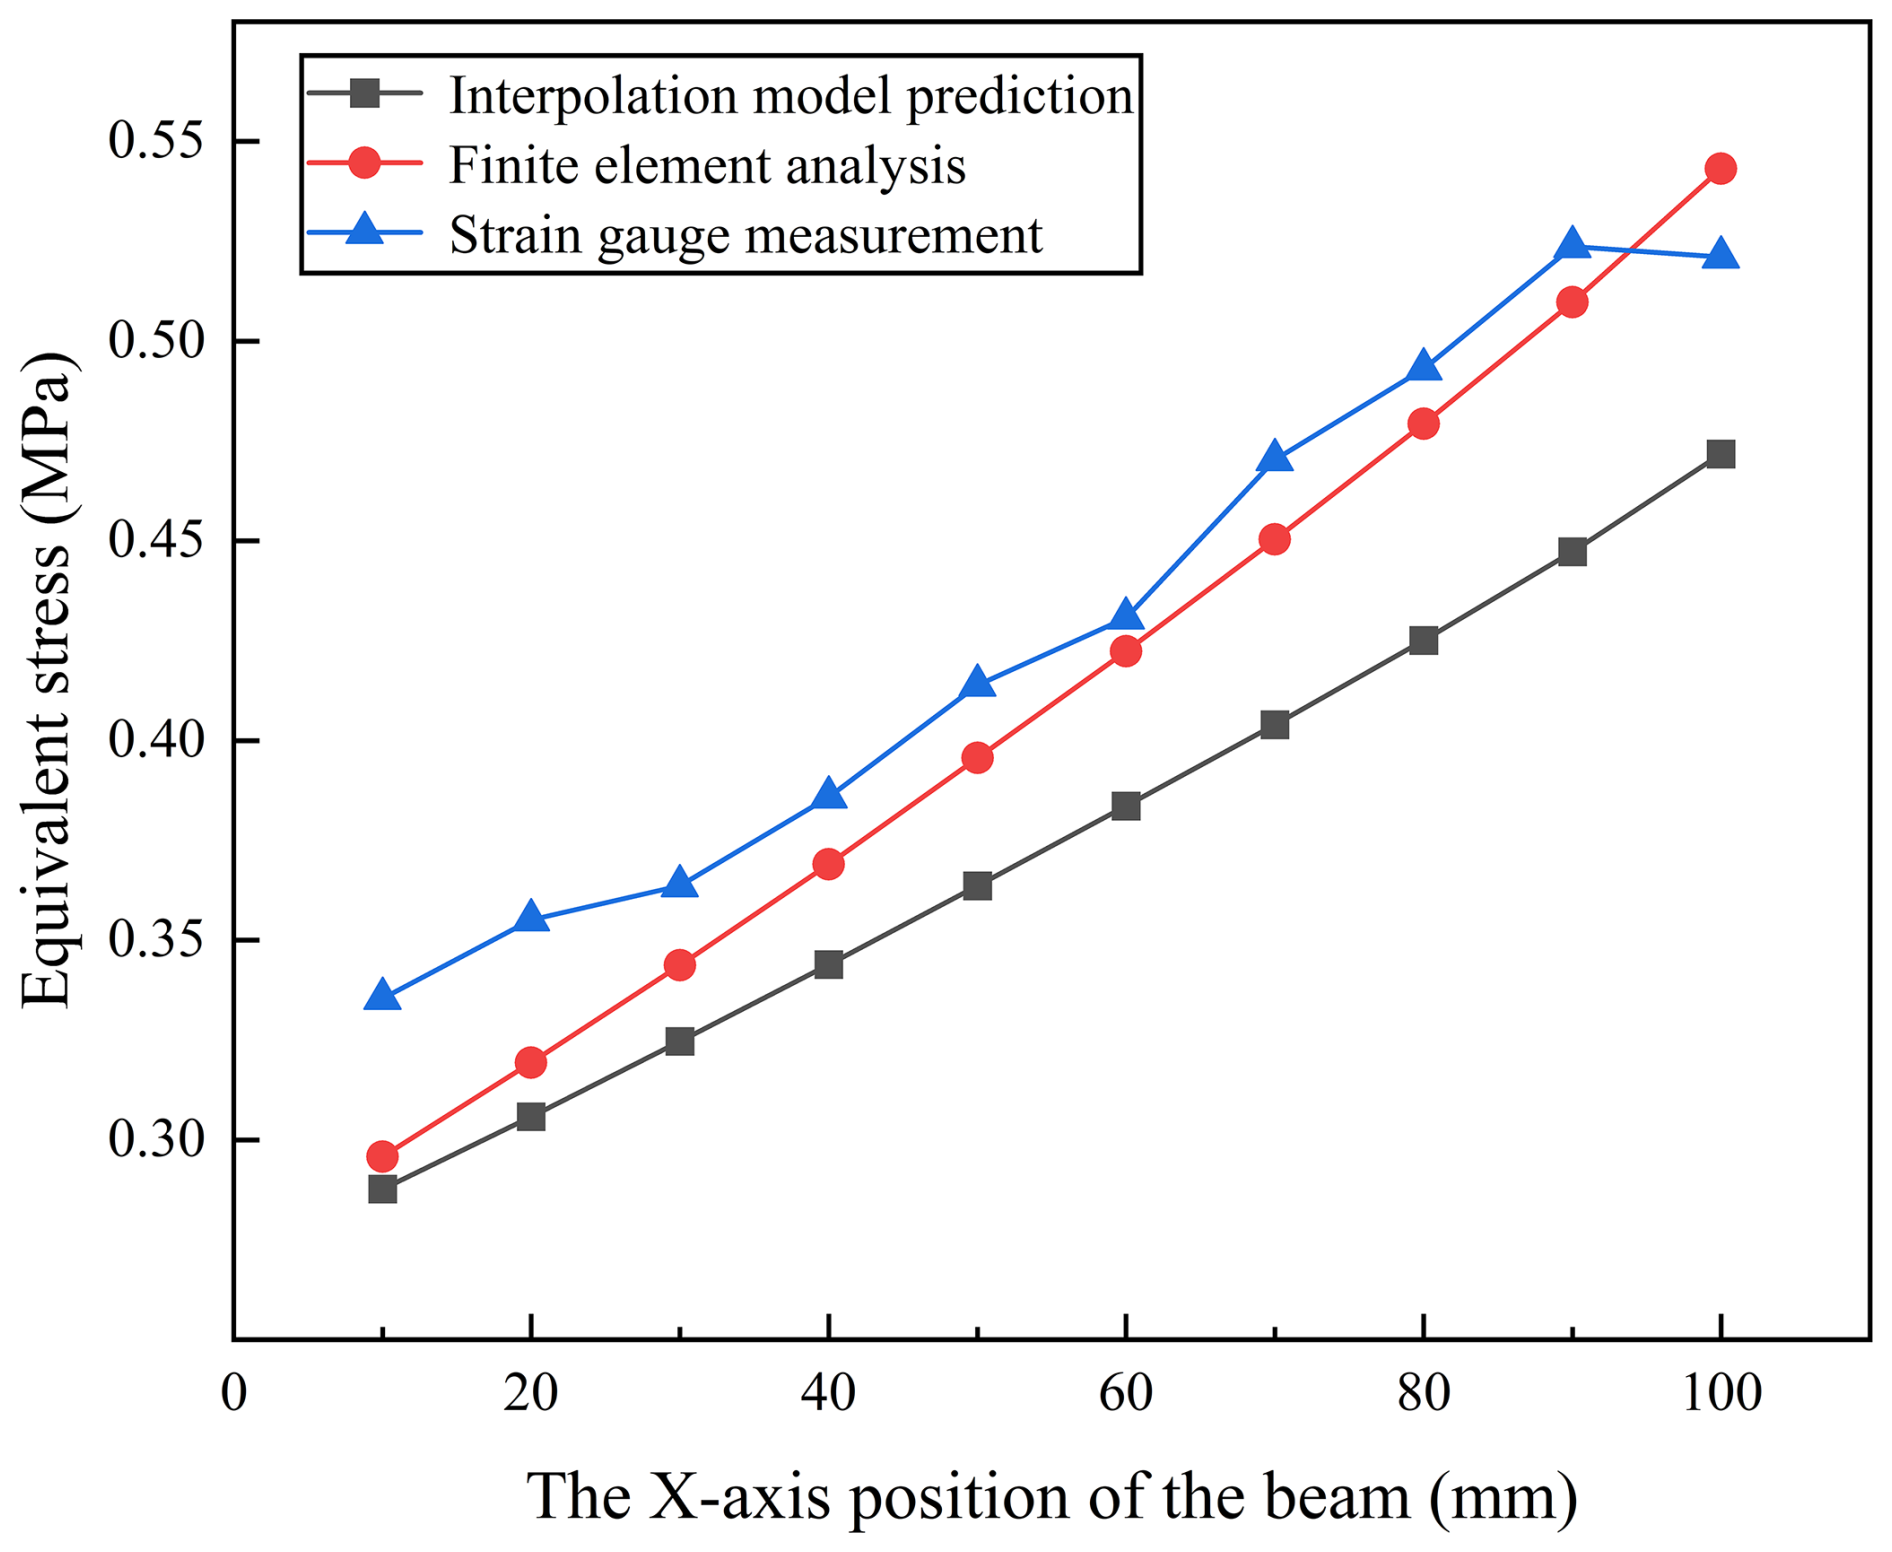
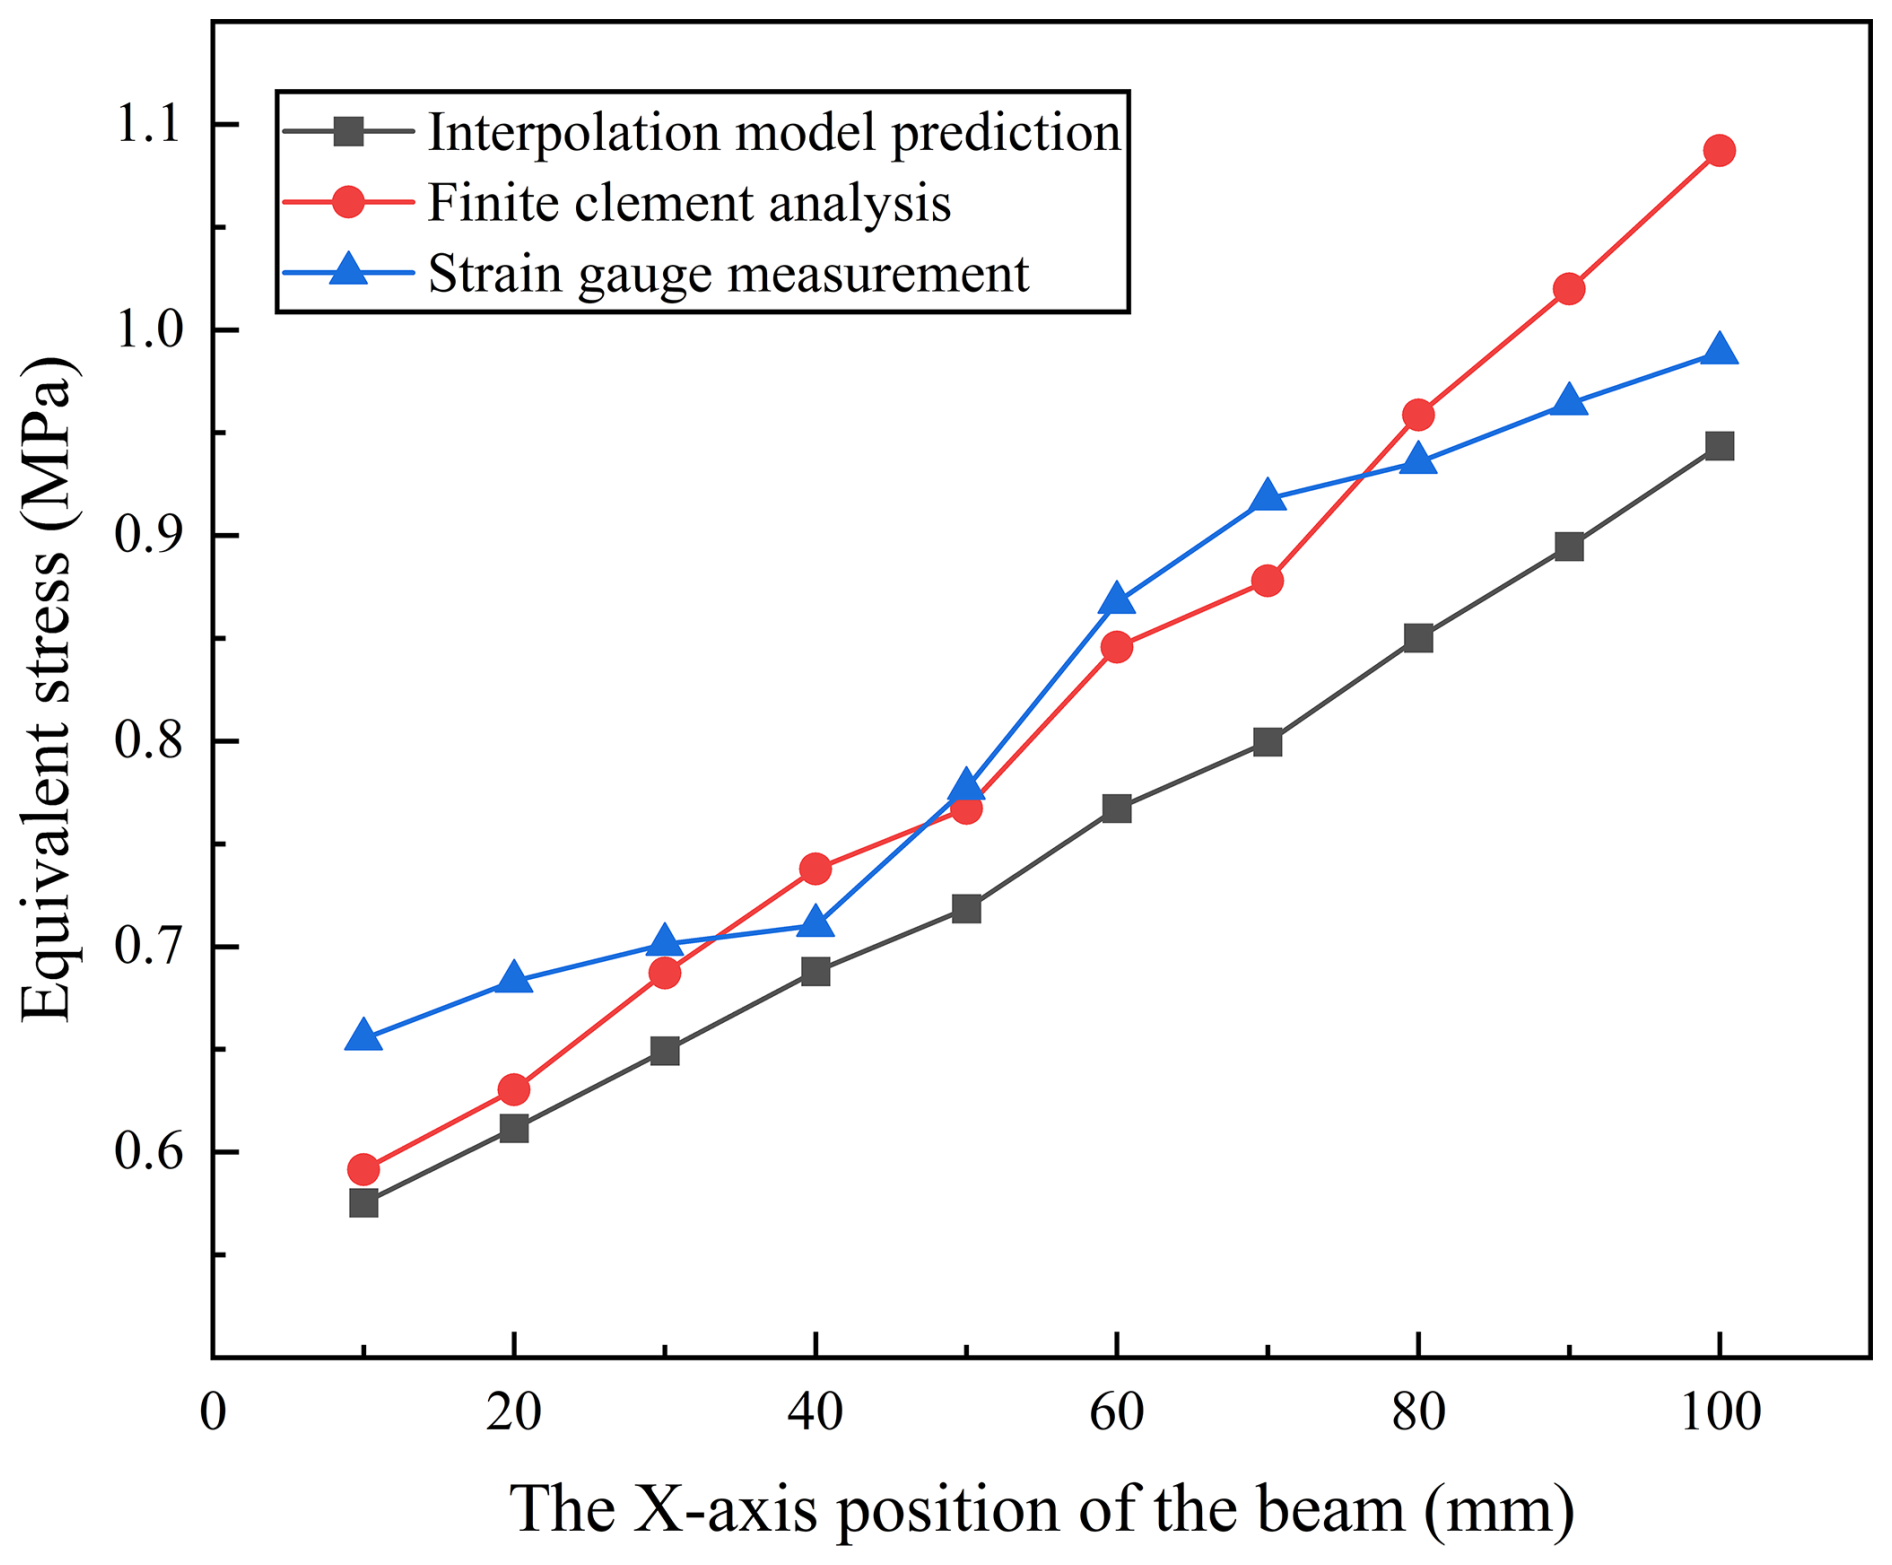
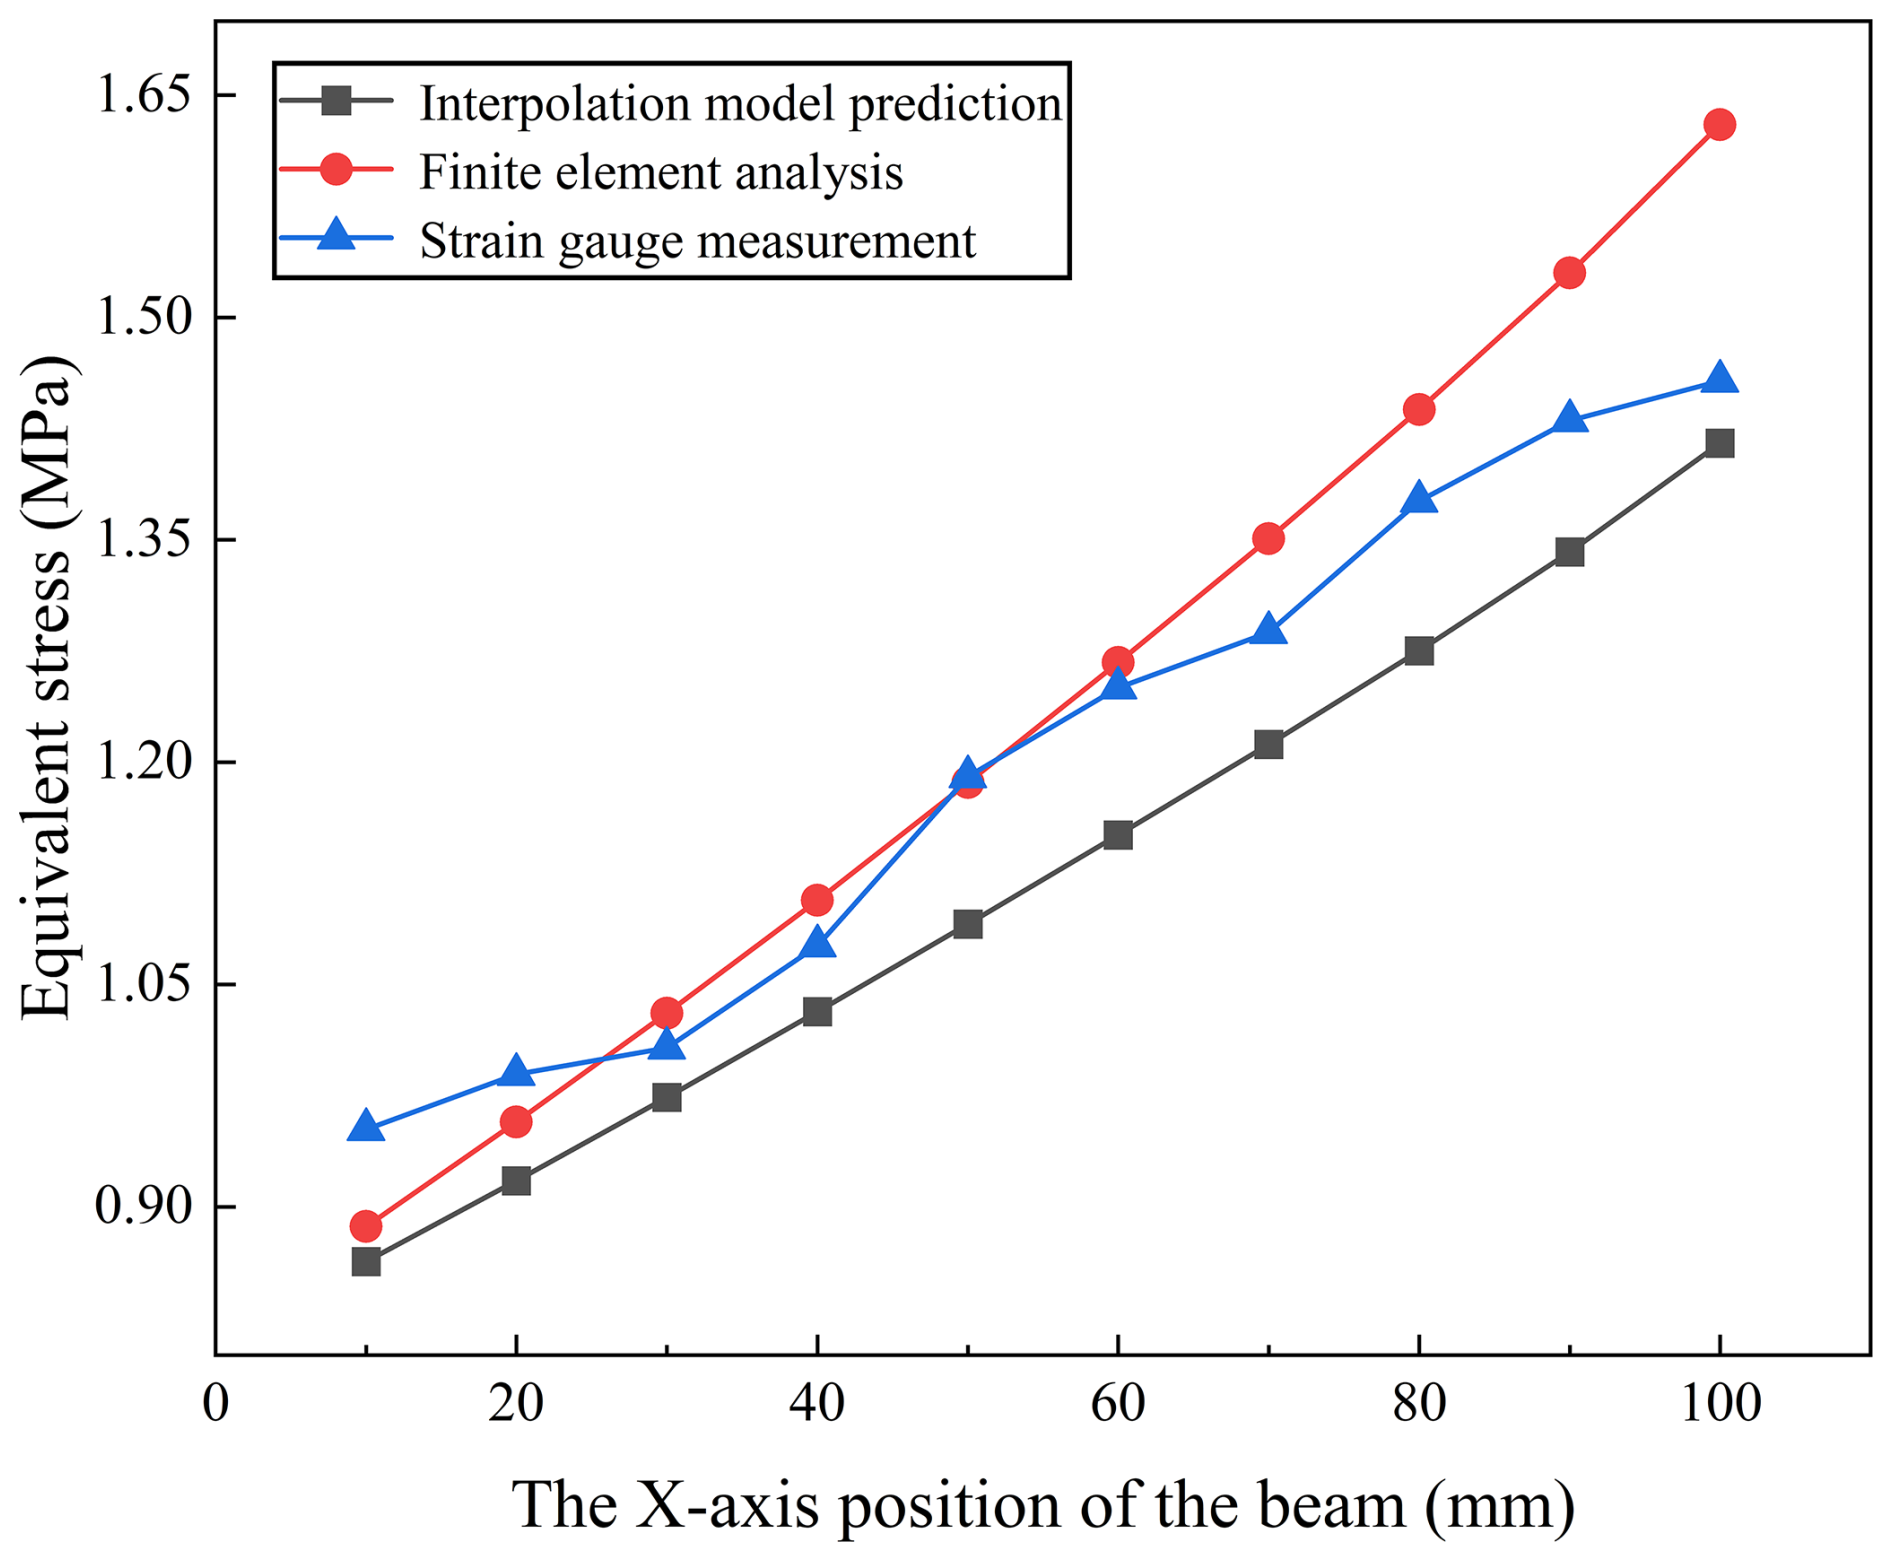
Based on the comparison results shown in the figure above, the stress curves obtained from the three methods show a generally consistent trend. The relative errors of the average stress values predicted by the RBF interpolation model under 5, 10, and 15 kg load conditions, compared to the finite-element analysis results, were 8.36 %, 7.93 %, and 8.58 %, respectively. When comparing the average errors from the RBF surrogate model with the strain gauge measurements, the relative errors were 12.5 %, 9.78 %, and 7.6 %. During the actual measurement process, the accuracy of the finite-element model, installation errors of the scaled crane, and the strain gauge installation method can also contribute to measurement errors. However, the maximum error remains within 15 %, indicating that the overall error was relatively stable.
As observed in the comparative results, the model predictions were consistently lower than both the finite-element solutions and the measured stress values. This discrepancy primarily arose from two contributing factors. First, to meet the computational efficiency required for real-time rendering, model order reduction was applied to the finite-element model, and interpolation was performed using a Gaussian radial basis function. While this process compresses data and ensures continuous, smooth results, it inherently suppresses local stress peaks, leading to predictions that were lower than the high-precision finite-element simulation results. Second, in the actual simplified crane test bench, slight clearances in the connectors introduced contact nonlinearity, inducing stress concentration near the clearances and increasing the local stress response. Meanwhile, welding residual stresses superimpose on external load stresses, which may have led to a slight increase in the measured total stress in certain areas. Consequently, the predicted values following the simulation baseline were lower than the measured values.
To address the systematic deviation between predicted values and finite-element simulation results, a lightweight residual-correction model could be developed. This model would learn the underlying error patterns between predictions and simulations and perform real-time compensation accordingly. Furthermore, to improve the model's performance in real physical environments, its predictive capability in critical regions could be enhanced by incorporating a small amount of high-precision finite-element simulation data or measured data for localized refinement.
The emergence of the digital-twin concept is closely linked to the developments in Industry 4.0, the Internet of Things (IoT), and big-data technologies. These advancements have driven transformative changes in smart manufacturing, enabling companies to monitor and optimize the performance of physical assets in real time through virtual models. In modern industry, digital-twin technology is widely applied across sectors such as manufacturing, energy, and aerospace, helping enterprises achieve predictive maintenance, optimize production processes, and manage resources effectively. By utilizing simulation and modeling, companies can test various strategies in a virtual environment to reduce costs and enhance efficiency. This study presented a comprehensive process for implementing real-time dynamic stress monitoring of industrial cranes using digital-twin technology. The following tasks were specifically completed.
Firstly, a scaled physical crane model and a corresponding digital twin were established to achieve virtual–physical synchronization of the crane's operational states. The delay of the crane twin system fluctuates around 100 ms, meeting the design requirement of staying below 500 ms; the lifting-height deviation between the physical and digital models was within 2 mm, and the maximum deviation in beam displacement did not exceed 0.3 mm, demonstrating good real-time synchronization.
Secondly, a finite-element model of the main truss was developed to monitor its stress during crane operation. Based on this model, a reduced-order model of the main truss was constructed, and an RBF interpolation surrogate model was developed to predict the nodal stresses of the reduced-order model. The surrogate model was implemented using the Unity3D virtual engine to render the scaled crane's main truss nodes in real time, enabling stress prediction within the digital twin.
Finally, using an experimental test platform, the results showed that the average error between the finite-element analysis results and the stress-rendering results was 8.29 %. In comparison, the average error between the measured data and the stress-rendering results was 9.98 %. With an average error of less than 15 %, the approach effectively met the real-time stress-monitoring requirements for the crane, marking a substantial advancement from monitoring external appearance to intrinsic properties and significantly reducing monitoring costs. The approach expanded stress visualization from one-dimensional to three-dimensional, providing a more intuitive representation of the global stress distribution in the crane's main truss.
The data cannot be made publicly available upon publication because they contain commercially sensitive information. However, the data may be made available by the corresponding author upon reasonable request and with permission from the relevant parties.
GP Yan: writing (original draft), methodology, formal analysis, data curation, conceptualization. XW Yang: writing (review and editing), formal analysis, visualization, software. JS Zhang: validation, formal analysis, data curation. Q Tao: writing (review and editing), supervision, funding acquisition. Y Li: funding acquisition.
The contact author has declared that none of the authors has any competing interests.
Publisher's note: Copernicus Publications remains neutral with regard to jurisdictional claims made in the text, published maps, institutional affiliations, or any other geographical representation in this paper. The authors bear the ultimate responsibility for providing appropriate place names. Views expressed in the text are those of the authors and do not necessarily reflect the views of the publisher.
The authors thank the editors and reviewers for their efforts.
This research was supported by the Scientific Research Foundation for Doctoral Program of Hubei University of Technology (grant no. XJ2022001001), the Hubei Provincial Technical Innovation Project (Major Project) (grant no. 2022BEC012), the Hubei Province Support Project for Technological Innovation and Development of Enterprises (High-tech Enterprises) of China (grant no. 2021BAB010), the Wuhan Science and Technology Achievement Transformation Project (grant no. 2024030803010163), the 2024 Wuhan Metropolitan Circle Collaborative Innovation Science and Technology Project of China (grant no. 2024070904020435), and the Scientific Research Program Project of the Education Department of Hubei Province (grant no. Q20241401).
This paper was edited by Pengyuan Zhao and reviewed by two anonymous referees.
Baiges, J., Codina, R., Castanar, I., and Castillo, E.: A finite element reduced-order model based on adaptive mesh refinement and artificial neural networks, Int. J. Numer. Meth. Eng., 121, 588–601, https://doi.org/10.1002/nme.6235, 2019.
Bao, W. X. and Hu, G. P.: Design and implementation of real-time communication mechanism based on WebSocket, Comput. Dig. Eng., 47, 1836–1840, https://doi.org/10.3969/j.issn.16729722.2019.07.055, 2019.
Barbie, A. and Hasselbring, W.: From digital twins to digital twin prototypes: concepts, formalization, and applications, IEEE Access., 12, 75337–75365, https://doi.org/10.1109/ACCESS.2024.3406510, 2024.
Bose, A. K., Zhang, X., Maddipatla, D., Masihi, S., Panahi, M., Narakathu, B. B., Bazuin, B. J., Williams, J. D., Mitchell, M. F., and Atashbar, M. Z.: Screen-printed strain gauge for micro-strain detection applications, IEEE Sens. J., 20, 12652–12660, https://doi.org/10.1109/JSEN.2020.3002388, 2020.
Chen, Q.: Surface crack detection of large-scale crane based on convolutional neural network, Nanjing University of Posts and Telecommunications, (04), https://doi.org/10.27251/d.cnki.gnjdc.2021.001285, 2021.
Cui, P., He, X. W., Guo, Y. F., Qiao, J. Q., Li, G., and Song, X. G.: Lightweight design of elevator pulley based on RBF surrogate model, Machinery Design, 39, 6–14, https://doi.org/10.13841/j.cnki.jxsj.2022.08.009, 2022.
Gao, P., Wang, Z., Zhang, Y., and Li, M.: Prediction system for overhead cranes based on digital twin technology, Appl. Sci., 13, 4696, https://doi.org/10.3390/app13084696, 2023.
He, X. W., Lai, X. N., Yang, L. L., Zhang, F., Zhou, D. C., Song, X. G., and Sun, W.: M-LFM: a multi-level fusion modeling method for shape-performance integrated digital twin of complex structure, Front. Mech. Eng., 17, 52, https://doi.org/10.1007/s11465-022-0708-0, 2022.
Hong, J. W., Roh, M. I., Ham, S. H., and Ha, S.: Dynamic simulation of subsea equipment installation using an offshore support vessel based on flexible multi-body system dynamics, J. Mar. Sci. Tech., 24, 807–821, https://doi.org/10.6119/JMST-016-0323-1, 2016.
Huang, F.: Analysis of dynamic load during lifting of single crane, Petrol. Chem. Equip., 25, 20–24, https://doi.org/10.3969/j.issn.16748980.2022.08.005, 2022.
Lai, X. N., Wang, S., Guo, Z. G., Zhang, C., Sun, W., and Song, X. G.: Designing a shape-performance integrated digital twin based on multiple models and dynamic data: a boom crane example, J. Mech. Design, 143, 071703, https://doi.org/10.1115/1.4049861, 2021.
Lai, X. N., He, X. W., Wang, S., Wang, X. B., Sun, W., and Song, X. G.: Building a lightweight digital twin of a crane boom for structural safety monitoring based on a multi-fidelity surrogate model, ASME. J. Mech. Des. 144, 064502, https://doi.org/10.1115/1.4053606, 2022.
Lalik, K., Dominik, I., Ćwiąkała, P., and Kwasniewski, J.: Integrated stress measurement system in tower crane mast, Measurement, 102, 47–56, https://doi.org/10.1016/j.measument.2017.01.041, 2017.
Levesley, J.: Approximation using Gaussian radial basis functions at different scales, AIP Conference Proceedings, 2293, 5, https://doi.org/10.1063/5.0027100, 2022.
Li, Y.: Stress analysis and damage identification method of box-type crane boom, Beijing University of Chemical Technology, (06), https://doi.org/10.7666/d.Y2628900, 2015.
Lin, Z. B.: Modeling simulation and process monitoring technology of virtual-to-real-time synchronization mapping for automated test unit execution, Nanjing University of Science and Technology, (06), https://doi.org/10.27241/d.cnki.gnjgu.2019.000623, 2019.
Liu, Z. S., Meng, X. T., Xing, Z. Z., and Jiang, A. T.: Digital twin-based safety risk coupling of prefabricated building hoisting, Sensors, 21, 3583, https://doi.org/10.3390/s21113583, 2021.
Liu, J. C.: Mechanical performance analysis and structural optimization of telescopic boom forklift boom, Dalian University of Technology, (02), https://doi.org/10.26991/d.cnki.gdllu.2022.000890, 2023.
Moi, T., Cibicik, A., and Rølvåg, T.: Digital twin-based condition monitoring of a knuckle boom crane: an experimental study, Eng. Fail. Anal., 112, 104517, https://doi.org/10.1016/j.engfailanal.2020.104517, 2022.
Montero, W., Farag, R., Diaz, V., Ramirez, M., and Boada, B. L.: Uncertainties associated with strain-measuring systems using resistance strain gauges, The Journal of Strain Analysis for Engineering Design, 46, 1–13, https://doi.org/10.1243/03093247JSA661, 2011.
Ogundeyi, K. E. and Yinka-Banjo, C.: WebSocket in real time application, Nigerian J. Technol., 38, 1010–1020, https://doi.org/10.4314/NJT.V38I4.26, 2019.
Qi, Q. L., Tao, F., Hu, T. L., Anwer, N., Liu, A., Wei, Y. L., Wang, L. H., and Nee, A. Y. C.: Enabling technologies and tools for digital twin, J. Manuf. Syst., 58, 3–21, https://doi.org/10.1016/j.jmsy.2019.10.001, 2021.
Su, H. H.: Research on overall hoisting strength and structural optimization of FPSO living module, Harbin Engineering University, (04), https://doi.org/10.27060/d.cnki.ghbcu.2023.000056, 2023.
Sulwinski, R. and Johnston, R.: Methodology for validation of finite element analysis utilizing strain gauge measurements, ASME 2023 Verification, Validation, and Uncertainty Quantification Symposium, Balti-more, Maryland, USA, 17–19 May, https://doi.org/10.1115/vvuq2023-108749, 2023.
Tao, F. and Qi, Q.: Make more digital twins, Nature, 573, 490–491, https://doi.org/10.1038/d41586-019-02849-1, 2019.
Tao, F., Liu, W. R., Zhang, M., and Hu, T. L.: Five-dimensional model of digital twin and its applications in ten major domains, Comput. Integr. Manuf., 25, 1–18, https://doi.org/10.13196/j.cims.2019.01.001, 2019.
Xia, Y. S.: Strength analysis of overall hoisting of superstructure based on direct calculation method, Sci. Technol. Innovation, 24, 136–139, https://doi.org/10.3969/j.issn.16731328.2023.24.035, 2023.
Xue, K. R.: Research on intelligent collision prevention and warning method of offshore lifting based on computer vision, China University of Petroleum (Beijing), (04), https://doi.org/10.27643/d.cnki.gsybu.2023.000544, 2023.
Yao, G., Duo, J., Chen, C. S., and Shen, L. H.: Implicit local radial basis function interpolations based on function values, Appl. Math. Comput., 265, https://doi.org/10.1016/j.amc.2015.04.107, 2015.
Zhang, Z.: A stress monitoring system for gantry crane for shipbuilding based on fiber grating strain induction, J. Eng. Constr. Des., 13, 194–196, https://doi.org/10.13616/j.cnki.gcjsysj.2019.07.062, 2019.
Zhu, A. M., Zhang, Z. Q., and Pan, W.: Developing a fast and accurate collision detection strategy for crane-lift path planning in high-rise modular integrated construction, Adv. Eng. Inform., 61, 102509, https://doi.org/10.1016/j.aei.2024.102509, 2024.
- Abstract
- Introduction
- Construction of physical space miniature crane prototype
- Construction of the crane digital-twin model in digital space
- Synchronization testing and analysis of crane virtual–physical states
- Dynamic prediction and visualization of main-beam stress in crane
- Experimental accuracy of real-time stress prediction for the main truss of crane
- Conclusions
- Data availability
- Author contributions
- Competing interests
- Disclaimer
- Acknowledgements
- Financial support
- Review statement
- References