the Creative Commons Attribution 4.0 License.
the Creative Commons Attribution 4.0 License.
 | 16 Feb 2026
Sealing performance of O-ring under coupled thermo-mechanical conditions
Ye Jing
Zhenyi Yuan
Kai He
Lingfei Kong
Guigeng Yang
To resolve the sealing deficiencies of actuator O-rings under cryogenic conditions and high-pressure environments, this study systematically analyzes the sealing performance of elastomeric O-rings, considering the hyperelastic properties of rubber materials and the nonlinear characteristics of contact friction. A two-dimensional axisymmetric finite element model was developed in ANSYS to analyze the effects of temperature, oil pressure, retaining rings, and O-ring dimensional variations on sealing performance. The results indicate that the combined use of a retaining ring and an O-ring enhances the sealing contact pressure of the O-ring, effectively preventing extrusion between the O-ring and the cover plate gap. Under cryogenic conditions (−55 °C), the interface contact pressure between the cover plate and O-ring exhibits a 1.9 MPa reduction relative to ambient temperature (25 °C), consequently amplifying the potential for sealing failure. Furthermore, dimensional analysis reveals that increasing the O-ring cross-sectional diameter enhances the interface contact pressure, thereby improving the sealing efficacy. From a safety and reliability perspective, it is recommended that the O-ring diameter be no less than 1.50 mm, with a maximum allowable assembly gap of 0.02 mm. These findings provide a methodological framework and theoretical guidance for the design and optimization of actuator sealing systems with different O-ring materials, sealing structures, and working environments.
- Article
(12280 KB) - Full-text XML
- BibTeX
- EndNote


The design and manufacture of actuators have long posed complex and challenging engineering problems. In practice, actuators are subjected to the combined effects of internal oil-pressure surges and extreme temperature variations, rendering sealing components susceptible to extrusion and oil leakage, ultimately causing seal failure. A common approach is to select an O-ring at the upper limit of its dimensional tolerance to increase the compression ratio and enhance sealing performance. However, even with this measure, additional oil-pressure impact and low-temperature environmental tests are required to verify sealing performance. The uncertainty of verification results leads to prolonged testing cycles and increased costs. At present, direct experimental measurement of contact pressure at the interface between servo valves and small actuators under low-temperature conditions faces several technical limitations. For example, most pressure sensors and strain gauges exhibit sensitivity degradation or even failure in low-temperature environments. Moreover, mounting pressure sensors at the contact interface can alter the original contact conditions, thereby compromising measurement accuracy under in-service conditions. Additionally, the complex geometry and uneven pressure distribution of the sealing interface, along with the challenges of capturing dynamic working states, further increase the difficulty and cost of experimental measurements. If complex actuator sealing experiments could be avoided, and instead, an efficient finite element modeling (FEM) approach used to identify the key factors affecting sealing performance and to guide targeted design optimizations, the development efficiency and reliability of sealing structures would be significantly improved.
In recent years, many researchers have conducted studies on O-ring sealing performance. Karaszkiewicz (1990) derived equations to determine the geometric parameters, contact pressure, and contact force of O-rings within the sealing groove during loading and unloading. Wu et al. (2024b) developed an idealized two-dimensional finite element model to analyze the effects of three types of surface defects on O-ring sealing performance. Qu et al. (2013) utilized ANSYS/LSDYNA to simulate the compression deformation behavior, stress field distribution, and elastic recovery characteristics of sealing rings under different loading conditions. The results indicate that the primary factors influencing the elastic properties of rubber sealing materials are the diameter and compression ratio. Li (2023) investigated the sealing behavior of O-rings under a high-pressure environment of 40 MPa, covering the installation, static pressurization, and reciprocating motion phases. Liang et al. (2019) analyzed failure mechanisms and failure modes of O-rings, establishing a reliability model for rubber O-ring seals and investigating the influence of parameter randomness on O-ring reliability. Zhang and Xie (2018) studied the effects of compression ratio, fluid pressure, velocity, and friction coefficient on the mechanical behavior, sealing performance, and failure modes of O-rings. Their findings revealed that, in static sealing applications, the maximum stress occurs inside the O-ring rather than on its surface, and the contact pressure increases with fluid pressure, while sealing performance improves with higher compression ratios. Zhao et al. (2025) conducted tensile tests, finite element simulations, and vibration experiments to investigate the nonlinear dynamic behavior of O-rings under different working conditions. The study revealed that O-ring stiffness and damping decrease with increasing vibration amplitude but increase with rising fluid pressure, consistent with the observed hysteresis in experiments. Melly et al. (2021) systematically reviewed 15 representative isotropic hyperelastic material models. Through comparative evaluation of model predictions under uniaxial, biaxial, and pure shear loading against Treloar's experimental data, they find that incorporating both deviatoric and volumetric terms and considering material compressibility significantly improve predictive performance in finite element simulations. Yang et al. (2023) investigated the coupling effect of compression ratio and sealing groove parameters on the sealing performance of an O-ring skeleton seal for a cutter-changing robot storage tank gate through an orthogonal experimental design combined with numerical simulations. The study revealed that the interaction between these parameters plays a dominant role in determining sealing performance, emphasizing that multi-parameter coupling effects should be considered rather than single-factor optimization in O-ring seal design. Jin and Che (2024) investigated the stress relaxation behavior of rubber O-rings under the combined effects of temperature, pressure, and compression rate by monitoring the contact force retention ratio. The study revealed that although a higher compression ratio increases the initial contact force, the greater compression ratio results in greater attenuation of contact force and longer attenuation time; meanwhile, the temperature of the medium hurts the contact force retention rate, while the pressure of the medium is conducive to stabilizing the contact force retention rate. Repplinger et al. (2024) combined low-temperature mechanical testing with finite element analysis to evaluate the influence of temperature-dependent properties on the sealing contact behavior of elastomeric O-rings. The study revealed that the reduction in contact pressure and the occurrence of leakage at sub-zero temperatures are mainly attributed to the thermal contraction of the elastomer and the loss of its elastic recovery capability. Deng et al. (2025) established a Mooney–Rivlin-based finite element model of an O-ring damper to analyze the nonlinear material variation mechanism and verified the model accuracy through experiments. The study indicated that under pre-compression conditions, the O-ring maintains a substantial contact pressure with both the inner and outer rings of the damper, and this contact pressure shows a linear increase with further compression. In contrast, in the absence of pre-compression, the initial contact pressure is zero, and the contact pressure rises nonlinearly throughout the compression process.
Typically, to simplify sealing problems, O-rings are assumed to be incompressible. However, under high oil pressure and low-temperature conditions, rubber materials exhibit significant volumetric shrinkage (Wu et al., 2024a), leading to changes in contact pressure and potential sealing failure. Although previous studies have provided valuable insights into the geometry, deformation, and stress distribution of O-rings, most have focused on single-factor analyses or relied on simplified assumptions that restrict their applicability under realistic service conditions. For instance, conventional models often treat rubber as incompressible and assume uniform contact interfaces, neglecting the combined effects of temperature variation, oil pressure, and material shrinkage at low temperatures. In addition, the nonlinear coupling between thermal contraction, frictional contact, and material hyperelasticity – which plays a critical role in determining sealing reliability in aerospace actuators – has rarely been fully considered. These simplifications often lead to discrepancies between simulation predictions and experimental observations, particularly under extreme conditions of low temperature and high hydraulic pressure. To overcome these limitations, the present study combines experimental characterization with finite element simulation to perform a comprehensive multifactorial analysis of O-ring sealing performance. Using the actuator sealing structure of a representative aircraft model as a case study, a series of parameter measurement experiments – including tensile, compression, friction, and thermal expansion tests – were conducted to characterize the thermo-mechanical behavior of fluorosilicone rubber. The experimentally obtained parameters were subsequently incorporated into a nonlinear finite element framework developed in ANSYS, which accounts for both material and contact nonlinearities. The influence of key factors such as retaining rings, O-ring compression ratio, and temperature on sealing performance was systematically examined. The findings not only elucidate the leakage mechanisms and deformation evolution of O-rings under extreme service conditions but also establish a quantitative relationship among temperature, compression ratio, and contact pressure, enabling a more realistic assessment of sealing reliability. This integrated experimental–numerical approach enhances the predictive accuracy of O-ring sealing behavior under coupled thermal and mechanical loading, and provides valuable theoretical guidance for optimizing actuator sealing structures and improving product reliability in aerospace applications.
2.1 Working principle
The actuator valve assembly is completed by sequentially tightening the cover plate, base, and O-ring with long bolts. The nonlinear behavior of this valve assembly primarily arises from the contact interactions between the cover plate, base, O-ring, and retaining ring, as well as the hyperelastic properties of the O-ring material. Given the confined space, high oil pressure, and fluctuating temperature conditions, it is challenging to effectively study the sealing performance of the O-ring through experimental methods. Moreover, conducting a nonlinear finite element simulation of the entire assembly would involve excessive computational costs, significantly compromising the model's efficiency and accuracy. To address these challenges, a two-dimensional axisymmetric simulation model of O-ring sealing was developed to obtain the contact-pressure distribution under high-pressure and extreme temperature conditions, thereby ensuring that the hydraulic valve achieves the required sealing performance. The detailed analysis is as follows: the O-ring deformation process is illustrated in Fig. 1. During the assembly stage, the O-ring is positioned within the groove of the base and remains nearly undeformed. As the bolts are gradually tightened, the cover plate moves toward the base and compresses both the O-ring and the retaining ring, causing elastic deformation of the sealing material and forming a continuous contact region between the O-ring and the adjacent metal surfaces, which provides the initial sealing capability. During the operating stage, the internal oil pressure in the chamber acts on the exposed lateral surface of the O-ring, inducing further deformation and a redistribution of contact along the interfaces between the O-ring, cover plate, and base. The retaining ring constrains excessive lateral flow of the O-ring material and helps to stabilize the contact configuration under service conditions. However, when the internal pressure becomes excessively high or the ambient temperature is significantly reduced, the deformation capacity and local contact state of the O-ring may be adversely affected. In such cases, the effective contact area may decrease or the local contact pressure at critical regions may be insufficient to maintain an effective seal, potentially leading to the formation of leakage paths along the interface and resulting in degradation or the failure of sealing performance.
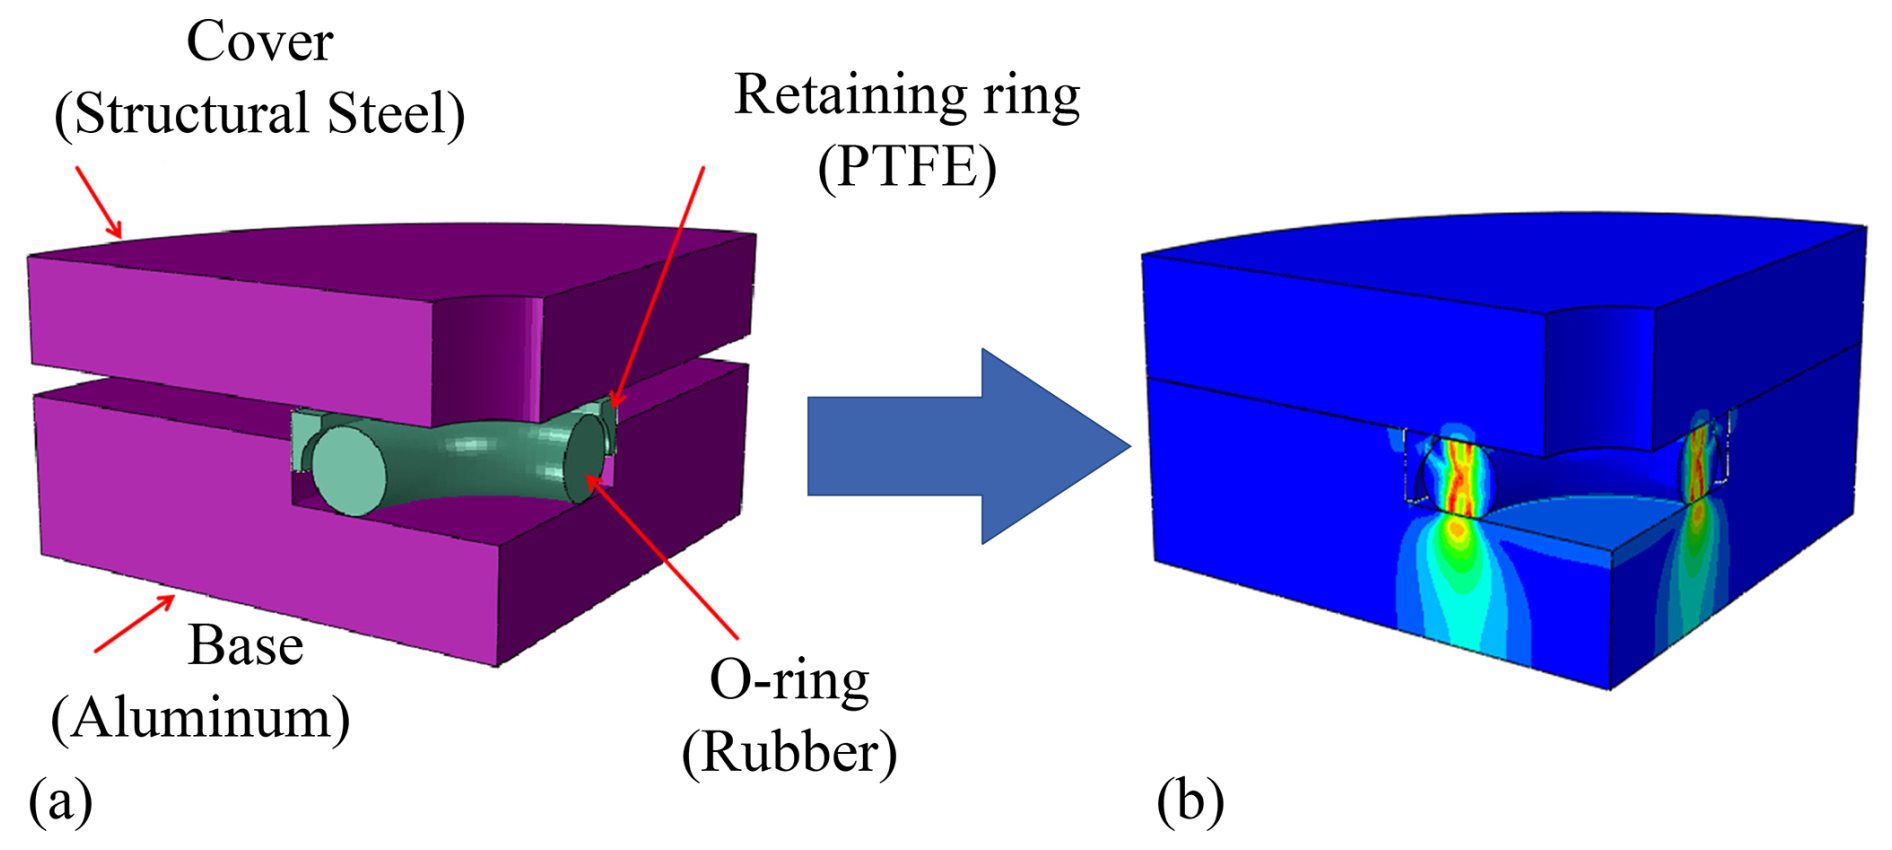
Figure 1Working principle of O-ring sealing. (a) Initial status; (b) multifactorial effects.
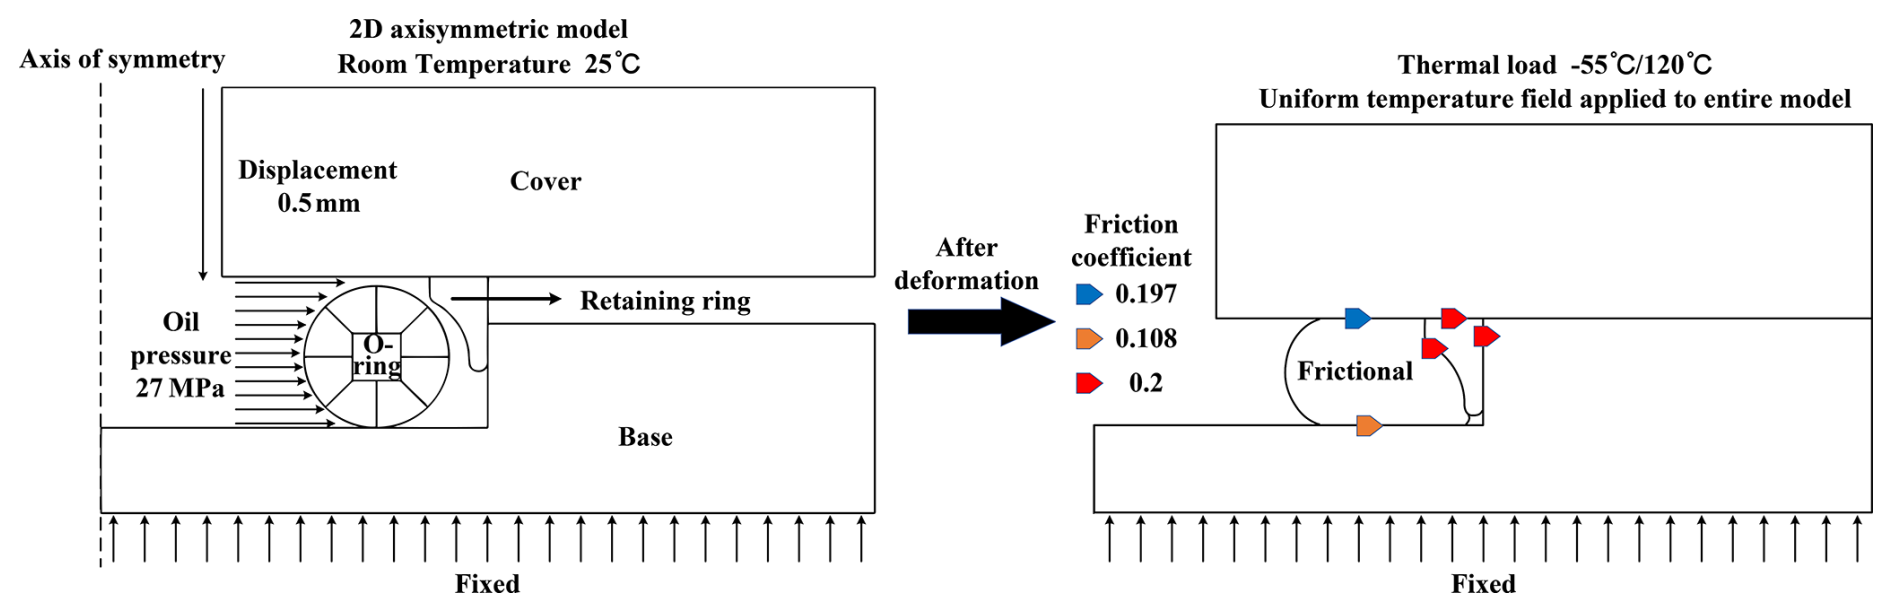
Figure 22D finite element analysis (FEA) model and boundary conditions for O-ring simulation.
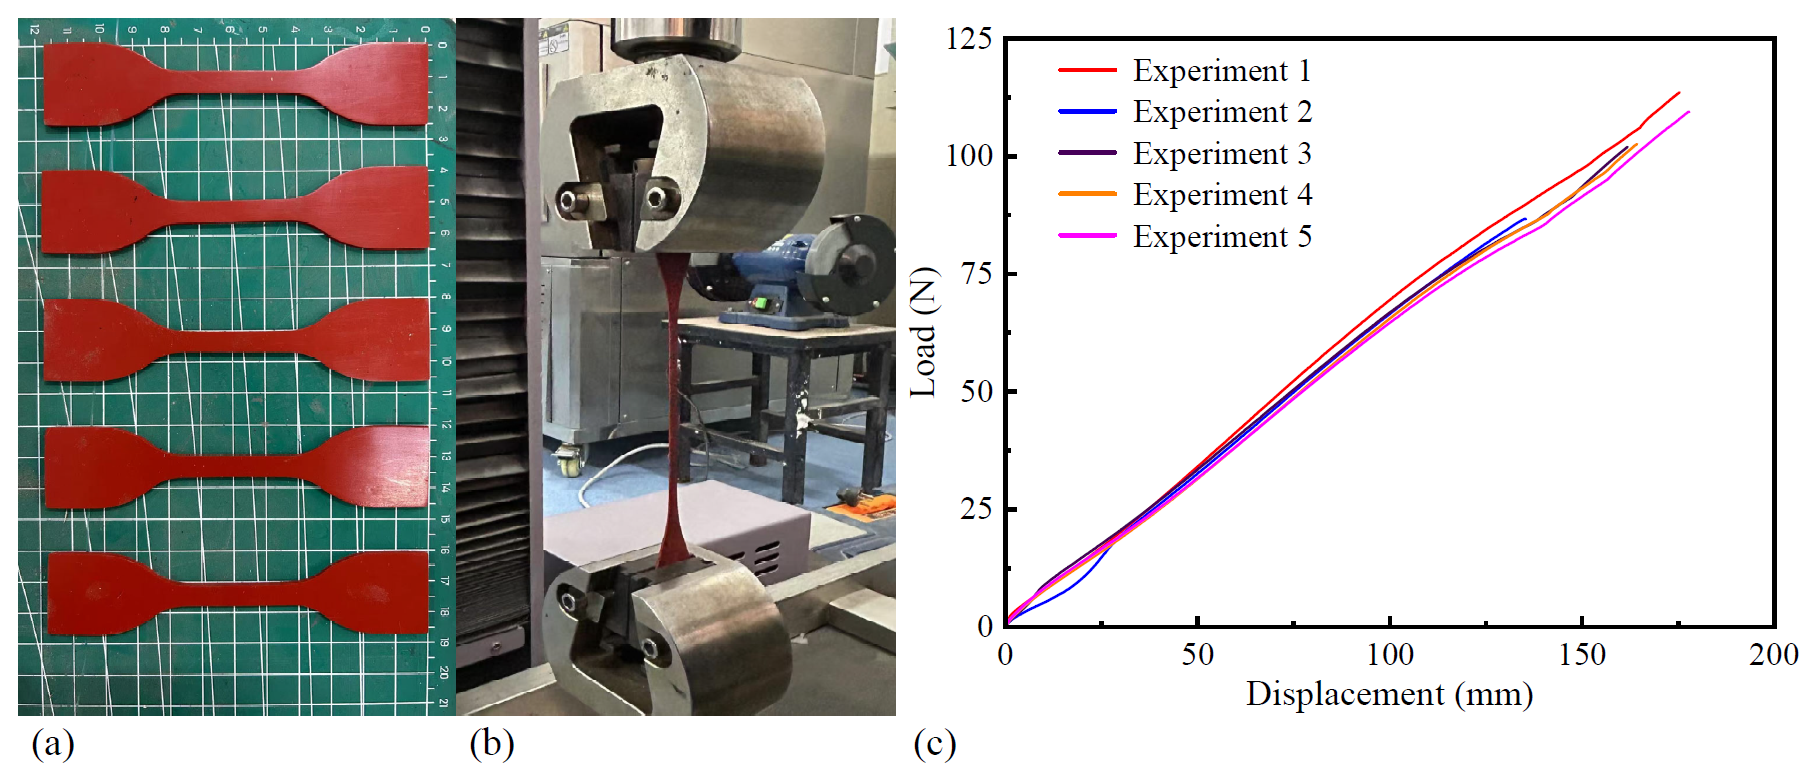
Figure 3The uniaxial tensile testing process and curve of the tensile experiment. (a) Tensile test samples; (b) rubber uniaxial tensile test; (c) load-displacement curve of the tensile experiment.
2.2 Geometric simulation model
Under the maximum internal fluid pressure and the largest temperature differential, the system is subjected to the most demanding sealing conditions. At this stage, the circumferential deformation rate of the O-ring is a secondary effect and can therefore be neglected. The stress–strain distribution is axially symmetric about the axis of rotation. Given the geometric and constraint symmetries of the assembly, the O-ring sealing problem can thus be simplified to an axisymmetric nonlinear analysis of the two-dimensional cross-section, as illustrated in Fig. 2. This model incorporates nonlinear relationships, including the hyperelastic properties of the rubber material; the contact nonlinearities between the rubber, cover plate, and retaining ring; and a uniform temperature load applied to the entire model. Friction coefficients were obtained experimentally (see Sect. 2.3). The adoption of this localized modeling approach, instead of a full-scale global model, significantly reduces computational complexity while maintaining the accuracy of the sealing analysis.
2.3 Material characteristics
The O-ring material is fluorosilicone rubber, which exhibits hyperelastic behavior and is accurately represented by the Mooney–Rivlin model. This model is suitable for moderate deformations, with strain levels of approximately 100 % in tension and 30 % in compression, consistent with the actual compression conditions in this study. The Mooney–Rivlin model (Mooney, 1940) defines the general strain energy function W for rubber materials using strain tensor invariants, as expressed in Eqs. (1) and (2):
where I1, I2, and I3 represent the invariants of the Green deformation tensor.
Here, λ1, λ2, and λ3 represent the stretch or compression ratios along the principal axes 1, 2, and 3, respectively. The Mooney–Rivlin model, depending on the order of approximation, commonly includes two-parameter and five-parameter formulations, as expressed in Eqs. (3) and (4):
where C10, C11, C01, C02, and C20 represent the Mooney–Rivlin material constants; D1 is the incompressibility parameter; and J denotes the volume ratio before and after deformation. The Mooney–Rivlin material constants can be determined by fitting experimental data obtained from uniaxial and biaxial tensile tests. The displacement–load relationship is converted into stress–strain data and imported into ANSYS for curve fitting.
The uniaxial tensile test was conducted on a universal testing machine. Standard dumbbell-shaped specimens with smooth surfaces and parallel faces were used. The experimental procedure is illustrated in Fig. 3. Five tensile tests were performed, and the resulting data were recorded as load-displacement curves, as shown in Fig. 3c.
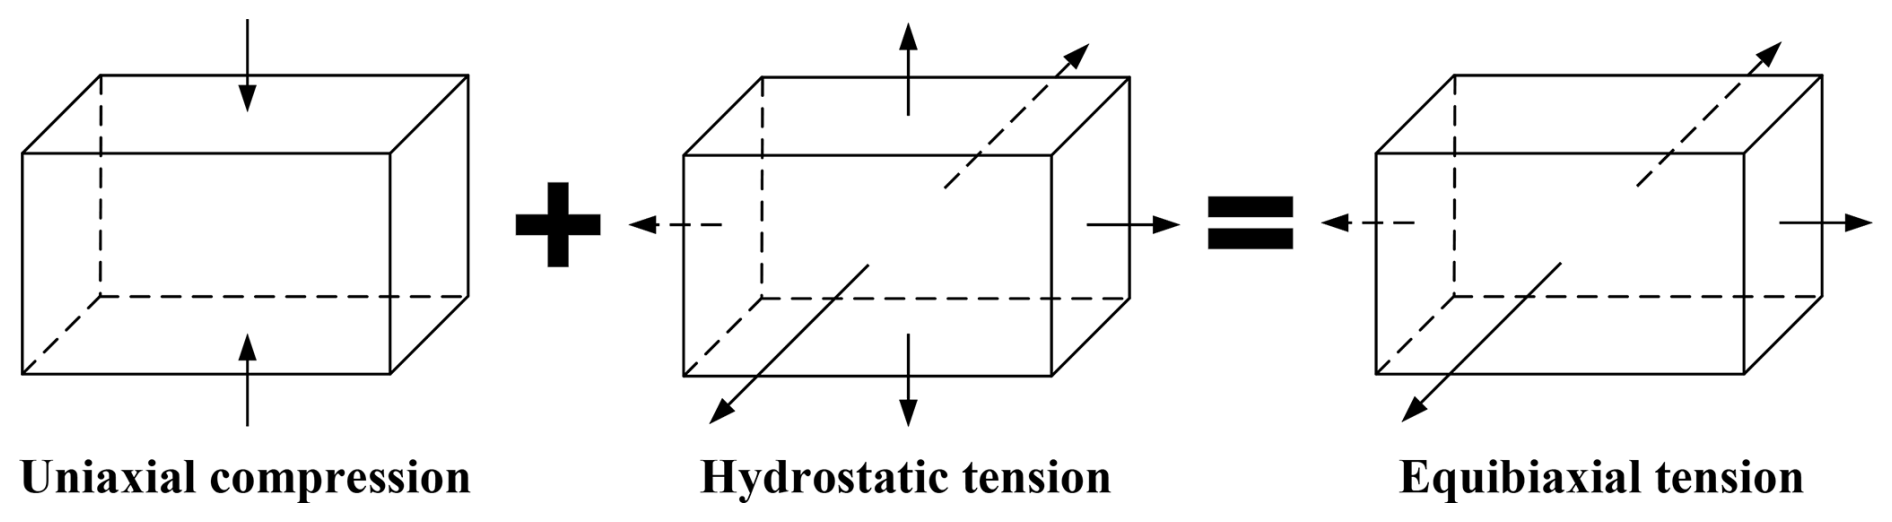
The experimental curves show that the five tests produce highly consistent results, confirming the reliability of the data. The final results were obtained by averaging the five tests. Moreover, the rubber material exhibits a distinctly nonlinear stress–strain response in the later stage of the tensile test. Equibiaxial tensile testing, however, entails stringent experimental requirements and is difficult to perform. However, as shown in Fig. 4, under the assumption of constant volume, the deformation of a specimen in an equibiaxial tensile test can be equivalently transformed into uniaxial compression deformation. Therefore, a uniaxial compression test can be used as a substitute for equibiaxial tensile testing. The relationship between stress and strain in these two cases (Rivlin, 1948) can be expressed by Eq. (5):
where σEc and εEc represent the principal stress and principal strain in the uniaxial compression test, while σEb and εEb represent the equivalent principal stress and strain in the equibiaxial tensile test.
The uniaxial compression test was carried out on an electronic universal testing machine, as shown in Fig. 5. Each test was performed at a crosshead speed of 10 mm min−1 until a strain of 30 % was reached, followed by unloading at the same rate. This loading–unloading cycle was repeated four times, with the first three cycles regarded as mechanical conditioning. The measured results are shown in Fig. 6, and it is evident that the data from the first compression test significantly differ from the subsequent three tests due to initial gaps between the specimen and the testing machine. The first compression cycle largely eliminates these initial gaps, while multiple subsequent cycles ensure that any remaining voids are completely removed. A total of five tests were conducted, and two datasets with large deviations were discarded, leaving three valid datasets. As shown by the experimental curves in Fig. 6, the results of these three tests exhibit excellent consistency, confirming the reliability of the experimental data. Furthermore, it is evident that the compression deformation process of the rubber exhibits distinct nonlinear characteristics. The processed experimental data were imported into ANSYS for hyperelastic parameter fitting, and the fitting results for the specimen's hyperelasticity are shown in Fig. 7.

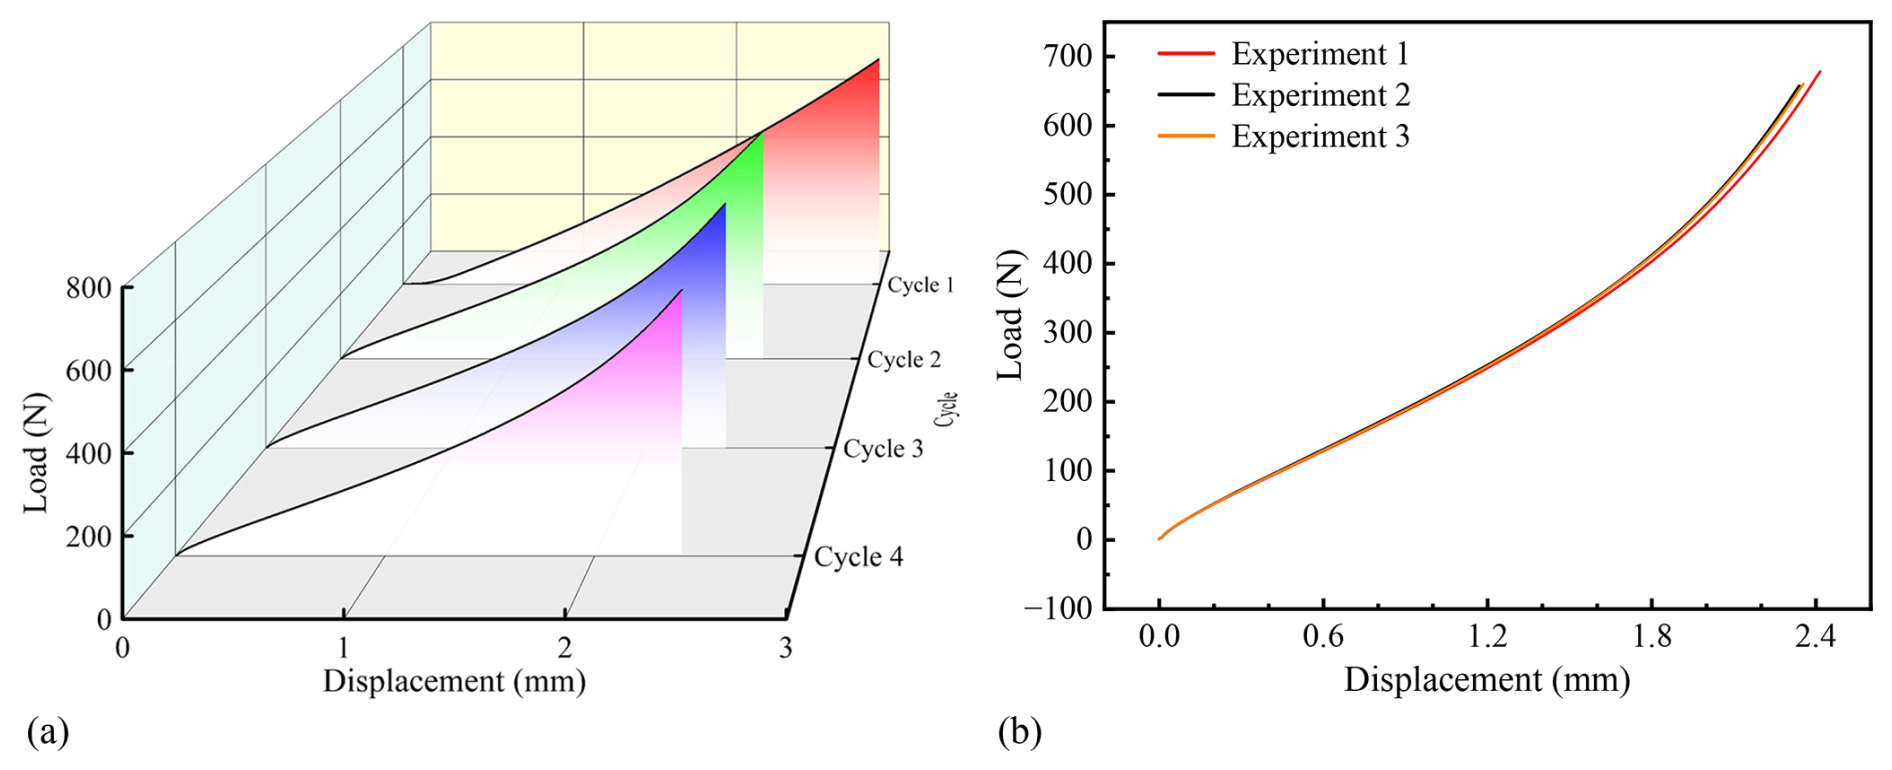
Figure 6Load-displacement curve of the first set of compression tests and the fourth cyclic compression test. (a) Load-displacement curve of the first set of compression tests; (b) load-displacement curve of the fourth cyclic compression test.
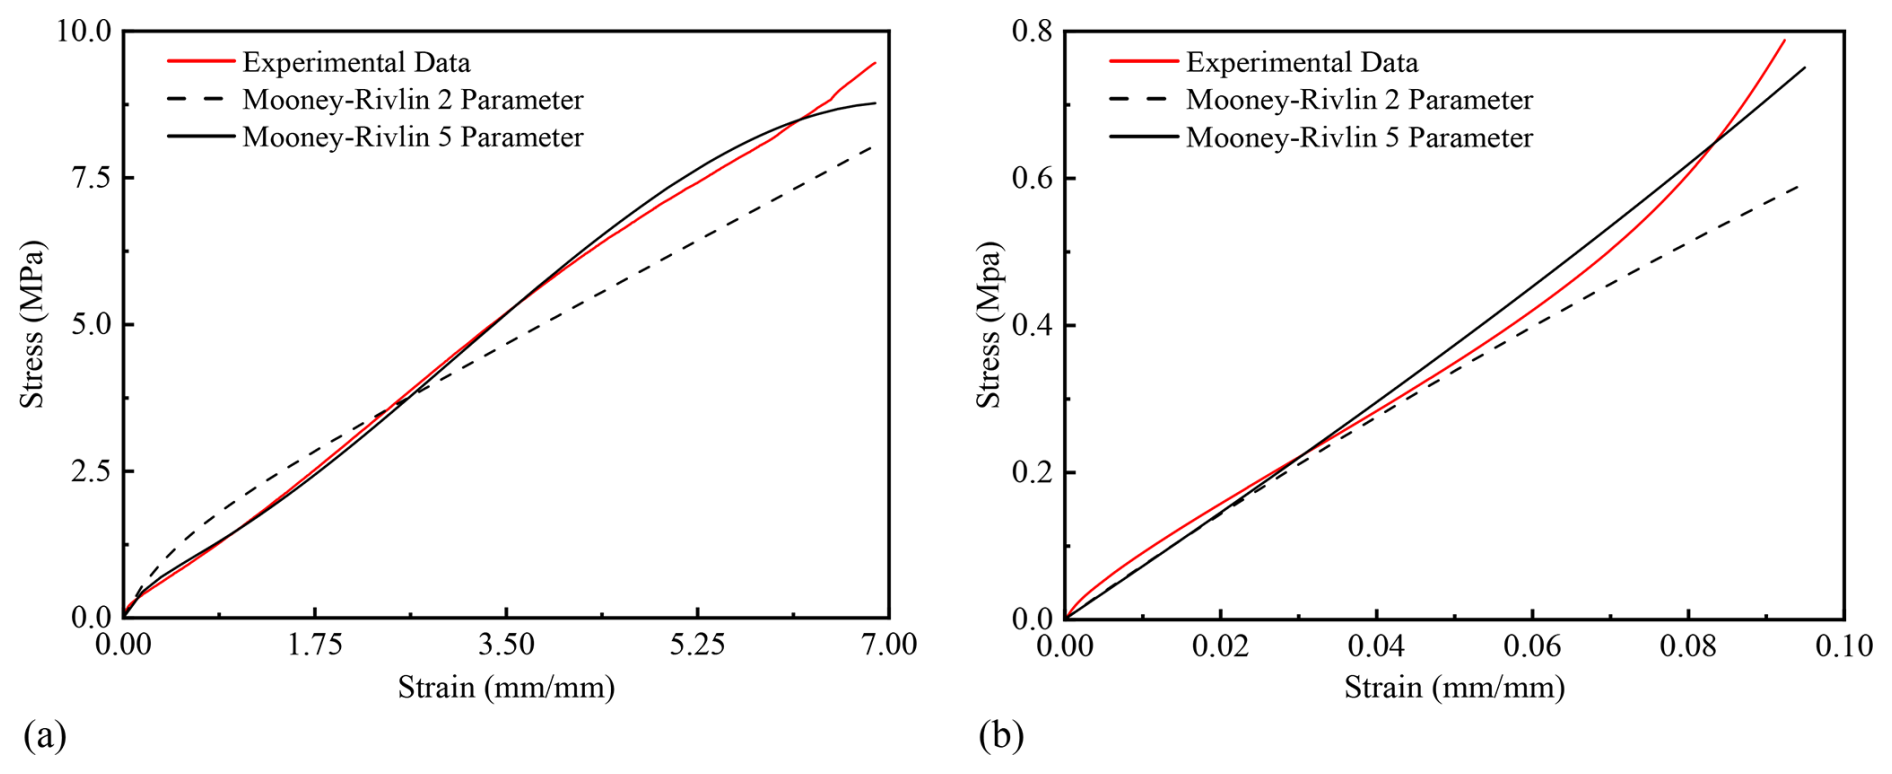
Figure 7Fitting of hyperelastic material parameters. (a) Uniaxial tensile experiment hyperelastic parameter; (b) equivalent biaxial tensile experiment hyperelasticity parameter.
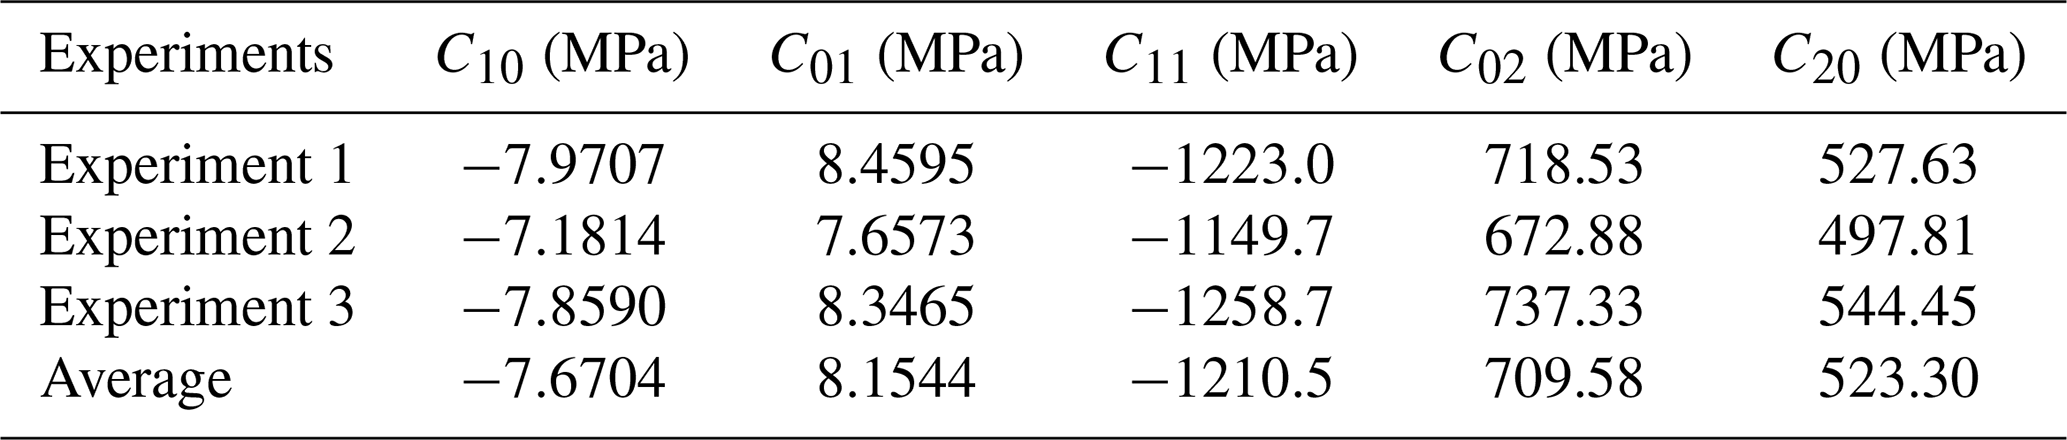
The comparison indicates that the Mooney–Rivlin 2 parameter model loses accuracy at large strains, resulting in distortion in the later stage. In contrast, the Mooney–Rivlin 5 parameter model provides significantly better fitting accuracy. Therefore, the Mooney–Rivlin 5 parameter model was adopted for hyperelastic material modeling in this study. Moreover, since no distinct inflection points were observed in the compression test curves, higher-order models, such as the Mooney–Rivlin 9 parameter model, were deemed unnecessary. The hyperelastic parameter fitting results are presented in Table 1: , C01=8.1544, , C02=709.58, C20=523.30 MPa.
To ensure the rational selection of the constitutive model that strongly influences the predicted dynamic behavior (Khaniki et al., 2022), a comprehensive comparison was performed among five representative hyperelastic models – neo-Hookean, Mooney–Rivlin (2 and 5 parameter), Yeoh, and Ogden – using both uniaxial tensile and equivalent biaxial tensile experimental data of the fluorosilicone rubber. The coefficient of determination (R2) was employed to quantitatively evaluate the fitting performance of each model under the two deformation modes.
As summarized in Table 2 and Fig. 8, for the uniaxial tensile tests, the neo-Hookean and two-parameter Mooney–Rivlin models exhibited relatively low accuracy (R2≈0.93), indicating their limitation to small-strain applications and their inability to capture the nonlinear stiffening behavior. The Yeoh and Ogden models achieved excellent fitting accuracy (R2≈ 0.99–1.00), while the five-parameter Mooney–Rivlin model also reached a high level of precision (R2≈0.996). For the equivalent biaxial tension, similar trends were observed: the neo-Hookean and Mooney–Rivlin 2-parameter models again showed moderate agreement (R2≈0.91), whereas the Yeoh and Ogden models yielded nearly perfect numerical fits (R2≈ 0.996–0.999). However, despite its high accuracy in uniaxial tension, the Yeoh model tended to overestimate stresses under compressive or biaxial states because it relies solely on the first strain invariant, which describes distortional and volumetric deformation components, respectively. Similarly, the Ogden model, although capable of providing excellent fits across a wide strain range, introduces multiple material constants that require extensive multi-axial testing for reliable identification, increasing computational cost and sometimes leading to convergence issues in coupled thermo-mechanical simulations. In contrast, the five-parameter Mooney–Rivlin model maintains consistently high accuracy across both deformation modes (R2=0.996 in uniaxial and 0.988 in biaxial tests), demonstrating its robustness and transferability between different strain states. Therefore, this model was adopted in the present study as it offers an optimal balance among fitting accuracy, numerical stability, and computational efficiency. The Mooney–Rivlin formulation effectively captures both the initial soft response and the subsequent nonlinear hardening behavior observed in experiments, while maintaining excellent convergence in finite element analyses. It is particularly suitable for modeling sealing components, where combined shear and volumetric deformations occur under moderate strain levels (up to approximately 30 % compression and 100 % tension).
Table 2Coefficient of determination (R2) for different hyperelastic models under uniaxial and equivalent biaxial tension.
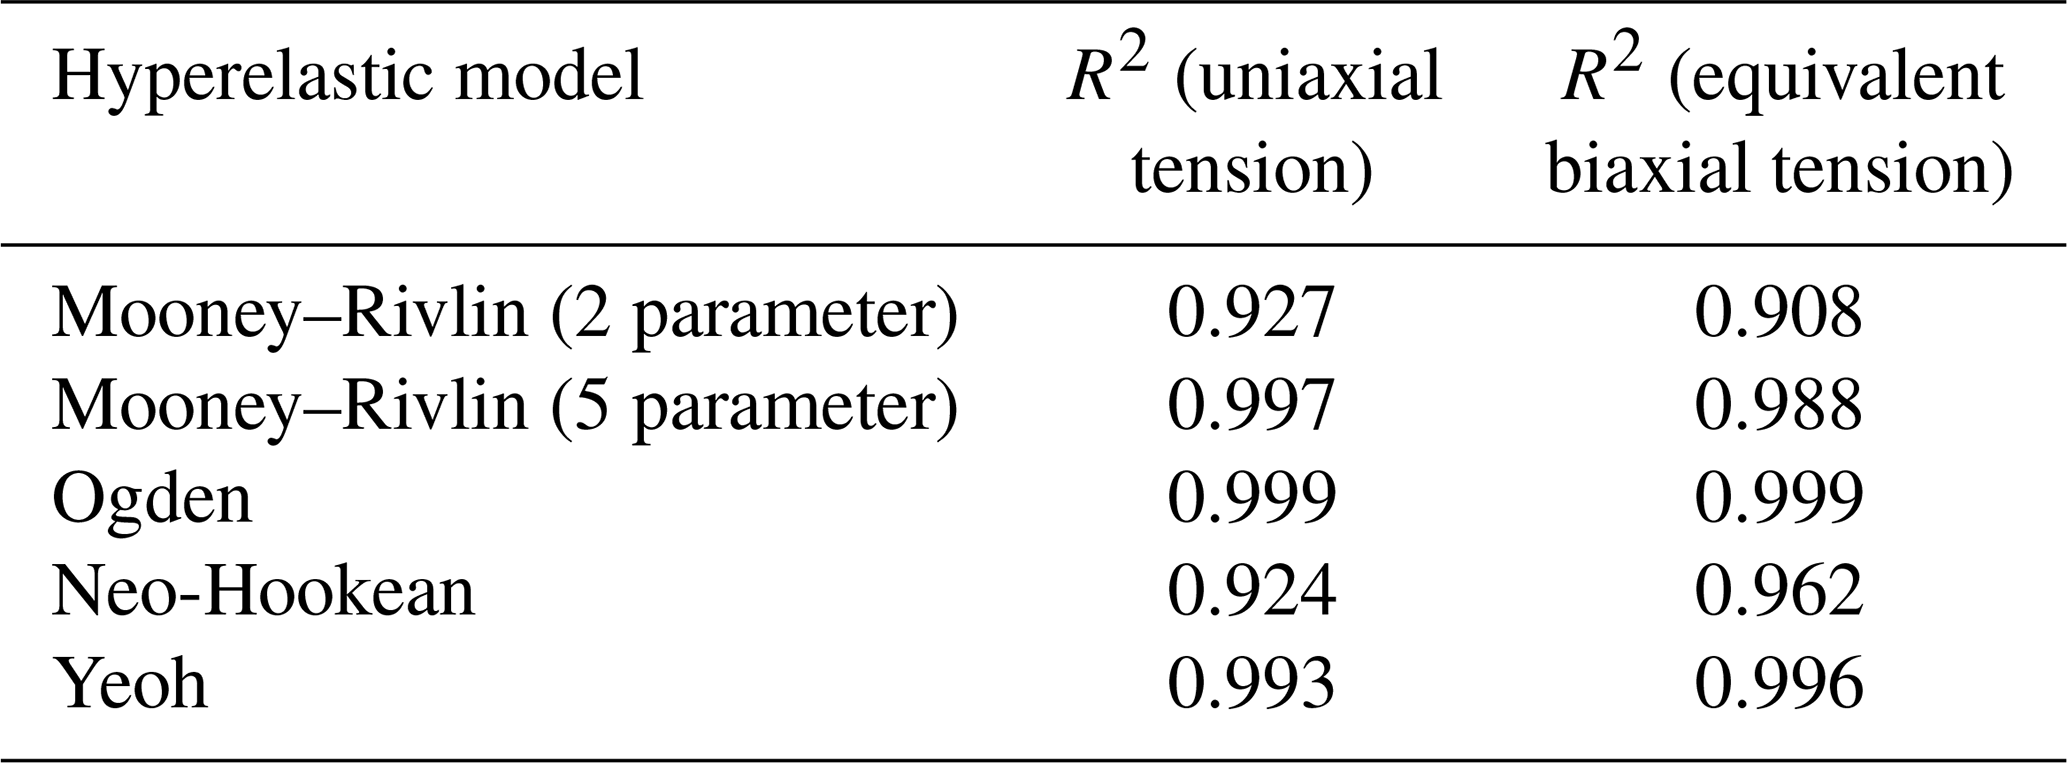
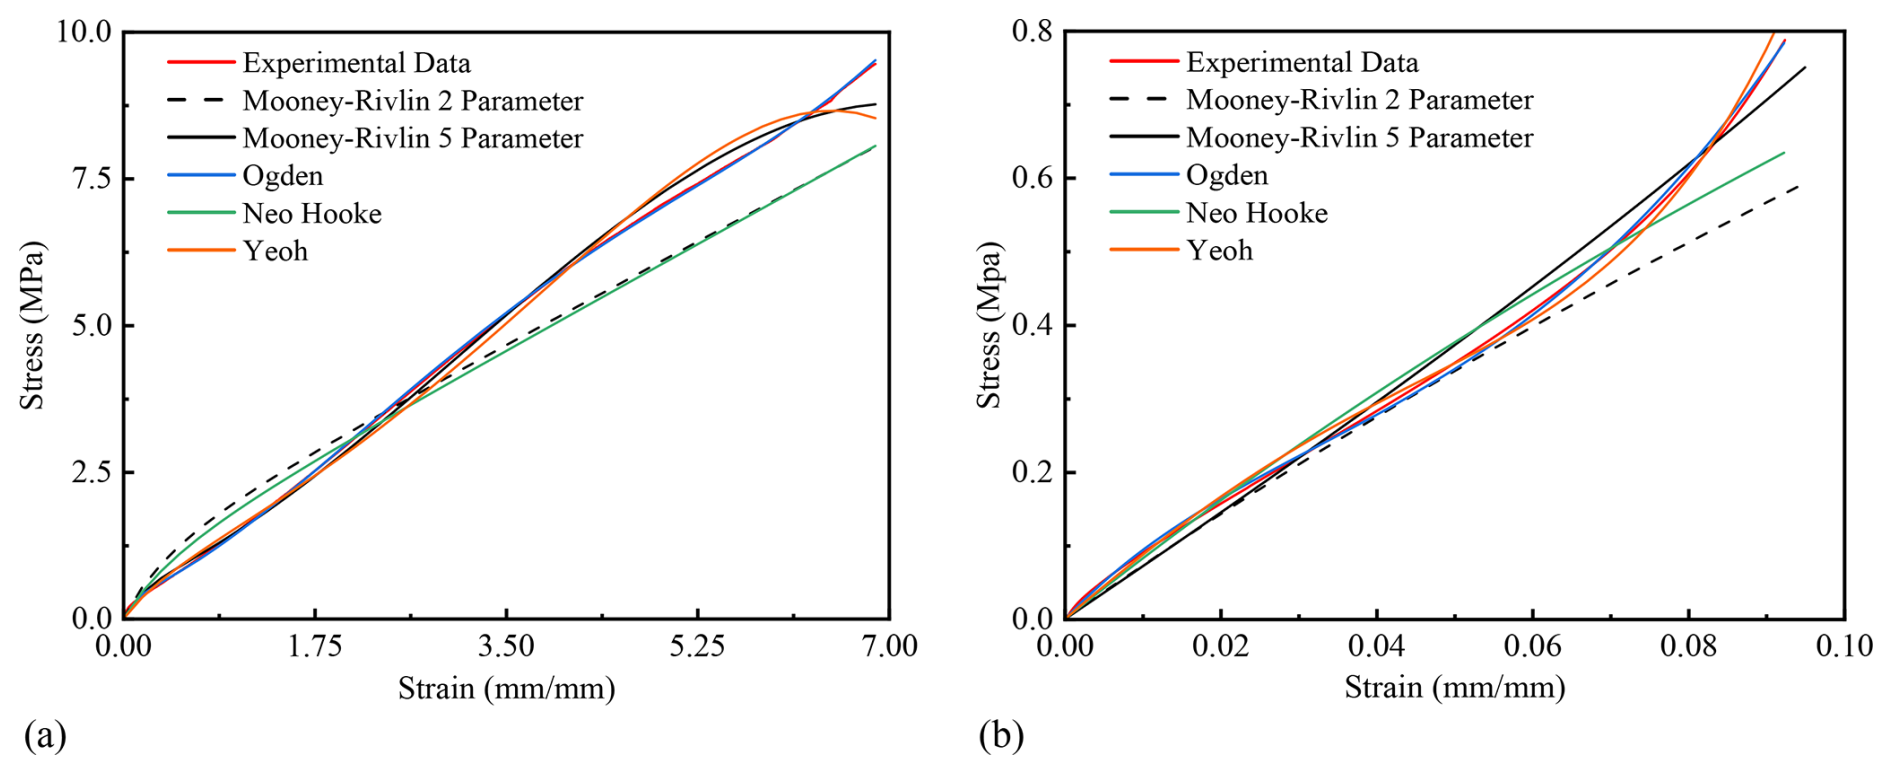
Figure 8Comparison of fitted stress–strain curves for different hyperelastic models under uniaxial and equivalent biaxial tension. (a) Uniaxial tensile experiment; (b) equivalent biaxial tensile experiment.
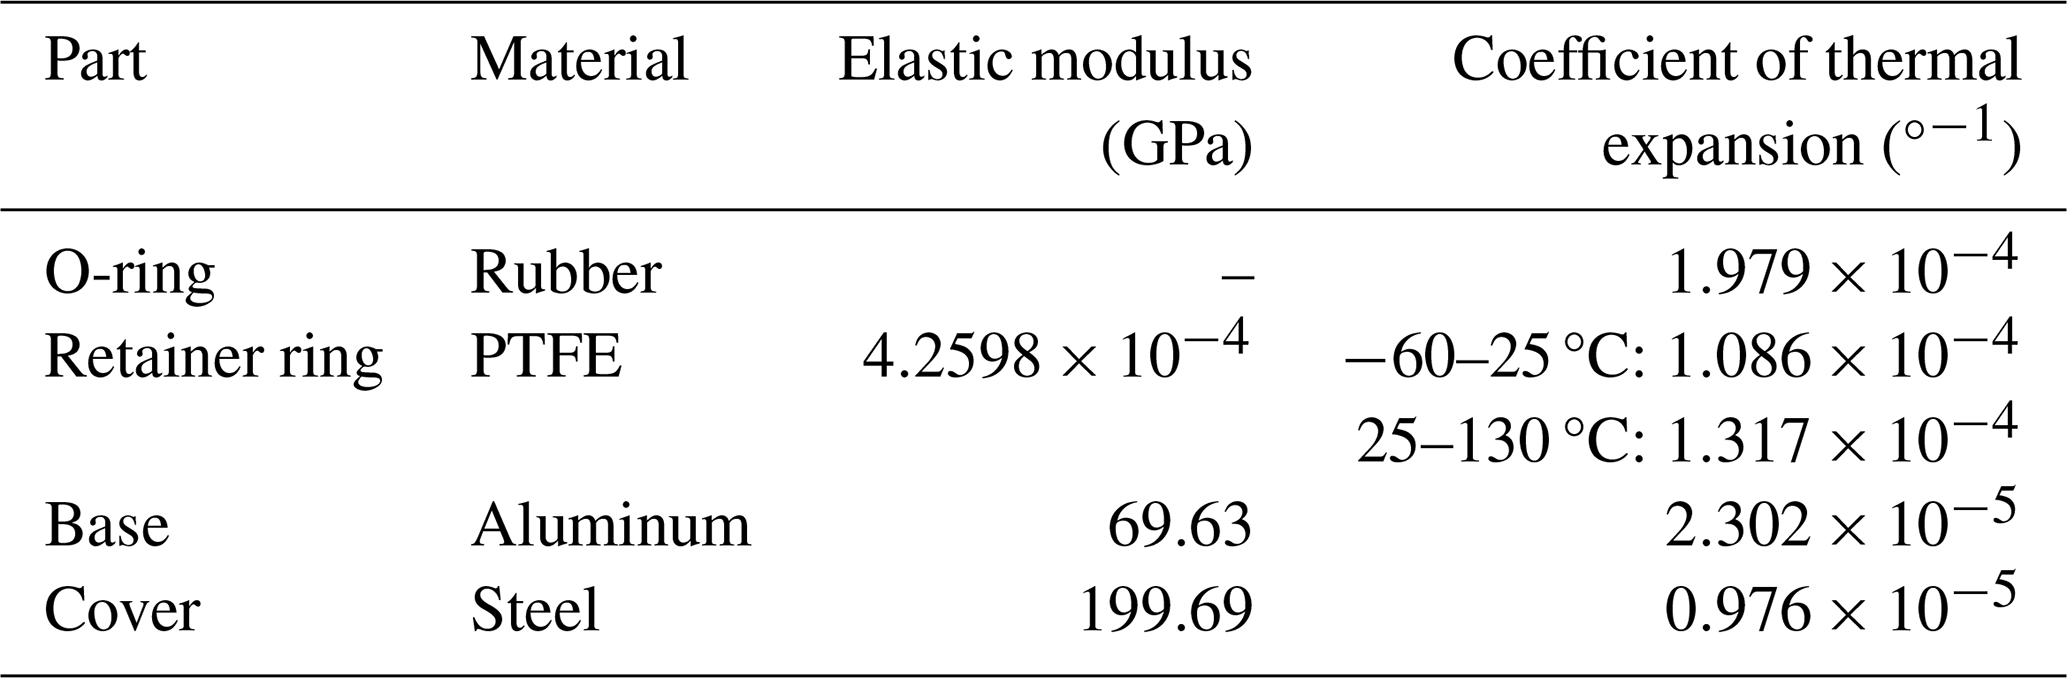
The retainer ring materials, aluminum alloy, and stainless steel were modeled using conventional linear elasticity, with elastic modulus values obtained through uniaxial tensile testing. The experimental process and data processing for the retainer ring are shown in Fig. 9a, b, and c, and the elastic modulus values are summarized in Table 3.
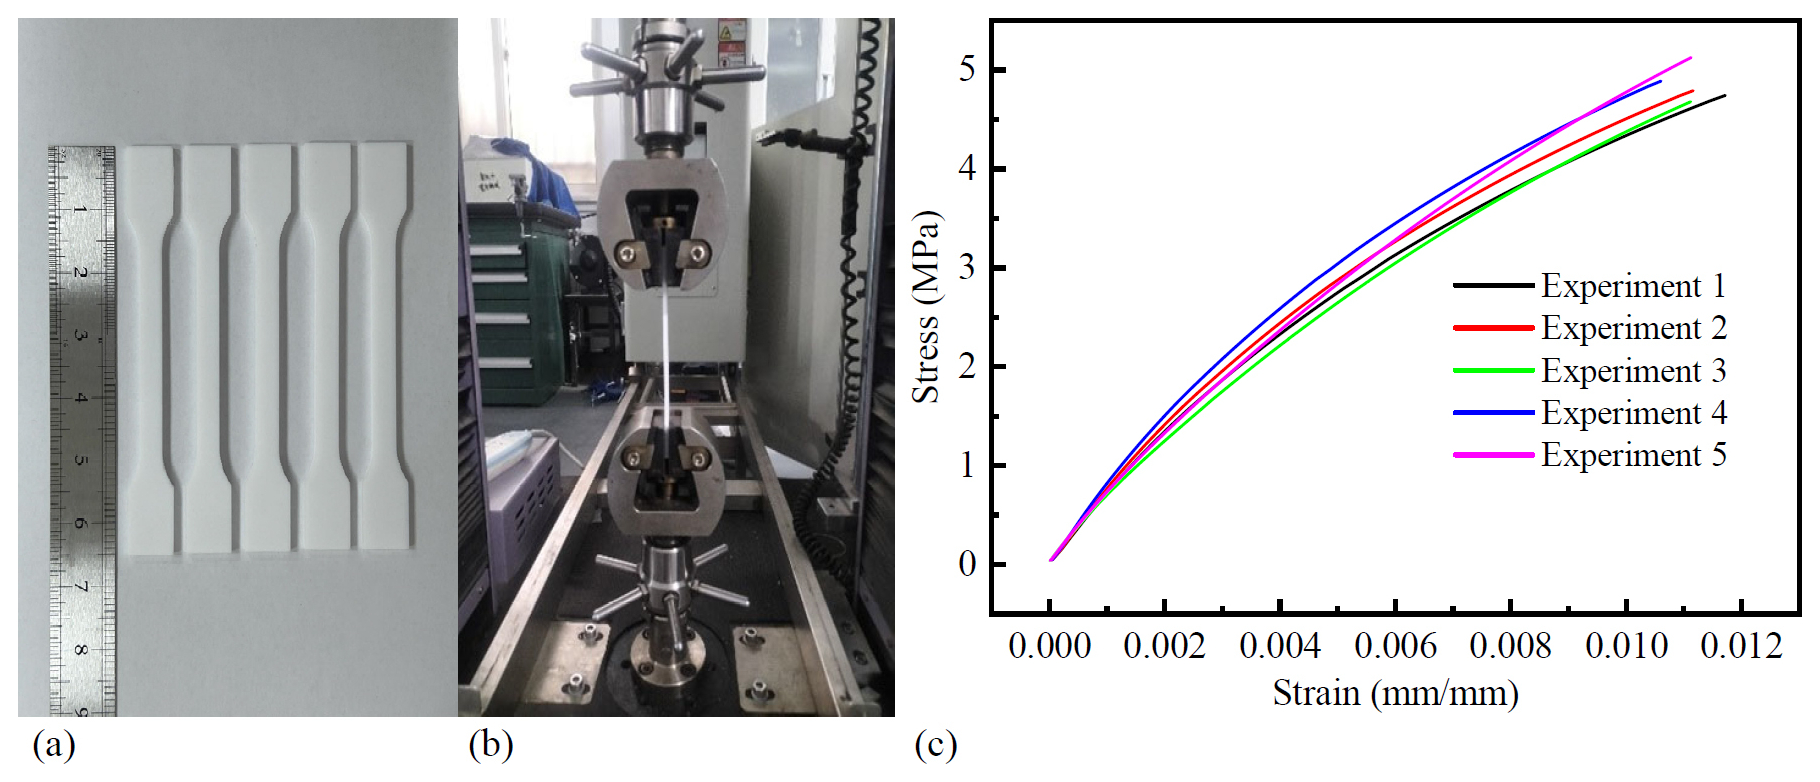
Figure 9Tensile testing and uniaxial tensile curve of retaining rings. (a) Tensile test samples; (b) polytetrafluoroethylene (PTFE) uniaxial tensile test; (c) uniaxial tensile curve of retaining rings.
The friction coefficients between the sealing ring, and the upper cover plate and lower valve body were determined through shear slip tests. Two methods – pull out and pull through – were used to characterize the rubber–metal shear interaction. The principles of both methods are illustrated in Fig. 10. In both cases, the test material is clamped between two fixture plates and then pulled out, but the structural configurations differ slightly. In the pull-out method, the contact area between the rubber clamping block and the fixture plate gradually decreases during testing. As a result, the pulling force F is affected by the reduction in contact area, making it difficult to obtain a stable force value and thus unsuitable for accurately evaluating shear properties. In contrast, in the pull-through method, the contact area between the rubber clamping block and the fixture plate remains constant throughout the test. Consequently, the pulling force F is unaffected by changes in contact area, ensuring load uniformity. Therefore, in this study, the pull-through method was adopted to investigate the shear characteristics between the rubber and metal materials.
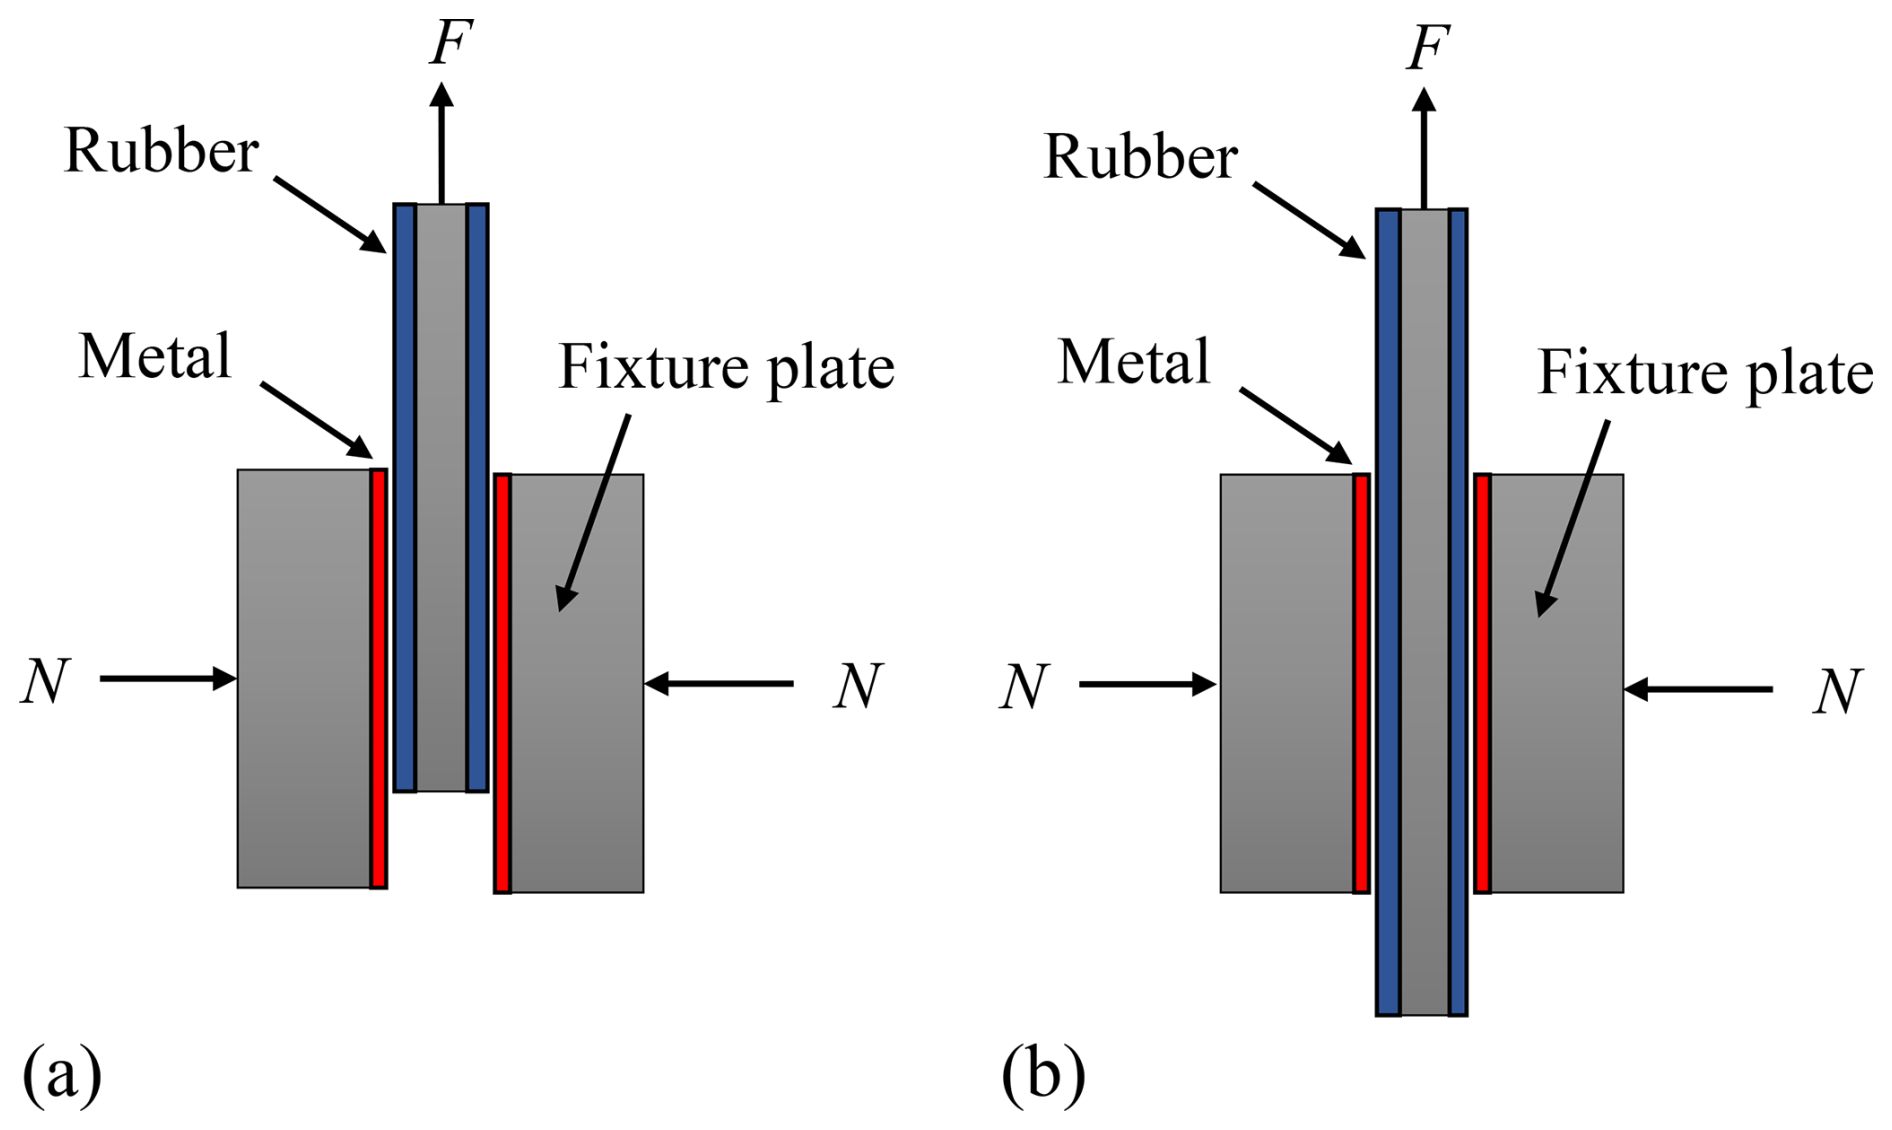
Figure 10Schematic diagrams of the friction coefficient measurement methods. (a) Pull out; (b) pull through.
The experimental setup is shown in Fig. 12a, where A represents the force sensor, B is the spring providing the normal compression force N, C is the fixture plate, and D is the rubber material clamped for testing. An electronic universal testing machine was used for the experiment. A constant pressure was applied on the left side through four springs, while the central rubber specimen was pulled out to generate a force–displacement curve. These data were then used to evaluate the interfacial shear properties between the rubber and metal materials. Since the compression force in this experiment was provided by a spring, it was necessary to measure the spring stiffness coefficient prior to the main tests. The spring was compressed by 4 mm at a compression rate of 2 mm min−1. To ensure result reliability, three repeated tests were performed. The experimental setup and data for the spring stiffness measurement are presented in Fig. 11. The spring stiffness coefficient was determined from the slope of the load-displacement curve. The three experimental curves exhibit excellent agreement, demonstrating high repeatability and data reliability. The slopes obtained from the three tests were 52.81, 52.91, and 52.87 N mm−1, respectively. Taking the average of these values, the spring stiffness coefficient was determined to be 52.86 N mm−1.
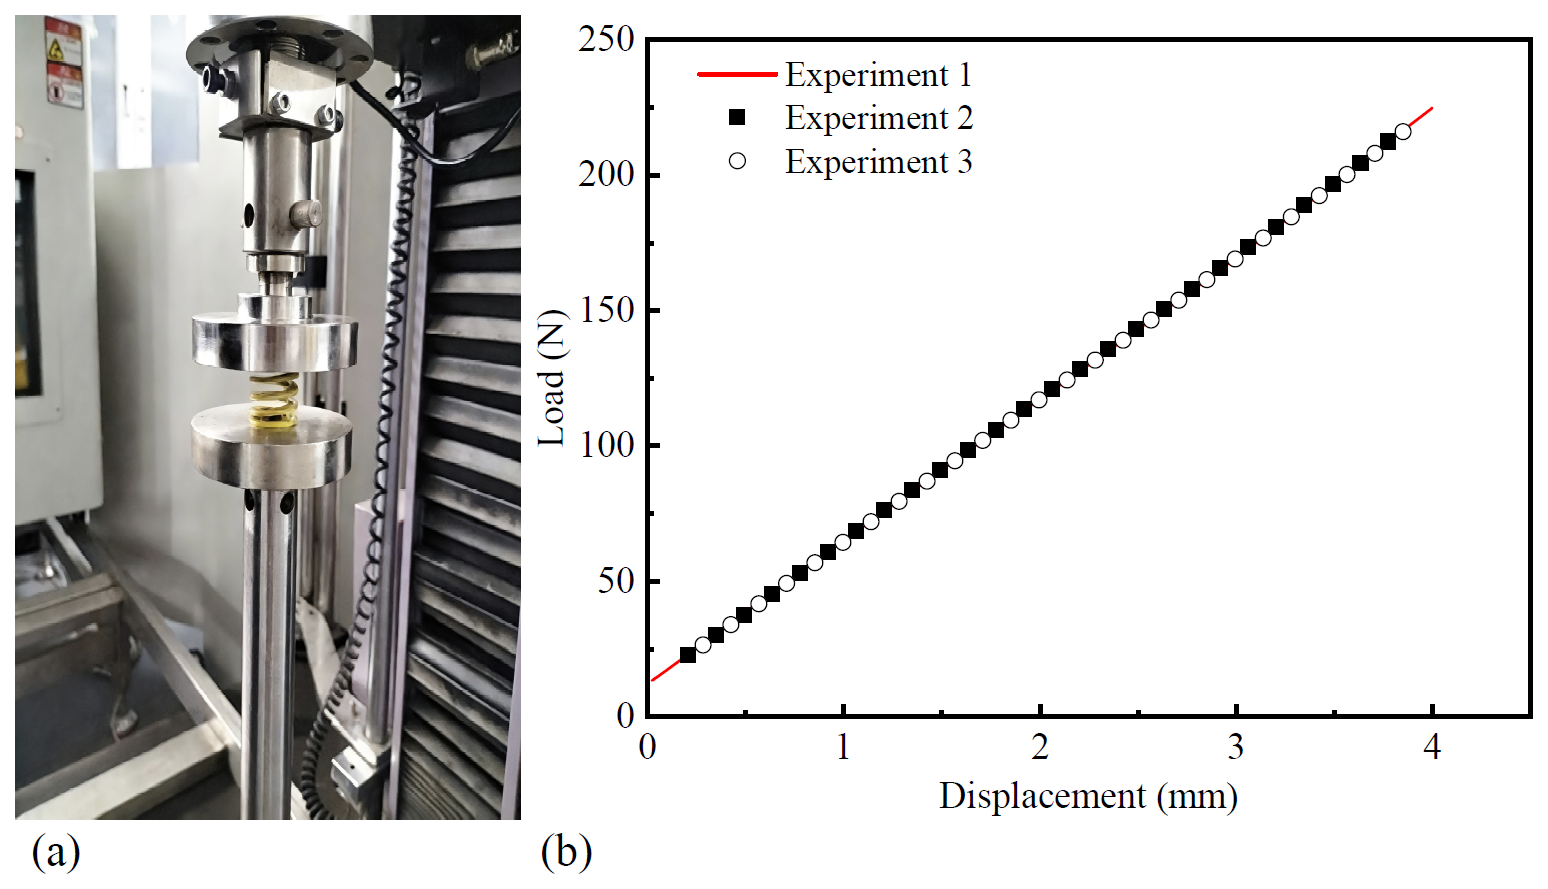
Figure 11Verification of spring stiffness coefficient. (a) Spring stiffness test; (b) load-displacement curves from three repeated measurements.
In this experiment, the interfacial shear properties between the rubber sealing material and metal substrates (steel and aluminum) were examined. Each test was conducted under room-temperature conditions (25 °C) with a tensile displacement of 3 mm. The spring compression was set to 4 mm, and the tensile rate was 2 mm min−1. A total of four springs were used to apply the load, generating a combined compressive force of 845.76 N. Since the inner side of the sealing ring is normally filled with liquid and exhibits good lubrication performance, a thin layer of aviation hydraulic oil was applied to the metal plate surface during testing to simulate the actual lubricated service conditions. Each test case was repeated five times to ensure data reliability. The experimental data of interlayer shear slip between rubber-steel and rubber-aluminum are shown in Fig. 12b and c. It can be seen that with the increase of tensile displacement, the trend of the curve is basically the same. The load is gradually reduced after a very small peak, and then it tends to stabilize. The stabilizing load of the curve can be equated to the interlayer sliding shear force, which will subsequently be used to calculate the coefficient of friction of the interlayer. Both tests basically enter the steady state after the tensile displacement reaches 1.8 mm, at which time the values of stable force for five tests of rubber and steel are 330.59, 337.84, 338.74, 324.54, and 331.08 N, resulting in an average of 332.56 N. For rubber-aluminum, the corresponding stable force values are 182.18, 185.71, 185.76, 185.39, and 176.47 N, resulting in an average of 183.10 N.
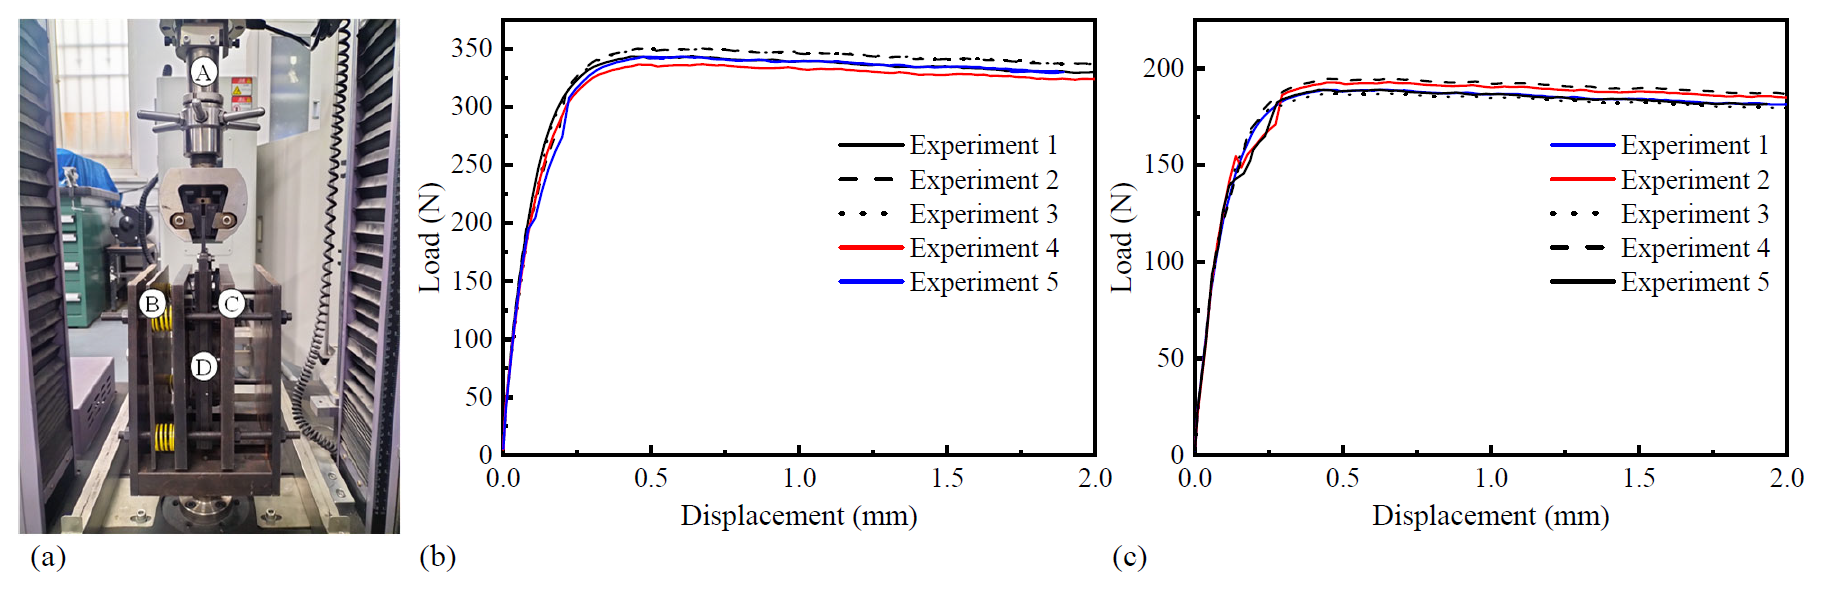
Figure 12Interlayer shear testing and interlayer shear load-displacement curve of rubber. (a) Experimental equipment; (b) interlayer shear curve for rubber-steel; (c) interlayer shear curve for rubber-aluminum.
Since all experimental data stabilized after interfacial slip, the interfacial shear behavior can be represented using the Coulomb friction model, expressed in Eq. (6):
where μ is the friction coefficient, F is the interfacial shear force (taken as half of the experimental load value), and N is the normal force applied by four springs (845.76 N). From the above sliding shear, the coefficient of friction μ between rubber and steel, and rubber and aluminum can be found to be 0.197 and 0.108, respectively.
Thermal expansion coefficient measurements were performed on O-ring, aluminum, and steel samples under different temperature conditions using a thermal expansion analyzer. The measured temperature–expansion data were imported into Origin for curve fitting, where the slope of the fitted function represents the thermal expansion coefficient. The numerical results are presented in Table 3. The experimental setup for rubber thermal expansion is shown in Fig. 13a and b. The experimental specimen had dimensions of 2 mm × 5 mm × 10 mm (length × width × height). The test temperature range was −60 to 130 °C, encompassing the actual service temperature range of the sealing element used in this project. To ensure data reliability, five repeated tests were conducted. The experimental data for the O-ring's thermal expansion coefficient were processed using Origin software, and the results are shown in Fig. 14a. The five experimental curves exhibit nearly linear relationships with almost constant slopes, indicating that the thermal expansion coefficient of the rubber remains constant over the tested temperature range. The fitted slopes from the five experiments were , , , , and °C−1, respectively. Taking the average of the five measurements, the thermal expansion coefficient of the rubber was determined to be °C−1. Following the same procedure used for measuring the O-ring's thermal expansion coefficient, tests on the retaining ring were conducted at various temperatures. The measured temperature–expansion data were imported into Origin software for fitting, yielding the relationship between the thermal expansion coefficient and temperature. The experimental specimen is shown in Fig. 13c, with dimensions of 20 mm × 5 mm × 2 mm (length × width × height). The test temperature range was −60 to 130 °C, and to ensure the reliability of the results, three repeated experiments were performed. The processed results are presented in Fig. 14b. The thermal expansion coefficient corresponds to the slope of each curve. The three experimental curves are almost identical, indicating that all three tests are valid. A noticeable inflection point appears around room temperature (25 °C). The curves exhibit different slopes in the temperature ranges of −60 to 25 °C and 25 to 130 °C, suggesting that the thermal expansion coefficient should be determined separately for these two regions. The −60 to 25 °C range is denoted as Region A, and the 25 to 130 °C range as Region B. For Region A (−60 to 25 °C), the fitted thermal expansion coefficients from the three experiments were , , and °C−1, respectively, giving an average value of °C−1. For Region B (25 to 130 °C), the corresponding fitted values were , , and °C−1, with an average of °C−1. Therefore, in subsequent high- and low-temperature sealing simulations, different thermal expansion coefficients are adopted for the two temperature regions to ensure higher modeling accuracy. The thermal expansion coefficient of aluminum was measured using the same method as described above. To ensure the reliability of the results, five repeated experiments were conducted, and the processed results are shown in Fig. 14c. The fitted slopes of the five experimental curves were , , , , and °C−1, respectively. Taking the average of these five values, the thermal expansion coefficient of the aluminum alloy used in the base structure was determined to be °C−1. Similarly, the thermal expansion coefficient of stainless steel was measured using the same procedure. To ensure the reliability of the results, five repeated experiments were also performed, and the results are presented in Fig. 14d. The fitted slopes from the five experiments were , , , , and °C−1, respectively. The average value was calculated to be °C−1, which represents the thermal expansion coefficient of stainless steel.
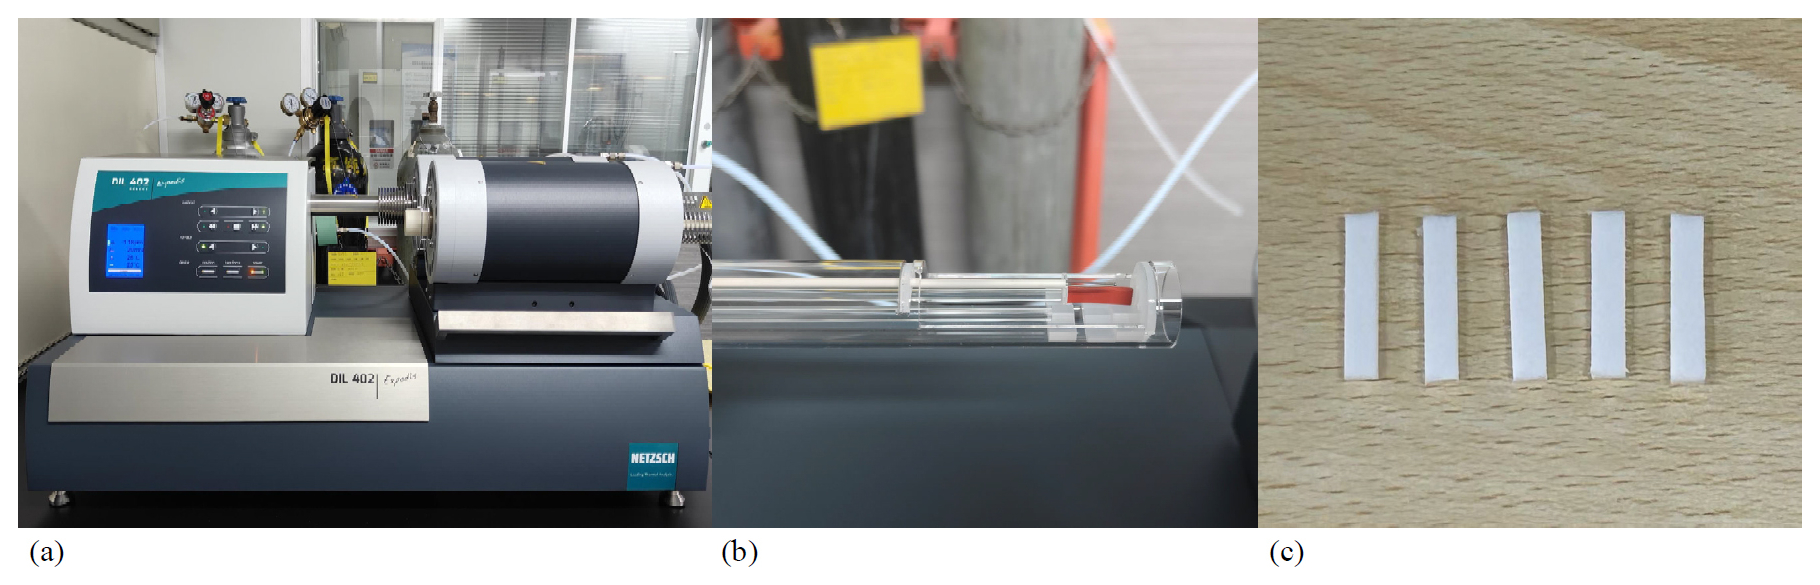
Figure 13Thermal expansion testing of rubber and PTFE. (a) DIL402C analyzer; (b) rubber test sample; (c) PTFE test sample.
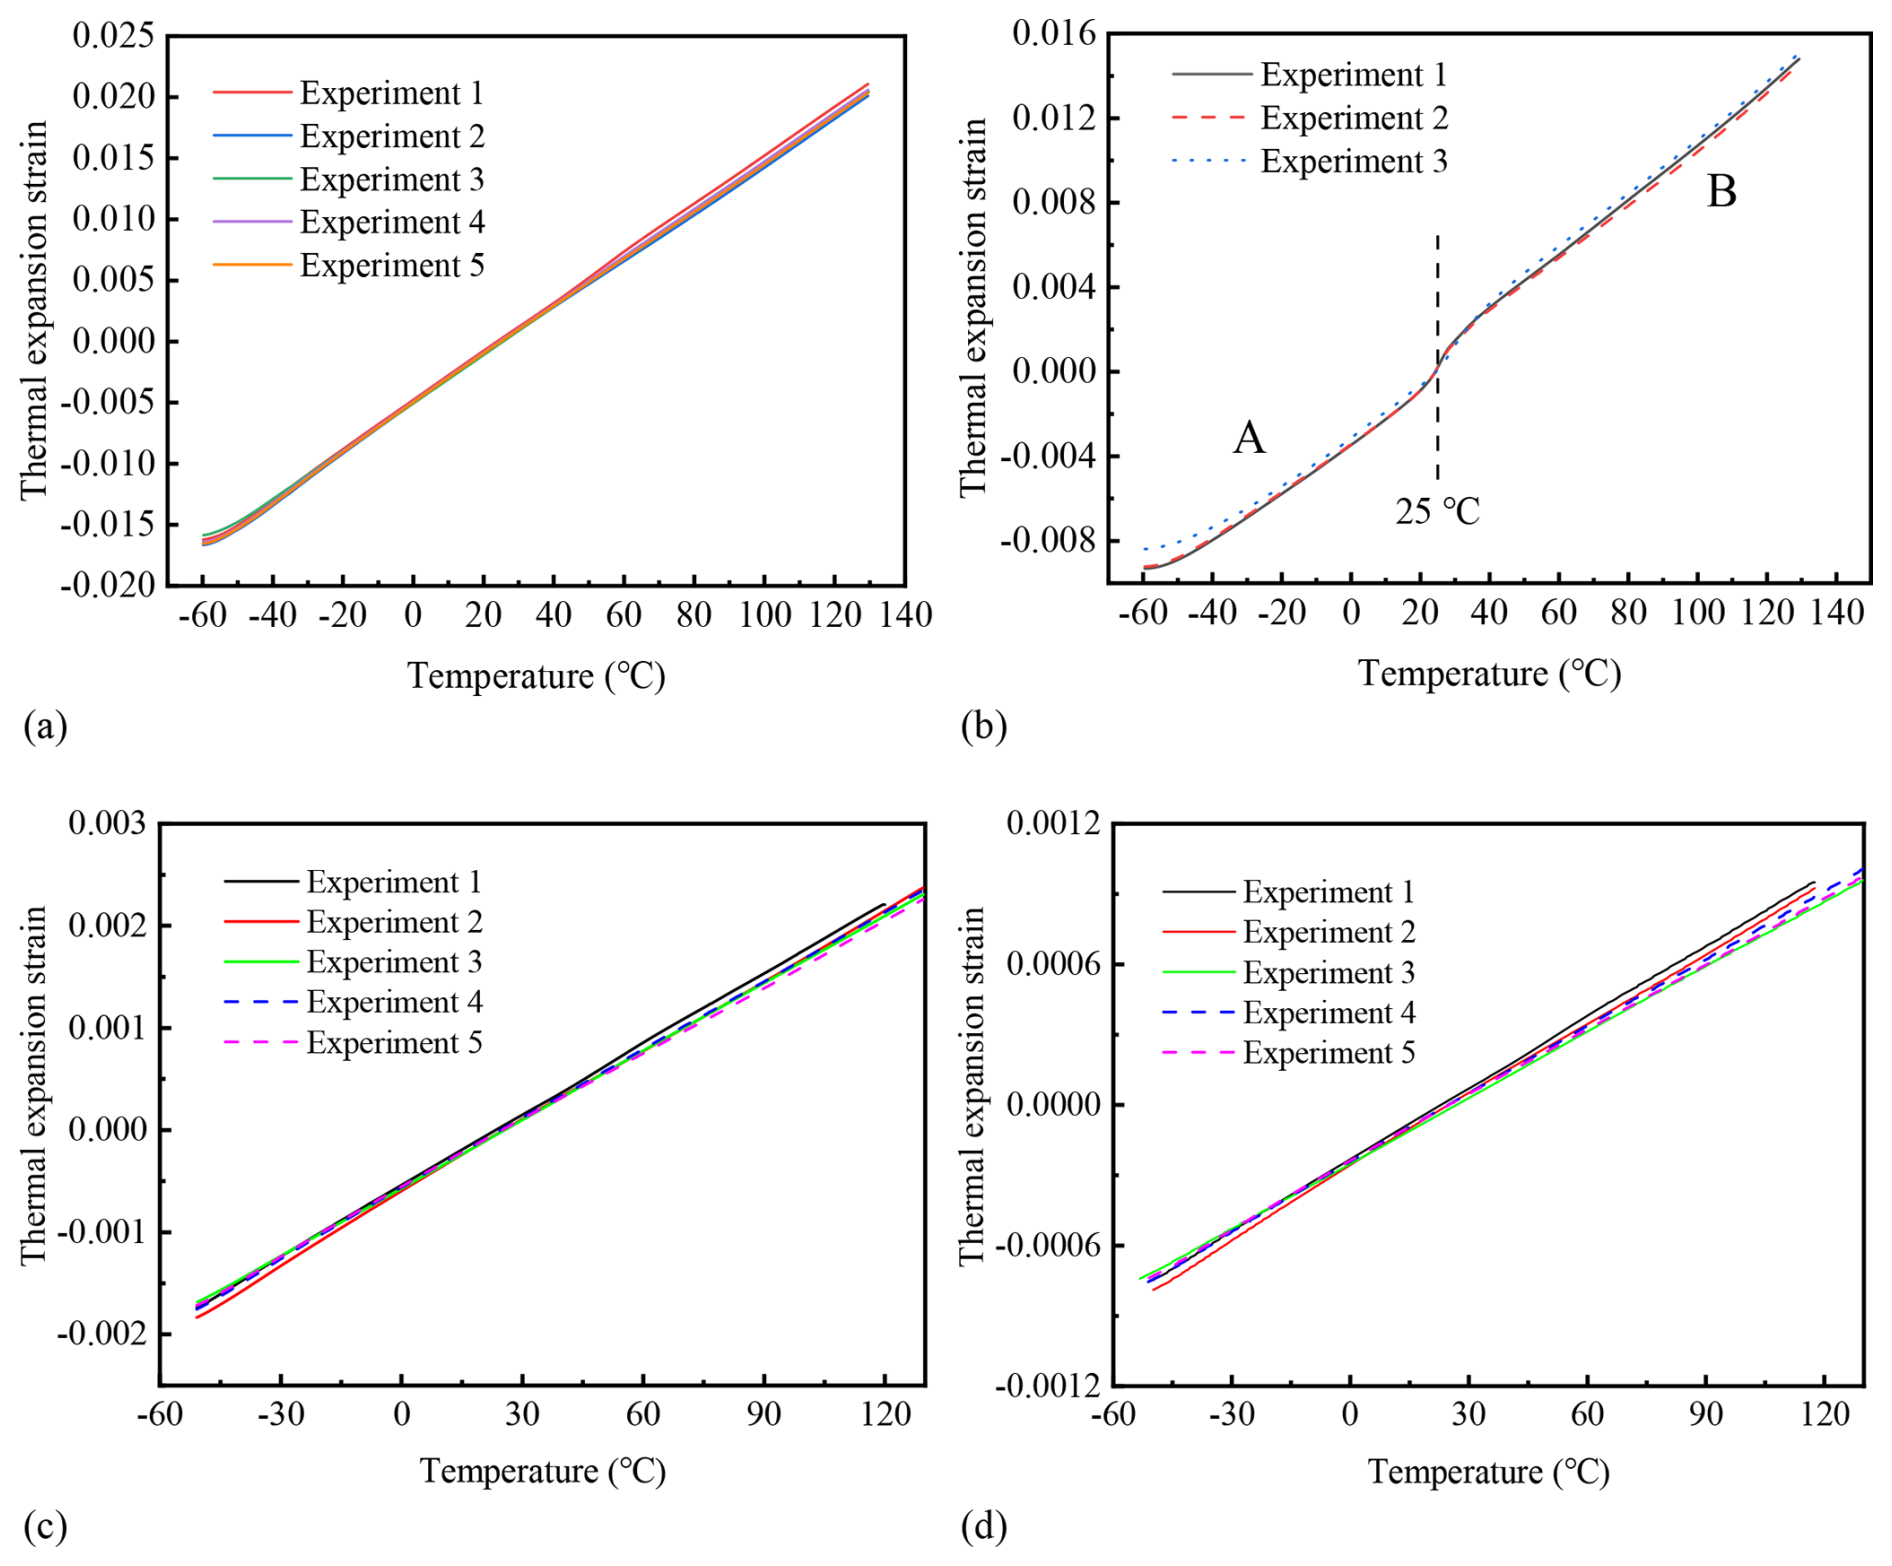
Figure 14Thermal expansion curves of different materials. (a) Thermal expansion curves of rubber; (b) thermal expansion curves of PTFE; (c) thermal expansion curves of aluminum; (d) thermal expansion curves of steel.
2.4 Simulation process
This study employs ANSYS Workbench for simulation modeling. The two-dimensional plane simulation is carried out in five load steps. (1) A specified vertical displacement is applied to the cover plate to simulate the O-ring assembly process. To ensure smooth contact establishment between the cover plate and the sealing ring, this displacement is applied in two load steps. (2) A uniform pressure is applied to the side of the O-ring facing the chamber to simulate internal oil pressure. Similarly, to enhance numerical convergence, the chamber pressure is applied in two load steps. (3) A temperature change is then applied to the entire model to simulate the sealing system's operating conditions under a low-temperature environment. The contact conditions include interactions between the O-ring and the cover plate, base, and retaining ring, as well as between the retaining ring and the cover plate and base. The actuator operates within a temperature range of −55 to 120 °C and a maximum working oil pressure of 27 MPa. However, due to wear from reciprocating friction (Oh et al., 2009), uneven surface roughness (Wang et al., 2021), surface defects of the sealing ring (Liu et al., 2021), and extreme temperature variations, the actual contact pressure may be lower than the ideal theoretical value. From a safety and reliability perspective, it is recommended that the sealing contact pressure be greater than 1.2 times the oil pressure, i.e., 32.4 MPa. If, under extreme oil pressure conditions, the contact pressure between the O-ring and the cover plate or base falls below 32.4 MPa, it is considered a seal failure, leading to leakage issues. It is worth noting that the mechanical behavior of elastomeric materials is strongly temperature dependent because of the rubber-to-glass transition, during which the material transforms from rubber-like entropy elasticity to glassy energy elasticity, exhibiting minimal strain or recovery (Jaunich et al., 2011; Porte et al., 2024). According to existing studies (Brounstein et al., 2021; So et al., 2023; Utrera-Barrios et al., 2025), the reported glass-transition temperatures for silicone and fluorosilicone rubbers are generally low but vary among formulations owing to differences in polymer architecture, fluorine content, and cross-linking chemistry. Within this context, −55 °C is above the glass-transition region of the materials considered; therefore, treating their behavior as rubbery and using hyperelastic parameters fitted at room temperature constitutes a reasonable and physically justified approximation over the investigated temperature range. The normal Lagrange contact algorithm is employed, in which contact pressure is introduced as an additional degree of freedom to enforce contact compatibility. Consequently, explicit evaluation of contact stiffness and penetration is unnecessary, as the contact pressure is treated as a variable. Under this formulation, two limiting states exist: non-contact and contact. These conditions can lead to severe computational oscillations, making convergence difficult. However, once convergence is achieved, the accuracy is high since no penetration between parts is assumed. Given the material nonlinearity and frictional contact nonlinearity, convergence remains challenging. To ensure high precision in contact pressure calculations, the normal Lagrange contact algorithm is employed for the critical contacts between the sealing ring and the cover plate/base. The experimentally measured friction coefficients are applied in these regions. To enhance computational efficiency and convergence, the penalty function algorithm is used for the remaining contact interfaces, with the friction coefficient set to 0.2.
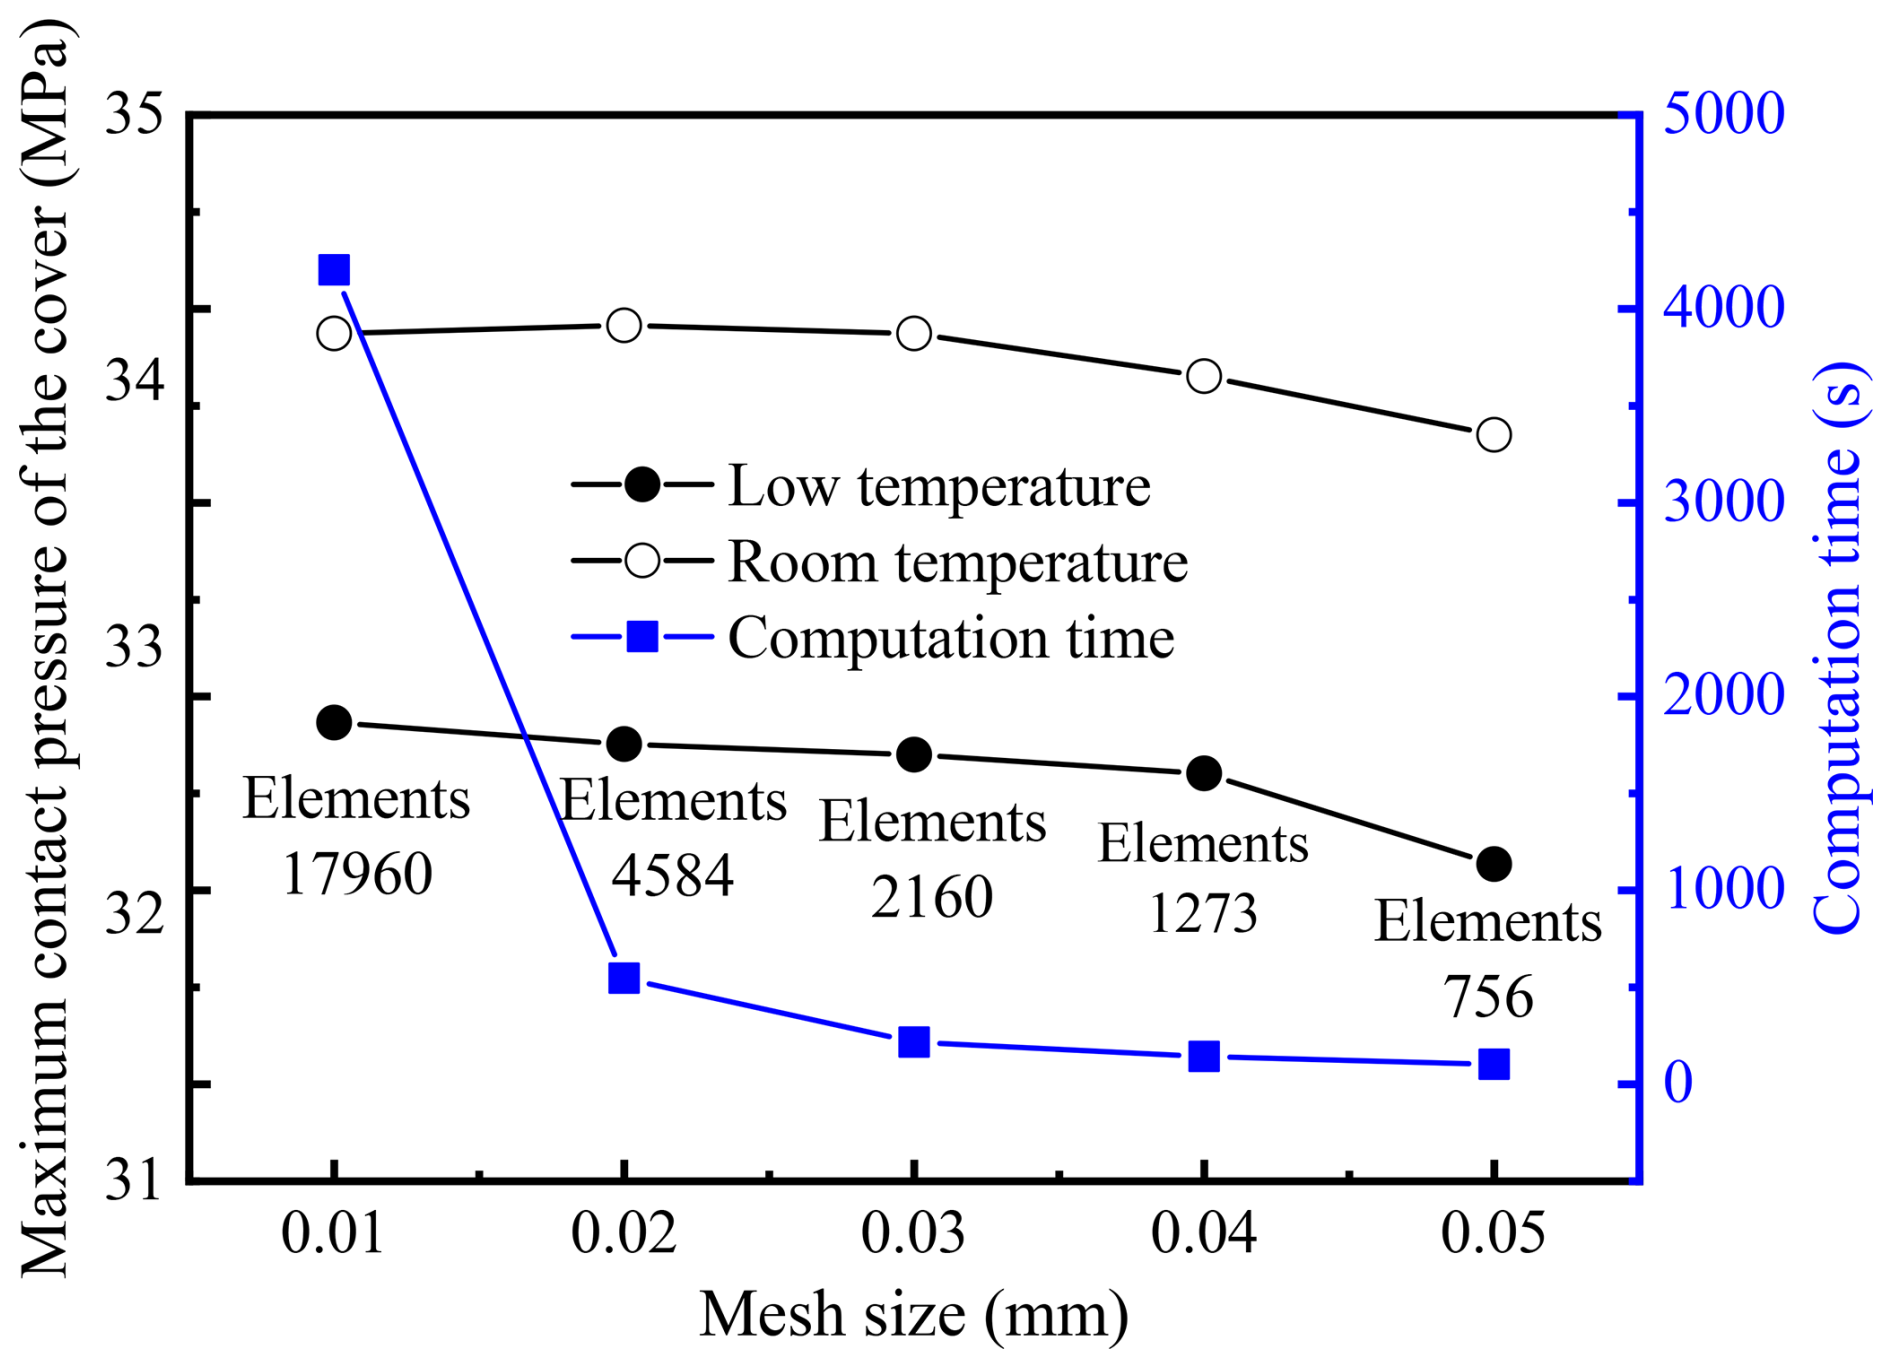
The mesh size must be set appropriately to ensure computational accuracy while improving efficiency. A convergence and efficiency analysis of the sealing ring mesh size was conducted, as shown in Fig. 15. The sealing ring mesh sizes were set to 0.01, 0.02, 0.03, 0.04, and 0.05 mm, corresponding to sealing ring mesh element counts of 17 960, 4584, 2160, 273, and 756, respectively (with total model element counts of 272 487, 68 095, 30 340, 17 093, and 10 949). The results show that for a mesh size below 0.03 mm, the computational speed is fast, but accuracy is compromised. At 0.03 mm, when subjected to 27 MPa oil pressure, the results show zero errors compared to the 0.01 mm mesh. For the 0.04 mm mesh, the error relative to 0.01 mm is 0.47 %. When subjected to 27 MPa oil pressure and low-temperature effects, the 0.03 mm mesh has an error of 0.37 % relative to 0.01 mm, while the 0.04 mm mesh has an error of 0.58 %. Generally speaking, mesh convergence is generally considered satisfactory when the numerical variation of model results is below approximately 5 % after refinement (Zheng and Li, 2021). In the present analysis, all deviations are well below this threshold, confirming that the 0.03 mm mesh achieves both convergence stability and computational efficiency. Therefore, this mesh size was adopted for subsequent simulations. The entire 2D axisymmetric model was discretized using the Multizone Quad/Tri hybrid element type. To ensure accurate resolution of the contact stresses, a refined mesh of 0.03 mm was applied along all O-ring/metal interfaces, while slightly coarser elements (0.04 mm) were assigned to the remaining non-contact regions of the O-ring and metallic parts. This local refinement strategy provides an optimal balance between numerical precision and computational efficiency.
3.1 Influence of O-ring diameter on sealing performance
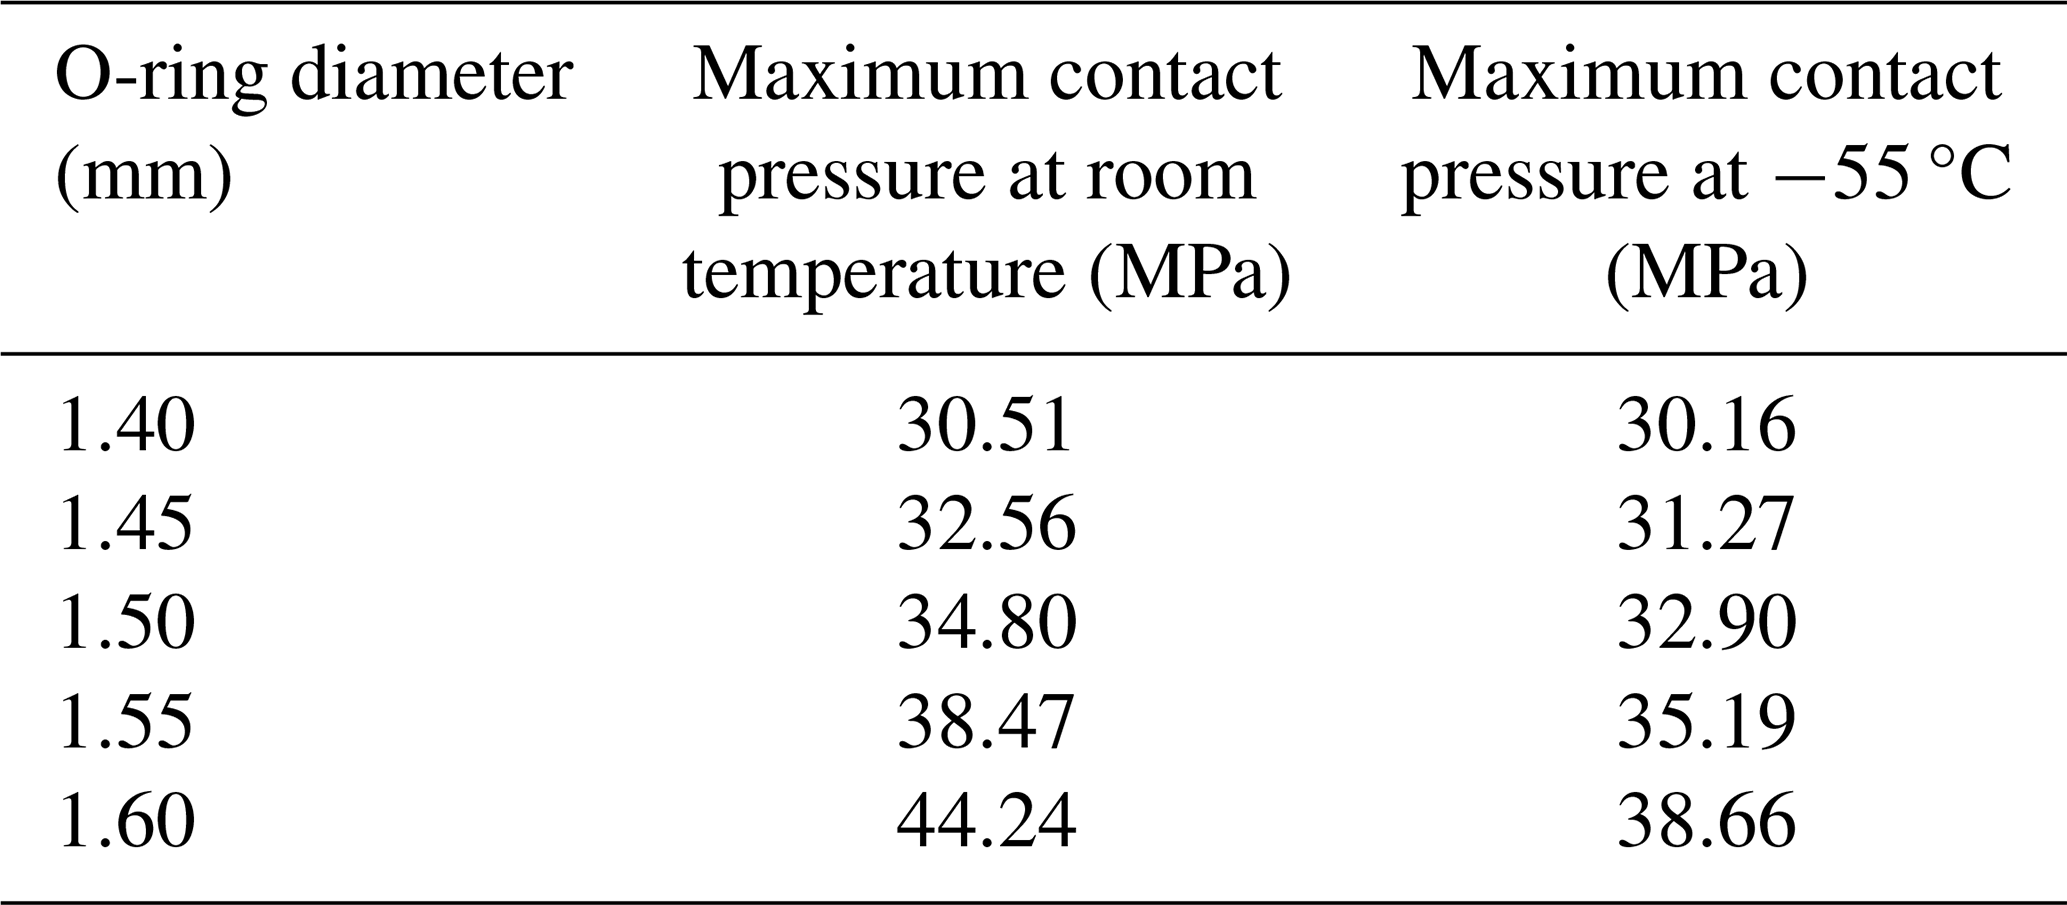
Due to manufacturing tolerances, slight variations exist in the diameter of the sealing ring. This study investigates the sealing performance of O-rings with different diameters, and the simulation results are presented in Table 4 and Fig. 16. Because of the presence of the retaining ring, the contact pressure between the O-ring and the cover plate represents a relatively weak sealing region. The results indicate that as the O-ring diameter increases, sealing performance improves. This is because a larger O-ring diameter enhances the contact area with both the cover plate and the base, thereby improving sealing effectiveness. However, when the O-ring diameter is less than 1.50 mm, there is a risk of leakage at −55 °C. When the diameter is less than 1.45 mm, leakage can occur even at room temperature. Therefore, it is recommended that the O-ring diameter should not be less than 1.50 mm. Experimental sealing tests further confirm that O-rings with a diameter smaller than 1.50 mm exhibit leakage under low-temperature conditions. However, after modifying the O-ring diameter based on simulation findings, the redesigned seals effectively prevent low-temperature leakage. In addition, the difference in maximum contact pressure between room temperature and −55 °C increases with O-ring diameter. This phenomenon is primarily attributed to the enhanced thermal contraction effect in larger O-rings, where the absolute volume shrinkage becomes more pronounced, thereby reducing the effective compression ratio under low-temperature conditions. In addition, the increase in material stiffness and the redistribution of contact stress during cooling further intensify this effect, resulting in a more significant decrease in contact pressure for larger diameters.
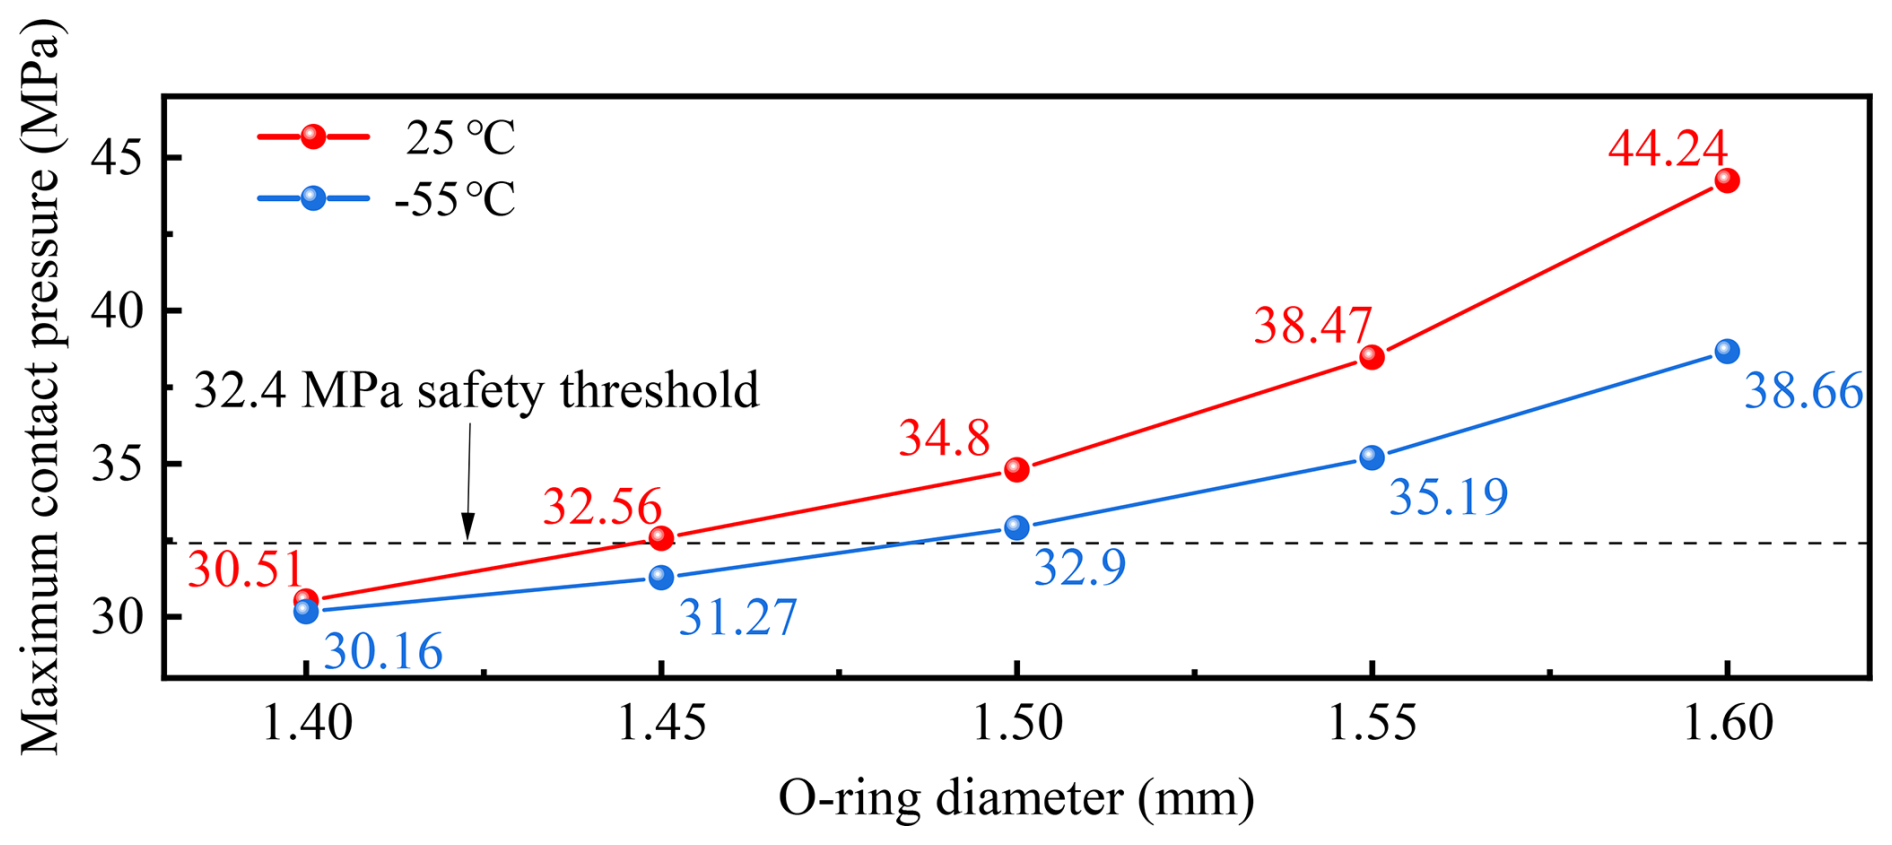
Figure 16Variation of maximum contact pressure with O-ring diameter under 25 and −55 °C conditions.
Table 4Contact-pressure distribution of O-rings with different diameters at room and low temperatures.
3.2 Influence of O-ring inner diameter on sealing performance
To further consider the influence of engineering tolerance fits and assembly deviations on sealing reliability, a new set of simulations was conducted to examine the effect of inner-diameter variation on contact pressure distribution. The analysis was performed using an O-ring with an outer diameter of 1.50 mm, which was identified in Sect. 3.1 as the optimal configuration that provides the highest contact pressure and adequate safety margin against low-temperature leakage. By keeping the O-ring diameter constant, the influence of inner-diameter variation can be isolated while maintaining identical external boundary conditions. As shown in Fig. 17, three representative inner diameters – 2.00, 2.05, and 2.10 mm – were selected to reflect typical manufacturing tolerances and assembly dimensional variations encountered in engineering practice. These values simulate the realistic dimensional scatter of the sealing ring within its production tolerance range. The corresponding simulation results for contact pressure under room- and low-temperature conditions are summarized in Table 5.
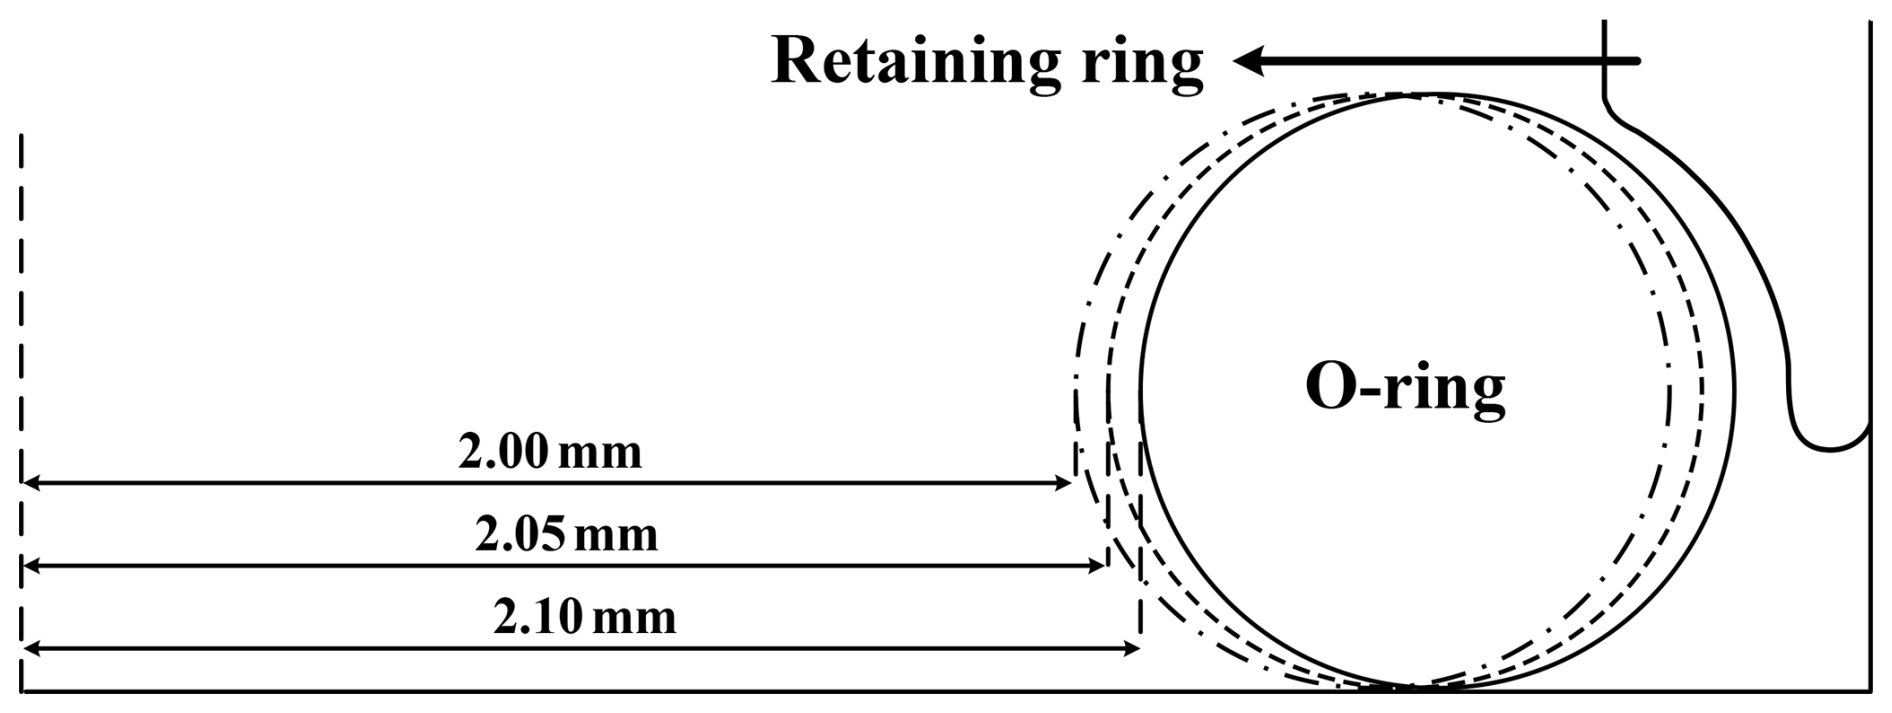
Table 5Contact-pressure distribution of O-rings with different inner diameter at room and low temperatures.
The results indicate that as the inner diameter increases (meaning the O-ring cross-section is positioned closer to the retaining ring), the contact pressure slightly increases under both room and low-temperature conditions. This can be attributed to the geometric constraint imposed by the retaining ring, which restricts radial expansion and enhances local compression near the contact interface. Nevertheless, the variations in maximum contact pressure remain minor – within approximately 0.5 MPa – and all configurations satisfy the required sealing pressure criterion (greater than 1.2 times the chamber oil pressure). These findings confirm that within the manufacturing tolerance range of the O-ring inner diameter, the sealing performance remains robust and insensitive to minor dimensional fluctuations.
3.3 Impact of O-ring compression on sealing effectiveness
During the standard O-ring assembly process, it is crucial to ensure precise dimensional matching with the sealing surface, correct installation positioning, and an appropriate compression ratio (Xiao et al., 2023). Among these factors, compression ratio is a key parameter affecting O-ring sealing performance. An optimal compression ratio ensures sufficient contact pressure between the O-ring and the sealing surface (Liu et al., 2022), preventing fluid leakage while compensating for potential gap variations caused by thermal expansion, pressure fluctuations, or material aging. If the compression ratio is insufficient, the O-ring cannot fully fill the sealing gap, resulting in seal failure. This study investigates the influence of compression ratio on sealing pressure, with simulation results presented in Fig. 18 and Table 6. The compression ratio is evaluated based on the gap between the cover plate and the base. A zero gap indicates full contact between the cover plate and the base, corresponding to the maximum O-ring compression ratio. The simulation results reveal that as the gap increases, sealing performance gradually deteriorates. When the gap exceeds 0.025 mm, a 1.5 mm diameter O-ring exhibits a leakage risk under low-temperature conditions, with a maximum contact pressure of 31.72 MPa – below the safety threshold of 32.4 MPa at −55 °C. If the gap further increases to 0.05 mm, although the contact pressure remains above 27 MPa, it still does not meet the required safety threshold, indicating potential sealing risks that must be carefully addressed. It should be emphasized that in actual assembly processes, it is practically impossible to achieve a perfectly zero gap or completely uniform compression. Small variations inevitably occur due to manufacturing tolerances, installation deviations, and elastic recovery after assembly. Therefore, from a safety and reliability perspective, it is recommended that the 1.50 mm diameter O-ring be designed with a maximum allowable assembly gap of 0.02 mm.
Figure 18Variation of contact pressure with compression ratio for O-rings of different sizes.
3.4 Effect of temperature on sealing property
The contact pressure of the 1.5 mm diameter sealing ring under normal, high, and low temperatures is shown in Fig. 19. Under normal-temperature conditions with an oil pressure of 27 MPa, the contact pressure between the sealing ring and both the cover plate and the base ranges from 34 to 39 MPa, exceeding the chamber oil pressure and thus satisfying the sealing requirement. At high temperatures, thermal expansion of the materials increases the sealing pressure between the sealing ring, the cover plate, and the valve body, with the maximum pressure exceeding 42 MPa. In contrast, at low temperatures, material contraction weakens the contact between components, reducing the contact pressure. The maximum sealing pressure between the sealing ring and the cover plate decreases to 37 MPa. Therefore, under full contact conditions between the sealing ring, cover plate, and base, the sealing performance remains effective across high, normal, and low temperatures. Additionally, as shown in Fig. 20, the simulation results indicate that the contact between the sealing ring and the base is superior to that with the cover plate. This behavior occurs because, in addition to direct contact with the cover plate, the retaining ring on the upper half of the sealing ring restricts lateral displacement to the right. As a result, the material primarily flows along the lower half, leading to a larger contact area and higher contact pressure between the sealing ring and the base. Notably, after cooling, the contact pressure between the cover plate and the O-ring decreases by 1.9 MPa compared with that at normal temperature, indicating an increased risk of sealing leakage.
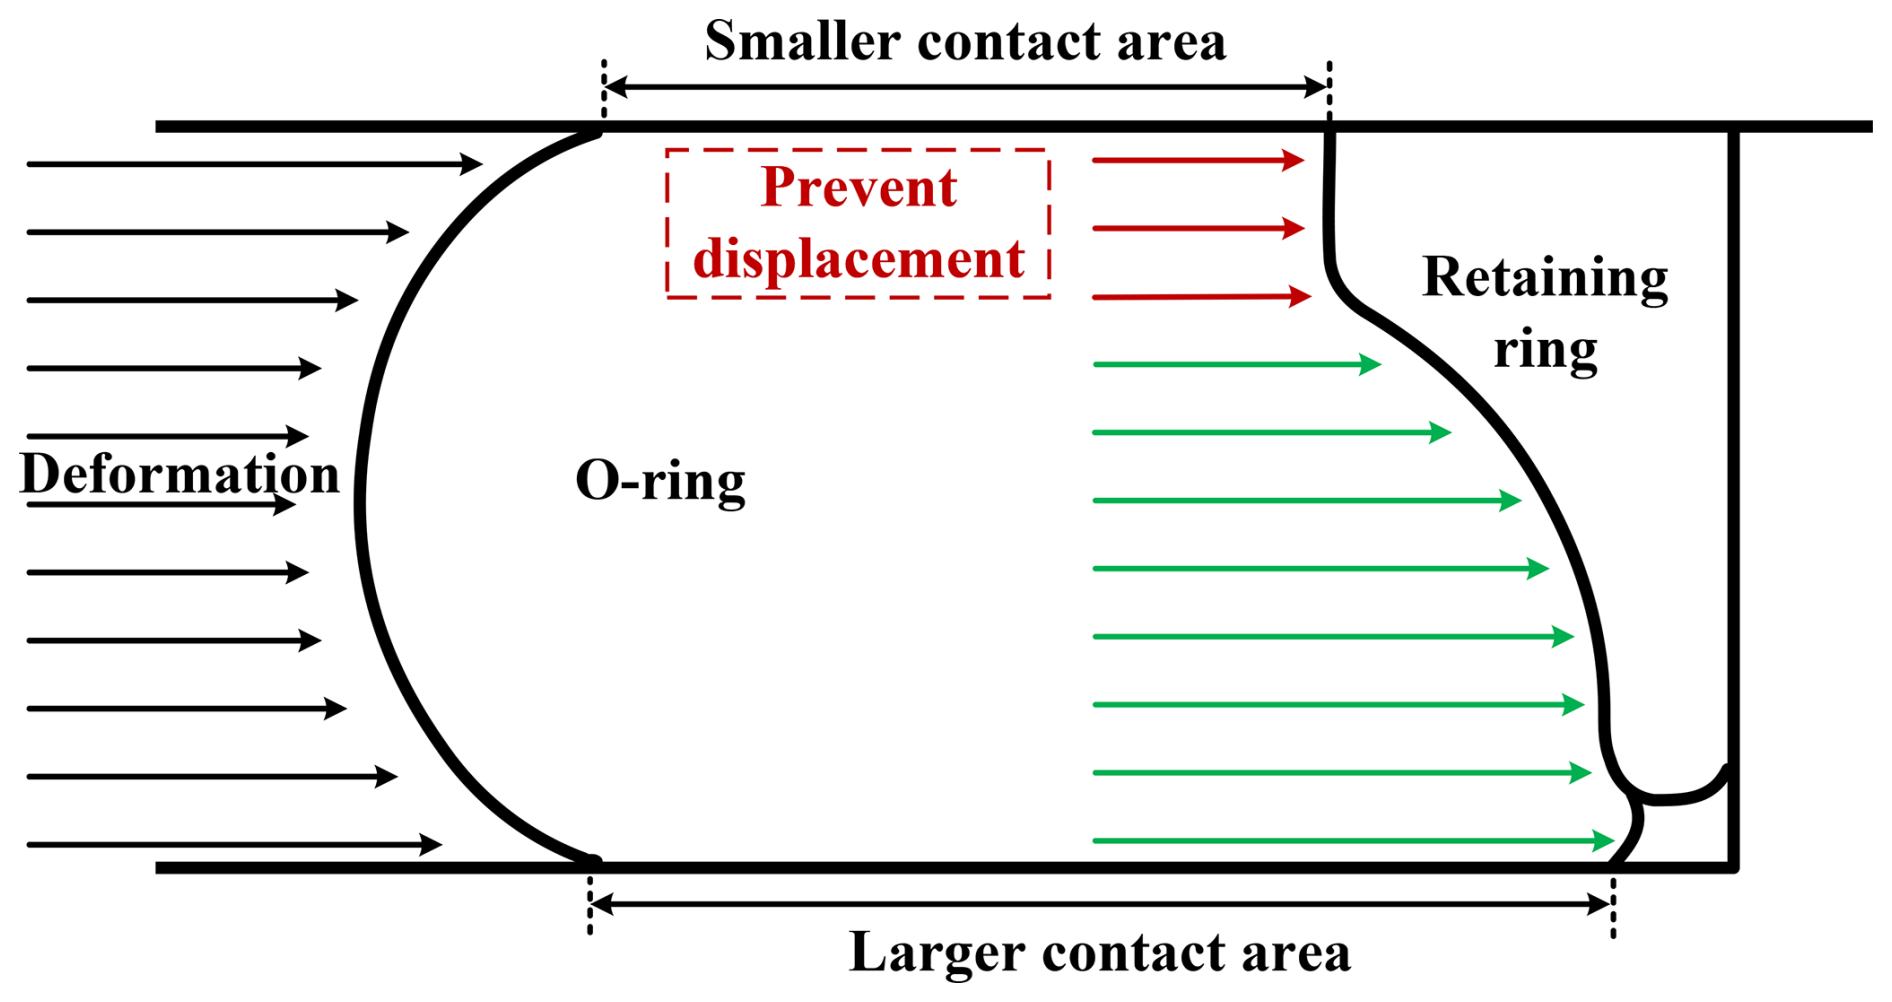
Figure 20Deformation and material flow behavior of the O-ring under oil pressure and retaining ring constraint.

Figure 21Effect of the presence or absence of a retaining ring on contact pressure distribution. (a) 0.05 mm gap with retaining ring; (b) 0.05 mm without retaining ring; (c) 0.10 mm gap with retaining ring; (d) 0.10 mm gap without retaining ring.
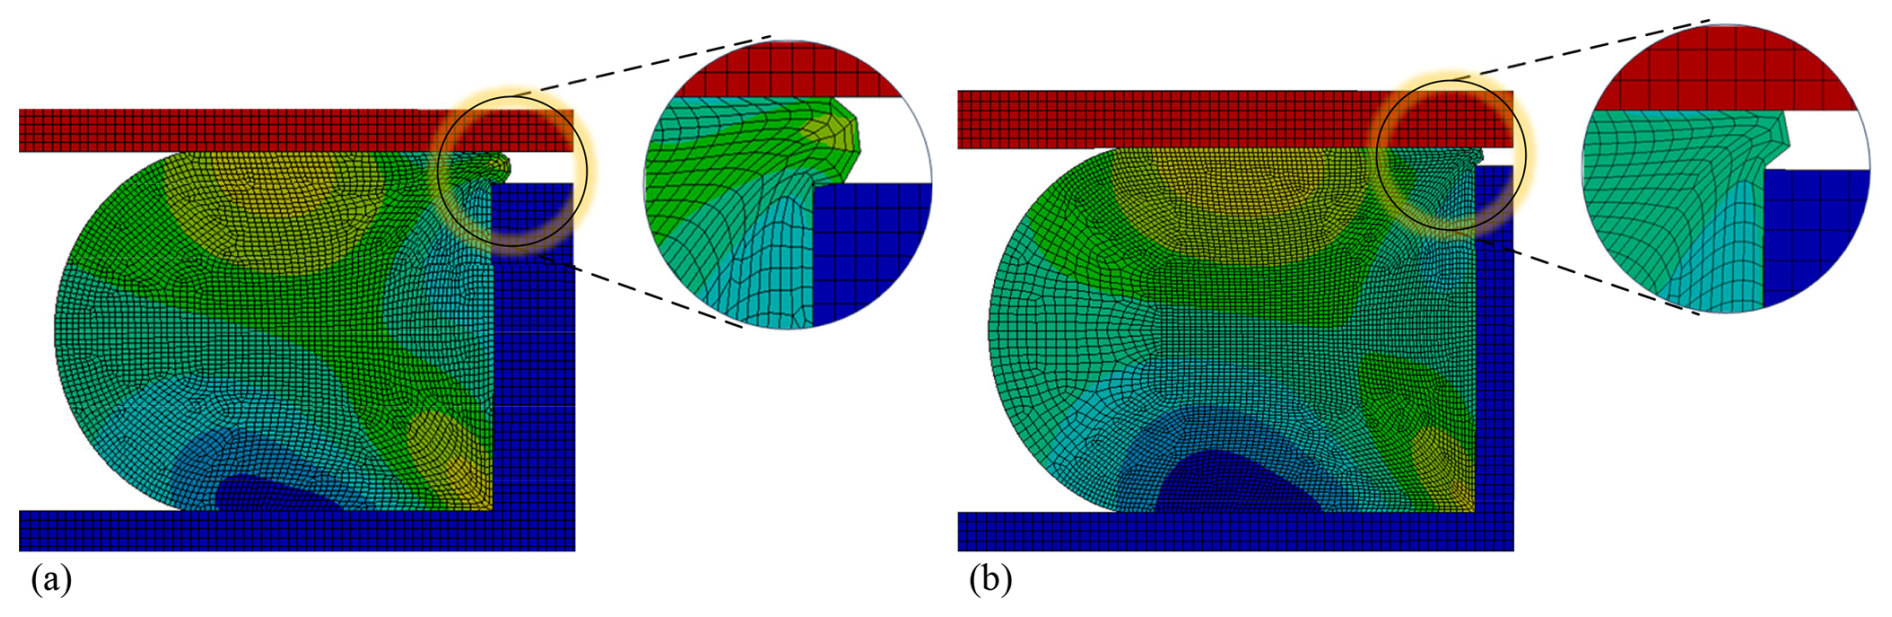
Figure 22Extrusion phenomenon of O-rings in the absence of retaining rings. (a) Extrusion phenomenon of O-ring with 0.10 mm gap; (b) extrusion phenomenon of O-ring with 0.05 mm gap.
3.5 Role of retaining rings in sealing function
Currently, O-ring sealing configurations are generally classified into two types: with and without a retaining ring. To analyze the sealing performance under these conditions, simulations were conducted for a 1.5 mm diameter O-ring. Two pre-compression rates were set: 20 % (corresponding to a 0.1 mm gap between the cover plate and the base) and 22.3 % (corresponding to a 0.05 mm gap) (Kim et al., 2007). A fluid pressure of 27 MPa was applied to the side of the O-ring facing the chamber, and the results are presented in Fig. 21. The simulations indicate that when no retaining ring is present, the contact pressure between the O-ring and both the cover plate and base remains relatively uniform. However, under the impact of 27 MPa oil pressure, the maximum contact pressure is approximately 10 % lower than that in configurations with a retaining ring. Similarly, when the gap is reduced to 0.05 mm, the sealing pressure in the case with a retaining ring is superior to that without one, as shown in Fig. 21c and d. When operating in a high-pressure environment, the O-ring in a configuration with a retaining ring initially translates toward the retaining ring as pressure increases. With further pressure rise, the O-ring and the retaining ring come into contact and, owing to their elasticity, undergo mutual deformation. This deformation initially propagates toward the upper and lower corners of the contact area and continues dynamically between the two components. This interaction effectively prevents the O-ring from being “extruded”, as illustrated in Fig. 22. In contrast, in the absence of a retaining ring, extrusion of the O-ring can lead to gap biting, which prematurely damages the material and results in seal failure. Additionally, the gap between the cover plate and the base, once affected by O-ring extrusion, becomes difficult to eliminate through other means such as bolt tightening, thereby compromising the sealing effectiveness. Moreover, the presence of the retaining ring constrains the lateral movement of the O-ring near the clearance gap, forcing the rubber material to redistribute deformation downward rather than extruding laterally. As a result, the effective contact area between the O-ring and the mating surfaces increases, particularly in the lower region, which alleviates local stress concentration and leads to a more uniform contact stress distribution. This redistribution of the stress field reduces the likelihood of localized shear failure and extrusion-induced gap biting under high-pressure conditions.
This study establishes a generalized methodological framework for analyzing O-ring sealing performance under coupled thermo-mechanical conditions. Within this framework, a finite element simulation model was developed to represent the in-service conditions of the O-ring in an aircraft actuator, incorporating both material and contact nonlinearities to investigate the effects of temperature, compression, and structural configuration on contact pressure. Based on this modeling approach, the main conclusions are summarized as follows:
-
A 1.5 mm diameter O-ring exhibits reduced contact pressure at low temperatures due to material contraction, which weakens component contact. Nevertheless, the contact pressure between the sealing ring and both the cover plate and the base remains within 34–39 MPa. Under fully sealed conditions, the 1.5 mm diameter sealing ring maintains effective sealing performance at high, normal, and low temperatures.
-
As the sealing ring diameter increases, the contact area with the cover plate and base increases, thereby improving sealing effectiveness. A critical diameter threshold was identified: if the sealing ring diameter is <1.50 mm, leakage risks arise at low temperatures (−55 °C); if the diameter is <1.45 mm, leakage risks exist even at normal temperatures. Therefore, the sealing ring diameter should not be reduced below 1.50 mm.
-
When the gap exceeds 0.025 mm, a 1.5 mm diameter sealing ring presents a leakage risk. At low temperature (−55 °C), the maximum contact pressure decreases to 31.72 MPa, falling below the safety threshold of 32.4 MPa for −55 °C. If the gap further increases to 0.05 mm, although the contact pressure remains above 27 MPa, it still does not meet the required safety threshold, indicating potential sealing failure. To ensure reliable sealing, the gap should not exceed 0.020 mm.
-
In the absence of a retaining ring, the contact pressure between the O-ring, and the cover plate and base remains relatively uniform. However, under a 27 MPa oil-pressure impact, the maximum contact pressure is 10 % lower than when a retaining ring is present. Furthermore, without a retaining ring, the O-ring is prone to extrusion, leading to gap biting and premature material failure.
These findings provide a methodological framework and theoretical guidance for the design and optimization of actuator sealing systems with different O-ring materials, sealing structures, and working environments. Future research will aim to extend this framework by systematically examining the effects of actuator geometry, aspect ratio, and scale on sealing efficiency, and by improving temperature-dependent material parameter identification to enhance predictive capability. Further attention will also be devoted to the limited elastic recovery of elastomeric O-rings and the complex compressibility behavior of rubber under coupled temperature- and pressure-dependent conditions, which are crucial for understanding leakage initiation and long-term sealing reliability.
Owing to confidentiality restrictions, the raw experimental data cannot be shared publicly because the rubber materials were obtained from a third-party research institute.
YJ: writing (original draft). ZY: writing (review and editing). KH: validation. LK: conceptualization. GY: software.
The contact author has declared that none of the authors has any competing interests.
Publisher's note: Copernicus Publications remains neutral with regard to jurisdictional claims made in the text, published maps, institutional affiliations, or any other geographical representation in this paper. The authors bear the ultimate responsibility for providing appropriate place names. Views expressed in the text are those of the authors and do not necessarily reflect the views of the publisher.
This research has been supported by the High Quality Development Special Project (grant no. 2023ZY01037).
This paper was edited by Liangliang Cheng and reviewed by four anonymous referees.
Brounstein, Z., Zhao, J., Geller, D., Gupta, N., and Labouriau, A.: Long-term thermal aging of modified sylgard 184 formulations, Polymers, 13, 3125, https://doi.org/10.3390/polym13183125, 2021.
Deng, T., Yin, X., Yan, Y., Zhou, H., and Zhang, R.: Study on the variation mechanism of non-linear stiffness of rubber O-ring, J. Vibroeng., 27, 839–856, https://doi.org/10.21595/jve.2025.24806, 2025.
Jaunich, M., von der Ehe, K., Wolff, D., Voelzke, H., and Stark, W.: Understanding low temperature properties of elastomer seals, Packag. Transp. Storage Secur. Radioact. Mater., 22, 83–88, https://doi.org/10.1179/1746510911Y.0000000004, 2011.
Jin, L. and Che, L.: Experimental study on stress relaxation of rubber O-ring for mechanical seal, J. Phys.: Conf. Ser., 2691, 012015, https://doi.org/10.1088/1742-6596/2691/1/012015, 2024.
Karaszkiewicz, A.: Geometry and contact pressure of an O-ring mounted in a seal groove, Ind. Eng. Chem. Res., 29, 2134–2137, https://doi.org/10.1021/ie00106a025, 1990.
Khaniki, H. B., Ghayesh, M. H., Chin, R., and Amabili, M.: A review on the nonlinear dynamics of hyperelastic structures, Nonlinear Dyn., 110, 963–994, https://doi.org/10.1007/s11071-022-07700-3, 2022.
Kim, H. K., Park, S. H., Lee, H. G., Kim, D. R., and Lee, Y. H.: Approximation of contact stress for a compressed and laterally one side restrained O-ring, Eng. Fail. Anal., 14, 1680–1692, https://doi.org/10.1016/j.engfailanal.2006.11.061, 2007.
Li, Z.: Study on the Sealing Performance of O-ring under High-Pressure Environment, J. Phys.: Conf. Ser., 2419, 012005, https://doi.org/10.1088/1742-6596/2419/1/012005, 2023.
Liang, B., Yang, X., Wang, Z., Su, X., Liao, B., Ren, Y., and Sun, B.: Influence of Randomness in Rubber Materials Parameters on the Reliability of Rubber O-Ring Seal, Materials, 12, 1566, https://doi.org/10.3390/ma12091566, 2019.
Liu, D., Yun, F., Jiao, K., Wang, L., Yan, Z., Jia, P., Wang, X., Liu, W., Hao, X., and Xu, X.: Structural Analysis and Experimental Study on the Spherical Seal of a Subsea Connector Based on a Non-Standard O-Ring Seal, J. Mar. Sci. Eng., 10, 404, https://doi.org/10.3390/jmse10030404, 2022.
Liu, H., He, B., He, Y., and Tao, X.: Lightweight detection algorithm for fine-grained surface defects of aerospace seal rings, J. Intell. Fuzzy Syst., 40, 11423–11440, https://doi.org/10.3233/JIFS-202614, 2021.
Melly, S. K., Liu, L., Liu, Y., and Leng, J.: A review on material models for isotropic hyperelasticity, Int. J. Mech. Syst. Dyn., 1, 71–88, https://doi.org/10.1002/msd2.12013, 2021.
Mooney, M.: A Theory of Large Elastic Deformation, J. Appl. Phys., 11, 582–592, https://doi.org/10.1063/1.1712836, 1940.
Oh, J. C., Kim, D. E., Kim, H. J., Kim, M. H., and Kim, C. I.: Experimental Investigation of Friction and Wear Characteristics of O-Ring, Trans. Korean Soc. Mech. Eng. A, 33, 1125–1131, https://doi.org/10.3795/KSME-A.2009.33.10.1125, 2009.
Porte, E., Eristoff, S., Agrawala, A., and Kramer-Bottiglio, R.: Characterization of Temperature and Humidity Dependence in Soft Elastomer Behavior, Soft Robot., 11, 118–130, https://doi.org/10.1089/soro.2023.0004, 2024.
Qu, J., Chen, G., and Yang, Y. W.: Finite Element Analysis of Rubber Sealing Ring Resilience Behavior, Adv. Mater. Res., 705, 410–414, https://doi.org/10.4028/www.scientific.net/AMR.705.410, 2013.
Repplinger, C., Sellen, S., Kedziora, S., Zürbes, A., and Maas, S.: Material modeling for numerical simulation of elastomer O-rings with experimental verification at low temperatures, Int. J. Hydrog. Energy, 80, 1046–1061, https://doi.org/10.1016/j.ijhydene.2024.06.427, 2024.
Rivlin, R. S.: Large elastic deformations of isotropic materials IV. further developments of the general theory, Phil. Trans. R. Soc. Lond. A, 241, 379–397, https://doi.org/10.1098/rsta.1948.0024, 1948.
So, J. I., Lee, C. S., Kim, B. S., Jeong, H. W., Seo, J. S., Baeck, S. H., Shim, S. E., and Qian, Y.: Improvement of Heat Resistance of Fluorosilicone Rubber Employing Vinyl-Functionalized POSS as a Chemical Crosslinking Agent, Polymers, 15, 1300, https://doi.org/10.3390/polym15051300, 2023.
Utrera-Barrios, S., Yu, L., and Skov, A. L.: Revisiting the Thermal Transitions of Polydimethylsiloxane (PDMS) Elastomers: Addressing Common Misconceptions with Comprehensive Data, Macromol. Mater. Eng., 310, 2500075, https://doi.org/10.1002/mame.202500075, 2025.
Wang, B., Meng, X., Peng, X., and Chen, Y.: Experimental investigations on the effect of rod surface roughness on lubrication characteristics of a hydraulic O-ring seal, Tribol. Int., 156, 106791, https://doi.org/10.1016/j.triboint.2020.106791, 2021.
Wu, J., Li, L., and Wang, P.: Effect of stress relaxation on the sealing performance of O-rings in deep-sea hydraulic systems: A numerical investigation, Eng. Sci. Technol. Int. J., 51, 101654, https://doi.org/10.1016/j.jestch.2024.101654, 2024a.
Wu, J., Li, L., and Wang, P.: Study on the effects of three surface imperfections on the performance of O-ring seals based on the finite element method, Proc. Inst. Mech. Eng. C: J. Mech. Eng. Sci., 238, 10158–10171, https://doi.org/10.1177/09544062241258911, 2024b.
Xiao, X., Zuo, S., Li, H., Lan, F., Gu, P., Zhou, L., and Wang, Y.: Analysis of Failure Causes for O-Ring Seals in the Converter Station and Study of Countermeasures, in: 2023 Panda Forum on Power and Energy (PandaFPE), Chengdu, China, April 2023, 1446–1450, https://doi.org/10.1109/PandaFPE57779.2023.10140995, 2023.
Yang, M., Xia, Y., Ren, Y., Zhang, B., and Wang, Y.: Design of O-ring with skeleton seal of cutter changing robot storage tank gate for large diameter shield machine, Tribol. Int., 185, 108591, https://doi.org/10.1016/j.triboint.2023.108591, 2023.
Zhang, J. and Xie, J.: Investigation of Static and Dynamic Seal Performances of a Rubber O-Ring, J. Tribol., 140, 042202, https://doi.org/10.1115/1.4038959, 2018.
Zhao, X., Liu, Y., and Guo, F.: A quantitative characterization model for nonlinear dynamic parameters of O-rings, Mech. Syst. Signal Process., 224, 112176, https://doi.org/10.1016/j.ymssp.2024.112176, 2025.
Zheng, X. and Li, B.: Study on sealing performance of packer rubber based on stress relaxation experiment, Eng. Fail. Anal., 129, 105692, https://doi.org/10.1016/j.engfailanal.2021.105692, 2021.